
Abstract
BACKGROUND:
Dual-energy computed tomography (DECT) can reconstruct electron density ρ e and effective atomic number Z eff distribution for material discrimination. Image-domain basis material decomposition (IBMD) method is a widely used DECT method. However, IBMD method cannot be used for mineral identification directly due to limitations of complex basis material determination, beam hardening artifacts, and inherent errors caused by approximate empirical formulas.
OBJECTIVE:
This study proposes an improved IBMD (IIBMD) method to overcome the above limitations.
METHODS:
In IIBMD method, the composition of basis material is optimized to obtain accurate decomposition coefficients, which enables accurate ρ e and Z eff distribution. Moreover, the thickness of basis material is optimized to reduce the effect of beam hardening. Furthermore, two formulas in place of empirical formulas are proposed to calculate ρ e and Z eff . Finally, a threshold technique is applied to separate different mineral phases.
RESULTS:
Numerical simulations and practical experiments using a photon-counting detector CT system are implemented to verify IIBMD method. Results show that the relative errors of ρ e and Z eff for seven common minerals are down to 5%, lower than most of the existing DECT methods for rocks. Reasonable volume fraction results of mineral phases are thus obtained through threshold segmentation.
CONCLUSIONS:
This study demonstrates that the proposed IIBMD method has high practical value in mineralogical identification.
Keywords
Introduction
X-ray computed tomography (XCT) is a non-destructive testing technique that quantifies the internal components of objects based on differences in linear attenuation coefficients among materials [1]. Recently, XCT is widely applied in geology to obtain quantitative information about component, structure, and pore distribution of rock [2–5]. However, XCT cannot identify minerals with similar linear attenuation coefficients in heterogeneous rocks. Dual-energy computed tomography (DECT) can overcome this limitation by decomposing linear attenuation coefficient measured at two different voltages into electron density ρ e and effective atomic number Z eff [6]. Conventional DECT methods can be classified into three categories: image domain method [7], projection domain method [8, 9], and iterative method [10]. Image domain method reconstructs dual-energy images by conventional CT reconstruction methods and extracts quantitative decomposition results from dual-energy images. Image domain method is applicable for mineral characterization in geology due to its efficiency and applicability. Several studies have attempted to apply the DECT image domain method in geology.
The image-domain DECT method in geology was used by Van Geet [11] firstly, who adapted the mathematical formulas previously elaborated in literature [12] to quantify ρ e and Z eff of reservoir rocks. Later, two-parameter model [13] was used to decompose ρ e and Z eff from dual-energy images of common minerals in geology [14, 15]. Simple mineralogical segmentation was achieved. However, the performance of the above methods depends highly on calibration with many standard materials, which limits the segmentation accuracy. Recently, the stoichiometric calibration method elaborated for medical purposes was applied to identify different mineral phases [16]. Common minerals in geology were distinguished successfully. However, the stoichiometric calibration method failed in the identification of dense samples. Beam hardening artifacts in reconstructed images cannot be removed completely, either.
Image-domain basis material decomposition (IBMD) method is another typical image domain material decomposition method that is widely used to extract ρ e and Z eff from DECT images. The precision of IBMD method [8] can be improved by the optimization of basis material without the need for extensive calibrations. However, the application of IBMD method to geological samples faces some challenges. Firstly, the optimization of basis material, which decides the accuracy of IBMD method [8, 17], has rarely been discussed in geology. Secondly, the beam hardening artifact cannot be eliminated completely, which is not desirable in quantitative imaging. Thirdly, there exist inherent errors caused by the use of approximate empirical formulas for ρ e and Z eff , especially for materials with high Z eff [18], such as geological samples.
In this paper, an improved IBMD (IIBMD) method is proposed to obtain accurate quantitative characterization results of geological samples. In IIBMD method, the composition of basis material is determined pixel by pixel to obtain accurate decomposition results. Moreover, beam hardening artifacts are reduced by optimizing the thickness of basis material. In addition, two formulas in place of the empirical formulas are proposed to calculate ρ e and Z eff to minimize the inherent error. These two formulas are established based on virtual monochromatic images at optimum energies (1MeV and 10KeV in this paper). After that, a simple thresholding technique is applied to the images of ρ e and Z eff to separate different mineral phases. Simulation and practical experiments were performed on a photon-counting detector (PCD)-based DECT system to validate the IIBMD method.
Method
Image domain basis material decomposition method
Image-domain basis material decomposition (IBMD) method is based on the assumption that the linear attenuation coefficient μ of any material can be expressed as a linear combination of μ of two basis materials [8] at given X-ray energy E. Therefore, IBMD model is expressed as:
IBMD method works well in medical applications. However, IBMD method might be problematic for geological samples which are denser and more complex than human tissues. Firstly, the determination of basis material for geological samples is a puzzle, which has rarely been investigated. In addition, IBMD method suffers a lot from beam hardening effect, which hampers the quantitative characterization of material [21]. Furthermore, inherent errors caused by empirical formulas are significant, particularly for geological samples with high Z eff . To overcome the above limitations, IIBMD method is proposed. In IIBMD method, the composition of basis material is determined pixel by pixel to accommodate the non-homogeneous property of rock. Additionally, the thickness of basis material is optimized to remove beam hardening artifacts, which is also carried out pixel by pixel. In addition, two formulas in place of the empirical formulas are proposed to calculate ρ e and Z eff . These two formulas are established from virtual monochromatic images at optimum energies to minimize the inherent error for geological samples with high Z eff .
Basis material composition determination
For IBMD method, the determination of basis material is the primary consideration. Basis material is determined based on component analysis [17, 22] in medical application. The determination of basis material is easy to complete since the composition of medical material is fairly known (e.g., brain tissue, water, fat, bone). However, component analysis is no longer applicable to geological samples with complex composition and random distribution of mineral phase. Therefore, the attenuation property of material at the pixel scale is utilized to determine the composition of basis material. The details are as follows.
To quantify the attenuation property of the material in the dual-energy situation, a metric which is called R - value is defined:
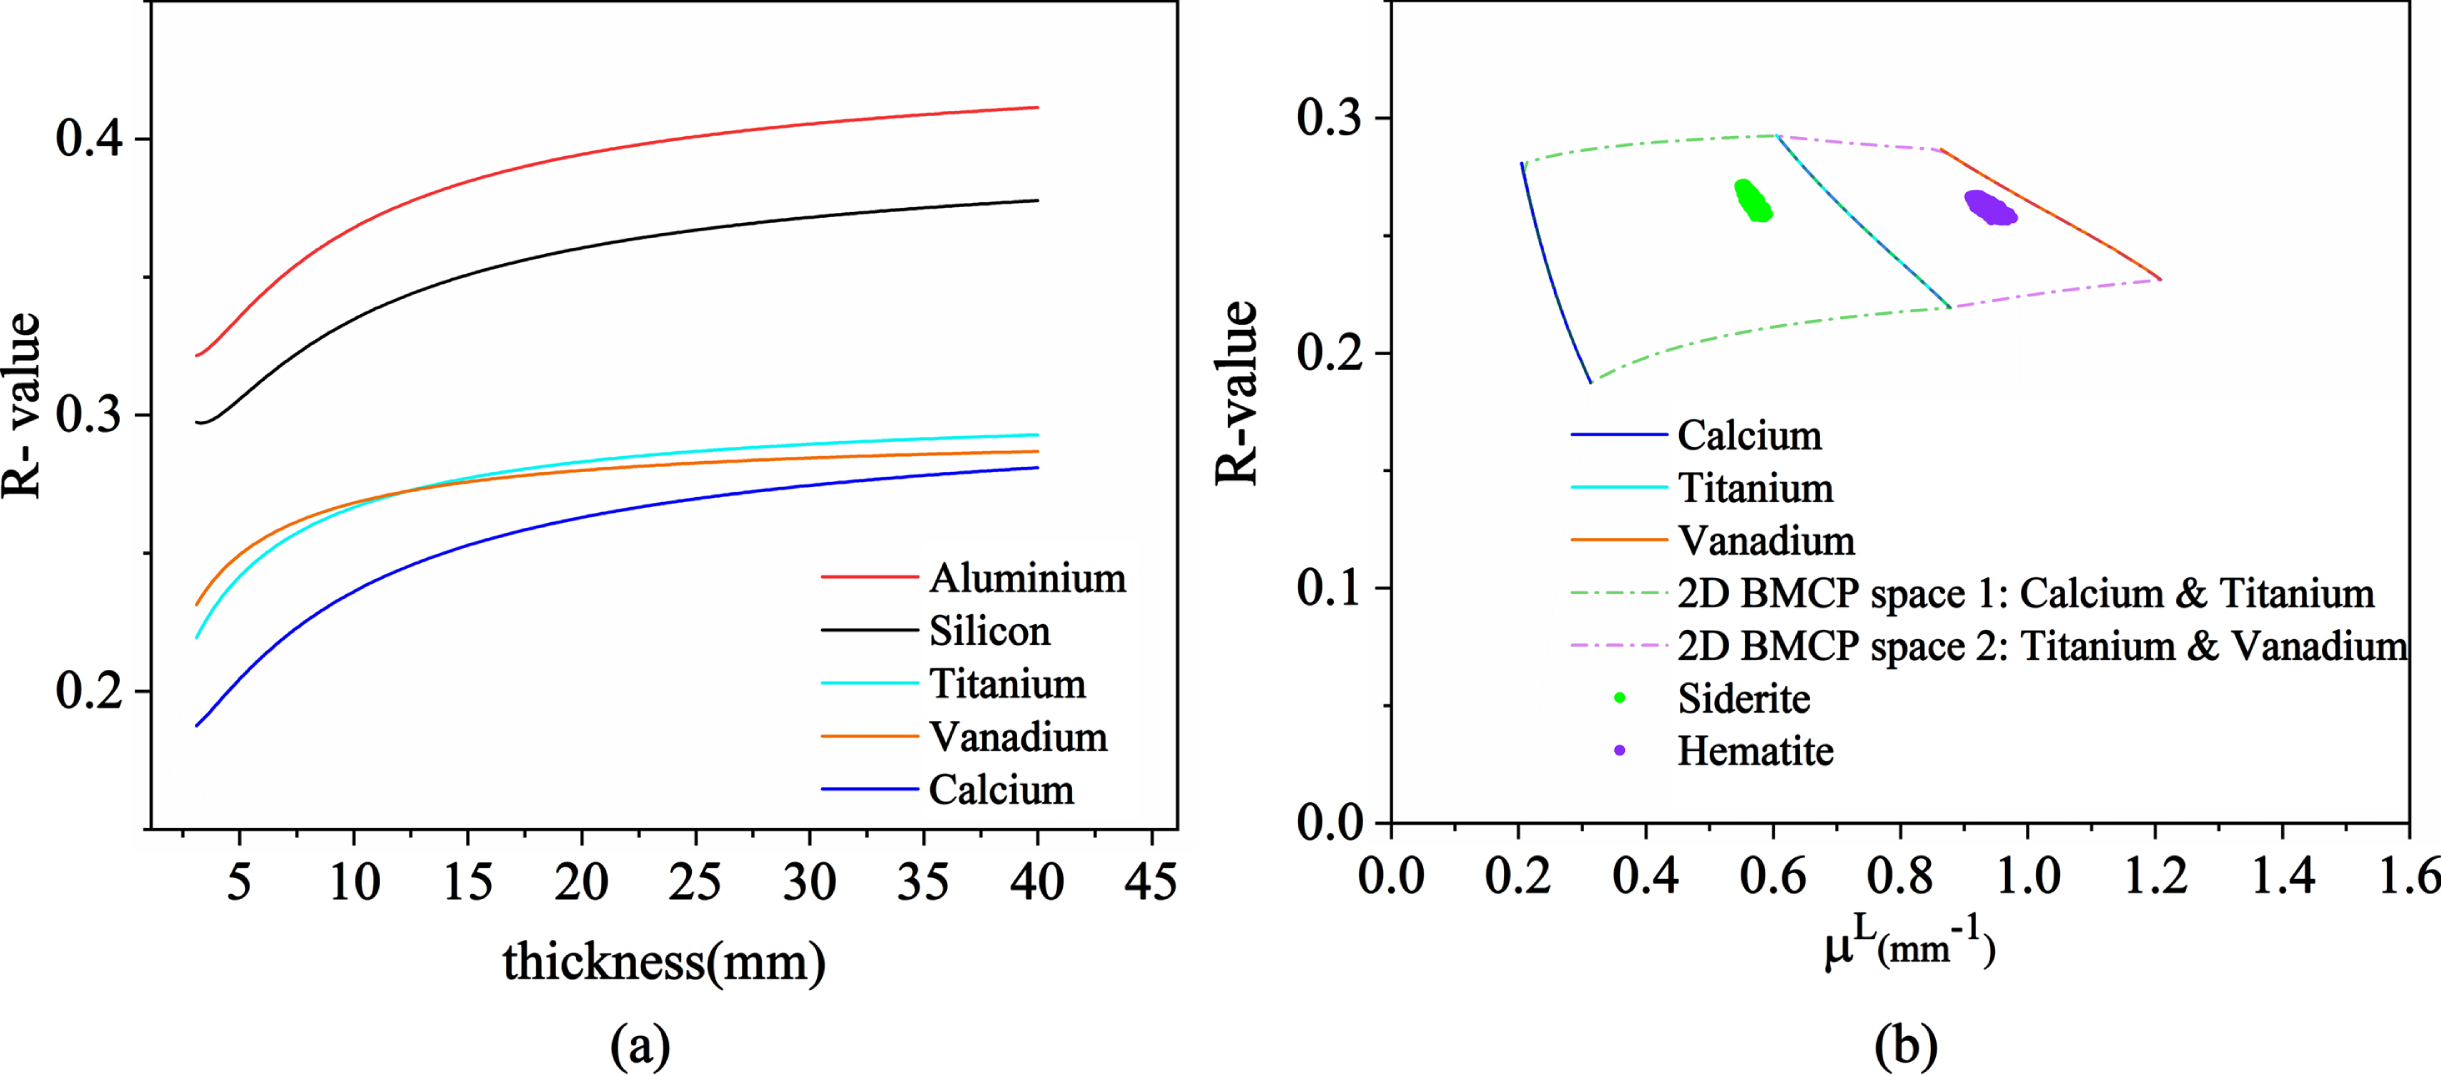
(a) R - values of five pure elements vary with the thickness.
To solve the problem above,
The curves of R - μ L show excellent separation capability for materials with different attenuation characteristics. As shown in Fig. 1 (b), calcium, titanium and vanadium are well separated. Once curves R - μ L of different basis materials are obtained, the basis material determination is performed on the plane R - μ L . To simplify the operation, an enclosed space, which is called the two-dimensional basis material combination property space (2D BMCP space), is formed by connecting curves R - μ L of any two basis materials (as shown in Fig. 1 (b)).
The proposed basis material determination method consists of three steps: (i) A basis material library devoted to geology is prepared. (ii) A 2D BMCP space library is created from DECT images. Every element in the library is the 2D BMCP space of two materials picked from the basis material library. (iii) Two optimal basis materials are determined for each pixel of DECT images by searching for one optimal 2D BMCP space in 2D BMCP space library. The optimal 2D BMCP space is the minimum one that can enclose point (μ L , R - value) of the pixel. If no 2D BMCP space in the library can enclose point (μ L , R - value), the optimal 2D BMCP space is the closest one to the point (μ L , R - value). As shown in Fig. 1 (b), the points (μ L , R - value) of hematite and siderite locate in 2D BMCP space 1 and 2 respectively. Therefore, calcium and titanium are selected as the basis materials for siderite, while titanium and vanadium are the ones for hematite.
After the compositions of two basis materials are determined for each pixel, IBMD method is performed to decompose two basis materials. The material decomposition may be imperfect due to beam hardening [21]. Cupping artifacts caused by beam hardening are shown in the image of
Taking single component material for example, the above method is illustrated as follows. Recalling formula (1), IBMD model contains three parameters: μ
E
,
Corrected image of
The principle for determining the thickness of basis material is then expressed as follows: the values of
(a) The energy map of siderite and the linear combination of basis material titanium and vanadium with varying thickness t = 2 ∼30mm. 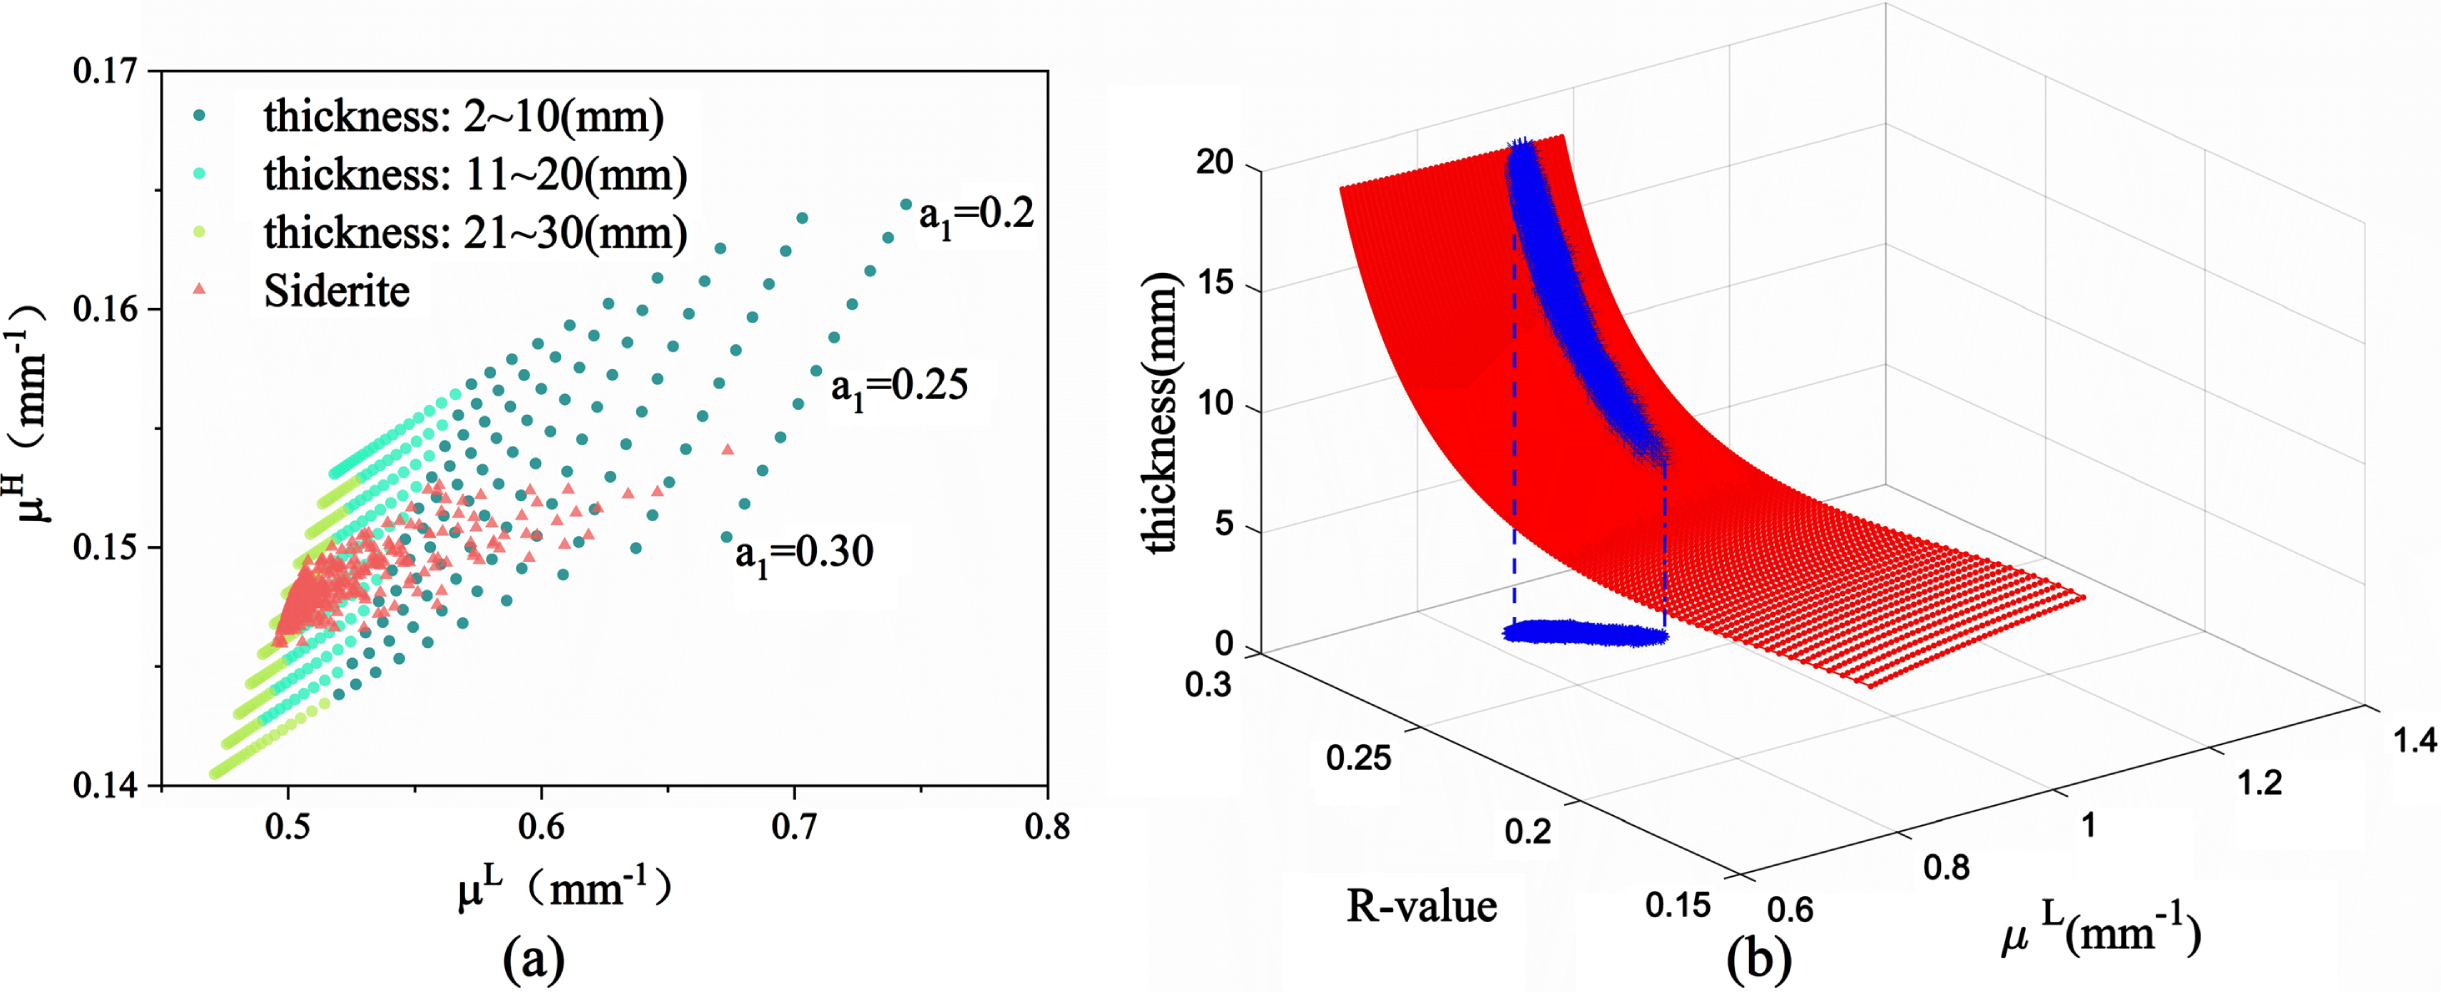
By setting the thickness of basis material as z-axis, 2D BMCP space is extended to three-dimensional (3D) BMCP space (see the 3D surface in Fig. 2 (b)).
The thickness of basis material is determined by mapping 2D points (μ L , R - value) of the scanned sample onto 3D BMCP space. The optimum thickness is the z-coordinate of each mapping point. Figure 2 (b) provides a graphical illustration for basis material thickness determination. The points (μ L , R - value) of hematite are mapped to 3D BMCP space of titanium and vanadium to determine the optimum thickness.
After two basis materials are determined, the images of a1 and a2 without the cupping artifact are obtained. Then the next step is to calculate ρ e and Z eff . As mentioned above, formula (4) and formula (5) are two empirical formulas that lead to inherent errors in the images of ρ e and Z eff . The detailed analysis is shown in literature [18]. To minimize the inherent errors, two formulas based on virtual monochromatic image are established to calculate ρ e and Z eff .
Once a1 and a2 are determined, the virtual monochromatic image at any energy is given by formula (1). X-ray attenuation for E < 1MeV arises from three physical mechanisms: Coherent scattering, Compton scattering, and Photoelectric absorption [29]. Therefore, μ
E
is expressed as follows:
In formula (12), f Coh (E), f Compton (E), and f Photo (E) denote the Coherent scattering coefficient, the Compton scattering coefficient, and the Photoelectric coefficient, which are only related to the energy E, whereas m and n are constants.
Figure 3 shows the variation of μ E for three different minerals at the range of 0 . 01MeV < E < 1MeV which is calculated according to the NIST XCOM database [30]. At E = 1MeV, as shown in Fig. 3, Compton scattering interaction accounts for more than 99.9% of photon-matter interaction. Therefore, the virtual monochromatic image at E = 1MeV provides a linear relationship between μ E and ρ e of the minerals:
Thus, ρ
e
is derived from formula (13). Similarly, at E = 10KeV, the photon-matter interaction exclusively involves Compton scattering interaction and Photoelectric absorption interaction. Then the attenuation coefficient is approximately expressed as:
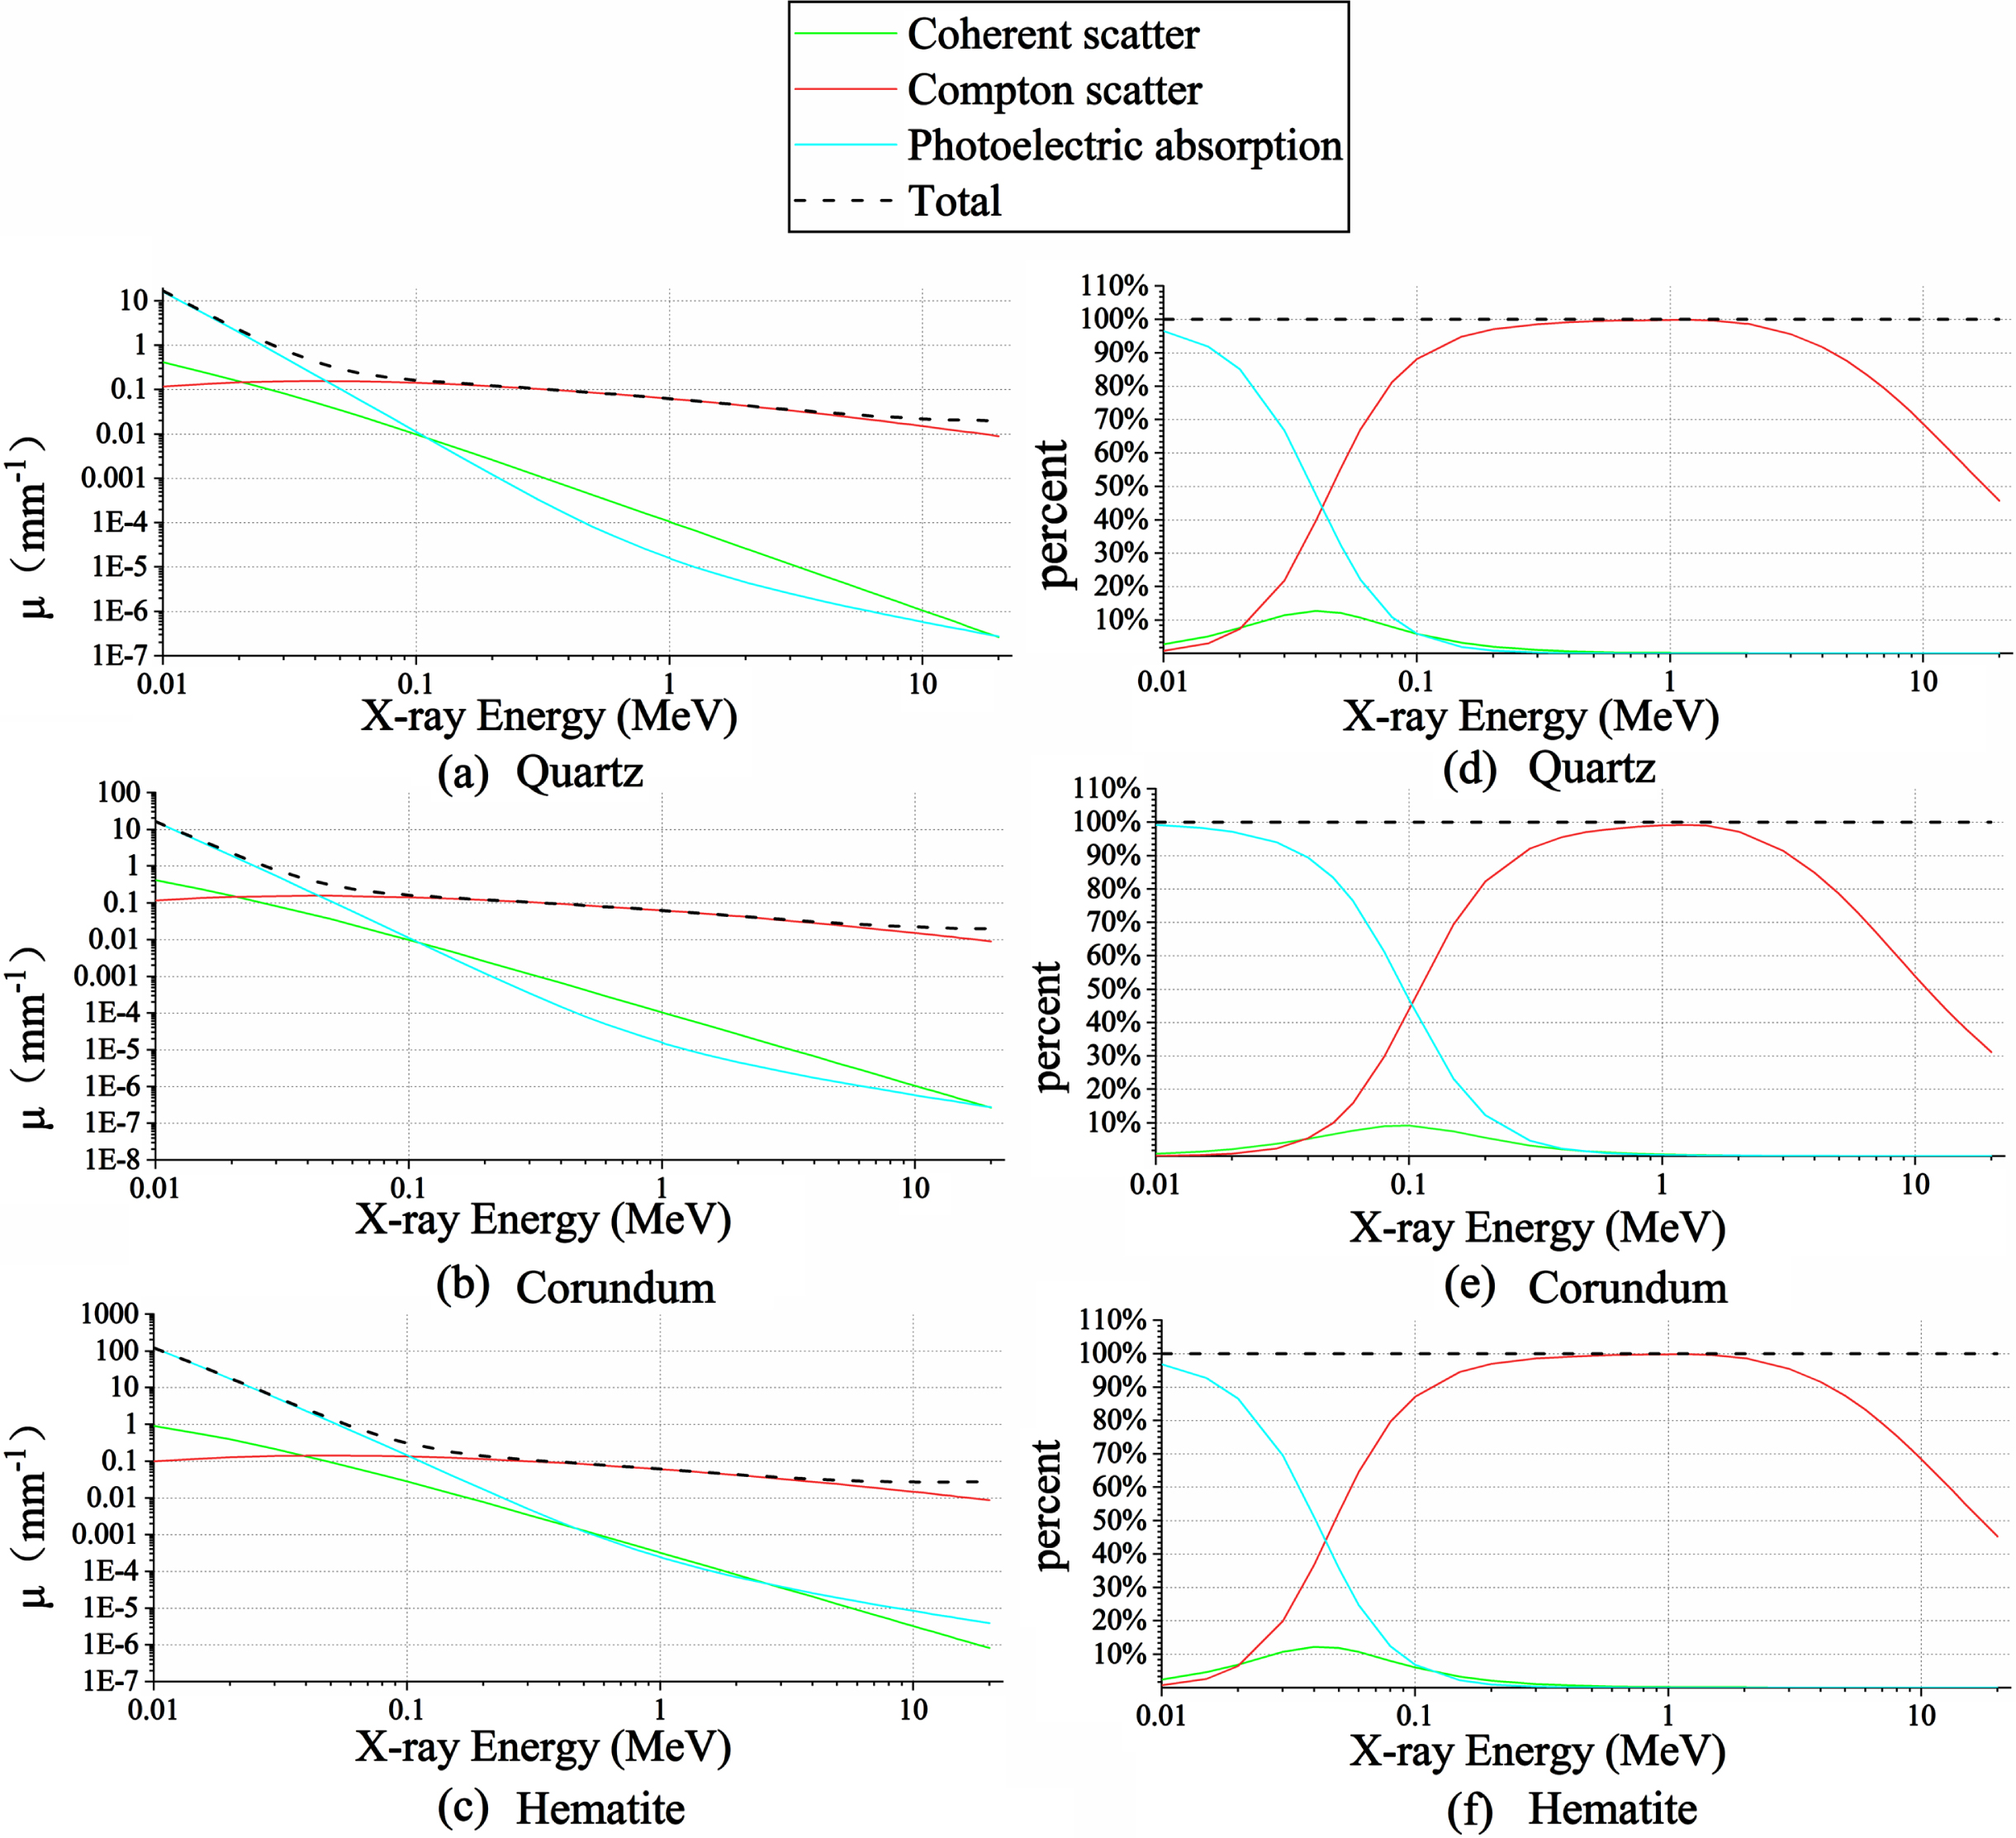
(a) (c) Example of μ E originating from three photon interactions at the range of 0 . 01MeV < E < 1MeV for three diagenetic minerals. (d) (f) Example of the percentage of three photon interactions at the range of 0 . 01MeV < E < 1MeV for three diagenetic minerals.
The workflow of our proposed method is shown in Fig. 4. First, a basis material library devoted to geological samples is developed (See Section 3.1 for detailed information). Every library member is set as a phantom with adjustable thickness. The 2D and 3D BMCP space library is built using the dual-energy imaging data of these basis material phantoms. Then the composition of basis material is determined using 2D BMCP space. After that, 3D BMCP space library is used to optimize the thickness of basis material. ρ e and Z eff of the scanned sample are obtained with the procedure in section 2.3.
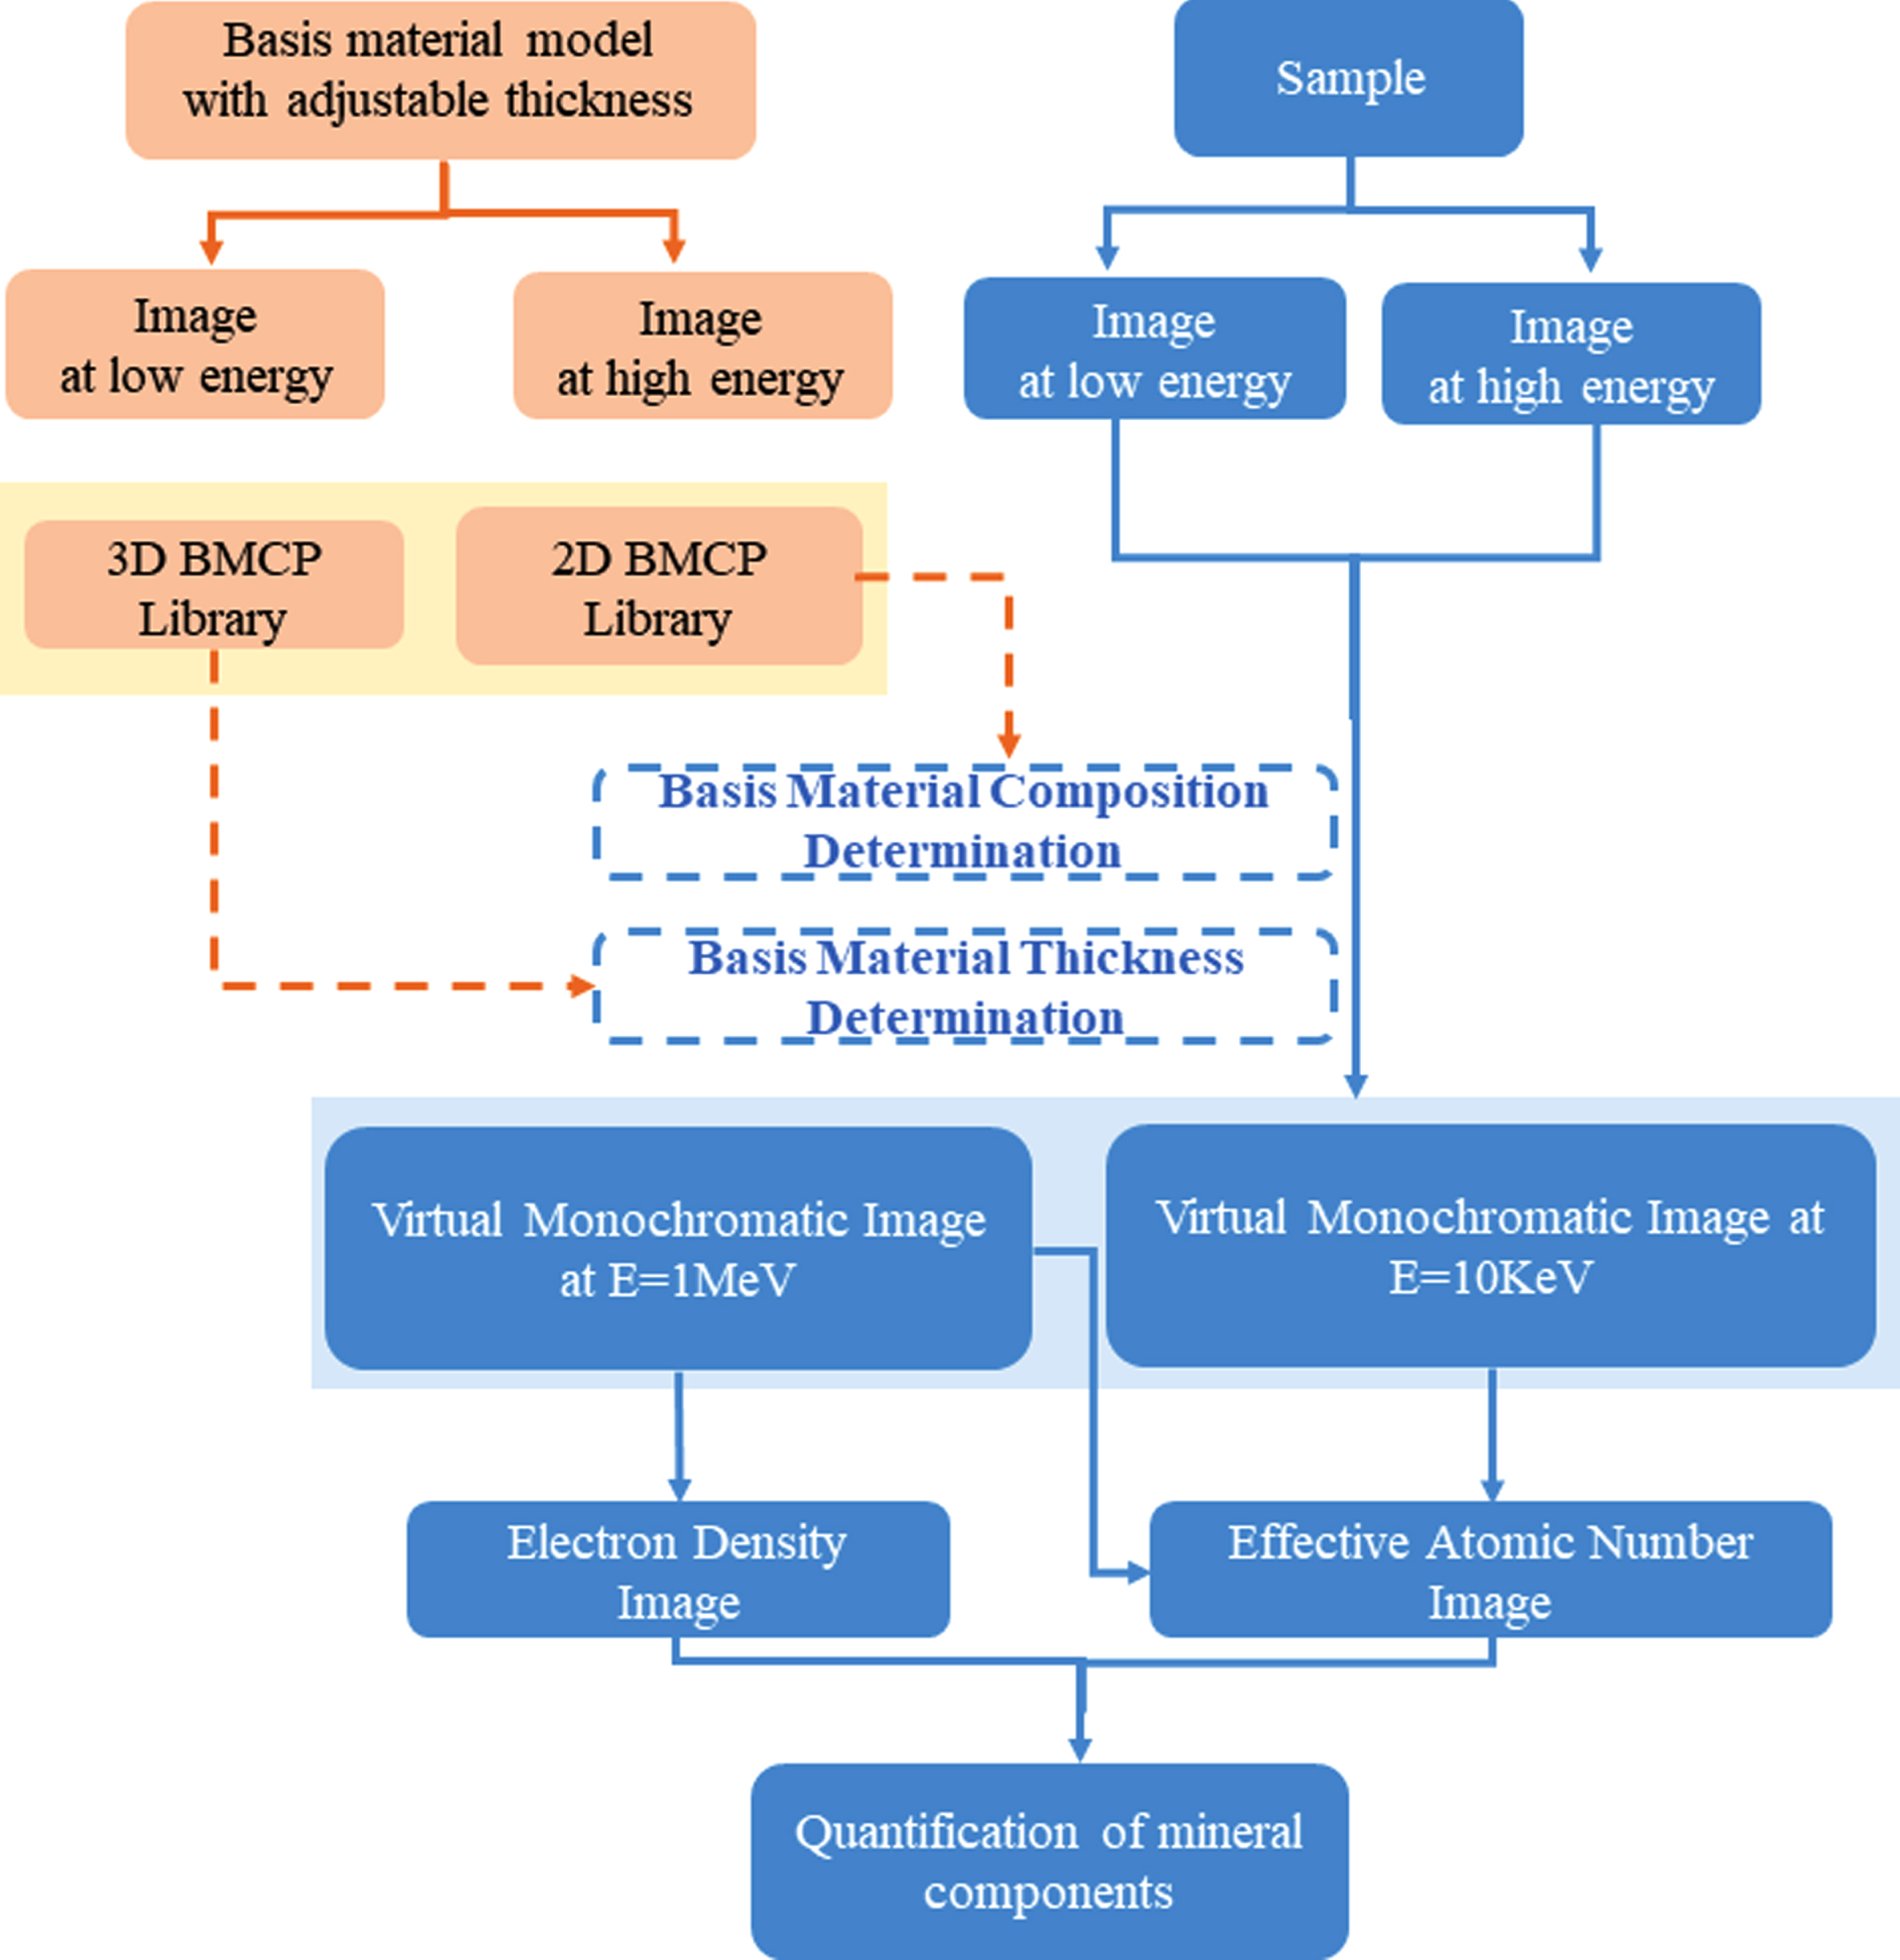
The diagram of the proposed method.
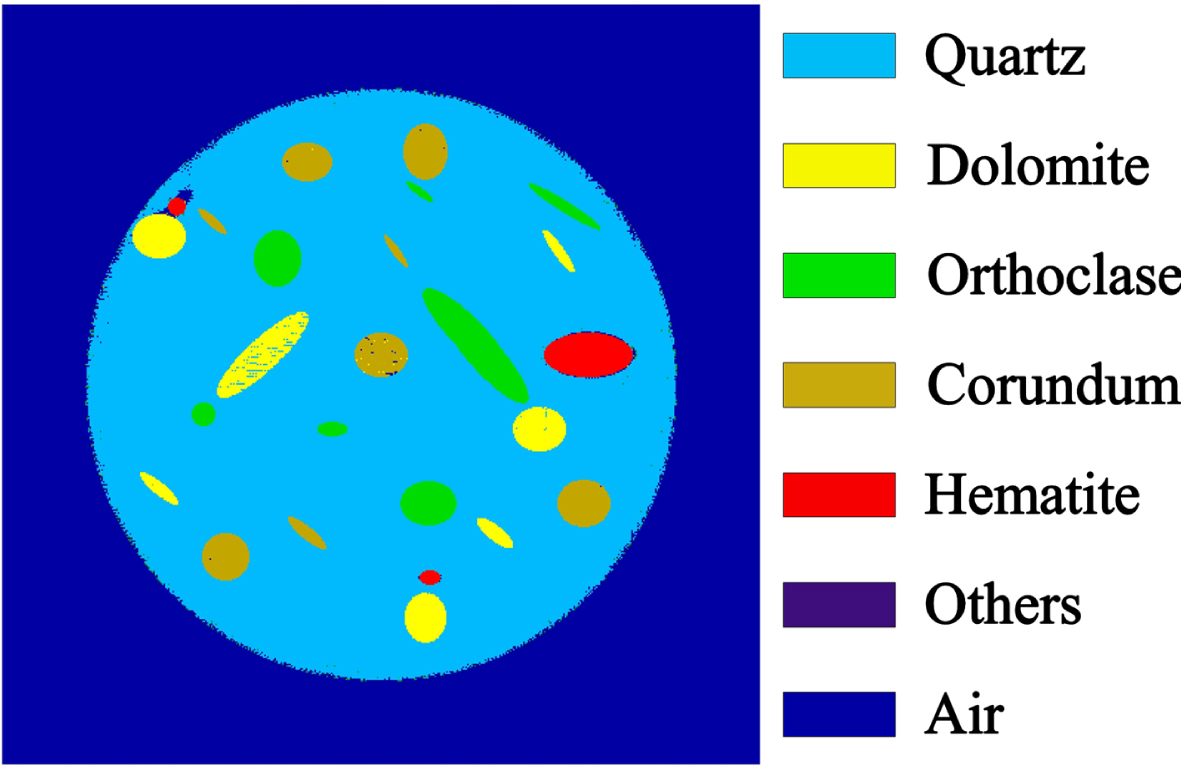
The final goal is to derive quantitative mineralogical results from the images of ρ e and Z eff . For this purpose, a threshold technique is carried out on the images of ρ e and Z eff . The upper and lower thresholds of ρ e and Z eff are determined based on the truth value of ρ e and Z eff of the minerals (upper/lower threshold = truth value ± truth value × 5 % in this paper). Possible mineral phases are listed in advance based on the knowledge of the geological samples. Pixels with the value of ρ e and Z eff between the same upper and lower thresholds are labeled as the same corresponding mineral. Pixels with the value of ρ e and Z eff above chalcopyrite were classified as unknown high-density mineral and those with the value of ρ e and Z eff below quartz are classified as porous. Thus, through the combination of the information of ρ e and Z eff , the material quantitative characterization of the geological sample is completed.
Experiment settings
Numerical simulations were implemented to investigate the performance of the proposed method. The X-ray spectrum was obtained from Spectrum GUI, an open-source energy spectrum generation program. No filter for the CT scanner was selected. Two narrow spectra: 30KeV ∼ 50KeV for the low-energy spectrum and 70KeV ∼ 90KeV for the high-energy spectrum were used for DECT imaging. In the numerical simulation study, a simulation phantom (Fig. 5) consisting of five minerals was imaged. ρ e and Z eff for the five minerals above cover a wide range of ρ e and Z eff of common minerals. The image size of the phantom is 512 × 512 pixels and each pixel is 100μ m × 100μ m. A basis material library devoted to geological samples was developed. Seven pure chemical materials: 20% sodium chloride solution (20% NaCl), aluminum (Al), silicon (Si), calcium (Ca), titanium (Ti), vanadium (V), and iron (Fe) were selected as the library members according to our prior knowledge. Every library member was set as a model with adjustable thickness and imaged to obtain the dataset μ - t. The attenuation coefficients of the materials used in this study were generated from the NIST XCOM database [25]. DECT projections under two spectra were simulated using 2D fan-beam CT geometry. FBP algorithm was applied to reconstruct the attenuation value distribution from the projections.
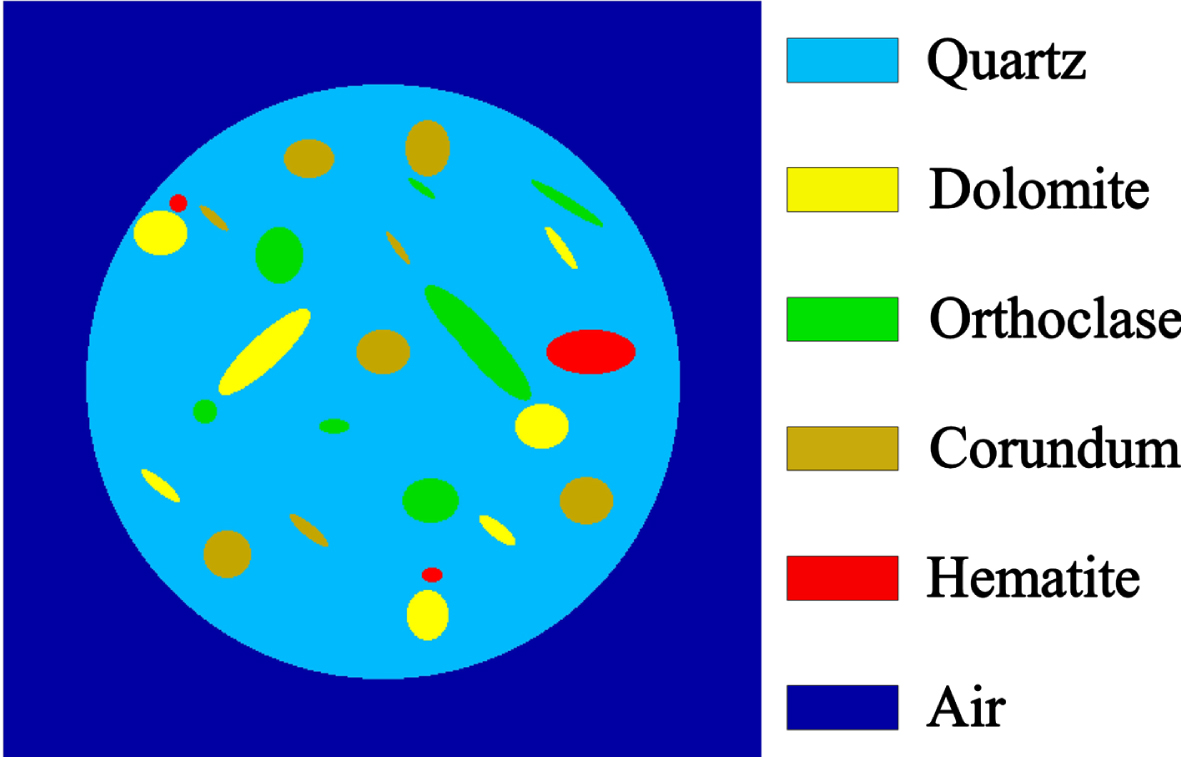
The simulation phantom.
The unknown coefficient mi (i = 1, 2, 3) in formula (9) was determined by fitting the dataset μ - t of basis material to formula (9). As shown in Fig. 6, there is an excellent agreement between formula (9) and the simulation data of iron and silicon with the thickness larger than 1 mm. The determination coefficients R2 of the fitting for the above six basis materials are all greater than 0.99, which demonstrates the validity of our proposed model in formula (9).
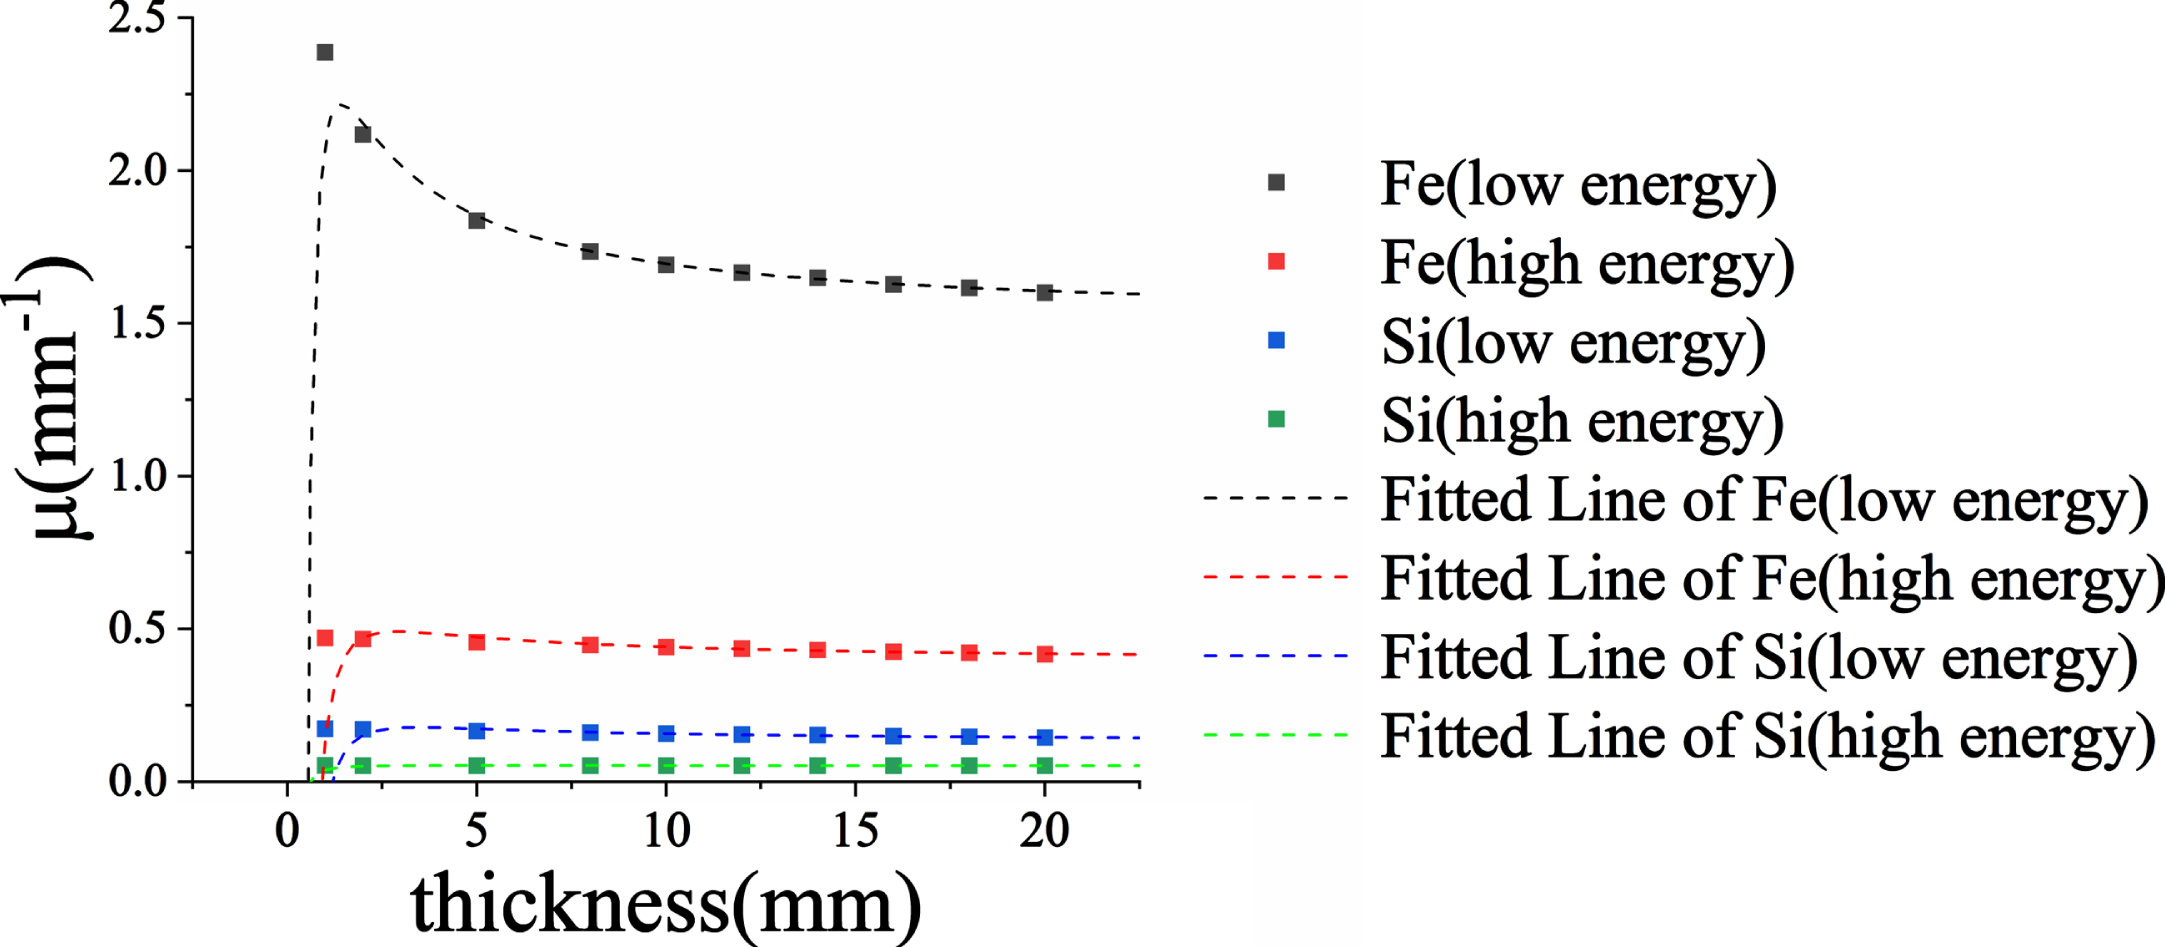
Simulated dataset μ - t and fitted lines for formula (9) of iron (Fe) and silicon (Si) at low and high energy.
The unknown coefficients: f Compton (E1), k (E2, E1), and g (E2, E1) in formula (13) and formula (15) were determined by fitting the data of several pure chemical elements to formula (13) and formula (15). The detailed data is listed in Table 1. Figure 7 shows the fitting results. It is noted that the determination coefficients are all above 0.999 (R2 > 0 . 999), which demonstrates the validity of the proposed formulas.
The reference data of the pure chemical elements used in the least squares fit
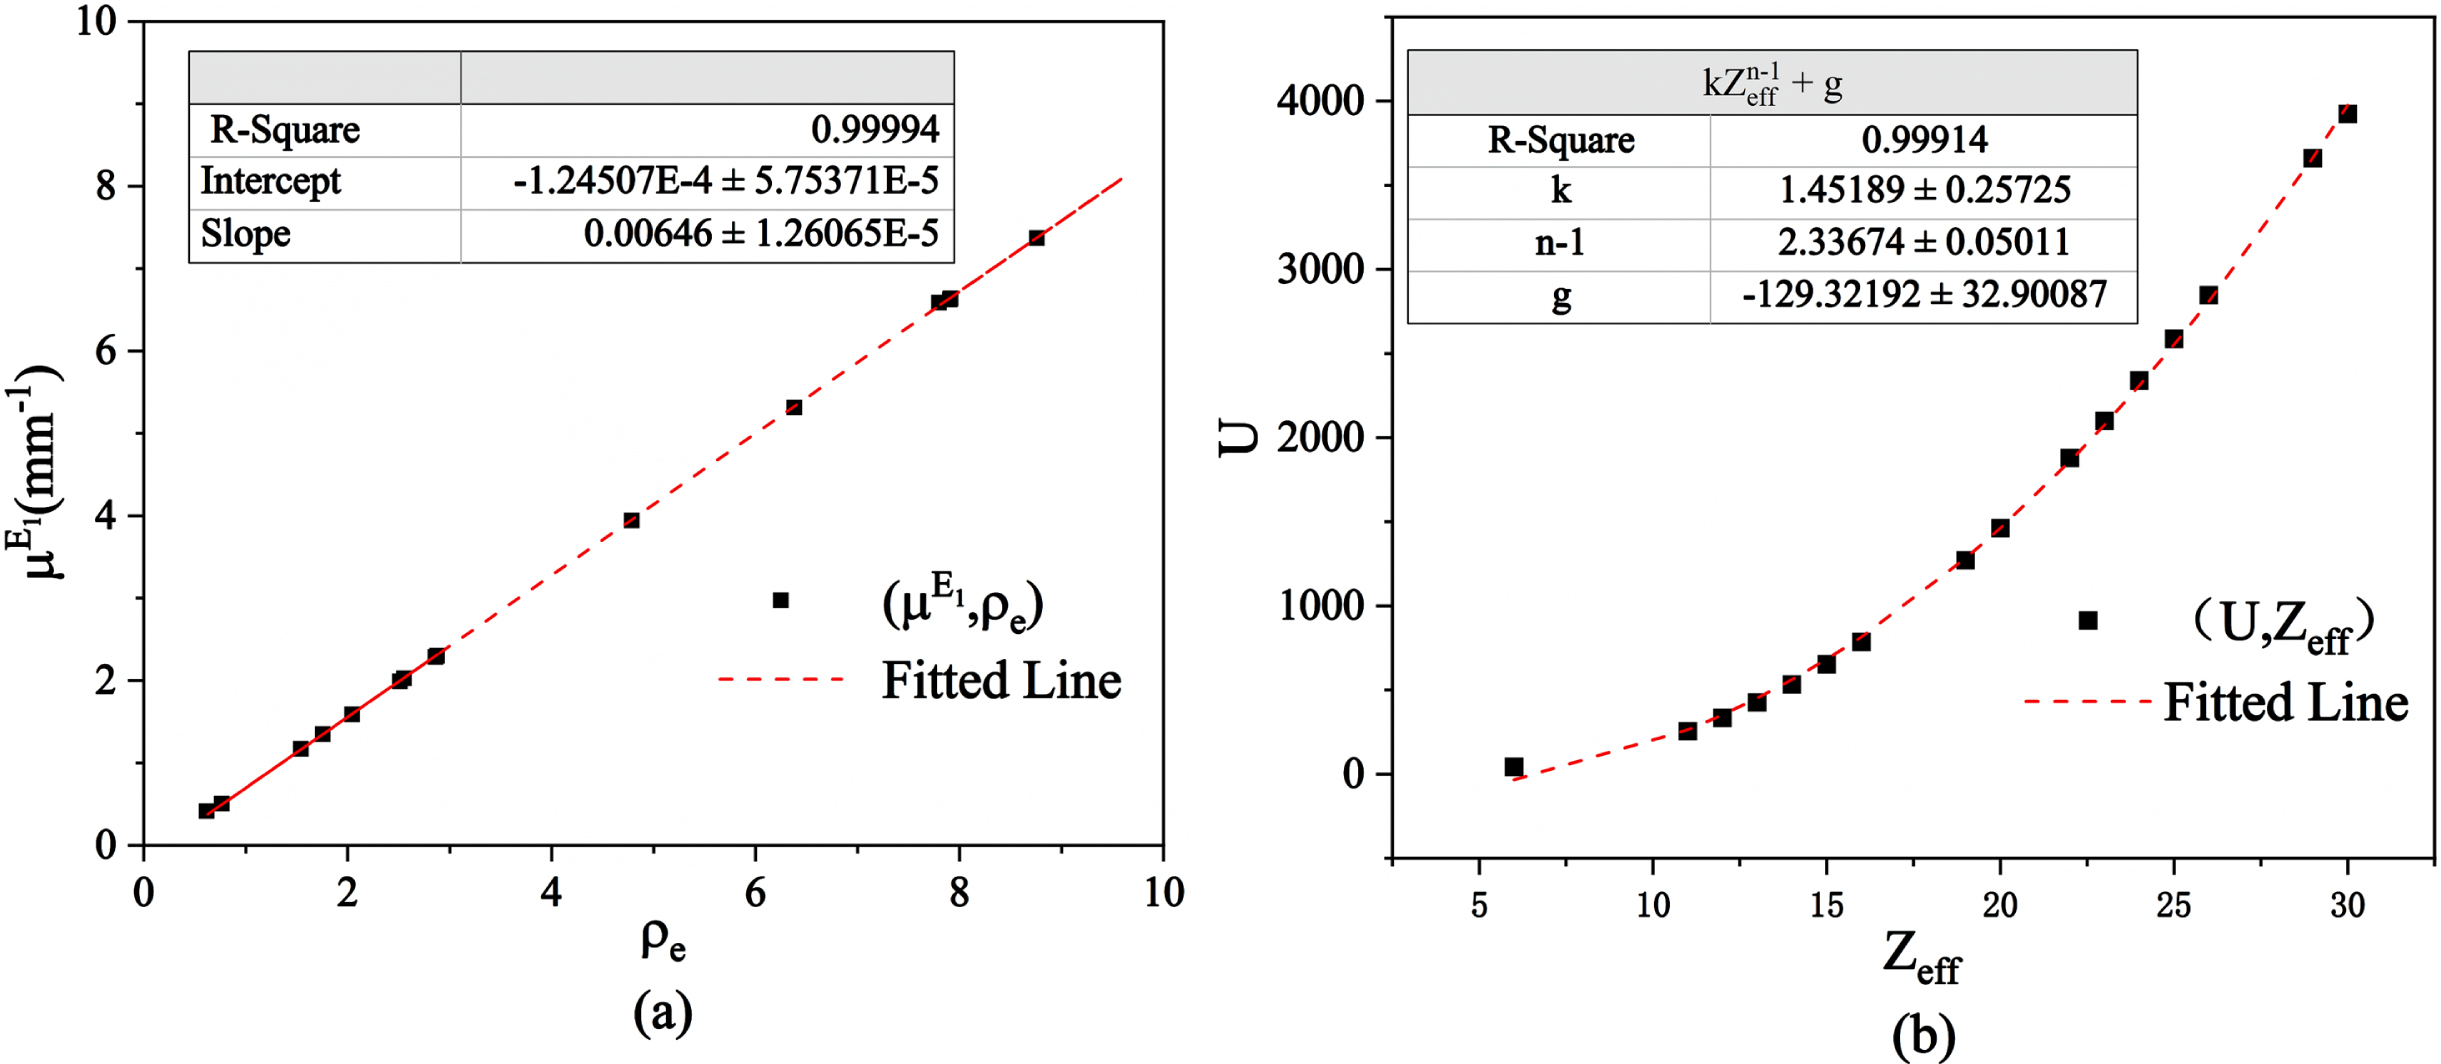
(a) Dataset μE1 - ρ e and fitted lines for formula (13); (b) Dataset U - Z eff and fitted lines for formula (15).
The determination results of basis material composition and thickness are shown in Fig. 8 (a) and 8 (b). The slice images of ρ e and Z eff obtained by IIBMD method are shown in Fig. 8 (c) and 8 (d). The performance of IIBMD method and traditional IBMD method in the calculation of ρ e and Z eff is compared in Fig. 8 (e) and 8 (f). In the traditional IBMD method, only one basis material combination (silicon and titanium) with uniform thickness was used for material decomposition, while ρ e and Z eff were calculated using formula (4) and formula (5). To fully verify the improvement of IIBMD method, the results of ρ e and Z eff from IBMD method with basis material composition determination (IBMDC) and IBMD method with basis material composition and thickness determination (IBMDT) are also shown in Fig. 8 (e) and 8 (f). Obviously, unacceptable errors are shown in the results from IBMD method (yellow lines in Fig. 8 (e) and 8 (f)), which is reduced to an acceptable range by basis material composition determination (blue lines in Fig. 8 (e) and 8 (f)). In addition, the determination of the thickness for basis material significantly attenuates the errors due to beam hardening (blue and green lines in Fig. 8 (e) and 8 (f)). Finally, the results of ρ e and Z eff obtained by IIBMD method are closer to the theoretical values than those of IBMDT method (green and red lines in Fig. 8 (e) and 8 (f)). Therefore, formula (13) and formula (15) are effective in improving the calculation accuracy of ρ e and Z eff .
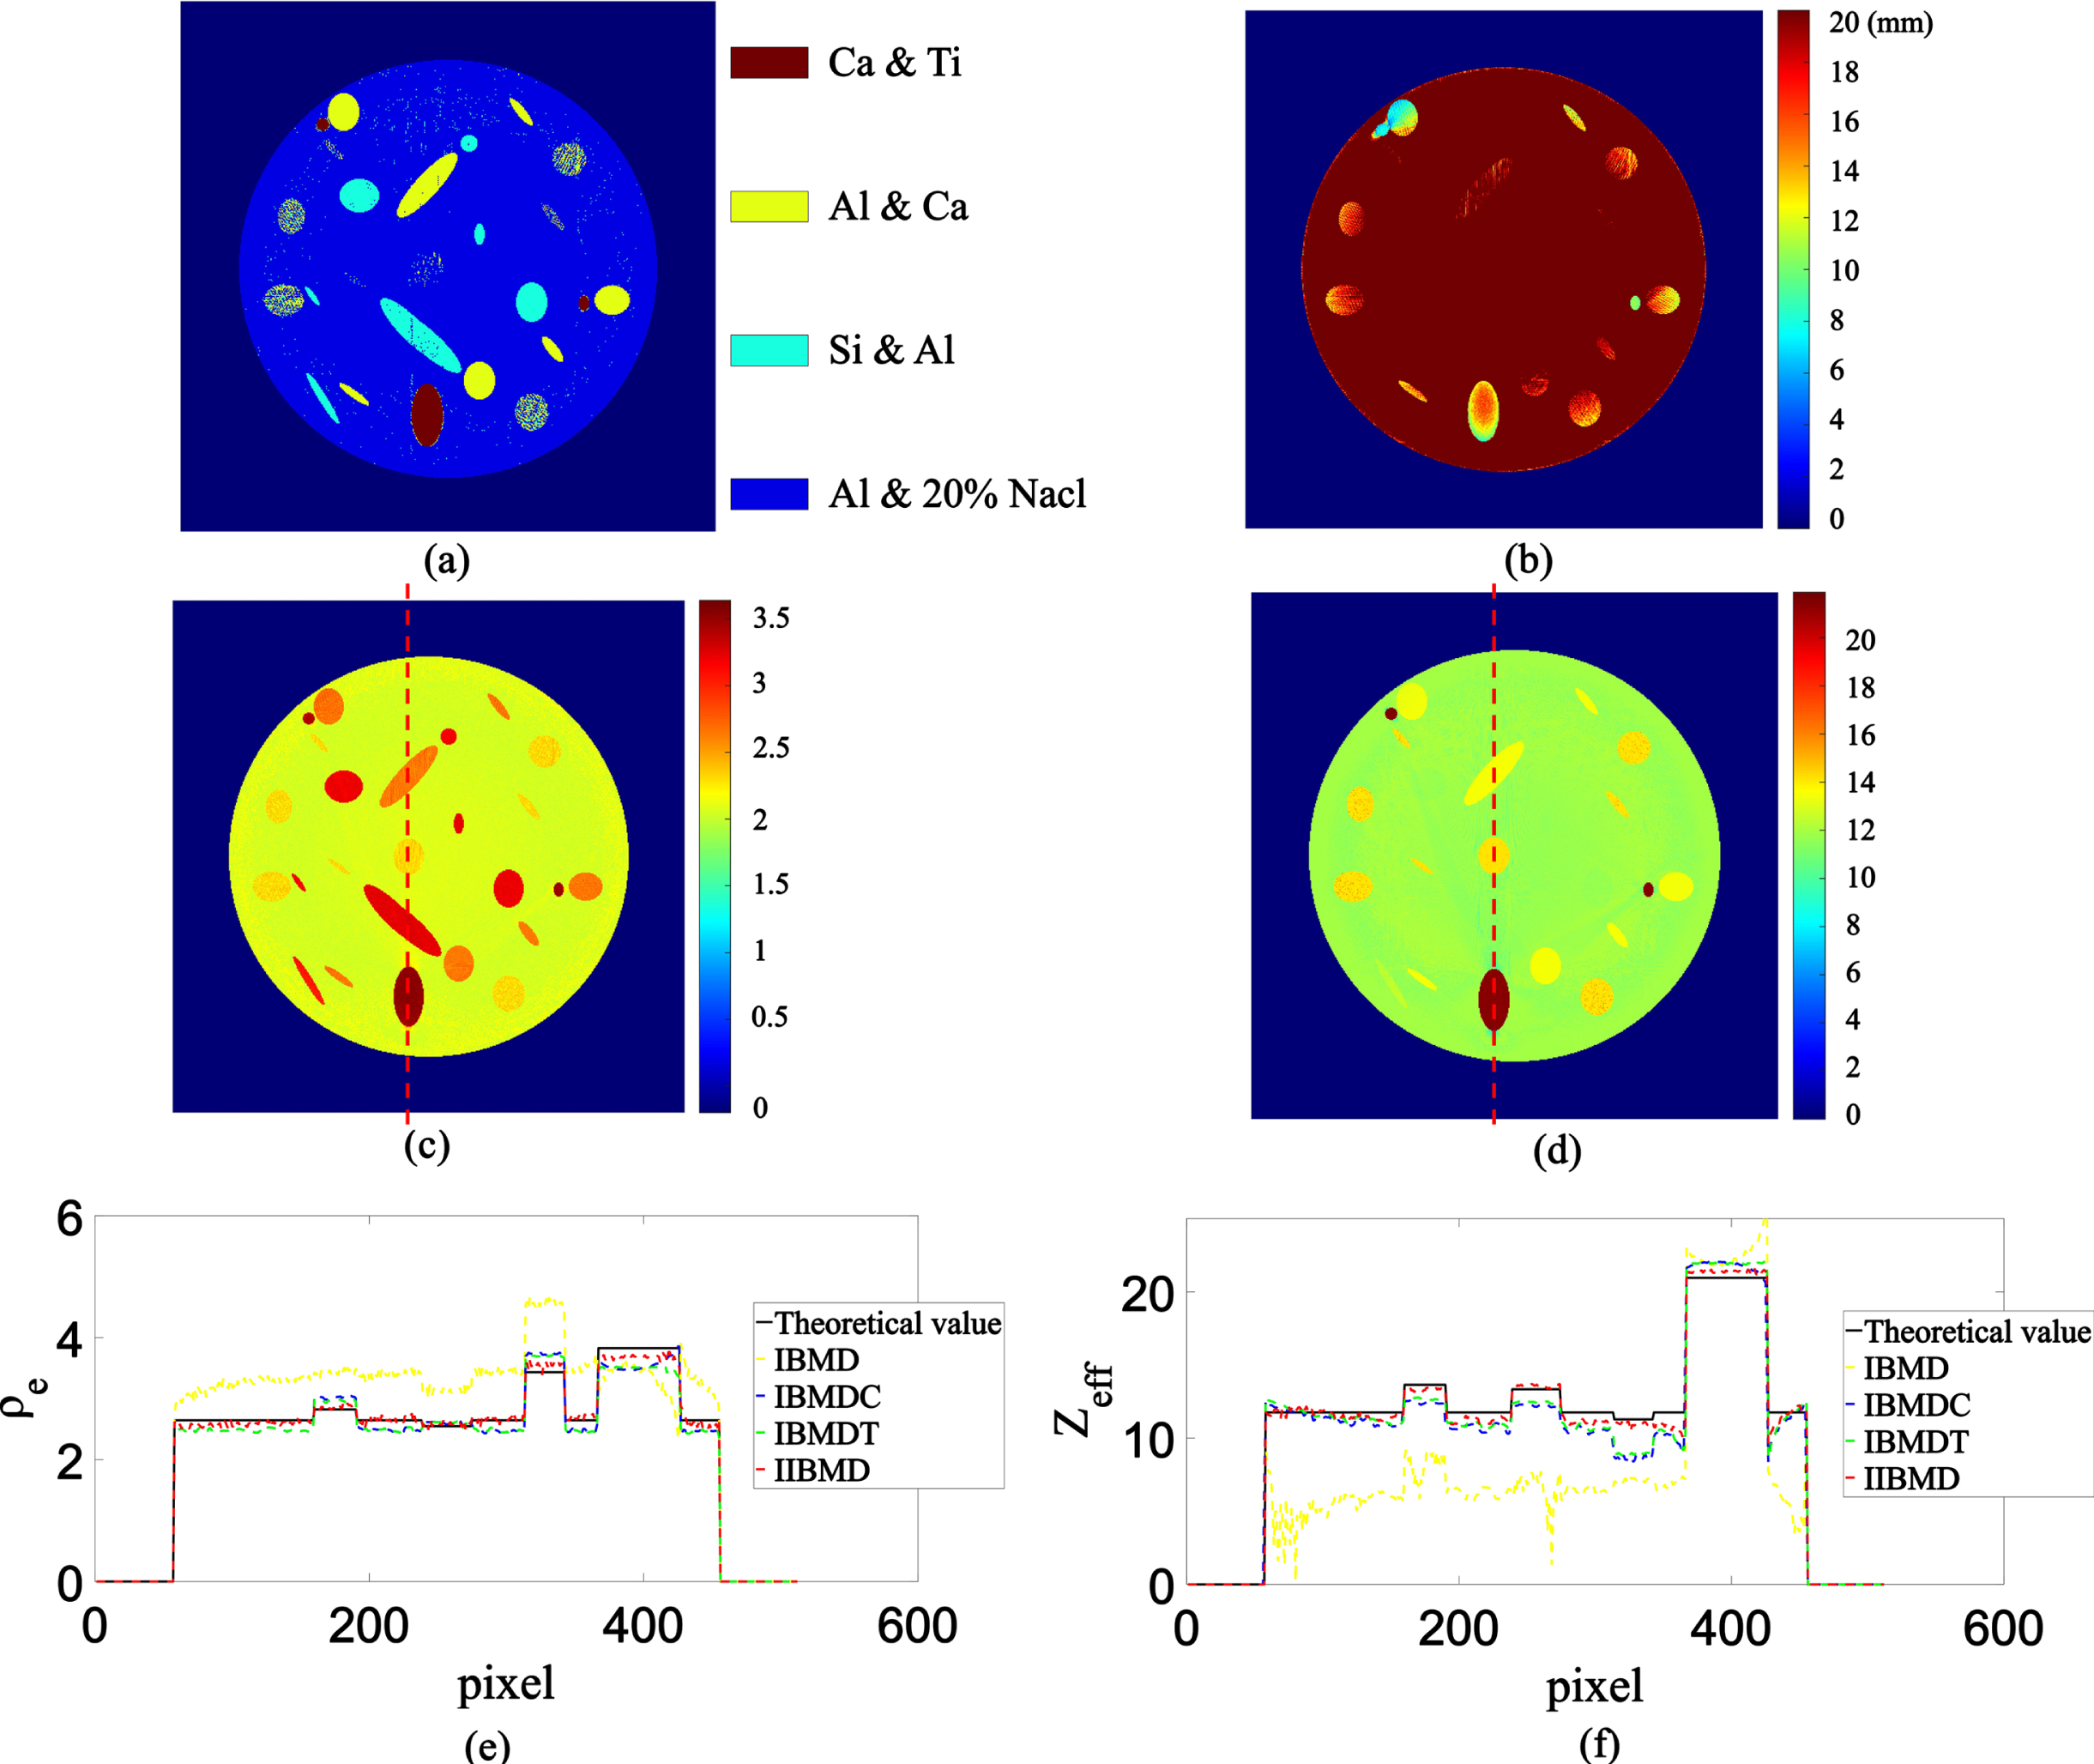
(a) The determination results of basis material composition;
After ρ e and Z eff were obtained, the segmented image was obtained by applying threshold technique, as shown in Fig. 9. Table 2 summarizes the results of ρ e , Z eff , and volume fraction. The experimental values show an excellent agreement with the theoretical ones within a relative error of 5%, which validates the effectiveness of the proposed method.
Segmented image of the simulation phantom.
Comparison of experimental value and theoretical value for ρ e , Z eff , and V of the simulation phantom in Fig. 5
*V means the volume fraction and the theoretical values of ρ e and Z eff are obtained by formula (6) and formula (7).
Configuration of the PCD-based DECT system
All the practical experiments were performed on a self-built PCD-based DECT system (Fig. 10), which is developed by The State Key Laboratory of Precision Measuring Technology and Instruments of Tianjin University in China. The DECT system is composed of an X-ray source (Hamamatsu L8121-52), a rotation stage, a CdTe semiconductor PCD (XC-Actaeon FX3), and the controlling system. The detector has 256 × 256 pixels with a pixel size of 100μ m × 100μ m. By setting different energy thresholds, PCD can count the photons above different energy thresholds to obtain CT images of different energy bins. In dual-energy mode, the detector could set two energy thresholds in one acquisition. The low energy threshold amounts to the lowest threshold for the detector to count the photons of the total energy image. The high energy threshold amounts to the lowest threshold for the detector to count the photons of the high energy image. Subtraction operation is applied to obtain the counts of low energy image.
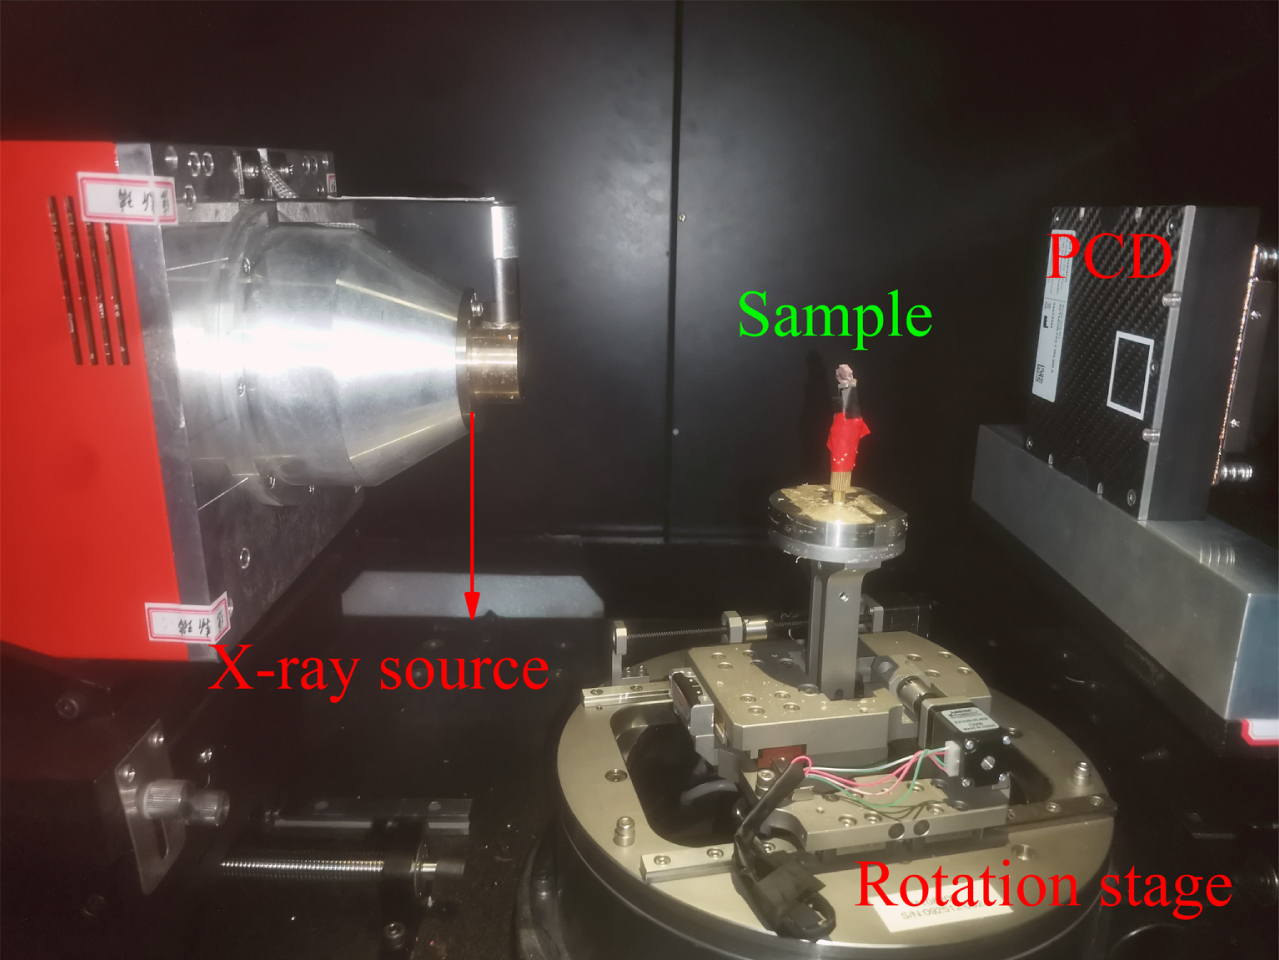
The PCD-based DECT system.
X-ray source was operated at 55kV and 115mA. Two thresholds used for acquisition were 10kV and 27kV. Thus, two narrow energy bins: 10kV ∼ 27kV for low-energy and 27kV ∼ 55kV for high-energy were achieved. The main dual-energy scanning parameters are summarized in Table 3.
Main dual-energy scanning parameters
Six basis materials: graphite, 20% NaCl, aluminum (Al), silicon (Si), titanium (Ti), and iron (Fe) were used for basis material decomposition in the practical experiment. These basis material phantoms are all cylinders of 99.9% purity elementary substances except 20% NaCl. The diameters of these cylinders are 4 mm, 8 mm, 10 mm, 12 mm, and 14 mm. 20% NaCl was placed in centrifuge tubes with diameters of 6 mm, 8 mm, 10 mm, 11 mm, and 13 mm. Seven mineral samples (Table 4, columns 1) and two rock samples (Fig. 11) were used for the validation of IIBMD method. The first rock sample is an artificial sample consisting of quartz, calcite, and siderite. The second one is a natural igneous sample. The possible mineral phases in igneous are classified into six categories (see Table 6 for corresponding parameters) according to prior knowledge [31].
Comparison of experimental value and theoretical value for ρ
e
and Z
eff
of seven mineral samples
Comparison of experimental value and theoretical value for ρ e and Z eff of seven mineral samples
*The theoretical values of ρ e and Z eff are obtained by formula (6) and formula (7).
Comparison of the theoretical values and experimental values of volume fractions of different phases in the artificial sample
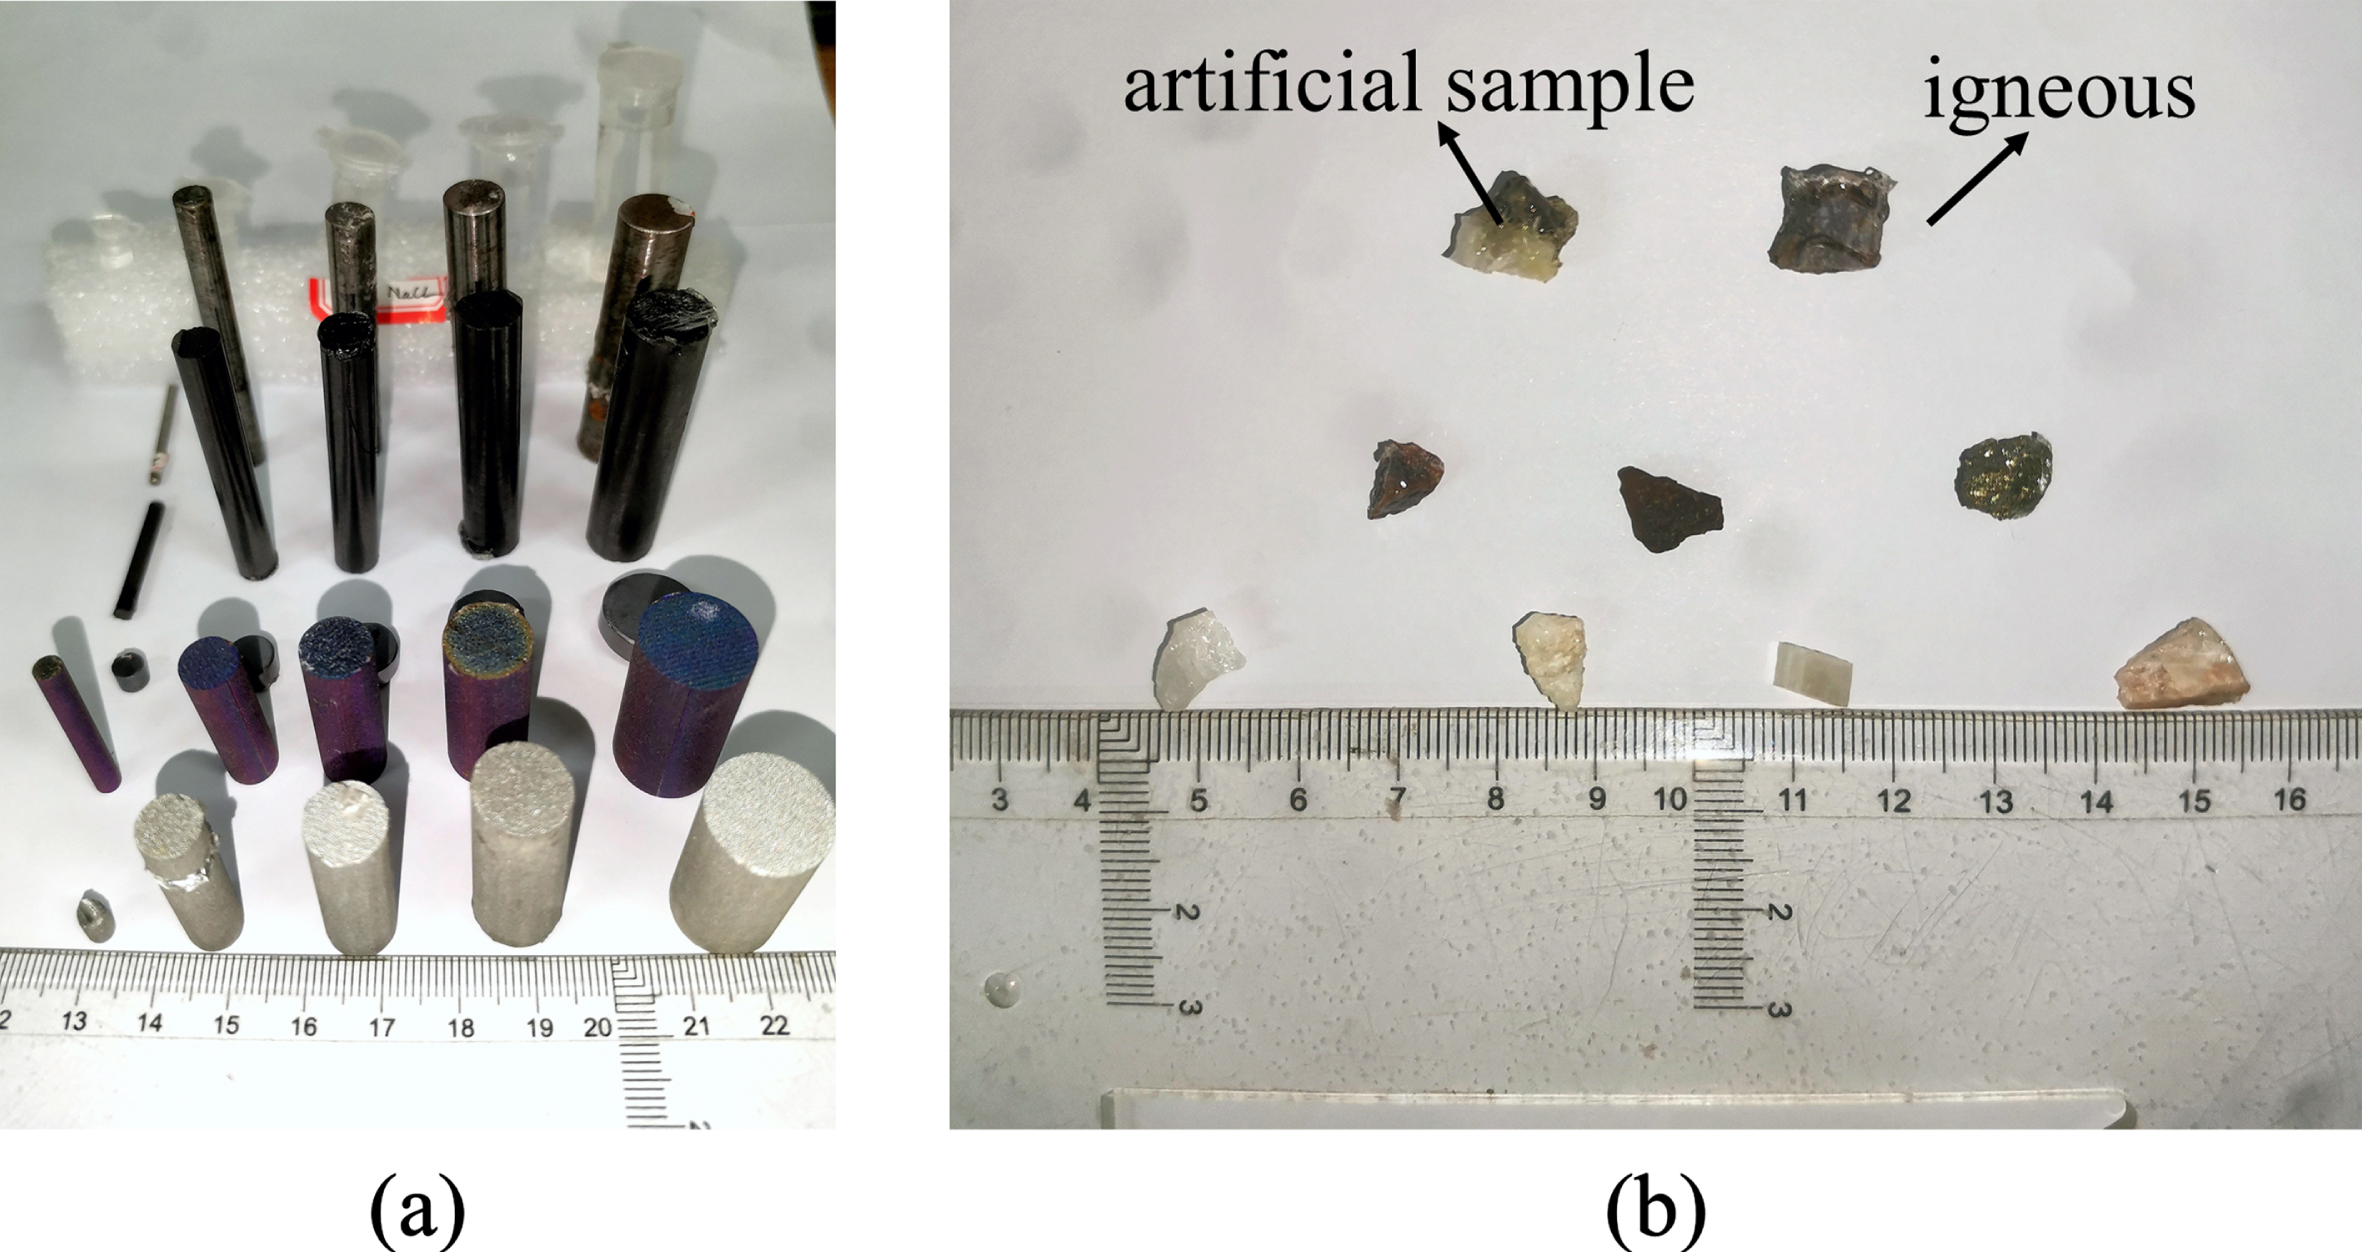
(a) Basis materials; (b) Geological samples: seven mineral samples and two rock samples.
Minerals phases in igneous sample with their chemical composition and theoretical ρ e and Z eff
The coefficients mi (i = 1, 2, 3) in formula (9) were calibrated by fitting dataset μ - t of basis material phantom. The fit for each basis material phantom in low and high energy presents R2 > 0.99. ρ e and Z eff of seven mineral samples were calculated using IIBMD method. The relative difference between the experimental and theoretical values of ρ e and Z eff is shown in Table 4. The experimental values agree well with the theoretical values within one standard deviation, indicating that the IIBMD method is also valid in real situations.
Figure 12 shows the performance of IIBMD method and traditional IBMD method in the calculation of ρ e and Z eff for the artificial sample. In the traditional IBMD method, only one basis material combination (silicon and titanium) with uniform thickness was used for material decomposition, while ρ e and Z eff were calculated using formula (4) and formula (5). In Fig. 12, the results of ρ e and Z eff from IBMD method with basis material composition determination (IBMDC) and IBMD method with basis material composition and thickness determination (IBMDT) are compared to those from IIBMD method. Obviously, unacceptable errors are shown in the results from IBMD method (yellow lines in Fig. 12). The errors are decreased to an acceptable range in IBMDC method (blue lines in Fig. 12), which illustrates the important role of basis material composition determination. In addition, basis material thickness determination significantly attenuates the error due to beam hardening (blue and green lines in Fig. 12). Finally, the results of ρ e and Z eff obtained by IIBMD method agree better with the theoretical values than those obtained by IBMDT method. Therefore, formula (13) and formula (15) are effective in improving the calculation accuracy of ρ e and Z eff .
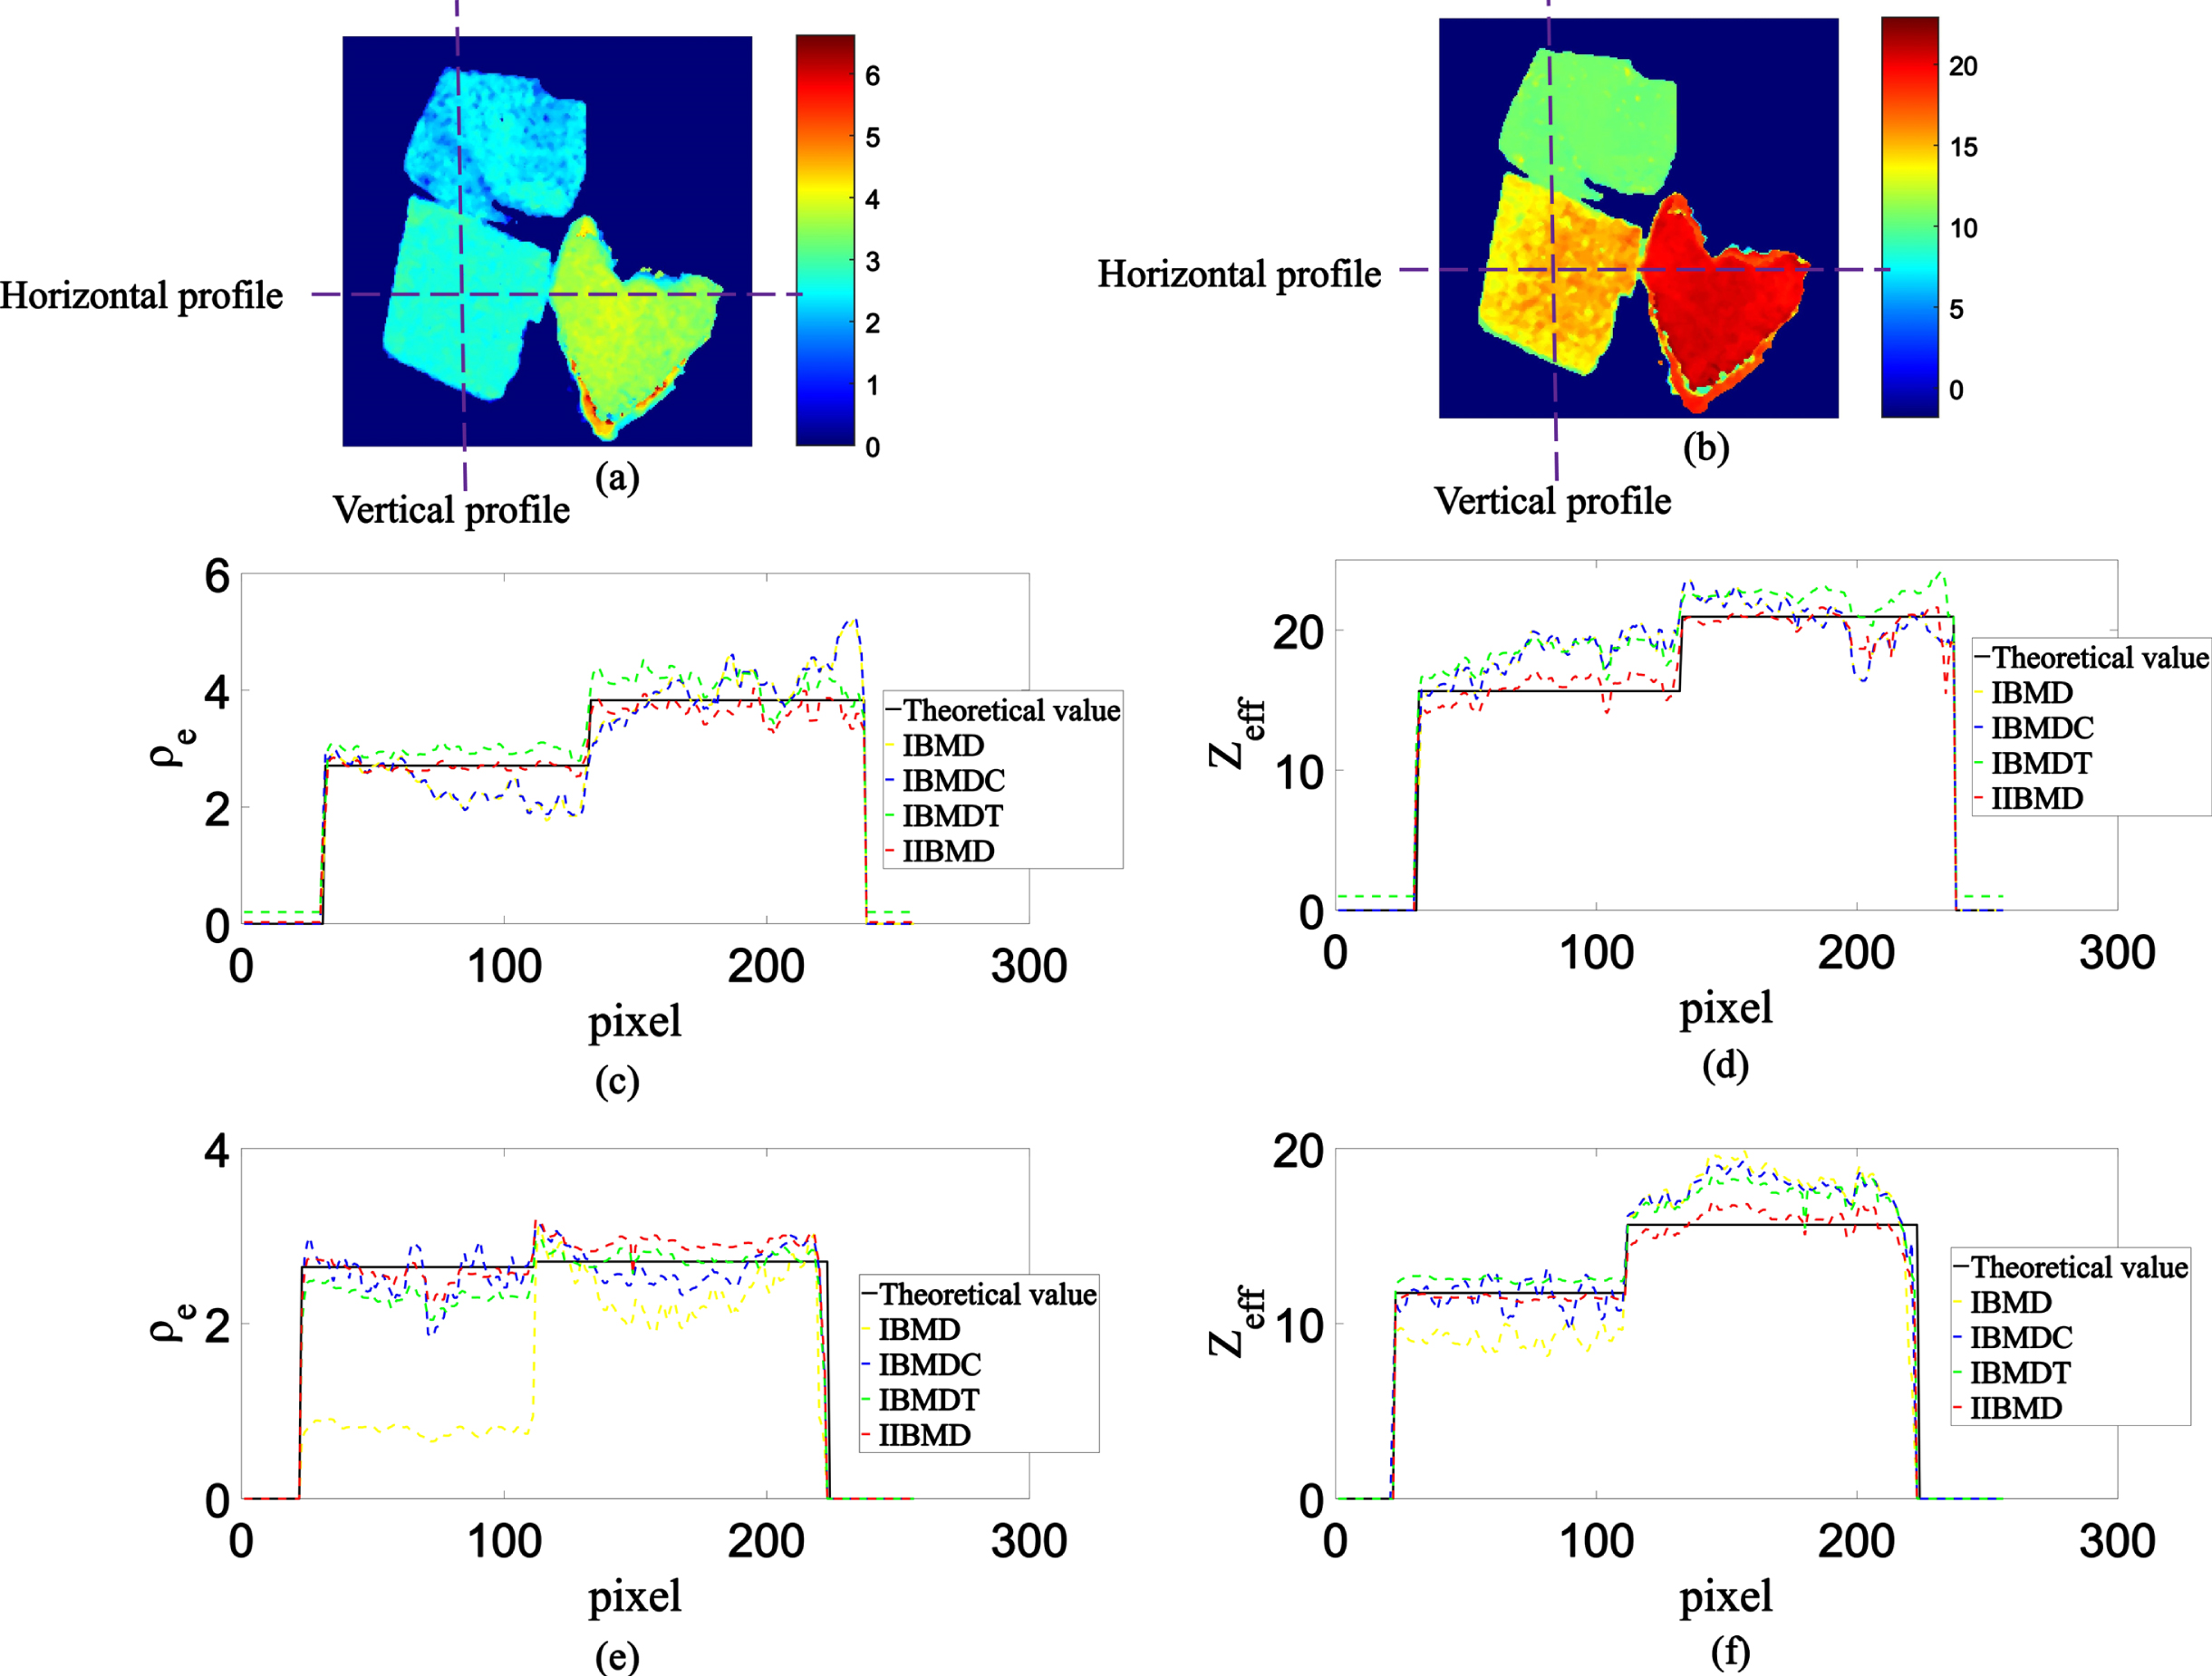
(a) The slice image of ρ e from IIBMD method; (b) The slice image of Z eff from IIBMD method; (c) Horizontal profile of ρ e ; (d) Horizontal profile of Z eff ; (e) Vertical profile of ρ e ; (f) Vertical profile of Z eff .
The spatial distributions (Fig. 13 (b)) and volume fractions (Table 5) of dolomite, calcite, and siderite in the artificial sample were obtained by applying a threshold technique to image ρ e and image Z eff . The theoretical volume fractions of different phases were obtained by the drainage method. Although the three mineral phases were separated successfully as shown in Fig. 13 (b), the accuracy of the volume fraction needs to be improved. Figure 14 shows the segmentation result of an igneous sample obtained by the proposed method. The volume fractions of all possible mineral phases are listed in Fig. 14 (b). The experimental value is quite close to the theoretical value, which indicates a reliable segmentation result. Note that the theoretical value in Fig. 14 (b) is obtained by referring to literature [31].
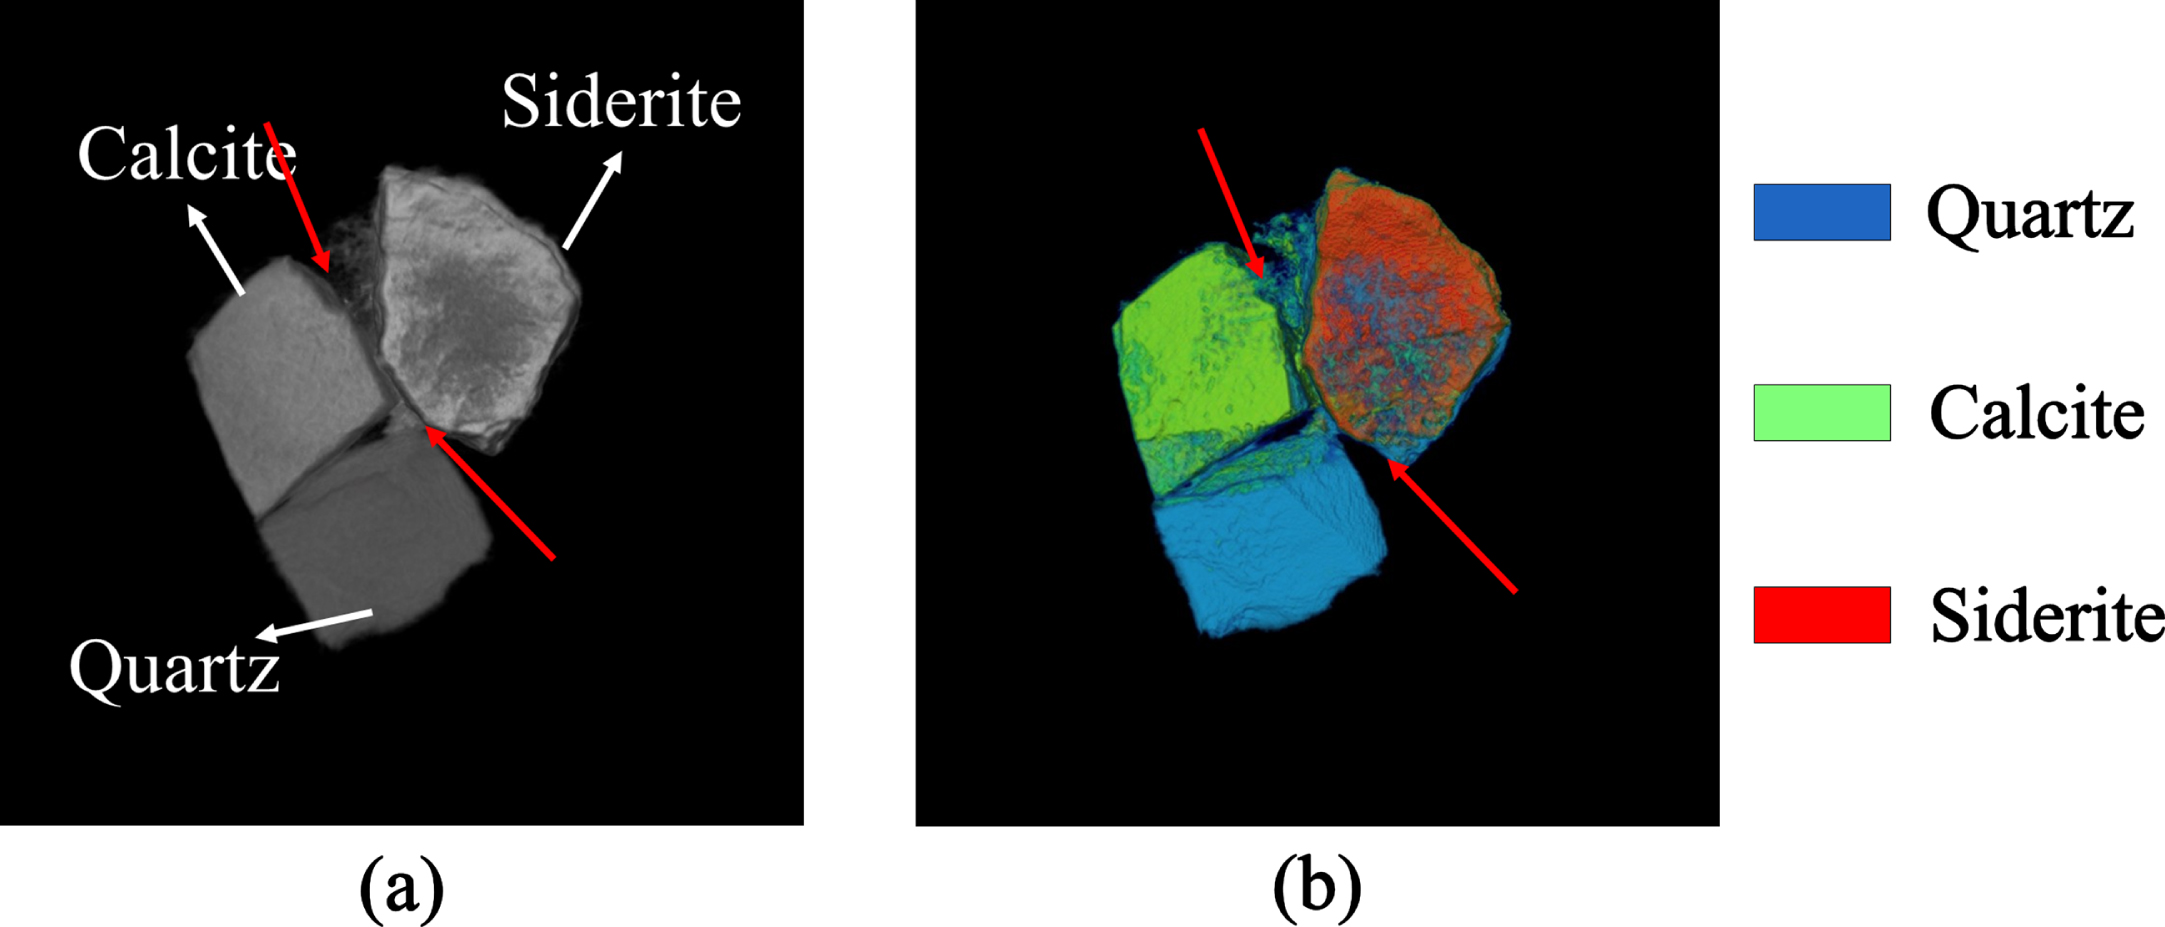
(a) Low-energy reconstruction image of the artificial sample; (b) 3D segmentation result of the artificial sample.
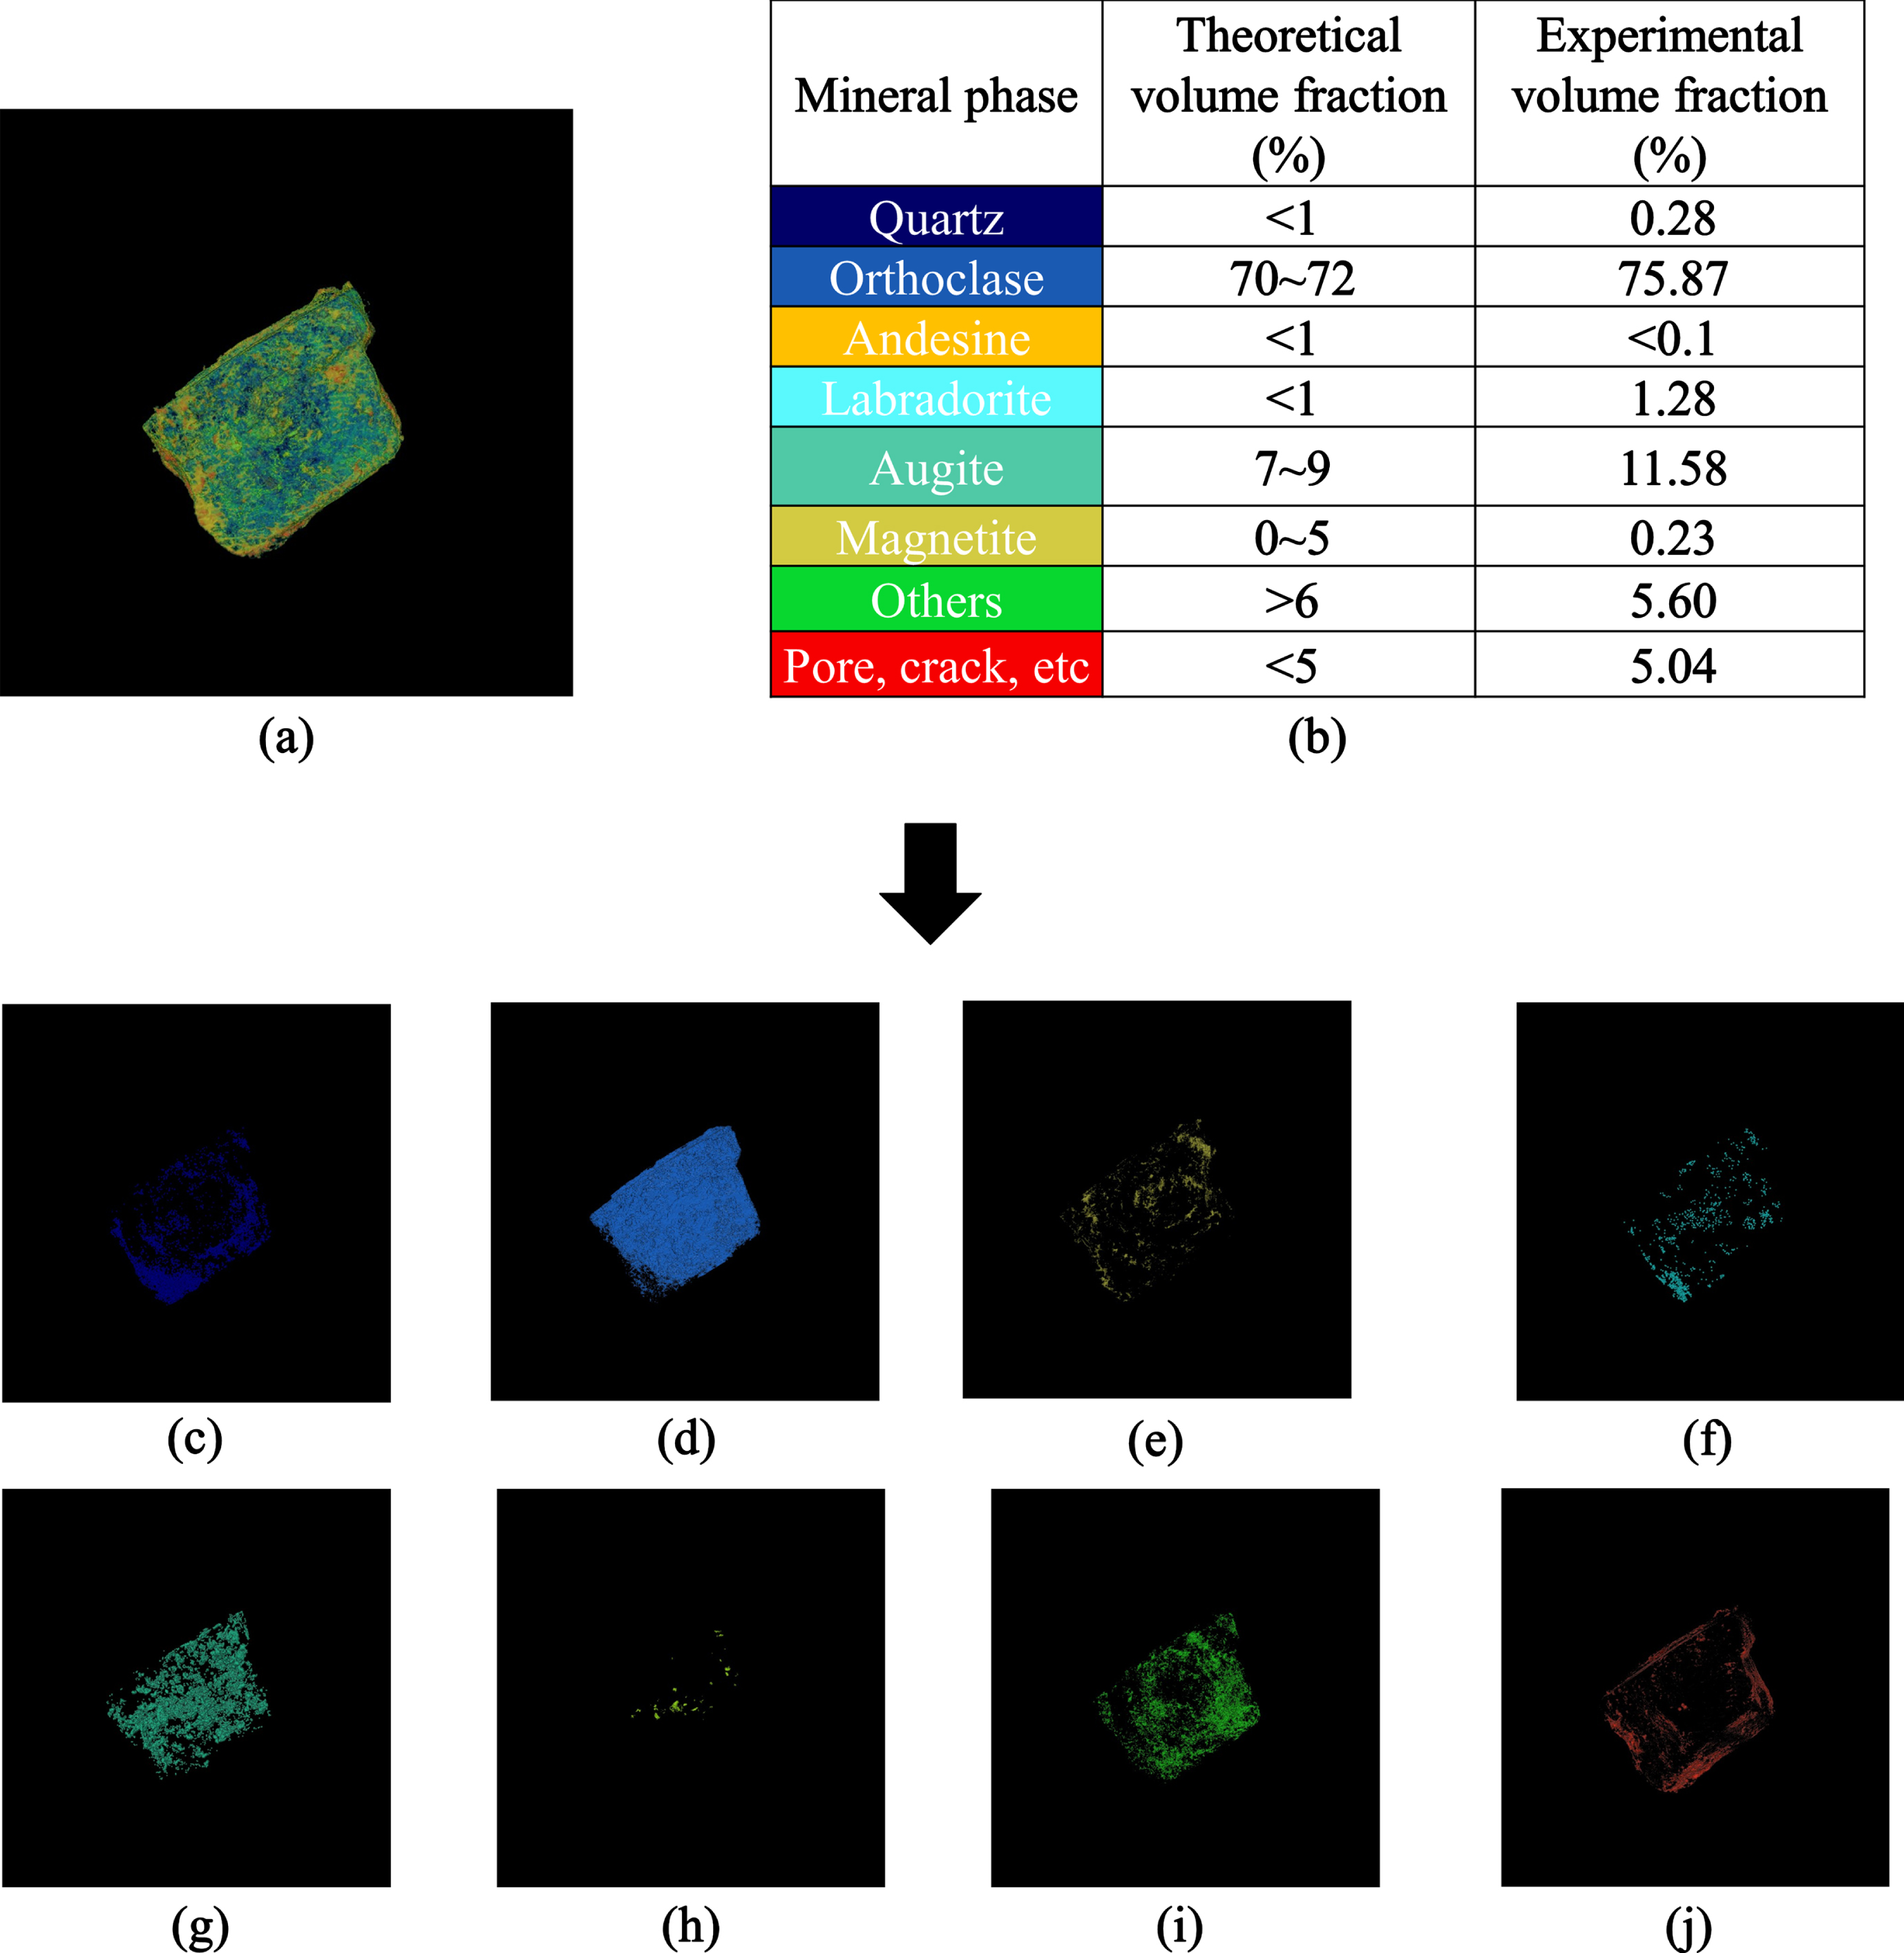
3D segmented result of igneous sample. (a) 3D segmented image (see Fig. 14 (b) for corresponding colors). (b) Volume fractions of the separated mineral phases. (c)-(j) Separated image of different phases: (c) quartz; (d) orthoclase; (e) andesine; (f) labradorite; (g) augite; (h) magnetite; (i) other phase; (j) pore and cracks.
The IIBMD method gives accurate quantitative information about ρ e and Z eff by automatically determining the optimal basis material and separates different mineral phases using a simple threshold technique. Compared with other methods [14–16], the IIBMD method does not require the calibration of large number of standard materials. In addition, the IIBMD method also attenuates the effects of beam hardening and performs well on dense samples.
Simulation and practical experimental results verify the potential of the IIBMD method for quantitative characterization of mineral phases. The fitting results of formula (9), formula (13), and formula (15) achieved high relevant coefficients, which indicates that the model functions proposed are accurate. In the simulation experiment, the errors of ρ e and Z eff between the experimental and theoretical values are less than 5%. The rock phantom image is accurately segmented into corresponding mineral phases. In the practical experiment, five minerals have a relative error of less than 5% between the experimental and theoretical value of ρ e and Z eff . However, a wider difference between the theoretical and experimental value of ρ e and Z eff appear in corundum. Several reasons can explain as follows.
First, the main reason is that the optimal basis material is not provided in the practical experiment (aluminum and calcium for Corundum). Second, the energy dependence of the decomposition coefficients also leads to errors. The IIBMD method is based on the premise that a1 and a2 in formula (1) are energy-independent. In practice, however, a1 and a2 vary with energy. Thus, the synthesized values of attenuation coefficients using the IBMD model are expected to suffer from energy-dependent systematic errors. A detailed analysis is shown in the literature [32]. Even so, the above problems can be solved by continuing to optimize two basis materials. The energy dependence of a1 and a2 has been proved to be neglected when suitable basis material is determined.
Moreover, the volume fractions of the artificial sample show a relative error of up to 19% (Table 5). Several reasons could explain the errors. First, gelatinous substance stuck to the surface of the fabricated sample (as shown by the red arrows in Fig. 13) caused misidentification. Therefore, the volume fractions of quartz and calcite are larger than expected. Second, natural minerals contain impurities and pores, which easily affect the segmentation results. For the above problems, optimizing the basis material library to obtain more accurate ρ e and Z eff or improving the segmentation algorithm may help.
In summary, IIBMD method demonstrates the potential in 3D quantitative characterization of the structure and components of geological samples. The current study is only a simple validation of IIBMD method. Our future work will devote to optimizing the basis material library and scanning energy to improve the quality of the IIBMD method for common minerals. In addition, an improved segmentation algorithm considering pore and micro porosity (pore whose size is smaller than XCT resolution) will also be included in future quantitative characterization procedures.
Footnotes
Acknowledgments
This work was support by the National Natural Science Foundation of China (NNSFC) [No. 61771328] and the National Key Research and Development Program of China [No. 2017YFB1103900].