
Abstract
OBJECTIVE:
To explore the application of quantitative computed tomography (CT) in analyses of lung changes in patients with rheumatoid arthritis (RA).
METHODS:
A total of 150 clinically diagnosed RA patients underwent chest CT and 150 matched non-smokers subjects with normal chest CT are enrolled. A CT software is applied to analyze CT obtained from both groups. The quantitative indices of emphysema are expressed as the percentage of lung area with attenuation < –950HU to the total lung volume (LAA–950%), and pulmonary fibrosis was expressed as the percentage of lung area with a attenuation of –200 to –700HU to the total lung volume (LAA–200––700%), quantitative indicators of pulmonary vascular include aortic diameter (AD), pulmonary artery diameter (PAD), the ratio of PAD to AD (PAD/AD ratio), the number of blood vessels (TNV), and the cross area of blood vessels (TAV). The receiver operating characteristic (ROC) curve is used to evaluate the ability of these indexes in identifying the changes in the lung in RA patients.
RESULTS:
Compared to the control group, the RA group has significantly lower TLV, larger AD, and smaller TNV and TAV (3921±1101 vs. 4490±1046, 33.26±4.20 vs. 32.95±3.76, 13.14±4.93 vs. 17.53±3.34, and 96.89±40.62 vs. 163.32±34.97, respectively, with all p < 0.001). Peripheral vascular indicator TAV has the better ability to identify lung changes in RA patients (area under ROC curve AUC = 0.894) than TNV (AUC = 0.780) or LAA–200 &sim–700% (AUC = 0.705).
CONCLUSION:
Quantitative CT can detect changes in lung density distribution and peripheral vascular injury in patients with RA and assess the severity.
Keywords
Introduction
Rheumatoid arthritis (RA) is a common connective tissue disease, with erosive arthritis as the main manifestation [1, 2]. RA- interstitial lung disease (ILD) is a common complication of RA, second only to cardiovascular complications. Prevalence varies from 6–30% due to different calculation methods, and patients may die from worsening ILD, better understanding of lung changes in RA patients can help early diagnosis and clinical intervention, and is critical to improving the prognosis [3–5]. ILD is a mostly diffuse disease, which is easy to identify and difficult to evaluate accurately. But assessing the extent and severity of the disease is necessary. High-resolution computed tomography (HRCT) is a common examination method for the diagnosis of lung diseases. It can more sensitively show mild lung changes in RA patients [6, 7].
Quantitative CT is a popular evaluation method based on HRCT and image data analysis. It can evaluate the changes of the lung by measuring the whole lung volume, calculate the volume of a specific attenuation range to distinguish and evaluate abnormal structures, and measure the diameter, area and thickness of the tracheal blood vessels to explore its subtle changes. It helps to improve the ability to diagnose and evaluate diseases in many aspects [8]. In this study, quantitative CT was used to (1) explore the pulmonary changes in RA patients, (2) screen effective evaluation indicators.
Materials and Methods
General data
This retrospective study was approved by the Ethics Committee, and patient consent was waived. A total of 150 patients with RA who met the 1987 American rheumatology diagnostic classification criteria or the new classification criteria developed by the American College of Rheumatology/European League Against Rheumatism in 2010 [9, 10] during June 2019–2021 were enrolled in this study. The inclusion criteria were as follows: (1) clinically confirmed RA patients; (2) complete HRCT images of the chest from the apex of the lung to the diaphragm at the bottom of the lung. The exclusion criteria were as follows: (1) incomplete clinical base data or CT images; (2) thoracic deformity and pleural effusion; (3) history of chest surgery affecting lung volume; (4) large solid lung lesions; and (5) acute exacerbation of chronic lung disease (COPD) and asthma. Moreover, 150 non-smokers without abnormal changes on chest CT comprised the control group, and the exclusion criteria for the control group were the same as those for the RA group.
Chest CT acquirement
GE Discovery 750HD was used to acquire chest CT images. Non-contrast-enhanced CT scans were performed in the supine position: head first and at the end of the deep inspiration period. The scan range was from the lung apex to the lung base, with an imaging matrix of 512×512, tube voltage of 120 kV, tube current of 200 mA, the pitch of 0.994 : 1. The scan layer thickness was set to 5.0 mm, and the image reconstruction layer thickness and reconstruction interval were set to 1.25 mm. The images were reconstructed using a standard kernel.
Subjective evaluation
The lung was divided into 5 lobes according to anatomical structure, each lobe was evaluated separately, the number of lobes with lung changes was recorded. All evaluations were independently performed by two diagnosing physicians, and when the results differed, a third senior physician judged them.
Quantitative data measurement
The images were uploaded to the “Digital Lung” (Dexin-FACT, Xi’an China) data analysis platform, and the whole lung was extracted by the adaptive boundary method to obtain the total lung volume (TLV), the percentage of lung area with attenuation < –950 HU to total lung volume (LAA–950%) to assess the extent of emphysema, and the histogram of lung attenuation distribution (Fig. 1), and the percentage of lung area with attenuation from –200 to –700 HU to the total lung volume (LAA–200––700%) was calculated as pulmonary fibrosis index [11]. The computer segment and reconstruct the pulmonary blood vessels by the direction of blood vessels and image features and generate the three-dimensional image of bronchial blood vessels. The bronchus with a diameter of 2 mm was selected from the lower lobes of both lungs to obtain the number and area of blood vessels in the visible area. The square visible area with sides of 80 mm (Fig. 2). The number of blood vessels (TNV) at and before bifurcation was 1. For vessels at an Angle to the plane of observation, the area of the vessels (TAV) is the mean of the reconstructed area of the part appearing in the plane. Then, the average number and area of blood vessels in the lower lobes of both lungs (TNV and TAV, respectively) were calculated. The aortic diameter (AD) and pulmonary artery diameter (PAD) were measured by two diagnosing physicians at the level of pulmonary artery bifurcation. The average value was taken as the result, and the ratio of the pulmonary aorta diameter to the artery diameter (PAD/AD ratio) was calculated.

Schematic diagram of quantitative CT analysis function. (1a) Methods for obtaining total lung volume. (1b) Location of attenuation < –950 HU distribution in the whole lung. (1c) Whole-lung attenuation histogram.
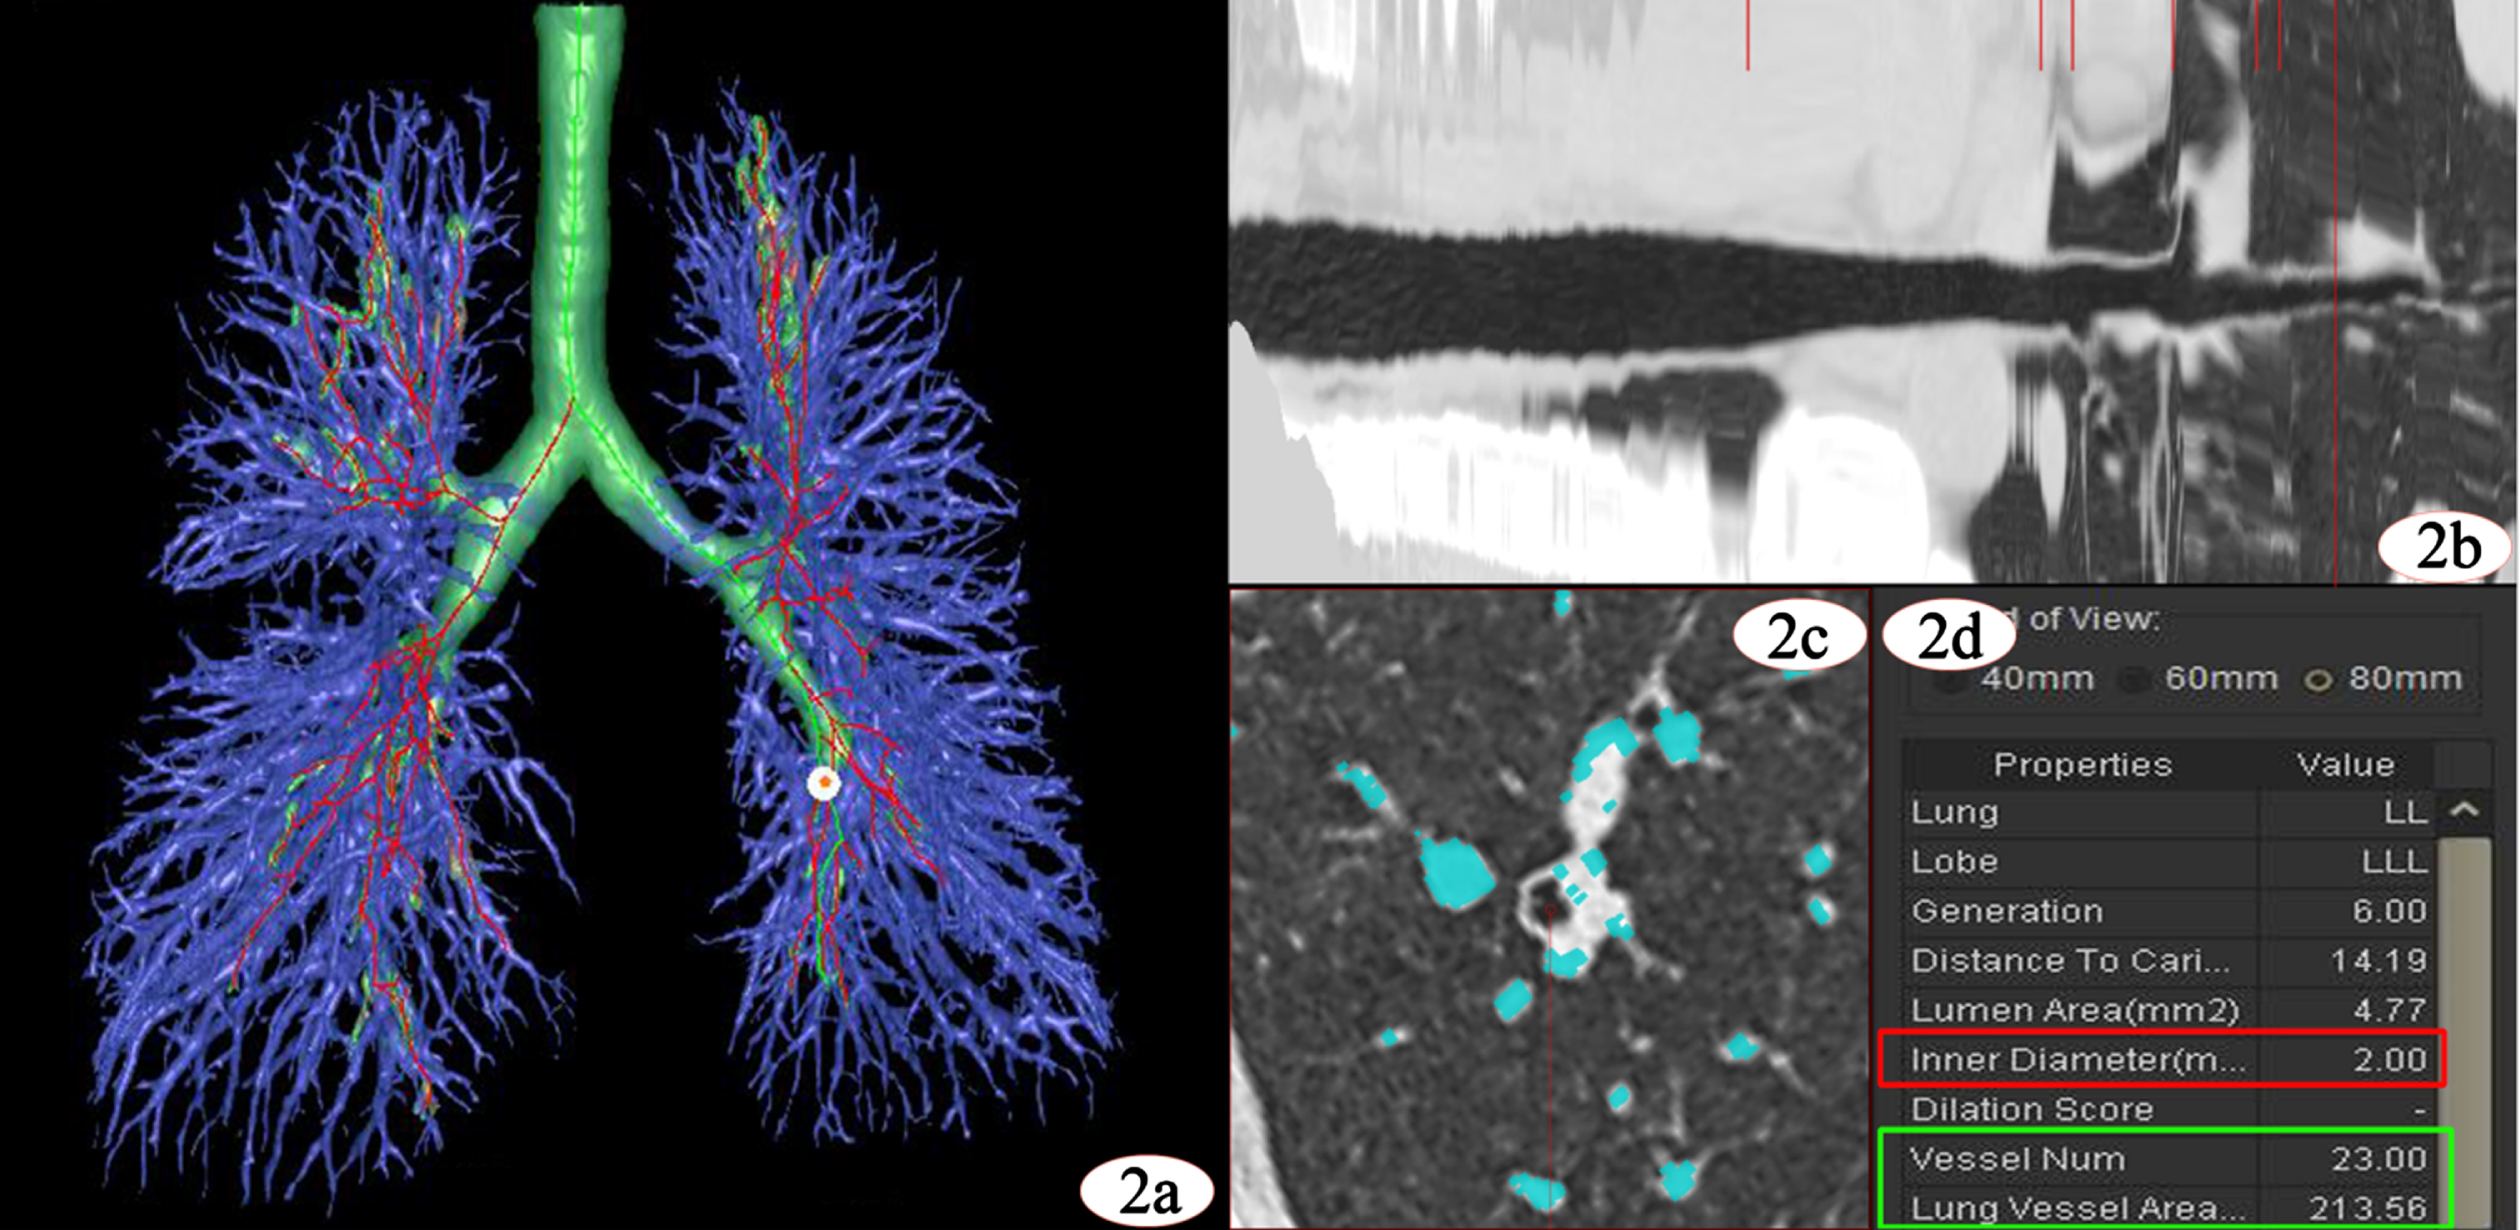
Peripheral vascular measurements and results. (2a) The segmented bronchial vascular tree shows the trachea in green, the pulmonary vessels in purple, and the white spots are the measurement locations of the peripheral vessels. (2b) A curved reconstruction of the selected bronchi. The long red line shows the position of the bronchi with a 2mm inner diameter. (2c) A square observation area with sides of 80mm, the peripheral blood vessels are displayed, and the blue part is the pulmonary blood vessels. (2d) Red box shows the diameter of the target small airway, and the green box shows the number and area of the specific peripheral blood vessels.
Statistical analysis was performed using SPSS 26.0 (version 26.0; SPSS, Chicago, IL, USA) and MedCalc (version 9.3.1 Med-Calc, Inc., Mariakerke, Belgiumand). The measured data were expressed as mean and standard deviations. The normality was tested using Shapiro–Wilk test for the measured data. Data conforming to normal distribution were analyzed using an independent sample t test, and data not conforming to normal distribution were analyzed using a non-parametric test. The computed p < 0.05 indicated a statistical difference between the two groups. The identification ability of the indicators was assessed by the receiver operating characteristic (ROC) curve analysis.
Results
General data
The RA patient groups enrolled in this study comprised 51 males and 99 females with a mean age of (54.69±10.94) years old, and the control group consisted of 58 males and 92 females with a mean age of (53.93±10.24) years old. No significant difference was observed in the ages between the two patient groups.
Subjective evaluation results
Subjective evaluation was performed only in the RA group, and the lesions in most cases were less than 2 lobes (n = 110, 73.3%) of these, 34 cases with no abnormal CT findings, the range of interstitial changes in 76 patients was 1 or 2 lobes. Besides, 27 cases with changes in 3 or 4 lobes, and all lobes were injury in 13 cases (Table 1).
Visual assessment results
Visual assessment results
*: The number of damaged lobes in control group is all n = 0.
The average values of TLV, PAD/AD ratio, TNV, and TAV in the RA group were smaller than those in the control group, and the average value of LAA–200––700% and PAD were significantly greater than that in the control group (p < 0.05) (Fig. 3). The LAA–950% and AD did not differ significantly between the two groups (p > 0.05) (Table 2).

Comparison of pulmonary fibrosis levels. (3a-b) Chest CT image and density histogram of patients in the control group. (3c-d) Chest CT image and attenuation histogram of patients in the RA group. (3e) Comparison of lung attenuation histogram between two patients.
Association between control and RA groups based on quantitative CT measurements
TLV: total lung volume; LAA–950% : percentage of lung area with attenuation < –950 HU to total lung volume; LAA–200––700% : percentage of lung area with attenuation from –200 to –700 HU to the total lung volume; AD: aorta diameter; PAD: pulmonary artery diameter; TNV: number of blood vessels; TAV: the cross area of blood vessels; PAD/AD ratio: the ratio of PAD to AD.
The ROC curve was used to evaluate the ability of each index and identify the lung change in RA (Table 3). The TAV was a good index (area under the curve (AUC) = 0.894, p < 0.001) to distinguish between two groups. The pulmonary fibrosis evaluation index LAA–200––700% (AUC = 0.705, p < 0.001) and vascular index TNV (AUC = 0.780, p < 0.001) also demonstrated the identification effect (Fig. 4).
Analysis of the diagnostic value of quantitative CT indexes
TLV: total lung volume; LAA950% : percentage of lung area with attenuation < –950HU to total lung volume; LAA–200––700% : percentage of lung area with attenuation from –200HU to –700HU to the total lung volume; AD: aorta diameter; PAD: pulmonary artery diameter; TNV: the number of blood vessels; TAV: the cross area of blood vessels; PAD/AD ratio: the ratio of PAD to AD. CI: confidence interval. AUC: area under the ROC curve.

ROC curve for distinguishing the RA and control groups. (4a) The AUC of pulmonary interstitial evaluation index LAA–200––700% is 0.705. (4b) The AUC for the number of blood vessels (TNV) is 0.780. (4c) The AUC of the cross area of blood vessels (TAV) is 0.894.
In the current study, quantitative CT was used to explore the lung changes in patients with RA. The results showed that the lung changes in RA patients are mainly manifested as pulmonary fibrosis and destruction of the surrounding small blood vessels. Quantitative CT is a critical tool for the diagnosis of lung changes and disease assessment in patients with RA.
The lung imaging types of RA-ILD are mostly usual interstitial pneumonia (UIP, 37%) and nonspecific interstitial pneumonia (NSIP, 30%), and the lesions are mainly distributed in the periphery and bottom of the lung [12–14]. The type and extent of injury may be related to the severity of the disease. Describing the main signs is a commonly used visual assessment method in clinical practice. However, the size and severity of the lesion is insufficient to describe only the signs. The reason why quantitative CT can assess the degree of pulmonary fibrosis is that interstitial lung diseases are mostly diffuse lesions, and changes in imaging signs are accompanied by changes in structure, which also means changes in the degree of radiation attenuation. The lung volume in the attenuation interval is calculated, which enables sensitive detection and quantification of lung changes. The lung volume in the attenuation interval is calculated, which enables sensitive detection and quantification of lung changes. Quantitative CT is objective and accurate in identifying and assessing pulmonary fibrosis in interstitial disease [15]. For different degrees of diffuse pulmonary fibrosis, the lung density histogram can distinguish the lung density interval corresponding to the fibrotic tissue and calculate the volume and percentage of the total lung volume [16, 17].
In this study, the CT image was quantified, and the pulmonary fibrosis index was defined as LAA–200––700%, which was used to evaluate the pulmonary interstitial changes in the RA patient group. The decrease in TLV may be due to the existence of different degrees of pulmonary fibrosis in RA patients. On the one hand, lobular destruction and scarring secondary to fibrosis reduces lung volume. On the other hand, interstitial fibrosis restricts the expansion of lung tissue and reduces the negative pressure in the chest, resulting in insufficient execution of deep inspiration commands during routine CT scans. In addition, because patients with pulmonary interstitial changes may have emphysema, we used LAA–950% to evaluate the condition in RA patients [18]. The results showed no statistical difference between the two groups of data. Which could be attributed to the inclusion of many patients with mild lung changes in this study.
Pulmonary vascular alterations are the potential manifestations of lung injury in RA, possibly due to repeatedly attacks of autoimmune inflammation on small blood vessels and surrounding connective tissue. Common extra-articular complications of rheumatoid arthritis include the cardiovascular system, but whether it affects small blood vessels is inconclusive. In addition, pulmonary interstitial fibrosis is mainly manifested as pulmonary ventilation dysfunction, the main influencing factors are the lung parenchyma and pulmonary blood vessels, and the carbon monoxide diffusion index in the pulmonary function test is reduced. Therefore, we paid attention to the pulmonary small blood vessels and quantified them. Studies have pointed out that chronic lung diseases are often accompanied by micro-vessels in the lungs stenosis, occlusion, and loss [19], while peripheral vascular alterations are further aggravated by damage to the endothelial cells of the vessel wall due to impaired pulmonary blood flow exchange, which produces hypoxemia [20].
Since pulmonary vessels travel with the bronchi and constitute the interstitial lung, the selection of peri-pulmonary respiratory fine bronchi can localize the peripheral vessels. Herein, we selected fine respiratory bronchi with a diameter of 2 mm in the lower lobes of both lungs to measure the number and area of peripheral vessels, calculated the bilateral average value and compare to the control group and concluded that the number and area of peripheral vessels were reduced, which was consistent with the pathological changes. The decrease in the area and number of microvascular lumen obstruct the pulmonary blood flow through the lungs, and the pressure in the pulmonary capillary bed increases, and the retrograde conduction to the pulmonary artery leads to increased pulmonary artery pressure; the final manifestation is increased pulmonary artery diameter [21]. Consistent with other studies, pulmonary vascular disease can cause pulmonary hypertension in nearly 20% of cases [22–24].
Pulmonary fibrosis index is calculated based on the lung density histogram for a specific range of lung volume, including all lung tissues. Consequently, the sensitivity is poor, but the specificity is strong. The pulmonary vascular index is also a specific and accurate measurement index with optimal distinguishing ability. Combining the two sets of indicators prevents the broad range of the pulmonary fibrosis indicators and avoids the limited range of pulmonary vascular indicators. Therefore, the combined model has a satisfactory distinguishing power.
In this study, we analyzed and found some imaging features of lung changes in RA patients using quantitative CT, but with certain limitations. First, we only analyzed the changes of lung CT imaging, but did not research the functional changes in combination with pulmonary function tests. The main reason is the retrospective study, the data is not complete enough. The RA group included many cases without imaging changes or clinical symptoms, and the guidelines state that pulmonary function testing is not necessary in these patients [25, 26]. However, it is necessary to study the relationship between pulmonary function changes and imaging changes, so this is also a follow-up research direction. Second, we only analyzed the CT images of the inspiratory phase and did not include the expiratory phase. The main reason is that dual-phase scanning has not yet become the main CT examination method, and previous study reported an acceptable variability (< 10%) and a good repeatability in patients with restrictive lung diseases. Third, we only conducted a cross-sectional study of a single patient image. If a longitudinal study can be carried out, the clinical follow-up significance of quantitative indicators can be better interpreted.
Footnotes
Acknowledgments
This research work is supported by the Subject Innovation Team of Shaanxi University of Chinese Medicine (#2019-QN09) and Key Industry Innovation Chain of Shaanxi Provincial Department of Science and Technology (#2021ZDLSF04-10).