
Abstract
BACKGROUND:
Inverse Compton scattering (ICS) source can produce quasi-monoenergetic micro-focus X-rays ranging from keV to MeV level, with potential applications in the field of high-resolution computed tomography (CT) imaging. ICS source has an energy-angle correlated feature that lower photon energy is obtained at larger emission angle, thus different photon energies are inherently contained in each ICS pulse, which is especially advantageous for dual- or multi-energy CT imaging.
OBJECTIVE:
This study proposes a dual-energy micro-focus CT scheme based on the energy-angle correlation of ICS source and tests its function using numerical simulations.
METHODS:
In this scheme, high- and low-energy regions are chosen over the angular direction of each ICS pulse, and dual-energy projections of the object are obtained by an angularly-splicing scanning method. The field-of-view (FOV) of ICS source is extended simultaneously through this scanning method, thus the scale of the imaging system can be efficiently reduced. A dedicated dual-energy CT algorithm is developed to reconstruct the monoenergetic attenuation coefficients, electron density, and effective atomic number distributions of the object.
RESULTS:
A test object composed of different materials (carbon, aluminium, titanium, iron and copper) and line pairs with different widths (15/24/39/60 μm) is imaged by the proposed dual-energy CT scheme using numerical simulations, and high-fidelity monoenergetic attenuation coefficient, electron density, and effective atomic number distributions are obtained. All the line pairs are well identified, and the contrast ratio of the 15 μm lines is 22%, showing good accordance with the theoretical predictions.
CONCLUSIONS:
The proposed dual-energy CT scheme can reconstruct fine inner structures and material compositions of the object simultaneously, opening a new possibility for the application of ICS source in the field of non-destructive testing.
Keywords
Introduction
X-ray CT imaging is a powerful non-destructive testing tool with widespread applications in the field of biology, material science, medical diagnosis and so on [1–5]. The CT image quality is directly decided by the focal spot size, the bandwidth, and the photon energy of X-ray source. Specifically, higher imaging resolution can be obtained using smaller X-ray focal spot size; weaker beam hardening artifact can be achieved using narrower X-ray bandwidth; denser and larger object can be imaged using higher X-ray photon energy. In recent years, dual-energy micro-focus CT has attracted a lot of attention for the capability to inspect fine inner structures and material compositions of the object simultaneously [6–8]. However, current dual-energy micro-focus CT systems are mostly based on the X-ray tubes [9, 10], which typically have broad bandwidth with photon energy well below MeV [11], showing serious limitations in high-energy applications such as the non-destructive testing of dense object.
ICS source, generated by colliding energetic electron beams with intense laser pulses, can produce high-flux quasi-monoenergetic micro-focus X-rays with tuneable photon energy ranging from keV to MeV level [12–15], showing great advantages in high-resolution CT imaging [14–18]. The scale and cost of an ICS source usually depend on the electron accelerator. In the past decade, high-gradient electron accelerator especially the laser wakefield accelerator (LWFA) has made immense progress [19–23], which can produce MeV- to GeV-level high-quality (<1% FWHM energy spread, <1 mrad FWHM divergence, hundreds of pC charge) electron beams on a tabletop. Besides, kilohertz long-term-stable LWFA electron beams have been readily generated by several groups [24–26], which makes it an especially preferable accelerator for many practical applications. Therefore, ICS based on LWFA has both high performance and compact scale, showing great potential in widespread applications including the dual-energy micro-focus CT imaging [27–30].
In conventional dual-energy CT systems based on the ICS source, three ways are typically adopted to adjust the X-ray photon energy: tuning the electron energy [15], changing the scattering laser wavelength [17], or adjusting the collision angle between the electron and the scattering laser [31]. However, frequently adjusting the accelerator parameters and laser parameters during CT scanning will inevitably induce perturbations to the source parameters such as the spot size, divergence, spectrum, and photon yield, which will further degrade the imaging quality. Besides, ICS source typically has a limited FOV caused by the small X-ray divergence (typically of ∼1/γ, γ is the Lorenz factor of the electron beam) [13], thus a long drift distance is required to image a large object, which will greatly increase the system scale and weaken the photon density on the detector. ICS source has an energy-angle correlated feature that X-rays with lower photon energy are generated at larger emission angle [32], thus different photon energies are inherently contained in each ICS pulse, which provides a new possibility to achieve dual- or multi-energy CT imaging.
In this paper, a novel compact and robust dual-energy CT scheme based on the ICS source is proposed using its energy-angle correlation. In this scheme, each ICS X-ray pulse is partitioned into high- and low-energy regions over the emission angle, and the object is translated and rotated relative to the X-ray source to obtain several sub-projections in each scanning direction. Complete dual-energy projections of the object are then obtained by rearranging and splicing the high- or low-energy regions in the sub-projections. A corresponding dual-energy CT algorithm is developed to reconstruct the monoenergetic attenuation coefficient, electron density, and atomic number distributions of the object using the complete dual-energy projections [33–36]. The FOV in the CT scanning can also be efficiently extended by splicing several ICS pulses in each scanning direction, thus the scale of the imaging system can be greatly reduced. A series of numerical simulations are then performed to demonstrate this CT scheme.
This paper is organized as follows. The simulation codes and the input parameters are introduced in Sec. 2. The energy-angle correlation of ICS source is studied in Sec. 3. The CT scanning method and the projection data rearrangement are introduced in Sec. 4. The dual-energy CT reconstruction is described in Sec. 5, and the conclusions are talked in Sec. 6.
Simulation methods
ICS X-ray photons are generated by colliding energetic electron beams with intense laser pulses. The photon energy of ICS source can be expressed as [13]
To optimize the X-ray parameters and study the energy-angle correlation of ICS X-ray source, CAIN Monte Carlo simulation code is utilized in this paper [38]. CAIN is a stand-alone FORTRAN code simulating all possible combinations of electromagnetic interactions between colliding electron, positron, and laser photon beams, such as the ICS, pair creation, and electron-positron colliding. In CAIN code, the electron and laser beam input parameters, the physical processes, and the output information can all be flexibly set. In our simulation, the input parameters of the electron beam and the scattering laser pulse are listed in Table 1, where the electron beam parameters are the typical values generated by LWFA, and the scattering laser is set as an ideal Gaussian beam. The physical process in the simulation is set to be ICS, and the collision angle θ i is 180 degrees (head-on collision). It should be noted that macro-particles are used to simulate electrons to improve the computing efficiency in CAIN, and there are totally 3 × 10⁶ macro-particles set for 200 pC electrons in our simulation. To evaluate the beam quality of ICS X-rays, the six-dimensional phase space parameters and the photon energies of all of the generated X-ray photons are output. Figure 1(a), (b), (c) and (d) are the energy-angle distribution, focal spot, normalized photon density, and pulse duration of the generated ICS X-rays, showing that the on-axis average photon energy is 0.5 MeV with 17% FWHM bandwidth, the focal spot size is 1 μm FWHM, the pulse duration is 6.7 fs FWHM, the divergence is 4.2 mrad FWHM, and the photon yield is 9 × 10⁸ per shot. It can be seen that in the angular direction of ICS X-ray pulse, lower X-ray photon energy with lower photon density is obtained at larger emission angle, showing clearly the energy-angle correlated feature.
Input parameters of the electron beam and scattering laser pulse in CAIN simulation

The energy-angle distribution (a), focal spot (b), normalized photon density (c), and pulse duration (d) of the ICS X-rays generated using the electron beam and scattering laser pulse shown in Table 1. The black dashed curve in (a) is the ideal energy-angle distribution calculated by Equation (1), and the red solid curves in (b) are the line-outs the focal spot in the corresponding directions.
To demonstrate the proposed dual-energy CT scheme, a two-dimensional numerical simulation code based on MATLAB is developed to perform the CT scanning. Among the X-ray parameters mentioned above, the pulse duration has no influence on the proposed dual-energy CT scheme, thus only the energy-angle distribution, focal spot size, and photon density of the ICS source are set in our simulation code according to the CAIN simulation results. The physical interaction of X-ray with the object is represented by the attenuation coefficient downloaded from the official website of National Institute of Standards and Technology (NIST), which has considered all major effects such as the photoelectric effect, Compton scattering, electron pair effect, and Rayleigh scattering. Therefore, once the structure and material composition of the object is confirmed, a two-dimensional attenuation coefficient distribution of the object will be generated in the simulation code. The proposed dual-energy CT scheme has no specific requirements for the X-ray detector, thus a widely used intensity-accumulation detector (such as the flat panel detector) is adopted to get the X-ray projections in the simulation code, and the pixel can be flexibly set to any size. Specifically, the counts of each pixel are the accumulation of the intensities of all the X-rays (with different photon energies) collected by that pixel. To simplify the simulation, the detection efficiencies at different X-ray photon energies are all set to be 100%, and this setup has no influence on the CT imaging results. Then, once the CT scanning parameters (such as the magnification ratio, projection angles, and splicing methods) are entered in the simulation code, a series of transmission matrixes are generated to calculate the sinogram of the object. It should be noted that there is no noise and error introduced in above processes, thus certain level of Gaussian statistic noise is finally added in the sinogram according to the X-ray photon flux.
In Equation (1), it can be seen that the ICS X-ray photons are monoenergetic at certain emission angle θ, and the energy-angle correlation is evident that smaller photon energy Eph is obtained at larger θ. For real electron beams with certain divergence and energy spread colliding with real laser pulses with certain divergence and bandwidth, as shown in Fig. 1(a), the generated ICS X-rays will have certain bandwidth at given emission angle θ, and the energy-angle correlation can be weakened. Dual-energy CT typically prefers larger energy difference of the high- and low-energy X-rays to ensure better material identification, thus the ICS source should have stronger energy-angle correlation. Besides, narrower X-ray bandwidth of ICS source is also preferred in dual-energy CT because the spectrum is easier to be measured and fewer artifacts are induced in the imaging.
Energy-angle correlation for different electron energy spreads and electron divergences
Energy-angle correlation for different electron energy spreads and electron divergences
To study the bandwidth broadening and the energy-angle correlated feature of ICS source, five Monte Carlo simulations are performed by CAIN. Since the laser parameters are quite controllable and stable in practical experiments, the scattering laser parameters in these five simulations are kept the same as those in Table 1, and only the divergence and energy spread of electron beams are changed in these simulations (other electron parameters are the same as those in Table 1), as shown in Table 2. Nowadays, LWFA electron beams with <1 mrad FWHM divergence and <1% FWHM energy spread have been achieved [22, 23], thus the electron divergences are changed from 2 mrad to 10 mrad FWHM and the electron energy spread are changed from 2% to 100% in these simulations.
The parameters of the generated ICS X-rays in these five simulations are also shown in Table 2. It can be seen that the focal spot size (1 μm), pulse duration (6.7 fs), and the photon yields (9 × 10⁸ per pulse) of the ICS X-rays are the same, which are consistent with the theoretical predictions. In case i, ii and iii, it can be seen that the on-axis bandwidth of ICS X-rays are significantly extended as the electron energy spread increases, while the X-ray divergence is nearly irrelevant to the electron energy spread. In case i, iv and v, it can be seen that both the on-axis bandwidth and the divergence of ICS X-rays are extended as the electron divergence increases. Therefore, smaller bandwidth of ICS X-rays can be achieved by reducing both the electron energy spread and the electron divergence.
The energy-angle distributions and the normalized photon density distributions of the generated ICS X-rays in these simulation cases are shown in Fig. 2(a) and (b). To analyse the energy-angle correlation of the ICS X-rays, high- (marked by α) and low-energy (marked by β) regions with 1.5 mrad angular range are selected in the angular direction, as illustrated in Fig. 2(a) and (b), where the average photon densities in β-regions are all 20% of that in α-regions. The average X-ray spectra in α- and β-regions are plotted in Fig. 2(c), and the energy-angle correlation can be evaluated by the difference between the average photon energies (energy difference) of these two regions. The energy difference of the high- and low-energy X-rays as well as the on-axis X-ray bandwidth for different electron energy spread (case i, ii and iii in Fig. 2) and different electron divergence (case i, iv and v in Fig. 2) are shown in Fig. 3(a) and (b). It can be seen that the energy difference of α- and β-regions in the simulation case i, ii and iii are 0.2 MeV, 0.21 MeV and 0.41 MeV, showing that the energy-angle correlation can be gradually enhanced through increasing the electron energy spread. For simulation case i, iv and v, the energy difference of α- and β-regions are 0.2 MeV, 0.17 MeV and 0.11 MeV, showing that the energy-angle correlation is significantly weakened as the electron divergence increases. Therefore, to enhance the energy-angle correlation of ICS X-rays, the electron divergence should be especially optimized while there is no strict requirement for electron energy spread. According to the above discussions, the ICS source in simulation case i is adopted in the following dual-energy CT imaging due to its strong energy-angle correlation and relatively narrower bandwidth.
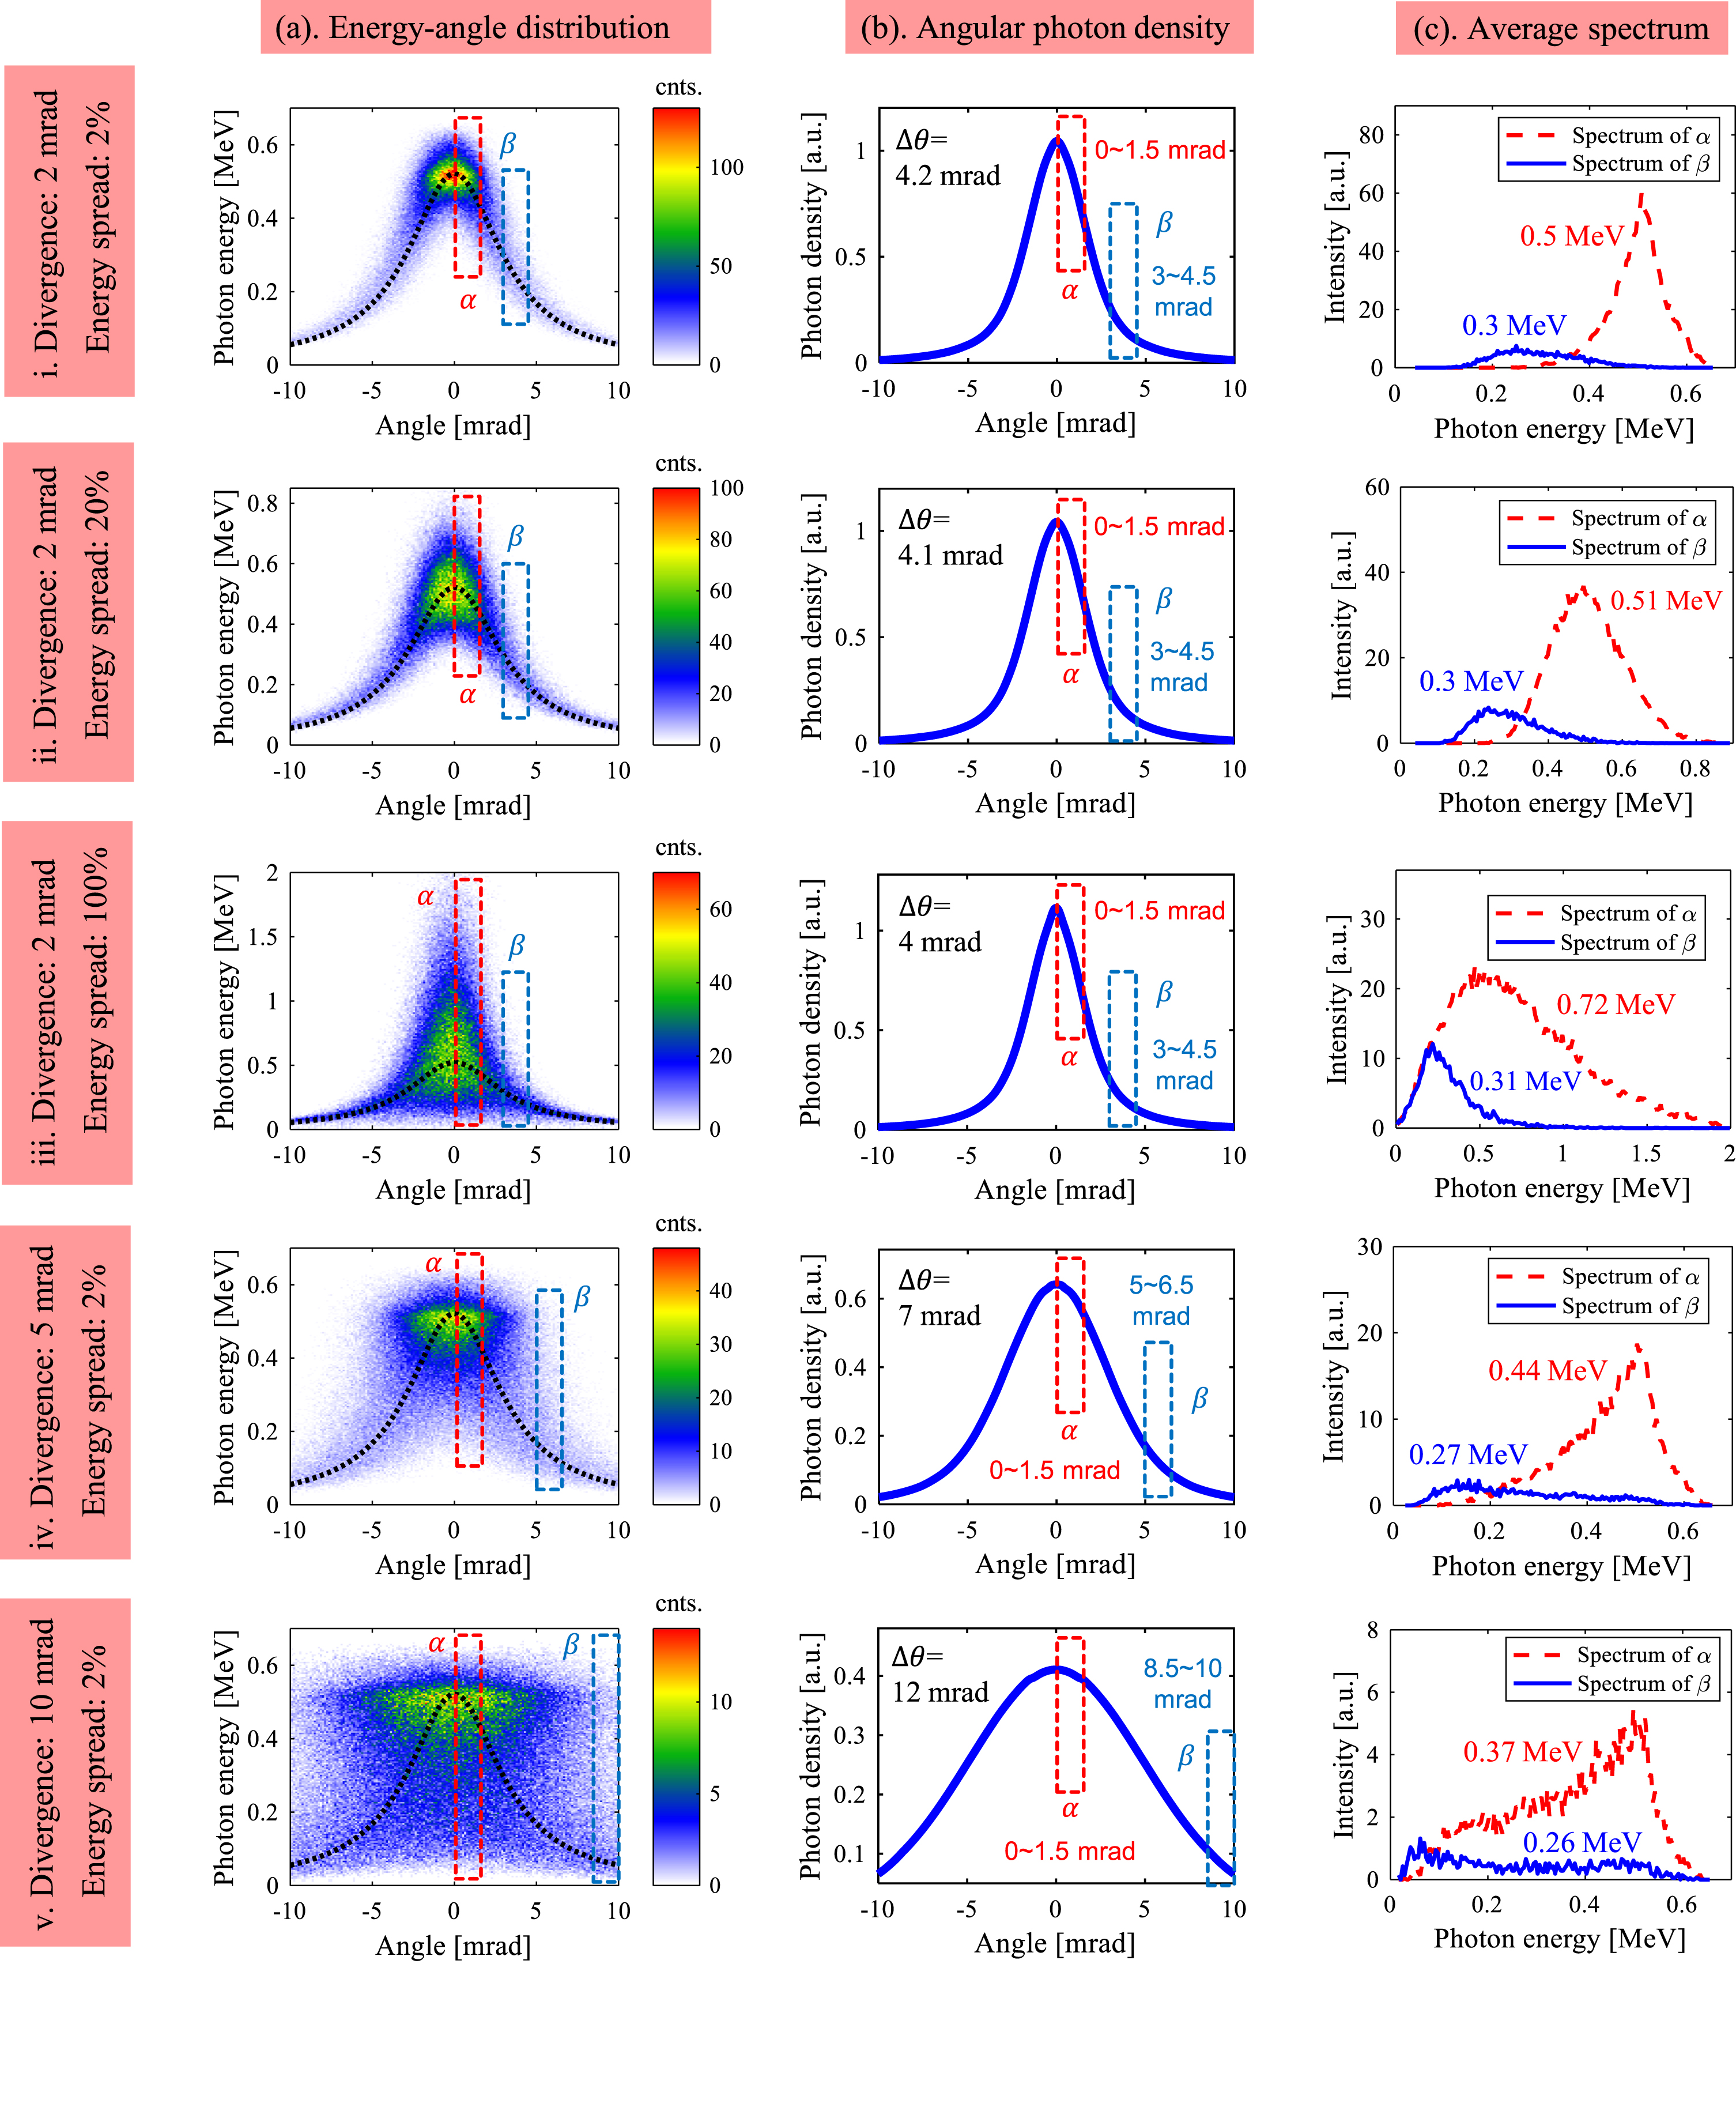
The energy-angle correlation of ICS source at different parameters. The energy-angle distributions and the normalized angular photon densities are shown in (a) and (b), where the red (α) and blue (β) dashed rectangles highlight the selected high- and low-energy regions. The average spectra of α- and β-region are plotted in (c). For each case, the FWHM divergence Δθ of the X-rays and the angular ranges of α- and β-regions are marked in (b), and the average energies of the high- and low-energy X-rays are marked in (c).

The energy difference of the high- and low-energy X-rays as well as the on-axis X-ray bandwidth for different electron energy spread (a) and different electron divergence (b).
To achieve the dual-energy micro-focus CT imaging based on the energy-angle correlation of ICS source, an angularly-splicing CT scanning method is proposed. In the scanning process, high- and low-energy regions are chosen in the angular direction for each ICS pulse according to the energy-angle correlation. The object is then translated and rotated relative to the source to obtain a series of sub-projections, and each sub-projection has high- and low-energy regions. It’s important that each high- or low-energy region in the sub-projections only scan part of the object, thus complete high- and low-energy projections of the object are obtained by splicing the high- and low-energy regions in these sub-projections together. In the rest reference frame of the object, the sub-projections are driven by ICS X-ray pulses with different pointing directions, thus the FOV of ICS X-ray pulses can be efficiently extended. To achieve <1 μm splicing error, the required translation and rotation resolution of the object are ~1 μm and ~10 μrad, which can be easily realized by current high precision motorized stages.
To show the details of the angularly-splicing CT scanning method, a two-dimensional numerical simulation is performed using the MATLAB code introduced in Sec. 2, and the layout of this scanning scheme (in the rest reference frame of the object) is sketched in Fig. 4(a). The X-ray detector is located 4.5 m downstream of the ICS source with pixel size of 45 μm. A 13-mm-diameter test object composed of 5 cylinders (materials of carbon, aluminium, titanium, iron and copper) and four sets of line pairs (line widths of 15/24/39/60 μm) is inserted in the X-ray path with 3 times geometric magnification. The imaging resolution can be estimated by the equivalent beam width BW as described in Equation (2), where a is the X-ray source size, d is the detector pixel size and M is the geometric magnification [39]. In our simulation case, the BW is calculated to be 15 μm, thus the imaging resolution is about 15 μm.

Schematic layout of the angularly-splicing CT scanning method in the rest reference frame of the object, where the rectangles filled with gradient red denotes the projection data. (a) Layout of the imaging system, where the red solid lines with arrows denote the ICS X-ray pulses, the corresponding sub-projections and sub-spectra are illustrated downstream with the same serial number, and the boundaries of the object are highlighted by two gray dashed lines. (b) Partitioning each of the ICS pulses and the corresponding sub-projections into three energy regions over the angular direction, where the high-energy region is marked with ‘C’, low-energy region is marked with ‘A’ and ‘E’, middle-energy region is marked with ‘B’ and ‘D’. The middle energy regions are not utilized in the proposed dual-energy CT scheme. In the high- (c) and low-energy (d) projections and spectra, the number marked in each region denotes the serial number of the sub-projection in (a) and the letter denotes the corresponding energy region.
The material identification capability of dual-energy CT imaging is better when the energy difference of the high- and low-energy X-rays is larger, but the low-energy X-rays should be energetic enough to pass through the object, otherwise artifacts will be induced by the truncated projection data [40]. Therefore, according to the energy-angle correlation of ICS source, there must be a trade-off between the above two effects when choosing the angular regions of the high- and low-energy X-rays. In this simulation case, ICS X-rays within –4.5 to 4.5 mrad are adopted in the CT scanning, where the high-energy region is –1.5 to 1.5 mrad (marked by ‘C’ in Fig. 4(b)) with the average photon energy of 0.5 MeV, and the low-energy region is –4.5 to –3 and 3 to 4.5 mrad (marked by ‘A’ and ‘E’ in Fig. 4(b)) with the average photon energy of 0.3 MeV. The test object is then scanned in 360 directions over 360 degrees, and in each scanning direction, five sub-projections driven by ICS pulses with 3 mrad angular intervals (in the rest reference frame of the object) are performed to scan different part of the object, as shown in Fig. 4(a). Here, the angular intervals of the adjacent ICS pulses are just determined by the angular range of the high-energy region. Complete dual-energy projections of the test object are obtained by rearranging the sub-projections, where the complete high-energy projection (Fig. 4(c)) is obtained by splicing the high-energy regions of the middle three sub-projections (No. 2–4 in Fig. 4(a)), and the complete low-energy projection (Fig. 4(d)) is obtained by splicing the low-energy regions of the five sub-projections. The corresponding X-ray spectra of the complete dual-energy projections are also shown in Fig. 4(c) and (d). It should be noted that the scanning parameters can be flexibly adjusted for different ICS source parameters.
In this simulation case, the average photon density of the high-energy region is ~5 times as high as that of the low-energy region. Since the statistical noise of the projection image is proportional to

High- (a) and low-energy (b) sinograms of the test object, both of which are the negative logarithm of the X-ray intensities on the detector.
It can be seen in Fig. 4(c) and (d) that the X-ray spectra of both the high- and low-energy projections still have weak energy-angle correlation, thus the attenuation coefficient distribution directly reconstructed using general CT algorithms will still have deviations [41]. Besides, the noise in the low-energy projections is relatively high, which may affect the reconstructed image quality. To address the above two problems, a dual-energy based virtual-monoenergetic CT algorithm [33–35, 42] is adopted to reconstruct the monoenergetic attenuation coefficient distribution, which has no deviations and the image quality is nearly free from the noise of low-energy projections. The electron density and atomic number distributions then can be reconstructed by the compressed sensing based dual-energy CT algorithms [43] with prior information of the monoenergetic projections and the monoenergetic attenuation coefficient distribution. The flow diagram of the reconstruction process is sketched in Fig. 6, and the following are the details.

Flow diagram of the reconstruction process.
In dual-energy CT imaging, the attenuation coefficient μ (E), the electron density ρe and the effective atomic number Zeff of certain material can be decomposed as follows [35, 36]
According to Equation (3), the dual-energy projections P
i
can be described as follows
Both B1 and B2 have relatively large noise δ
B
1
and δ
B
2
(decomposition noise) induced in the numerical calculating process. It should be noted that δ
B
1
and δ
B
2
are negatively correlated and can be well eliminated when |δ
B
2
/δ
B
1
| ≈ |μ1 (E)/μ2 (E) | [45]. Therefore, the virtual monoenergetic projection in Equation (7) will have a minimum noise at an optimal energy E = Eo described as follows [34, 42]
The attenuation coefficient distribution at Eo then can be reconstructed by general CT algorithms using the virtual monoenergetic projection.
For the ICS source, the noise of the low-energy projection is typically several times (~2.25 times in our simulation case) as large as that of the high-energy projection. According to Equation (8), we can choose the average photon energy of the high-energy X-rays EH as the optimal energy because μ1 (Eo)/μ2 (Eo) ≈ μ1,H/μ2,H, and the minimum noise of the virtual monoenergetic projection is δmin ≈ δH according to Equation (9). Therefore, it can be seen that only the noise in the high-energy projection matters to the virtual monoenergetic attenuation coefficient distribution, and the noise in the low-energy projection can be neglected.
In our simulation case, B1 and B2 of the test object are shown in Fig. 7(a) and (b), and the virtual monoenergetic projection of the test object at EH = 0.5 MeV is shown in Fig. 7(c). As shown in Fig. 6, a widely-used iterative CT algorithm, Projection On Convex Sets (POCS) CT algorithm [46], is then utilized to reconstruct the attenuation coefficient distribution, and the result is shown in Fig. 8(a). The attenuation coefficient distributions directly reconstructed by POCS algorithm using the high-energy projection P H and the projection driven by single ICS X-ray pulse (the No. 3 sub-projection in Fig. 4(a)) are also presented in Fig. 8(b) and (c), respectively. The line-outs of these three reconstructions along the diagonals are shown in Fig. 8(d). It can be seen that the virtual monoenergetic attenuation coefficient distribution has no deviations, while the other two attenuation coefficient distributions both have distinct reconstruction deviations. Besides, all these three attenuation coefficient distributions have nearly the same level of noise, agreeing well with the above analyses. The line-outs of the four sets of line pairs in Fig. 8(a) are shown in Fig. 8(e), where all these lines are well recognized (contrast ratio of 100% for 60 μm, 94% for 39 μm, 60% for 24 μm and 22% for 15 μm), in good accordance with the theoretical prediction.

B1 (a), B2 (b) and the virtual monoenergetic projection at EH (c).

Reconstructions of the attenuation coefficient distribution using the virtual monoenergetic projection at EH (a), the high-energy projection (b) and the No. 3 sub-projection (c). The display window is set to [0 1]. (d) The line-outs of the three reconstructions along the diagonals. (e) Line-outs of the four line-pairs in (a).
According to Equation (4), the electron density projection of the object can be obtained by P ρe = B1 ρe1 + B2 ρe2. Since ρe1/ρe2 is typically not equal to μ1 (EH)/μ2 (EH), the decomposition noise δ B 1 and δ B 2 can be partially eliminated and the electron density projection still has some residual decomposition noise. As shown in Fig. 6, to further suppress the decomposition noise, the prior image constrained compressed sensing (PICCS) algorithm [43] is adopted to reconstruct the electron density distribution ρe with a prior image of the monoenergetic attenuation coefficient distribution. The reconstructed electron density distribution is shown in Fig. 9(a), and the line-outs of different materials are plotted in Fig. 9(d), agreeing well with the ideal values.

The reconstructions of the electron density and the atomic number distributions. (a) The electron density distribution within the display window of [0 4.5]. (b) The line-outs of B2 along the white dashed line in Fig. 7(b) before and after being filtered by the NLM algorithm. (c) The effective atomic number distribution within the display window of [0 32]. The line-outs of the reconstructed electron density (d) and the effective atomic number distribution (e) for different materials along the red dashed lines in (a) and (c), respectively.
It can be seen in Equation (5) that the effective atomic number distribution of the object can be calculated using b1 and b2. However, b1 and b2 are reconstructed by B1 and B2, and both of them have large noise caused by the decomposition noise δ
B
1
and δ
B
2
, which will badly degrade the image quality of the atomic number distribution. To reduce the reconstruction noise of the atomic number distribution, Equation (5) is rewritten as the following form using the electron density distribution ρe obtained above
In Equation (10), only b2 is needed to calculate the effective atomic number distribution and the noise in b1 can be neglected. As shown in Fig. 6, to reduce the decomposition noise δ B 2 , B2 is filtered by the Non-Local Means (NLM) algorithm [47] with a prior image of the virtual monoenergetic projection, Fig. 9(b) is the line-outs of B2 along the white dashed line in Fig. 7(b) before and after being filtered by the NLM algorithm, showing that the decomposition noise δ B 2 is greatly reduced while the structure information is well preserved. As shown in Fig. 6, the distribution of b2 is then reconstructed by the PICCS algorithm using the denoised B2 with a prior image of the monoenergetic attenuation coefficient distribution. The effective atomic number distribution is finally calculated using Equation (10), as shown in Fig. 9(c). The line-outs of the effective atomic numbers in the reconstructed image are illustrated in Fig. 9(e), showing good accordance with the ideal values. Caused by the residual decomposition noise δ B 2 and the metal artefacts [40], the reconstruction noise is relatively large for the materials with lower effective atomic number, which can be further optimized in future research.
ICS X-ray source has an energy-angle correlated feature that X-rays with lower photon energy are generated at larger emission angle, which enables different photon energy inherently contained in each ICS pulse, showing great advantages in dual- or multi-energy CT imaging. In this paper, a series of Monte Carlo simulations are firstly performed to show that the energy-angle correlation can be enhanced by optimizing the electron divergence. A novel compact and robust dual-energy micro-focus CT scheme based on the energy-angle correlation of ICS source is then proposed and demonstrated by numerical simulations. In this CT scheme, high- and low-energy regions are chosen over the angular direction of each ICS pulse, and dual-energy projections of the object are obtained by an angularly-splicing CT scanning method. The FOV of the ICS source is efficiently extended by this scanning method and the scale of the imaging system is greatly reduced. A dedicated dual-energy CT algorithm is developed to get high-fidelity reconstructions of the monoenergetic attenuation coefficient, the electron density and the effective atomic number distributions. A numerical simulation is performed to scan a test object using the proposed dual-energy micro-focus CT scheme, and high-resolution material-identified reconstructions of the test object are obtained, demonstrating the feasibility of this CT scheme. The spatial resolution of this CT scheme can be further improved to micron-level by optimizing the geometric magnification ratio of the imaging system or utilizing an X-ray detector with higher resolution.
Currently, based on a 10 hertz ICS X-ray source, the entire scanning duration of the proposed dual-energy CT is about several hours, which can be greatly reduced in the near future because the repetition rate of ICS X-ray source can potentially be optimized to kilohertz [24, 25]. The performance of our dual-energy CT is closed related to the stability and repeatability of the X-ray parameters, which can be greatly improved by multi-shots ICS pulses accumulation in the CT scanning. Moreover, long-term stable ICS X-rays can potentially be achieved in the near future [26], so that the X-ray parameters will be much more stable and repeatable. Fundamentally, the proposed dual-energy CT algorithm is similar with the traditional dual-energy CT that is based on the bremsstrahlung X-ray source (typically with broad bandwidth and large divergence), thus our dual-energy CT scheme do have relatively high tolerance for the X-ray bandwidth and divergence. Since the X-ray photon energy of ICS source can be readily tuned from keV to MeV, objects of light or dense materials can all be well imaged by our dual-energy CT scheme. Besides, the proposed dual-energy CT scheme can also be used in the ICS source based on a traditional accelerator.
Footnotes
Acknowledgments
The authors thank Prof. Yongshun Xiao and Prof. Liang Li for a fruitful discussion of the CT algorithm.
Funding
This work was supported by the National Natural Science Foundation of China (Grants No. 11991071, No. 11991073) and the National Science and Technology Major Project (Grant No. 2019-VII-0019-0161).