
Abstract
BACKGROUND:
The study aimed to investigate anatomical changes in the neck region and evaluate their impact on dose distribution in patients with nasopharyngeal carcinoma (NPC) undergoing intensity modulated radiation therapy (IMRT). Additionally, the study sought to determine the optimal time for replanning during the course of treatment.
METHODS:
Twenty patients diagnosed with NPC underwent IMRT, with weekly pretreatment kV fan beam computed tomography (FBCT) scans in the treatment room. Metastasized lymph nodes in the neck region and organs at risk (OARs) were redelineation using the images from the FBCT scans. Subsequently, the original treatment plan (PLAN0) was replicated to each FBCT scan to generate new plans labeled as PLAN 1–6. The dose-volume histograms (DVH) of the new plans and the original plan were compared. One-way repeated measure ANOVA was utilized to establish threshold(s) at various time points. The presence of such threshold(s) would signify significant change(s), suggesting the need for replanning.
RESULTS:
Progressive volume reductions were observed over time in the neck region, the gross target volume for metastatic lymph nodes (GTVnd), as well as the submandibular glands and parotids. Compared to PLAN0, the mean dose (Dmean) of GTVnd-L significantly increased in PLAN5, while the minimum dose covering 95% of the volume (D95%) of PGTVnd-L showed a significant decrease from PLAN3 to PLAN6. Similarly, the Dmean of GTVnd-R significantly increased from PLAN4 to PLAN6, whereas the D95% of PGTVnd-R exhibited a significant decrease during the same period. Furthermore, the dose of bilateral parotid glands, bilateral submandibular glands, brainstem and spinal cord was gradually increased in the middle and late period of treatment.
CONCLUSION:
Significant anatomical and dosimetric changes were noted in both the target volumes and OARs. Considering the thresholds identified, it is imperative to undertake replanning at approximately 20 fractions. This measure ensures the delivery of adequate doses to target volumes while mitigating the risk of overdosing on OARs.
Introduction
Nasopharyngeal carcinoma (NPC) stands as one of the most prevalent tumors in southern China, notably in Guangdong Province. Intensity-modulated radiotherapy (IMRT) has emerged as the standard treatment modality for NPC, offering improved tumor control and reduced toxicity. The 5-year overall survival (OS) rate for NPC patients has now exceeded 84%, with the 5-year OS rate surpassing 95% for early-stage NPC [1].
As radiotherapy progresses, certain patients may experience nutritional intake disorders due to treatment side effects, leading to noticeable anatomical changes within 6–7 weeks from the start of radiotherapy. These changes include significant regression of primary tumors, metastatic lymph nodes, parotid glands, submandibular glands, and other tissues or organs [2, 3]. Such anatomical variations can cause spatial deviations in target volumes and surrounding organs at risk (OARs), resulting in discrepancies between the actual irradiated dose and the prescribed dose, significant dosimetric variances, and a heightened risk of tumor uncontrollability [4, 5].
Several studies have investigated the dosimetric effects of anatomical changes in NPC patients [6, 7]. However, most of these studies relied on cone-beam computed tomography (CBCT) images acquired before treatment to delineate target volumes and OARs. Despite its widespread use, CBCT presents limitations such as low image quality, insufficient field of view, and inaccurate conversion of CT values to electron density for dose calculation, rendering it unsuitable for direct dose calculations. Hence, more precise and reliable techniques are warranted to assess the dosimetric effects of anatomical changes in radiation therapy for NPC.
In this study, the URT-linac 506c linear accelerator was utilized to obtain real-time fan beam computed tomography (FBCT) images prior to treatment. FBCT offers superior image quality and a wider imaging range, rendering it directly suitable for dose calculation. FBCT was leveraged in this research to devise a new treatment plan, with retrospective dosimetry employed to evaluate the dosimetric effects of anatomical changes in the neck on target volumes and OARs in NPC patients’ post-treatment.
Materials and methods
Patient characteristics
In this study, twenty patients diagnosed with NPC were enrolled between October 2021 and October 2022, undergoing weekly FBCT scans during IMRT treatment at the Sun Yat-sen University Cancer Center. The study cohort comprised 17 males and 3 females, with ages ranging from 28 to 74 years and a median age of 46 years. All patients underwent nasopharyngeal biopsy, confirming undifferentiated non-keratinizing carcinoma of the nasopharynx with metastatic lymph nodes and no distant metastasis.
According to the 7th edition of the International Union Against Cancer/American Joint Committee on Cancer (UICC/AJCC) staging criteria, the distribution of primary tumor stages was as follows: 2 cases of T1, 2 cases of T2, 9 cases of T3, and 7 cases of T4. Additionally, clinical stage distribution was as follows: 2 cases of stage II, 7 cases of stage III, and 11 cases of stage IVA. Among the patients, 6 exhibited left lymph node involvement, 1 had right lymph node involvement, and 13 presented with bilateral lymph node involvement (Table 1).
Patient characteristics
Patient characteristics
Abbreviations: KPS: Karnofsky Performance Status.
The patient was positioned in a supine position and securely immobilized using polyurethane foam, supplemented with a thermoplastic mask covering the head and shoulders. Computed tomographic simulation (CTsim) was conducted utilizing a Philips Big Bore CT machine (Philips, Netherlands), with scanning spanning from the upper edge of the frontal sinus to 2 cm below the head of the clavicle. The CT imaging utilized a layer thickness of 3 mm.
Target delineation and dose prescription
Following the scan, the physician delineated the target volumes and OARs on the workstation (United Image, Shanghai, China). Target volumes and OARs were determined according to the International Commission on Radiation Units and Measurements Reports 50 and 62 [8]. Specifically, the gross target volume of the nasopharynx (GTVnx) represented the primary tumor, while the gross target volume of metastatic lymph nodes was defined as GTVnd. The high-risk clinical tumor volume (CTV1) encompassed GTVnx plus a 5 to 10 mm margin and the entire nasopharynx. The low-risk CTV (CTV2) included CTV1 plus a 5 to 10 mm margin, extending to the bilateral cervical selective lymph drainage areas (levels II, III, and V). Additionally, GTVnx, GTVnd, CTV1, and CTV2 were expanded by 3 mm to generate the planning target volume (PTV) of PGTVnx, PGTVnd, PCTV1, and PCTV2, respectively (Fig. 1).

Axial, sagittal and coronal simulated images of GTVnx (red line), CTV1 (pink line), CTV2 (blue line), GTVnd-L (orange line) and GTVnd-R (green line).
The prescribed dose consisted of 70 Gy administered at 2.12 Gy per fraction to PGTVnx and PGTVnd, 60 Gy delivered at 1.82 Gy per fraction to PCTV1, and 54 Gy administered at 1.63 Gy per fraction to PCTV2, all delivered over the course of 33 fractions.
The normal tissues and organs considered in the treatment plan included the mandible, temporomandibular joint, parotid gland, spinal cord, brainstem, optic chiasm, optic nerve, eyeball, lens, pituitary gland, and oral cavity. Specific dose constraints for these OARs were established as follows: a maximum dose (Dmax) of the brainstem≤54 Gy; a Dmax of the spinal cord≤45 Gy; a mean dose (Dmean) of the parotid gland less than 26 Gy; and a volume receiving 30 Gy (V30) less than 50%. Additional constraints included a Dmax of≤8 Gy for the lens; a Dmax of≤54 Gy for the optic nerve and optic chiasm; a Dmax of≤60 Gy for the temporomandibular joint; a Dmax of≤54 Gy for the temporal lobe and pituitary gland; and a Dmax of≤40 Gy for the oral cavity.
After target delineation, dose prescription, and establishing dose constraints, the physicist proceeded to design and optimize the treatment plan using the Treatment Planning System (TPS) provided by United Image in Shanghai, China. A dose-volume histogram (DVH) was employed to assess the dose distribution in both target volumes and OARs. All patients underwent treatment utilizing a 0° to 360° double-arc volumetric modulated arc therapy (VMAT) plan.
FBCT image acquisition and recalculation
The URT-linac 506c linear accelerator underwent weekly FBCT scans to correct setup errors. Subsequently, investigators utilized FBCT images sent to the TPS to iteratively adjust the target volumes and OARs layer by layer (Fig. 2). The relevant parameters of the initial plan were replicated to maintain consistency in beam angle, beam monitor unit, and segment number. Building upon these adjustments, six new plans (Plans 1–6) were generated with modified dosages. Subsequently, the original plan and the new plans were compared to evaluate volume changes and dose distribution in the GTVnd and OARs, including the brainstem, spinal cord, parotid and submandibular glands.

Changes of GTVnd in FBCT images. Original GTVnd-L, green line; Original GTVnd-R, orange line; Recontoured GTVnd-L and recontoured GTVnd-R, red line.
The CTsim images and all six FBCT images of each patient were transmitted to the TPS. Subsequently, for each patient, the contour of the neck was delineated from the level of the odontoid process to the level of the clavicular head, denoted as NeckCT, Neck1, Neck2...Neck6, as illustrated in Fig. 3.
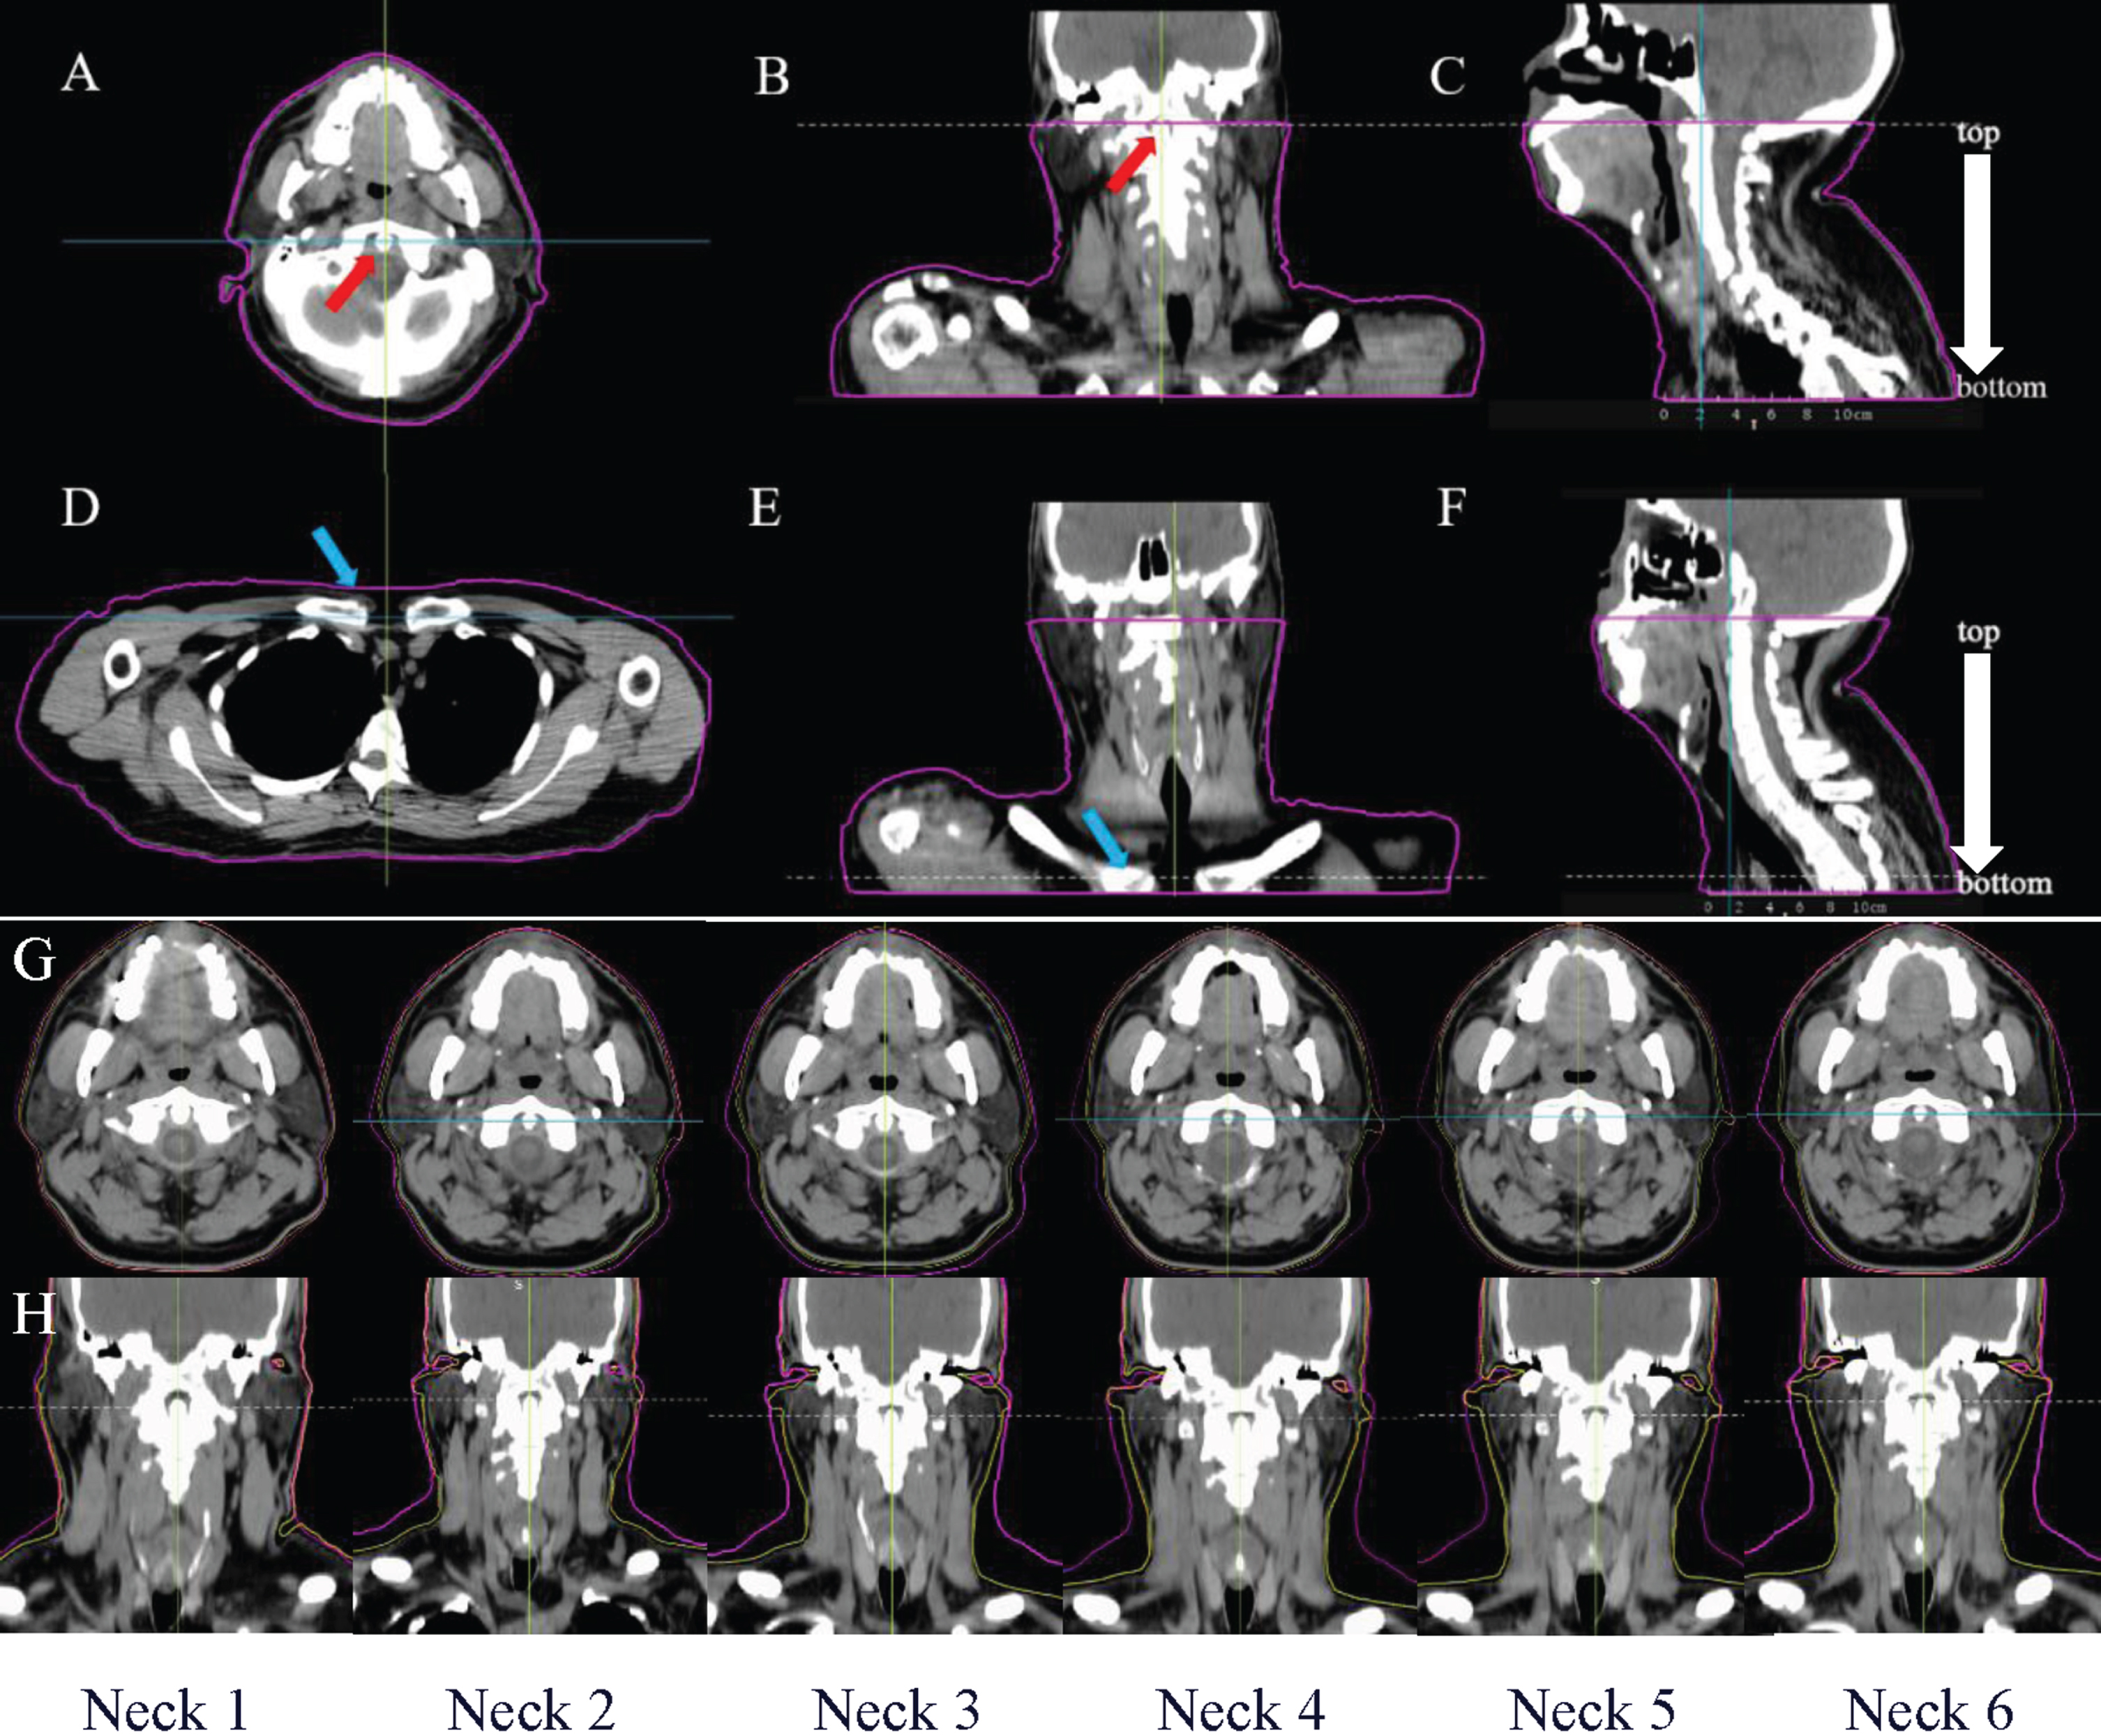
The volume of neck acquisition. The area outlined in pink is the neck volume area included in the dose calculation. Axial (A), sagittal (B) and coronal (C) images of odontoid process (red arrow) layer. Axial (D), sagittal (E) and coronal (F) images of clavicle head (blue arrow) layer. (G& H) Six FBCT images with neck contour named Neck1, Neck2 ... Neck6 were shown. (neck contour in CTsim: pink line; neck contour in FBCT: yellow line).
The TPS calculated and recorded the volumes of the neck contour (Neck), bilateral GTVnd (GTVnd-L and GTVnd-R), bilateral parotid glands (Parotid-L and Parotid-R), and bilateral submandibular glands (Sub-L and Sub-R).
Additionally, parameters including the mean Dmax, Dmean, dose received by 1% of the volume (D1%), dose received by 95% of the volume (D95%), V26, and V30 of GTVnd or various OARs were recorded and subsequently compared.
During volumetric and dosimetric analysis, any parameters exhibiting progressive changes were - considered for establishing the Adaptive Radiation Therapy (ART) strategy in cases of NPC. One -way repeated measure analysis of variance (ANOVA) was utilized to identify statistically significant anatomic changes (thresholds) at various time points throughout the treatment course, indicating the need for replanning. For example, if significant anatomical or dosimetric alterations were observed between the first plan (Plan 1) and the initial plan (Plan 0), the time corresponding to the first plan (Plan 1) was designated as the initial reference point for replanning. This iterative process was then repeated to identify subsequent reference points. By comprehensively evaluating the performance metrics of all parameters within the treatment plan and summarizing the frequency of replanning events, the optimal time point for effective replanning could be determined.
Statistical analysis
The mean percentage of volume change relative to CTsim was calculated as (volume in CTsim - volume in FBCTi) / volume in CTsim; The mean percentage of volume change relative to previous CTsim or FBCT was calculated as (volume in FBCTi-1 - volume in FBCTi)/ volume in FBCTi-1, i = 1, 2, 3, 4,5 and 6.
The data were analyzed using GraphPad Prism 8.0 software. If the data were normally distributed, single-factor analysis of variance (one-way ANOVA) was used, and the results were reported as mean±standard deviation. If the data were not normally distributed, Friedman’s rank test was used, and the results were reported as median (interquartile range). If statistically significant, which indicates that the entire cohort was significantly different, then dose between each plan with the initial plan was further compared. A significance level of P < 0.05 was considered statistically significant.
Results
Volumetric analysis
Compared to CTsim, the volume reductions observed in the neck, GTVnd-L, GTVnd-R, Parotid-L, Parotid-R, Sub-L, and Sub-R were 6.37%, 21.74%, 18.91%, 4.84%, 14.20%,1.26%, and 0.72%, respectively, in the first fraction. Over the course of 26 fractions, these volumes exhibited total reductions of 17.26%, 45.75%, 35.40%, 35.66%, 43.51%, 25.98%, and 26.02%, respectively (Table 2). Notably, the neck volume showed a progressive decrease throughout the treatment, resulting in a significant drop by the end of the treatment period (Fig. 3).
Mean percentage of volume change relative to CTsim
Mean percentage of volume change relative to CTsim
Mean percentage of volume change was calculated as (volume in CTsim - volume in FBCTi)/ volume in CTsim, i = 1, 2, 3, 4,5 and 6. Abbreviations: L = left; R = right; Sub = submandibular gland.
The degree of reduction remained relatively consistent in the following six weeks. Specifically, in the 16th fraction, the volume of GTVnd-L and GTVnd-R decreased by 17.42% and 13.09% compared to the 11th fraction, respectively. Additionally, both Parotid-L and Parotid-R exhibited reductions of 9.81% and 10.15%, respectively, after two weeks of treatment (11th fraction) compared to the previous week (6th fraction). Furthermore, the volume of Sub-L and Sub-R decreased by 9.2% in the 6th fraction compared to the 1st fraction, and by 9.26% in the 11th fraction compared to the 6th fraction (Table 3).
Mean percentage of volume change relative to previous CTsim or FBCT
Mean percentage of volume change was calculated as (volume in FBCT i–1 - volume in FBCTi)/ volume in FBCTi–1, i = 1, 2, 3, 4,5 and 6. Abbreviations: L = left; R = right; Sub = submandibular gland.
The one-way ANOVA analysis revealed significant differences in most dosimetric changes during the transition from PLAN0 to PLAN6. Upon further comparison with PLAN0 for parameters exhibiting significant dosimetric changes, it was observed that the Dmean of GTVnd-L significantly increased in PLAN5, while the 95% of PGTVnd-L showed a significant decrease from PLAN3 to PLAN6. Similarly, the Dmean of GTVnd-R significantly increased from PLAN4 to PLAN6, whereas the D95% of PGTVnd-R exhibited a significant decrease from PLAN3 to PLAN6.
Furthermore, there was a gradual increase in the dose delivered to the bilateral parotid glands, bilateral submandibular glands, brainstem, and spinal cord from PLAN0 to PLAN6. Additionally, significant increases in Dmean, V26, and V30 were observed in Parotid-L in PLAN4 to PLAN6 compared to PLAN0. The Dmean of Sub-R significantly increased in PLAN5. Moreover, the Dmax of the spinal cord and brainstem significantly increased in PLAN4 and PLAN6, respectively (Table 4).
Dosimetric comparisons of the lymph nodes target volumes and OARs
Dosimetric comparisons of the lymph nodes target volumes and OARs
Data presented as mean±standard deviation or median (interquartile distance) based on normality consistency. For PLAN1-6 compared with PLAN0, *p < 0.05. **p < 0.01 and marked in red. Abbreviations: L = left; R = right; Sub = submandibular gland; V = volume; D = dose.
Table 5 lists the threshold occurrences in parameters throughout the treatment course based on the ANOVA results. Each threshold represented a statistically significant anatomic or dosimetric change such that replanning was preferred. The above parameters changed to varying degrees with increasing treatment time. The optimal re-planning time was determined by summing up all “R” frequencies. If only one re-planning was performed, the optimal time node was PLAN5 (21 fractions). For two re-plannings, the best time points were PLAN2 (11 fractions) and PLAN5 (21 fractions).
Replanning schedules for selected parameters
Replanning schedules for selected parameters
R indicates threshold occurrence on a particular fraction of treatment, in which replanning is suggested.
Many studies have reported varying degrees of target volume and OARs reduction in NPC patients during treatment. Barker et al. [9] found that the volume of GTV and GTVnd decreased continuously at a rate of 1.8% in 14 patients with head and neck tumors. Lu et al. [10] analyzed 43 patients with NPC who underwent CT scans at the 20th fraction of radiotherapy and found that the volume of GTVnx and GTVnd decreased by 30.1% and 41.6%, respectively. Yang et al. [11] reported on 53 patients with NPC who underwent IMRT and found that the volumes of the Parotid-L and Parotid-R were reduced by (5.70±6.26) ml and (5.04±5.85) ml, respectively, after the 25th fraction of radiotherapy.
In our study, compared to PLAN0, the volume of Neck was reduced by 17.26%, the volumes of GTVnd-L and GTVnd-R were reduced by 45.75% and 35.4%, respectively. Additionally, the volumes of PGTVnd-L and PGTVnd-R decreased by 32.96% and 31.51%, respectively, in PLAN6. Moreover, the volumes of the Parotid-L and Parotid-R were reduced by 35.66% (equivalent to 10.47 ml) and 43.51% (equivalent to 14.22 ml), respectively. Furthermore, the volumes of the Sub-L and Sub-R were reduced by 25.98% and 26.02%, respectively.
While confirming that there will be anatomical changes during the treatment of NPC patients, the focus of this study is to determine whether these changes will cause corresponding dosimetric changes. Compared to the original plan, the Dmean of GTVnd-L and GTVnd-R Slightly increased, while the D95 of PGTVnd-L and PGTVnd-R showed a significant decrease in the last few plans. Therefore, the actual delivered dose to metastatic lymph nodes might be insufficient or even off-target during the treatment, posing the risk of reducing the local control rates (LCR) and increasing the recurrence and metastasis rate.
During IMRT for NPC, parotid gland and submandibular gland are considered OARs that exhibit obvious changes [12–14]. The irradiated volume and dose of these glands determine the incidence of xerostomia after radiotherapy. In this study, the parotid and submandibular glands entered the high-dose area due to their morphological retraction and positional movement, resulting in a significant increase in the irradiated dose. Significant increases in Dmean, V26, and V30 were observed in the Parotid-L in PLAN4 to PLAN6. Studies have shown that the average volume of the parotid gland is reduced by 26% before and after radiotherapy in patients with head and neck tumors. Additionally, the dosimetric results after the reduction can vary significantly, with an average dose increase of (2.2±2.7) Gy observed. Moreover, some researchers have reported an overdose dose up to 4 Gy [15–17]. Marzi et al. [18] also pointed out in their study that patients with positive bilateral metastatic lymph nodes should pay more attention to volume and positional changes during treatment. Even a slight increase in the Dmean of the parotid gland can lead to severe dry mouth symptoms, significantly affecting the patient’s quality of life.
For patients with locally advanced NPC, the PTV of the primary tumor is usually close to the brainstem, especially if the tumor is invading posteriorly. Therefore, any anatomical deformation or slight changes in the body surface contour may result in excessive radiation dose to the brainstem. In this study, the Dmax of the spinal cord and brainstem significantly increased in PLAN4 and PLAN6, respectively. The spinal cord and brainstem are considered tandem organs, and an increase in Dmax could increase the risk of radiation-induced brain injury. Cheng et al. [12] rescanned at CTsim when the radiation dose reached 30 Gy and 50 Gy, respectively, and found that 11% and 16% of patients had brainstem Dmax exceeding 54 Gy, and 11% of patients had spinal cord Dmax exceeding 45 Gy. The Dmax in the spinal cord and brainstem increased by up to 2.7 Gy and 2 Gy, respectively, which is slightly higher than the values observed in this study.
Anatomical changes during treatment can cause volume reduction and positional changes in the target volume and OARs, thereby exacerbating side effects and increasing additional risks. Studies have confirmed that timely modification of treatment plans can ensure good dose coverage of the target volumes, improve the LCR of tumors, and reduce normal tissue volume, irradiated dose, and incidence of side effects [19]. Yang H et al. [20] found that replanning during IMRT for NPC significantly improved the 2-year LCR (97.2% vs. 92.4%, P = 0.040). Chen A et al. [21] showed that patients who received ART had a higher 2-year LCR than those who did not receive ART (88% vs. 79%, P = 0.01). Additionally, patients who received ART had a lower incidence of grade 3 or above toxicities (14% vs. 19%, P = 0.71).
On the premise that the advantages of ART are obvious, finding the best time node for ART is an urgent problem to be solved in clinical practice. However, there are no clear consensus guidelines on the time and standard for triggering ART. Common triggering factors for ART include changes in body weight, tumor retraction, metastatic lymph nodes, and an increase in the irradiated volume and dose of parotid glands [22–24]. Additionally, some researchers use the individual condition and nutritional status of patients as criteria for assessing ART [25]. In this study, the volume of Neck was added for analysis. We found that the relative reduction of the volume of Neck was the fastest in the first 4 weeks of treatment, with a rate of 0.36% per day. By the 6th week of treatment, the volume of Neck was reduced to 82.74% of the original value. The reduction of the volume of Neck indicates an increase in the cavity between the thermoplastic mask and the patient’s body surface contour, reducing the repeatability and stability of the patient’s position. This results in an increase in the difference between the actual irradiation dose and the original plan, potentially affecting the final treatment effect.
In this study, retrospective dose analysis was carried out by recalculating FBCT images obtained every week. When the reference indicators significantly differed from those of the last week, the time node of the FBCT scan was considered suitable for modifying the plan. The optimal time for one ART was found to be (21fractions), while the optimal times for two ART were (11 fractions) and (21 fractions). Other researchers concluded that ART can be performed 3-4 weeks after the start of treatment [26, 27], which is similar to the results of this study.
This study presents several limitations. First, we did not consider the differences in body mass index (BMI) among patients. Previous research suggests that patients with a BMI exceeding 25 may experience more pronounced weight loss during treatment, potentially resulting in more substantial alterations in body surface contour [28]. Secondly, the efficacy of the replanning strategy implemented in this study for patient outcomes warrants validation through additional experimentalinvestigations.
Conclusion
Anatomical changes occurring in the neck region of patients with NPC during treatment can introduce disparities between the actual irradiation dose received by patients and the planned dose. Significant alterations in the position and volume of OARs, such as the parotid and submandibular glands, may lead to inadequate irradiation doses delivered to metastatic lymph nodes in certain areas, while simultaneously increasing the irradiation doses to OARs. Consequently, this scenario could elevate the incidence of toxic and side effects associated with radiotherapy. To mitigate these challenges, timely modification of the treatment plan, approximately 4 weeks after initiating radiotherapy, may offer potential benefits for patients. However, further research is necessary to validate the efficacy of thisapproach.
Author contributions
AC MZ: conception and design; AC XC: data collection; DX: data reduction; AC DX: statistical analysis; YW XJ: treatment planning; CF XJ: manuscript preparation; DX: quality control of target volume; MZ DX: quality control of data and manuscript review; All authors read and approved the final manuscript.AC and XC share first authorship.
Ethical approval and consent to participate
This study was approved by the Medical Ethics Committee of Affiliated Hospital of Sun Yat-sen University Cancer Center, and the need for written informed consent was waived.
Funding
This work was supported by grants from the National Natural Science Foundation of China (No. 82273582 and No. 82103785), the Provincial Natural Science Foundation of Guangdong, China (No. 2021A1515011055, No. 2020A1515110543 and No. 2022A1515012593).
Conflict of interest
The authors declare that they have no competing interests.