
Abstract
AIM:
This study assessed the myocardial infarction (MI) using a novel fusion approach (multi-flavored or tensor-based) of multi-parametric cardiac magnetic resonance imaging (CMRI) at four sequences; T1-weighted (T1W) in the axial plane, sense-balanced turbo field echo (sBTFE) in the axial plane, late gadolinium enhancement of heart short axis (LGE-SA) in the sagittal plane, and four-chamber views of LGE (LGE-4CH) in the axial plane.
METHODS:
After considering the inclusion and exclusion criteria, 115 patients (83 with MI diagnosis and 32 as healthy control patients), were included in the present study. Radiomic features were extracted from the whole left ventricular myocardium (LVM). Feature selection methods were Least Absolute Shrinkage and Selection Operator (Lasso), Minimum Redundancy Maximum Relevance (MRMR), Chi-Square (Chi2), Analysis of Variance (Anova), Recursive Feature Elimination (RFE), and SelectPersentile. The classification methods were Support Vector Machine (SVM), Logistic Regression (LR), and Random Forest (RF). Different metrics, including receiver operating characteristic curve (AUC), accuracy, F1- score, precision, sensitivity, and specificity were calculated for radiomic features extracted from CMR images using stratified five-fold cross-validation.
RESULTS:
For the MI detection, Lasso (as the feature selection) and RF/LR (as the classifiers) in sBTFE sequences had the best performance (AUC: 0.97). All features and classifiers of T1 + sBTFE sequences with the weighted method (as the fused image), had a good performance (AUC: 0.97). In addition, the results of the evaluated metrics, especially mean AUC and accuracy for all models, determined that the T1 + sBTFE-weighted fused method had strong predictive performance (AUC: 0.93±0.05; accuracy: 0.93±0.04), followed by T1 + sBTFE-PCA fused method (AUC: 0.85±0.06; accuracy: 0.84±0.06).
CONCLUSION:
Our selected CMRI sequences demonstrated that radiomics analysis enables to detection of MI accurately. Among the investigated sequences, the T1 + sBTFE-weighted fused method with the highest AUC and accuracy values was chosen as the best technique for MI detection.
Keywords
Introduction
Cardiovascular disease/myocardial infarction
Cardiovascular disease (CVD) prevalence increases with age and causes structural and functional complications [1, 2]. Cardiovascular magnetic resonance imaging (CMRI), which is a non-invasive, reproducible, fast, and accurate diagnostic method, is considered the main routine clinical modality for evaluating myocardial anatomy and function, especially for both left and right ventricles [3, 4]. Myocardial infarction (MI) commonly occurs after cardiac ischemia and the ventricular myocardium loses part of its functions [5]. Some parameters such as ventricular volumes and systolic functions are considered the main predictive markers of MI consequences and can be computed from the MR images [3, 6]. Therefore, CMRI can be used for the diagnosis and evaluation of MI.
Detection of MI
Late gadolinium enhancement (LGE) at CMRI has become the standard method to assess MI location, size, and grade [7, 8]. However, assessment with LGE-CMR has some limitations, such as dependency on the physician’s skill and experience (i.e., intra- and inter-observer variability), health side effects of Gadolinium like renal diseases, and incomplete cardiac imaging coverage. Furthermore, the enhancement regions of LGE can occur in other myocardial diseases like inflammation of the myocardium (i.e., myocarditis) and may cause a misdiagnosis with MI [9]. In this regard, quantitative measures could increase the accuracy of diagnostic procedures.
Machine learning
Machine learning (ML) is commonly categorized into supervised learning and unsupervised learning [10], and helps develop artificial intelligence, used in various fields such as academic investigations and industrial research [11]. This method is used in medical research and plays an important role in the development of intelligent healthcare systems [12]. ML techniques use computational algorithms to compute and predict the patient’s health after obtaining the essential data such as MR images [13]. These algorithms can be trained to learn a mathematical relation between the imported data (such as image features) and results (like cardiovascular diseases) [14]. Radiomics (radiological images) features can translate cardiovascular imaging data into mathematical models. In this regard, the features of ventricular hypertrophy, risks of post-MI arrhythmia, and MI grading such as acute, subacute, chronic, and myocarditis as well as healthy myocardium tissue can be identified from CMRI [13, 16].
Previous studies
There are several studies that assessed the potential advantages of texture analysis in cardiac images for the diagnosis of myocardial diseases [13, 15–19]. For instance, Avard et al. [13] developed an ML algorithm for the differentiation of MI and normal cases in left ventricular myocardium (LVM) on non-contrast CMR images of 72 patients (52 MI cases and 20 control subjects). In addition, Noto et al. [15] assessed the ability of radiomics features for LGE regions at CMRI to distinguish between MI and myocarditis (111 patients with MI and 62 with myocarditis) with various subjective visual analyses by readers. In another study, Baessler et al. [16] tested the texture analysis whether it allows for the diagnosis of subacute and chronic MI in non-contrast cine CMRI of 120 patients. All of the aforementioned studies concluded that radiomics analysis based on LGE and/or non-contrast CMRI could potentially be used as an alternative diagnostic method for accurate MI detection.
This work/research gap
The quantitative evaluation of MI has important implications for the diagnosis and treatment. LGE-CMRI evaluation is a gold standard method for MI diagnosis; however, there are some mentioned complications that require specially trained experts [13, 20]. The present study aimed to quantify the MI using ML-based analysis of clinical features obtained from multi-parametric CMRI, including T1-weighted (T1W) in the axial plane, sense-balanced turbo field echo (sBTFE) in the axial plane, LGE of heart short axis (LGE-SA) in the sagittal plane, and four-chamber views of LGE (LGE-4CH) in the axial plane. These images were combined using three different fusion techniques, creating 22 images/datasets for each patient. This approach referred to as multi-flavored or tensor-based feature extraction, has not been previously explored for the MI detection on CMR images. Most of the previous studies focused on the classification of clinically significant/insignificant MI detection using a single CMRI sequence [13, 18–21], which may not present complete information on the myocardial situation. In our approach, multiple fusion techniques were used to extract complementary information from different aspects of the MI, which can address several limitations of previous methods to quantify the MI using radiomics features.
Methods
Flowchart
A summary of the current study method is illustrated in Fig. 1 as the “study flowchart”.
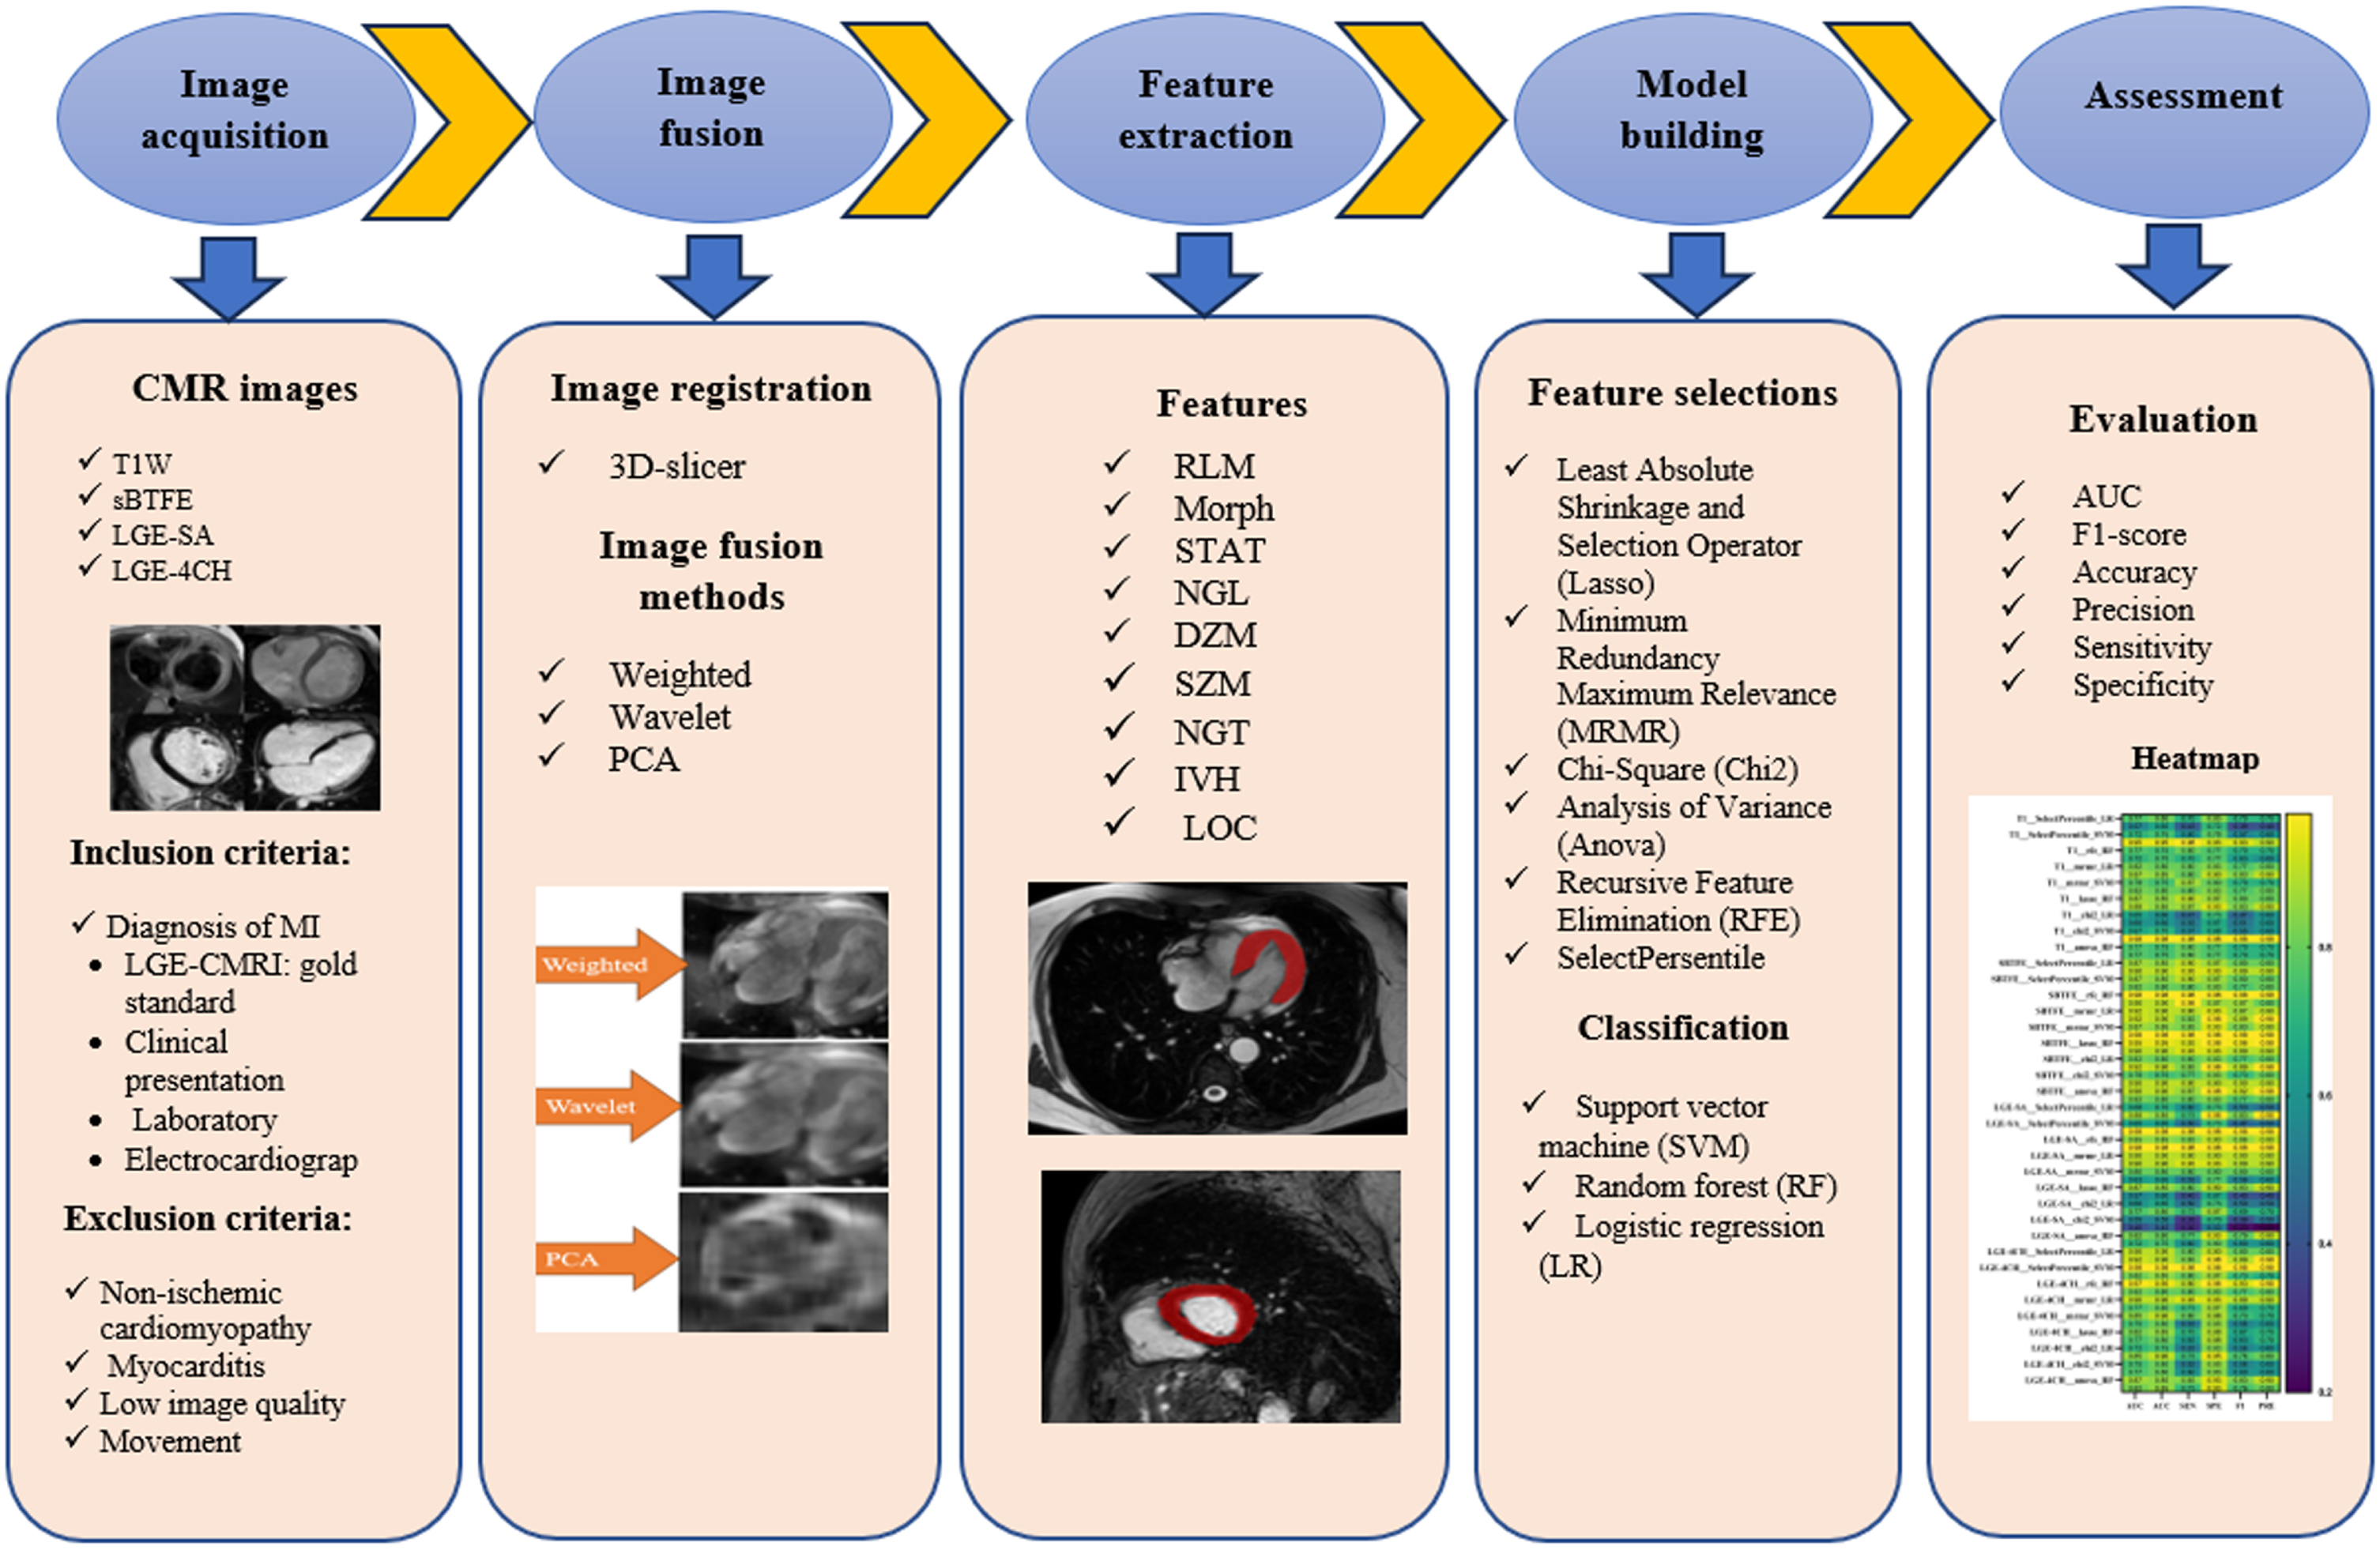
Different steps of the present study described by flowchart.
This retrospective study was approved by the National Ethics Board committee, and written informed consent was waived due to the nature of the study. Data of 200 patients who were referred to the radiology department for performing CMRI, were selected in this study. The exclusion criteria were nonischemic cardiomyopathy, myocarditis, low image quality, and/or patient movement image artifacts. The inclusion criteria was the diagnosis of MI based on clinical presentation (LGE-CMR images of patients considered as gold standard), laboratory, and electrocardiographic in which infarcted tissue is present in the left ventricle. Finally, considering exclusion and inclusion criteria, the CMR image of 83 patients with MI detection, and 32 individuals were considered as the healthy control group in our study.
CMRI and segmentation
The CMR imaging was acquired using a 1.5 T scanner (MAGNETOM Aera; Siemens Healthcare), and the parameters are summarized in Table 1. All the images covered the left ventricle (from base to apex), and their resolution ranged from 0.518–2.43 mm2/pixel. CMR images were segmented and verified by two independent experienced radiologists, having 8 and 12 years of experience, respectively, in cardiovascular imaging. The radiologists were blinded to the patient information, their results and final diagnosis. All the segmentations were performed by 3D Slicer (v. 4.11.20210226, free image computing platform of Harvard University and national institutes of health) [22]. The whole LVM was segmented and chosen as the volume of interest (VOI) in CMR images for further analysis. The samples of the CMR imaging sequences (T1W-transverse, sBTFE, LGE- SA, and LGE-4CH) are shown in Fig. 2.
CMRI parameters
CMRI parameters
TR/TE: Repetition time/echo time; FOV: Field of view.

Sample of CMR images of the four sequences for a patient with the diagnosis of MI; (a): T1W- transverse, (b): sBTFE, (c): LGE-SA, and (d): LGE-4CH.
The images were primarily registered to each other by 3D Slicer software package to obtain the transform matrix and therefore transformed images. Then, three different image fusion techniques were performed in Python 3.6.7 (Python Software Foundation, Beaverton, Oregon, USA) to obtain the combined images with probably more detailed information and improve diagnostic accuracy. Four CMRI sequences, including T1W-transverse, sBTFE, LGE-SA, and LGE-4CH, were combined one by one using the fusion methods, including wavelet fusion, weighted fusion, and principal component analysis (PCA). Wavelet fusion is effective in preserving edges and fine details [23], weighted fusion is useful to noise reduce and maintain overall contrast [24], and PCA is appropriate for preserving the most important features of the image while reducing noise [25]. In total, we performed 18 fusions (6 combinations of images with 3 different methods). The created fusion images from the four CMRI sequences are shown in Fig. 3.
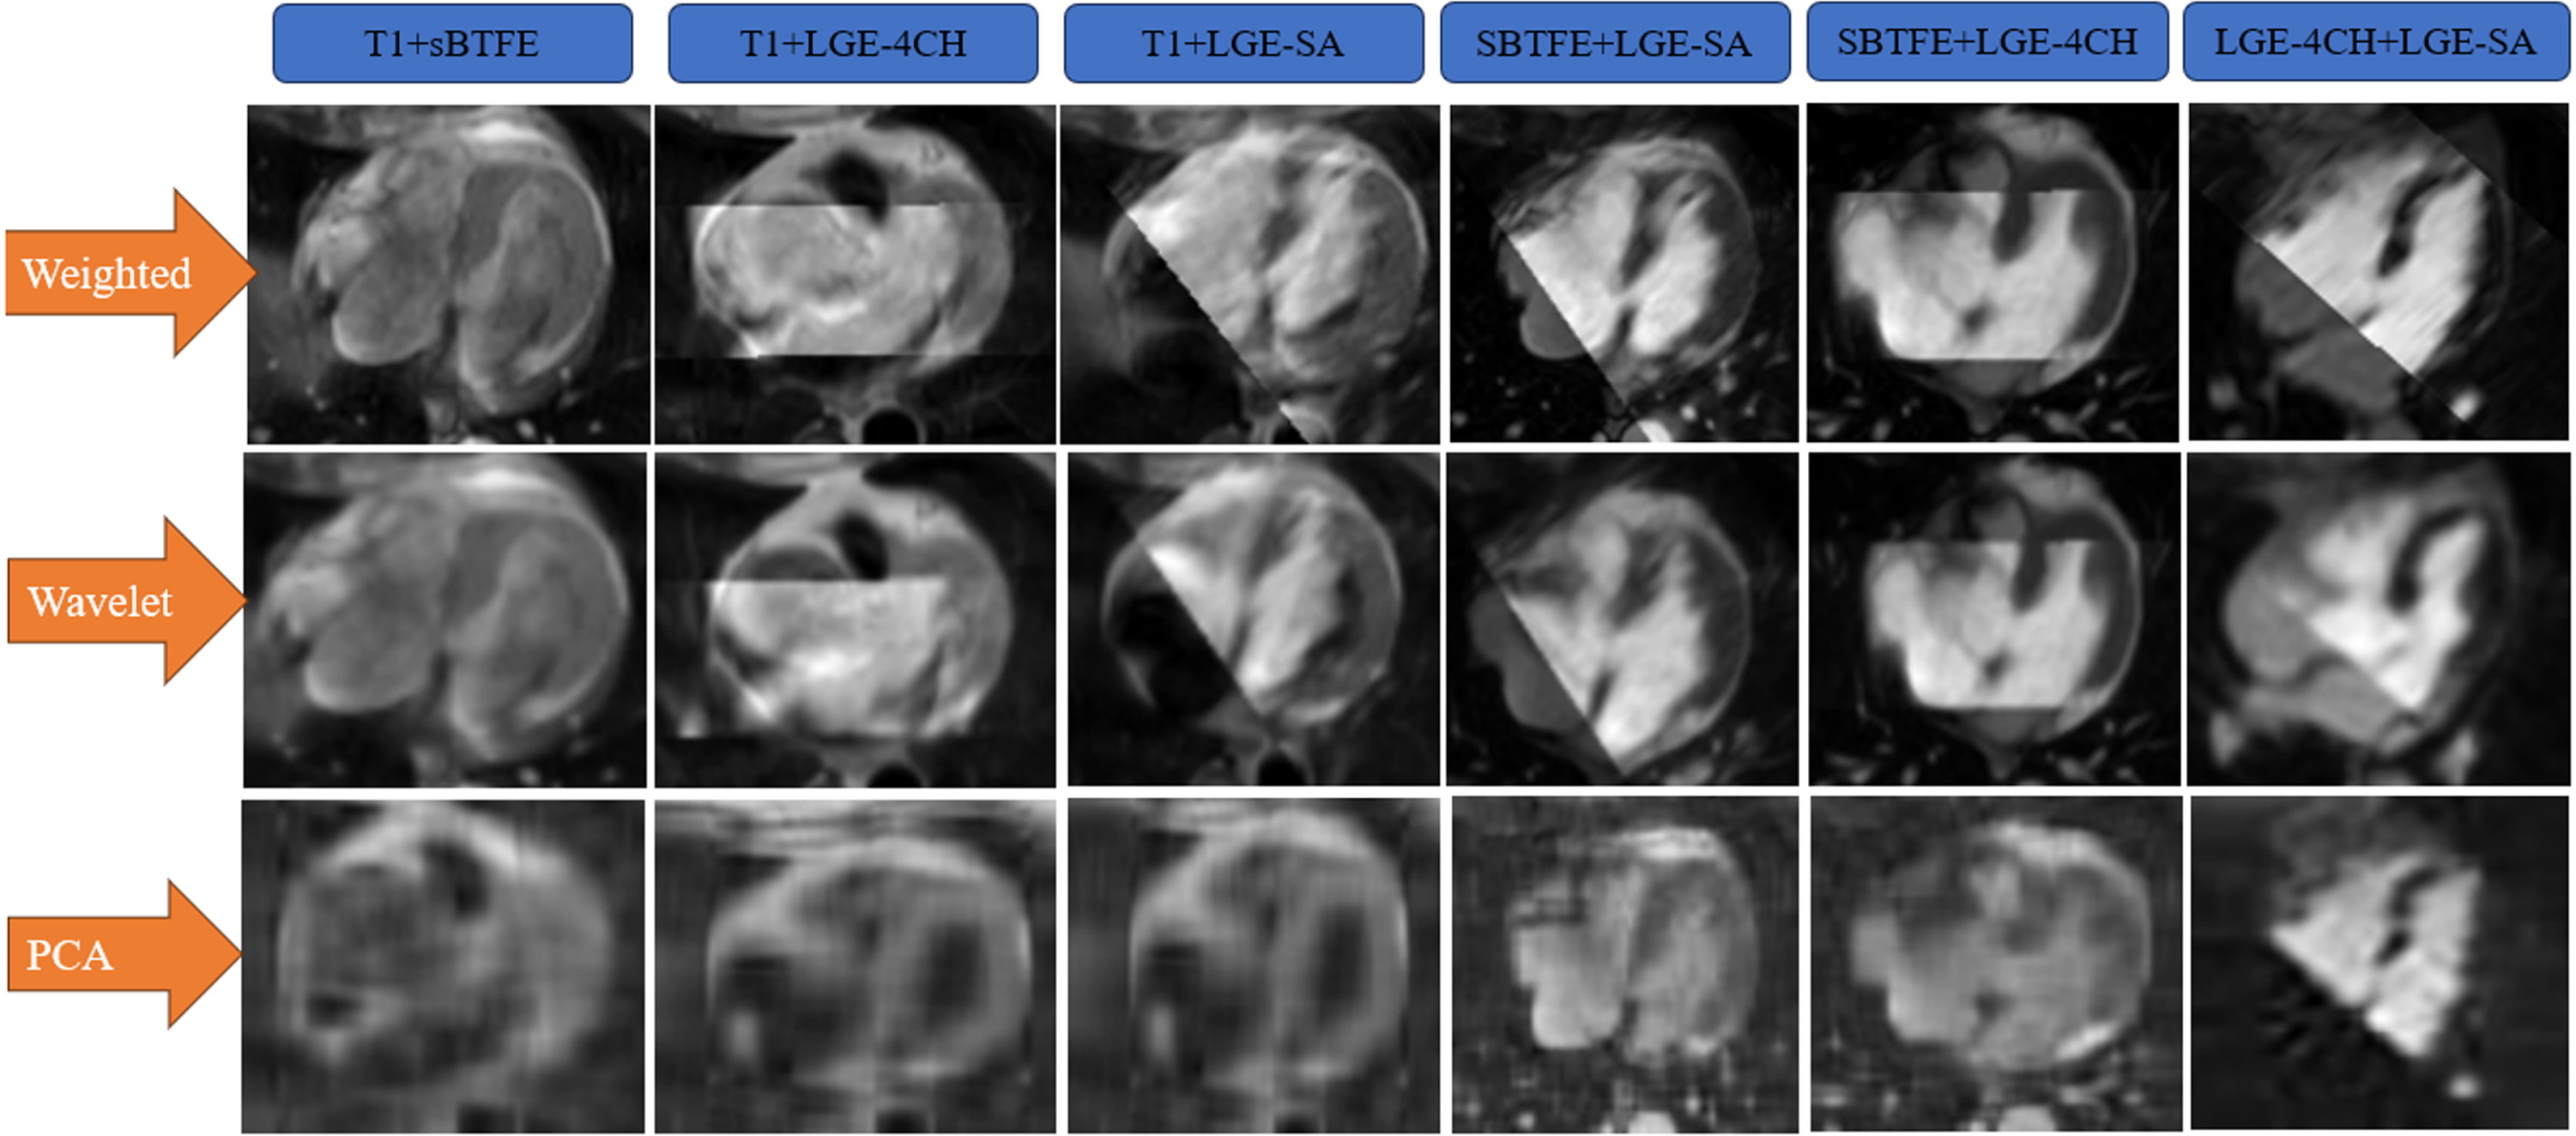
Created fusion images of the CMR images (T1, sBTFE, LGE-SA, and LGE-4CH) with different fusion techniques (weighted, wavelet, and PCA) for a normal case. Note: T1 + sBTFE is defined as T1W combined with sBTFE sequences. The abbreviations for others are defined in a similar way.
The LVM was contoured in all the main image series (not on the fusion images) as VOI. The reference image with its VOI was fused with the target image and produced the fused image. The samples of fused images for one patient are presented in Fig. 3. For example, T1 + sBTFE is a fused image with T1-weighted image as the reference image and sBTFE image as the target image. The VOI segmented on the reference image (T1W) was used for the analysis in this fusion.
It should be noted that N4 bias field correction algorithm was used to correct the intensity inhomogeneities, in the pre-processing step [26]. Radiomics features for each patient (4 main images and 18 fused images) were extracted using standardized SERA radiomics software, which has been extensively as a reference to the Image Biomarker Standardization Initiative (ISBI) [27]. A total of 487 standardized radiomics features are in SERA, including 79 first-order features (statistical, morphology, intensity-histogram, and histogram features), 272 higher-order 2D features, and 136 3D features. In the current work, first-order features and 3D features were employed: 50 Co-occurrence matrix (3D, averaged and merged) features (CM), 32 Run length matrix (3D, averaged and merged) features (RLM), 29 Morphology features (Morph), 23 Intensity histogram features (IH), 18 Statistics features (STAT), 17 Neighbouring grey level dependence matrix (3D) features (NGL), 16 Distance zone matrix (3D) features (DZM), 16 Size zone matrix (3D) features (SZM), 7 Intensity volume histogram features (IVH), 5 Neighbourhood grey tone difference matrix (3D) features (NGT), and 2 Local intensity features (LOC).
Feature selection and classification
Six feature selection methods were used for finding important radiomics features, including least absolute shrinkage and selection operator (Lasso), minimum redundancy maximum relevance (MRMR), Chi-Square (Chi2), analysis of variance (Anova), recursive feature elimination (RFE), and SelectPersentile. Furthermore, we used three classification methods including support vector machine (SVM), logistic regression (LR), and random forest (RF) to build a prediction model with stratified five-fold cross-validation [28, 29]. The feature selection and classification were performed with scikit-learn package in Python.
Evaluation
The areas under the receiver operating characteristic (ROC) curve (AUC) for each combination of feature selection and classification models on each of the images were calculated to evaluate univariate models or parameters. In addition to AUC calculation, the models were compared based on the accuracy, F1-score, precision, sensitivity, and specificity calculated using stratified five-fold cross-validation. The statistical analyses were carried out using SPSS 26 (Inc., Chicago, USA) and GraphPad Prism 8 software (Dotmatics Company, Boston, USA).
Results
The average + standard deviation age of the 115 assessed patients (83 with MI detection and 32 individuals as the healthy control) was 55.2±8.2 years old.
The top selected features for four CMRI sequences (T1W-transverse, sBTFE, LGE-SA, and LGE-4CH) and fused images are depicted in Table 2. These features mainly included 6 NGL, 5 Morph, 3 STAT, 3 SZM, 3 CM, 2 DZM, 2 IH, and 1 RLM.
Best selected features for four CMRI sequences and fused images
Best selected features for four CMRI sequences and fused images
The best feature selection and classifier methods for each CMRI sequence and fused image with the relevant AUC values are reported in Table 3. According to this table, for MI detection, Lasso (as the feature selection method), as well as, RF and LR (as the classifier methods) have the best performance (AUC: 0.97) in sBTFE sequences. For fused images, all feature selections and classifiers of T1 + sBTFE sequences with the weighted fused method had a good performance (AUC: 0.97).
Top chosen feature selection and classifier methods for CMRI sequences and fused images
Note: T1 + sBTFE-Weighted is defined as T1W combined with sBTFE sequences with weighted fusion method. The abbreviations for others are defined in a similar way.
In Table 4, the mean and standard deviation values of AUC, accuracy, F1-score, precision, sensitivity, and specificity for all investigated CMR images are represented. According to this table, the best performance was related to the fused image of T1 + sBTFE with weighted method (mean value of AUC: 0.93±0.05 and accuracy: 0.93±0.04), followed by T1 + sBTFE with PCA method (mean value of AUC: 0.85±0.06 and accuracy: 0.84±0.06).
Mean value of AUC, accuracy, F1-score, precision, sensitivity, and specificity for the CMRI sequences
Note: T1 + sBTFE-Weighted is defined as T1W combined with sBTFE sequences with weighted fusion method. The abbreviations for others are defined in a similar way.
In heatmap figures, the values of AUC, accuracy, F1-score, precision, sensitivity, and specificity for the various feature selections and classifiers for four main CMRI sequences, including T1W, sBTFE, LGE-CMR-SA, and LGE-CMR-4CH (Fig. 4a) as well as 18 created fusion images (Fig. 4b, c, d, e, and f) are represented.

Heatmap of the various feature selections and classifiers for four main CMRI sequences, including T1W, sBTFE, LGE-SA, and LGE-4CH (a), and for different CMRI fusion images (b, c, d, e, and f). ACC: accuracy, SEN: sensitivity, SPE: specificity, and PRE: precision. Note: T1-SelectPersentile-LR = T1 features were extracted by SelectPersentile classification and Logistic Regression machine learning method. sBTFE-LGE4CH-PCA-SelectPersentile-LR = sBTFE combined with LGE-4CH using PCA fusion methods, and the features were extracted by SelectPersentile classifications and Logistic Regression machine learning method. The abbreviations for others are defined in a similar way.
The visual diagnostic of diseases using the MRI method is subjective, error-prone, and slow [30]. However, in radiomic analysis, subtle changes in medical images would be predicted with higher precision and sensitivity compared to human visual inspection [31, 32]. Other advantages of radiomics include being automated, cost-effective, and preventing patient morbidity and mortality which may happen due to misdiagnosis or under/over-treatment [33, 34].
In the current work, we used ML-based analysis to quantify clinical features on multi-parametric CMRI (T1W-transverse, sBTFE, LGE-SA, and LGE-4CH). Radiomic features were used to potentially recognize changes in the cardiac tissue after MI, which is not possible by the naked eye. Although there are several studies that assessed fusion-based tensor radiomics for other diagnostic imaging methods [35–37], to the best of our knowledge, this is the first investigation that used tensor radiomics on multi-parametric CMRI for the detection of MI by different feature selections and ML models to reduce any biases and uncertainties.
In the current study, it was obtained that the best category of features (extracted using standardized SERA radiomics software) from the CMRI and fused images were NGL, Morph, SZM, DZM, and CM features. In line with the present study, Salmanpour et al. [36] demonstrated that these features had robust and excellent reliability. Owing to our results, Lasso (as the feature selection method), and RF/LR (as the classifier methods) for the main CMRI sequences, and almost all models for the fused images had a good performance (AUC > 0.8), which confirmed that multivariate radiomics analysis could distinguish MI from healthy cases with high AUC. In agreement with our study, there are several assessments that mentioned the potential advantages of texture analysis in CMRI of myocardial diseases [13, 15–21]. In addition, it was reported that deep learning can predict chronic MI areas using myocardial wall motion with appropriate AUC, sensitivity, and specificity [38]. In a retrospective study by Larroza et al. [20], the researchers assessed 50 patients with MI, in which the data was randomly split into training and testing sets, 30 and 20 patients, respectively. The LVM was segmented in cine and LGE-MRI sequences. The best AUC was 0.85, contributing to the local binary pattern features using a 2D + t approach. In Noto et al.’ study [15], it was shown that radiomics features of LGE permit the distinction between MI and myocarditis with high accuracy; for 2D features, an SVM model achieved the best results (accuracy: 0.88), and for 3D features, a linear discriminant analysis (LDA) showed the highest accuracy (0.85). Avard et al. [13] revealed that radiomics analysis can be used as an alternative method for LGE-CMRI due to accurate MI detection. They mentioned that the highest AUC was related to the Maximum 2D diameter slice (M2DS) shape feature (AUC: 0.88). The best ML algorithm for this radiomics analysis was LR (AUC: 0.93, accuracy: 0.86, sensitivity: 0.87, precision: 0.93, and F1-score: 0.90) and SVM (AUC: 0.92, accuracy: 0.85, sensitivity: 0.92, precision: 0.88, and F1-score: 0.90). Jiang et al. [21] assessed the ability of ML-based classifications to diagnose cardiac amyloidosis (CA) and hypertrophic cardiomyopathy (HCM) using non-contrast cine CMRI of 167 patients. They reported that ML-based with SVM method can accurately differentiate between CA and HCM on non-contrast cine images (accuracy: 0.85). According to our results and the mentioned studies, no feature selection and ML method are better than any other for all complications. These controversies can be attributed to different CMR imaging sequences and image segmentations, as well as various types of image pre-processing algorithms, ML and feature selection methods [39].
The main benefit of the use of tensor-based feature selection is the feature extraction with more information, consequently improving the model’s performance [36, 37]. Our results indicated that the highest number of AUC: 0.93, accuracy: 0.93, sensitivity: 0.89, specificity: 0.95, precision: 0.91, and F1-score: 0.89, contributed to the CMRI sequences with tensor-based feature selection (T1 + sBTFE with weighted method), which suggests MI detection. There are no investigations assessing the tensor-based radiomics techniques for CMRI, in this regard, we will mention some studies related to other modalities [35–37]. For instance, Salmanpour et al. [36] investigated/compared conventional and tensor deep features, in 408 patients with head and neck cancer. They registered and fused positron emission tomography (PET) with computed tomography (CT) images using the standardized-SERA radiomics software (17 ‘flavours’ generated using CT-only, PET-only, and 15 fused PET/CT images). The result of three classifiers, including RF, LR, and Multi-layer perceptron, showed that the tensor fusion radiomics framework increased survival prediction performance compared to conventional feature selection methods. In another study, Rahmim et al. [37] assessed the tensor radiomics of PET/CT (head and neck cancer), MRI (glioblastoma), and CT (lung cancer) images using multiple combinations of parameters (i.e. flavours). They have shown that the proposed tensor radiomics paradigm had the potential to improve performance capabilities in different medical imaging tasks compared to many single-flavour features.
In the present work, we have not provided intra-observer dependency with different cardiovascular imaging expertise. Future studies can be carried out with larger patient data from multiple sites and CMRI sequences to check our novel fusion approach results for MI detection.
Conclusion
Multi-parametric of CMRI to distinguish MI was assessed using conventional and tensor-based radiomics features. The Lasso feature selection, and RF/LR classifier methods had the best performance in the sBTFE sequences; however, the fused method (especially T1 + sBTFE sequences with the weighted method) had a good performance in almost all feature selections and classifiers. Therefore, it can be concluded that a): CMRI sequences of MI could be potentially detected by radiomics feature and b): this detection is more accurate with the use of tensor-based radiomics feature.
Declarations
Footnotes
Acknowledgments
N/A
Data availability
The data used to support the findings of this study are available from the corresponding author upon request.
Conflict of interest
The authors declare that there is no conflict of interest regarding the publication of this article.
Funding
N/A