
Abstract
PURPOSE:
The explore the added value of peri-calcification regions on contrast-enhanced mammography (CEM) in the differential diagnosis of breast lesions presenting as only calcification on routine mammogram.
METHODS:
Patients who underwent CEM because of suspicious calcification-only lesions were included. The test set included patients between March 2017 and March 2019, while the validation set was collected between April 2019 and October 2019. The calcifications were automatically detected and grouped by a machine learning-based computer-aided system. In addition to extracting radiomic features on both low-energy (LE) and recombined (RC) images from the calcification areas, the peri-calcification regions, which is generated by extending the annotation margin radially with gradients from 1 mm to 9 mm, were attempted. Machine learning (ML) models were built to classify calcifications into malignant and benign groups. The diagnostic matrices were also evaluated by combing ML models with subjective reading.
RESULTS:
Models for LE (significant features: wavelet-LLL_glcm_Imc2_MLO; wavelet-HLL_firstorder_Entropy_MLO; wavelet-LHH_glcm_DifferenceVariance_CC; wavelet-HLL_glcm_SumEntropy_MLO;wavelet-HLH_glrlm_ShortRunLowGray LevelEmphasis_MLO; original_firstorder_Entropy_MLO; original_shape_Elongation_MLO) and RC (significant features: wavelet-HLH_glszm_GrayLevelNonUniformityNormalized_MLO; wavelet-LLH_firstorder_10Percentile_CC; original_firstorder_Maximum_MLO; wavelet-HHH_glcm_Autocorrelation_MLO; original_shape_Elongation_MLO; wavelet-LHL_glszm_GrayLevelNonUniformityNormalized_MLO; wavelet-LLH_firstorder_RootMeanSquared_MLO) images were set up with 7 features. Areas under the curve (AUCs) of RC models are significantly better than those of LE models with compact and expanded boundary (RC v.s. LE, compact: 0.81 v.s. 0.73, p < 0.05; expanded: 0.89 v.s. 0.81, p < 0.05) and RC models with 3 mm boundary extension yielded the best performance compared to those with other sizes (AUC = 0.89). Combining with radiologists’ reading, the 3mm-boundary RC model achieved a sensitivity of 0.871 and negative predictive value of 0.937 with similar accuracy of 0.843 in predicting malignancy.
CONCLUSIONS:
The machine learning model integrating intra- and peri-calcification regions on CEM has the potential to aid radiologists’ performance in predicting malignancy of suspicious breast calcifications.
Introduction
Calcification is one of the most common findings on mammograms [1]. Although most of those calcifications are benign and can be readily diagnosed by radiologists, some have the possibilities of relating to cancer, especially microcalcifications. According to data from the American College of Radiology Breast Imaging Reporting and Data System (BI-RADS), the probability of malignancy for calcifications ranges from 2% to 95% [2]. Almost one third of breast cancers presented microcalcifications as the only suspicious finding on mammography [3]. However, due to the overlap in their characters between benign and malignant lesions, the positive rates in asymptomatic patients underwent biopsy for suspicious calcifications was only 15–30% [4]. Improving the imaging diagnostic accuracy for these patients has underling clinical significance in reducing unnecessary biopsies or resections.
Most of the malignant calcifications identified on mammography also have soft-tissue changes that may not be able to be detected on mammogram due to its limited contrast resolution. MRI has the advantage in detecting calcification related soft tissue enhancement with high sensitivity [5], seen in 100% invasive cancers and 87.9% ductal carcinoma in situ (DCIS) from a multi-center prospective study [6]. However, despite the high cost of MRI examination, the main limitation is that it is unable to view the calcifications directly, especially difficult to locate small clusters of microcalcifications which are readily visible on mammogram. Disturbance from background parenchymal enhancement is another factor that may obscure the possible enhancement around calcification areas. Biopsy and pathologic examination are the important methods used to identify the nature of suspicious microcalcifications. But, the malignancy rate of biopsy of breast calicifications is modulated by many factors such as age and individual risk of the patient, but also by the mammographic morphology and distribution of calcifications [7]. There are many pathologies of benign and malignant lesions, and each type of pathological calcification varies greatly. If benign and malignant diagnoses can be made before surgery, many surgeries and even breast puncture examinations can be avoided. Contrast-enhanced mammogram (CEM) as an emerging new technique of mammography is a promising technique by combining both traditional mammographic images and iodinated contrast-enhanced images, and thus it provides additional information of tumor vascularity. CEM technology is based on X-ray molybdenum target photography combined with iodine contrast agent, and combined with iodine contrast agent can be absorbed by X-ray spectrum at high energy, but cannot be absorbed at low energy, so it can highlight high-density lesions and improve the sensitivity of breast cancer diagnosis [8]. Previous studies have already demonstrated CEM’s abilities with better sensitivity and specificity for breast cancer detection compared with full film digital mammogram and ultrasound [9, 10], even with similar performance to MRI especially in terms of sensitivity in detecting cancer [11]. Thus, CEM has the ability to show calcifications and enhancement simultaneously and directly, and thus has been used as a tool to improve the diagnostic ability for breast calcifications [12, 13]. However, as an accompanying sign for malignancy, the extensions of calcifications are usually not completely matched or covered by the underling soft tissue change. Therefore, the investigation of the surrounding tissue may provide additional information for diagnosis.
Artificial intelligence gives new possibilities and provides massive information about intensity, shape, size, volume and texture of tumors by extracting a large number of image characteristics for quantitative analysis of tumor tissues [14–16]. Various kinds of prediction models have been built for tumor diagnosis and prognosis. The computer-aided detection of breast calcifications on mammogram is relatively easy but not so good in differential diagnosis [4, 17], and most studies focused on the intra-tumoral features [18–20]. A radiomic model developed by Lin F et al. based on contrast-enhanced mammography effectively predicted preoperative non-sentinel lymph node metastasis of breast cancer using intratumoral and peritumoral regions [20]. In addition, previous study has found that intratumor and peritumor radiomics based on contrast enhanced mammography show potential to predict the neoadjuvant chemotherapy effect in breast cancer [21]. Current studies have shown that the peri-tumor characteristics offer more valuable information for the diagnosis of tumors. However, the usefulness of peritumoral features for calcification differentiation in conventional mammograms and CEM images has not yet been systematically investigated in the current literature. Therefore, this study firstly assessed the efficacy of computer-aided detection of suspicious microcalcifications and machine learning-based classification using in-site and peri-calcification features on CEM in order to improve the diagnostic ability of computer-aided detection (CAD) in breast calcification.
Materials and methods
Study population
This was a retrospective study enrolling consecutive patients coming for CEM examinations because of suspicious breast calcification between March 2017 and October 2019 in our hospital. The test set included patients between March 2017 and March 2019, while the validation set was collected between April 2019 and October 2019. Patients’ informed consent was waivered by the Institutional Review Board. The inclusion criteria included: (1) None-mass related suspicious microcalcification lesions (BI-RADS 4) were reported on the original mammogram; (2) either an in-hospital pathologic result within 6 months after CEM could be achieved, or there were a 2-years’ follow-up to confirm the benign status. Exclusion criteria included a history of any kind of operation or radiotherapy to the affected breast within 3 months prior to CEM.
CEM acquisition protocol
CEM was performed using a commercial mammography apparatus (Senographe Essential CEM, GE Healthcare). A dose of 2 mL/kg of iodinated contrast media (Iohexol 300 mg I/mL) was administered intravenously by a power injector at a rate of 2.5 mL/s via the forearm vein prior to the examination. Consecutive mammography acquisitions were sequentially performed with craniocaudal and mediolateral oblique views of the bilateral breasts within 2–7 min after contrast medium injection. Low- and high-energy exposures were within 1–2 sec intervals during a single breast-compressed position. Low-energy images (LE) were obtained with a 26–31 kilovoltage peak (kVp), and high-energy images were obtained with a 45–49 kVp. Low- and high-energy acquisitions were immediately computerized, and a recombined image (RC) was automatically created.
Computer-aided automatic calcification detection and boundary delineation
The calcifications were automatically detected by a deep learning-based computer-aided detection (CAD) system developed by Deepwise AI Lab. The CAD system was made up of four modules, each of which was designed for a particular task. The first module was called the Mammogram Preprocessing Module that takes mammograms and digitizes it into an 8-bit image of size 2048×2048. It then extracted the breast region from the mammogram, enhances the extracted breast image and stored the processed mammogram along with the original unprocessed mammogram in a database of the system for future reference. Since only clustered calcifications provided useful diagnostic information about malignancy, the second module was designed to find and locate suspicious clusters of calcifications and then segment these clustered calcifications from the background as regions of interest (ROIs) that will be used for further calcifications detection. So, it was called the calcifications Finder Module. As soon as ROIs were identified, they fed to the third module whose task was to detect calcifications in ROIs. Therefore, it was called the calcifications Detection Module and was a real-time processing system that used two different window sizes to extract calcifications. It began with a large window of size 64×64 to quickly screen mammograms to find large calcified areas. This was followed by a smaller window of size 8×8 to extract small and tiny calcifications. Finally, the fourth module was the calcifications Classification Module that classifies each of the segmented clustered calcifications into five categories to represent different stages of calcifications [22].
Subjective reading by radiologists
Calcification lesions detected as above were presented to two radiologists (L.R. and C.M, with 6- and 5-years’ experience in mammographic reading respectively), who were blinded to the original mammogram reports, to confirm the delineation margin and reevaluate each lesion’s characters (size, distribution type, morphologic type) according to the lexicons in BI-RADS 5th edition. Five types of distribution were diffuse, regional, grouped, linear and segmental. Five types of morphology were amorphous, coarse heterogeneous, fine pleomorphic, fine linear/fine-linear branching, and typically benign. Whenever there was disparity, the opinion from another senior radiologist (C.K. with 20 years’ experience in breast imaging) was introduced.
Radiomic feature extraction and classification using machine learning
A radiomic analysis consisted of the following steps (Fig. 1). First, each calcification lesion was extracted and the boundary was obtained as aforementioned on LE images automatically and then copied to corresponding RC images as LE and corresponding RC image were with the same spatial structure. This boundary tightly encircling the calcification region was referred as intra-calcification mask. Second, a morphologic operation of dilation was performed to capture the region outside the calcification with a radial distance of 1–9 mm (Fig. 2), which was identified as expanded regions [23]. Third, radiomic features were extracted from intra-calcification and expanded regions of different distances. Radiomics analysis was performed using a free radiomics platform: MaZda software (Technical University of Lodz), an established methodology as published in prior studies [24, 25]. A detailed description of each textural feature is reported in the website https://pyradiomics.readthedocs.io/en/latest/features.html. Based on the original images, three common feature groups were extracted as follows [26]: (i) First-order features based on the tumor intensity. (ii)Shape features: metrics of the two-dimensional shape and size of the tumor. (iii) Textural features:these features quantify the heterogeneity within the area of interest and are calculated in two dimensions, taking into account the spatial position of each voxel with its surroundings, included gray-level size zone matrix (GLSZM), gray-level dependence matrix (GLDM), gray-level co-occurrence matrices (GLCM), and gray-level run length matrix (GLRLM). Moreover, the first-order features and texture features were also extracted from filtered images (wavelet transformation) from the original mammographic image. The wavelet transform divided the original image into low and high frequencies with several levels, thereby focusing the features on different frequency ranges within the tumor. In total, 788 radiomic features for each ROI were extracted. Next, the radiomic features set was standardized with a z-score method [27]. Finally, logistic regression classifier was performed to differentiate between malignant and benign lesions. To avoid the curse of dimensionality and reduce the risk of overfitting, feature selection was performed with F-test to select the subset of features for the classification task. Feature selection and model building were conducted concurrently by using a five-fold cross-validation strategy to reduce data bias [28]. In each iteration, the data set was split into two subsets: 80% cases for training and 20% cases for testing. Features were selected from each cross-validation iteration and used in the same iteration for classification with a LR classifier. The LR classifier was trained by using the 80% training cases with the selected features and then tested on the other 20% test cases. This process was repeated 5 times for each classification task. Feature extraction and model building were carried out using the Dr. Wise Multimodal Research Platform (https://research.deepwise.com). (The whole flowchart of the methodology is illustrated in Appendix 2).
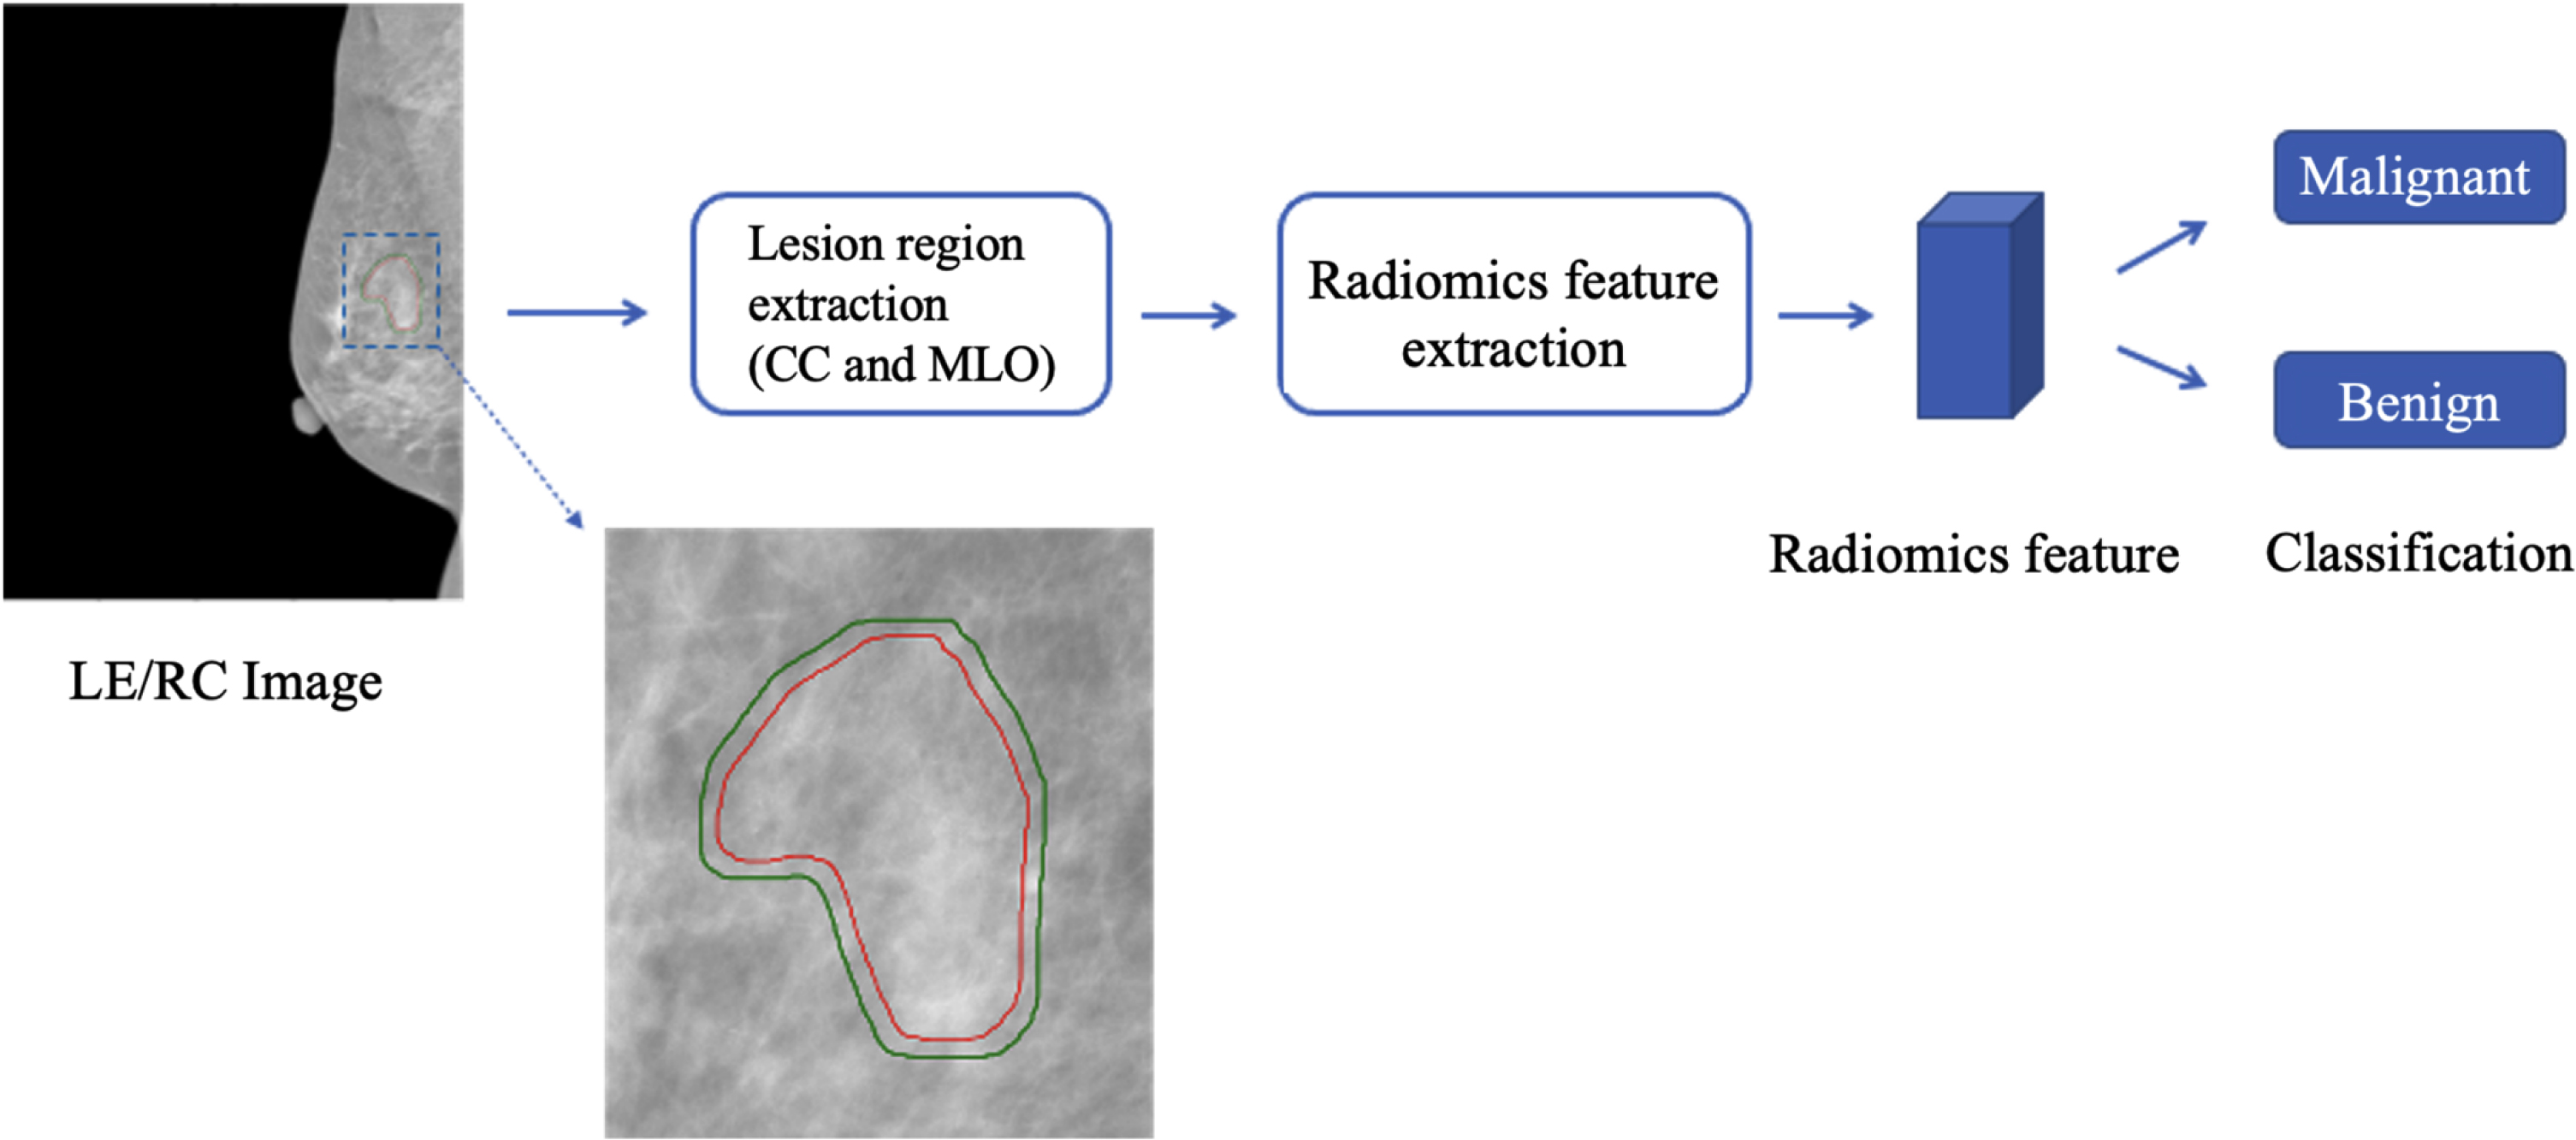
Flowchart of the methodology. Region of calcification was detected automatically to obtain compact intra-calcification mask (red line). Then, expanded mask (green line) including calcification and peri-calcification region was automatically generated for varying distances (shown here at 3 mm) outside calcification area. Radiomics features were extracted from the region within compact and expanded masks. Next, radiomics features were used to train logistic regression classifier and validate it on independent dataset. LE/RC, low-energy/recombined images;CC, craniocaudal; MLO, mediolateral oblique.

An example of extended margins of a breast calcification-only lesion on low-energy image of CEM. Female patient, 49 years old. Calcifications in the lower-outer quarter of the left breast was proved to be invasive ductal carcinoma with surrounding DCIS components by wire localization biopsy. Pictures show the CAD detected microcalcification cluster with compact margin (left), 3 mm (middle) and 5 mm (right) margin extension. CEM,contrast-enhanced mammography; DCIS, ductal carcinoma in situ; CAD, computer-aided detection.
Models from different extension of peri-calcification margins were compared by their ability in predicting malignancy of the lesions and to select the best ones. Diagnostic matrices were also presented for each model after combining with radiologists’ subjective classification.
Statistical tests were performed using SPSS (version 21.0, IBM) and Python (version 3.6.10). Categorical variables were represented as frequencies and percentages, continuous variables are presented as mean±standard deviation if the data distribution was normal or median with interquartile range for non-normal data. The area under the curve (AUC) of receiver-operating characteristics (ROC) with 95% confidence interval (95% CI) was used to evaluate the performance of the models with the following criteria: 0.5 < AUC < = 0.7, considered low or fair; 0.7 < AUC < = 0.8: considered good; 0.8 < AUC < = 0.9, considered very good; 0.9 < AUC< =1.0, considered excellent or outstanding. DeLong test was used to estimate the difference of AUC values among different models. A two-sided p-value <0.05 was considered statistically significant.
Results
A total of 102 calcification-only lesions from 96 female patients (mean age 47.7±7.4) were enrolled. Of them, 83 lesions from 81 patients were confirmed by pathology from lumpectomy or fine-needle biopsy, including 31 cancers and 52 benign conditions. The other 19 lesions from 15 patients were regarded as benign lesions by their stable status on a 2-year follow-up. 82 calcifications were included in the test set and 20 in the validation set. Clinical information of the patient cohort is listed in Table 1.
Clinical, pathology and imaging characteristics
Clinical, pathology and imaging characteristics
The predictive values of different calcification regions were assessed by comparing the models built with the same machine learning methods. Final models for LE and RC images were set up with 7 features for each (significant features in each model can be found in Appendix 1). Table 2 show the changes in prediction performance, particularly the AUC (Fig. 3), in the independent validation set after incorporating the peri-calcification features with different expanded sizes. It is observed that for the radiomic models, the AUCs of the models with the expanded region are higher than those of the models with compact intra-calcification region in the testing cohort, and their AUC differences are significant (expanded vs. compact: LE: 0.82 vs. 0.73, p < 0.05; RC: 0.89 vs. 0.81, p < 0.05), showing the usefulness of peri-calcification features in calcification differentiation of breast cancer. For the expanded boundary of LE, radiomics model using 5 mm peri-calcification region could achieve the best performance in the validation set. For RC, the model with 3 mm yielded the best performance compared to models with other sizes.
Classification performance of LE and RC image with different expanded sizes
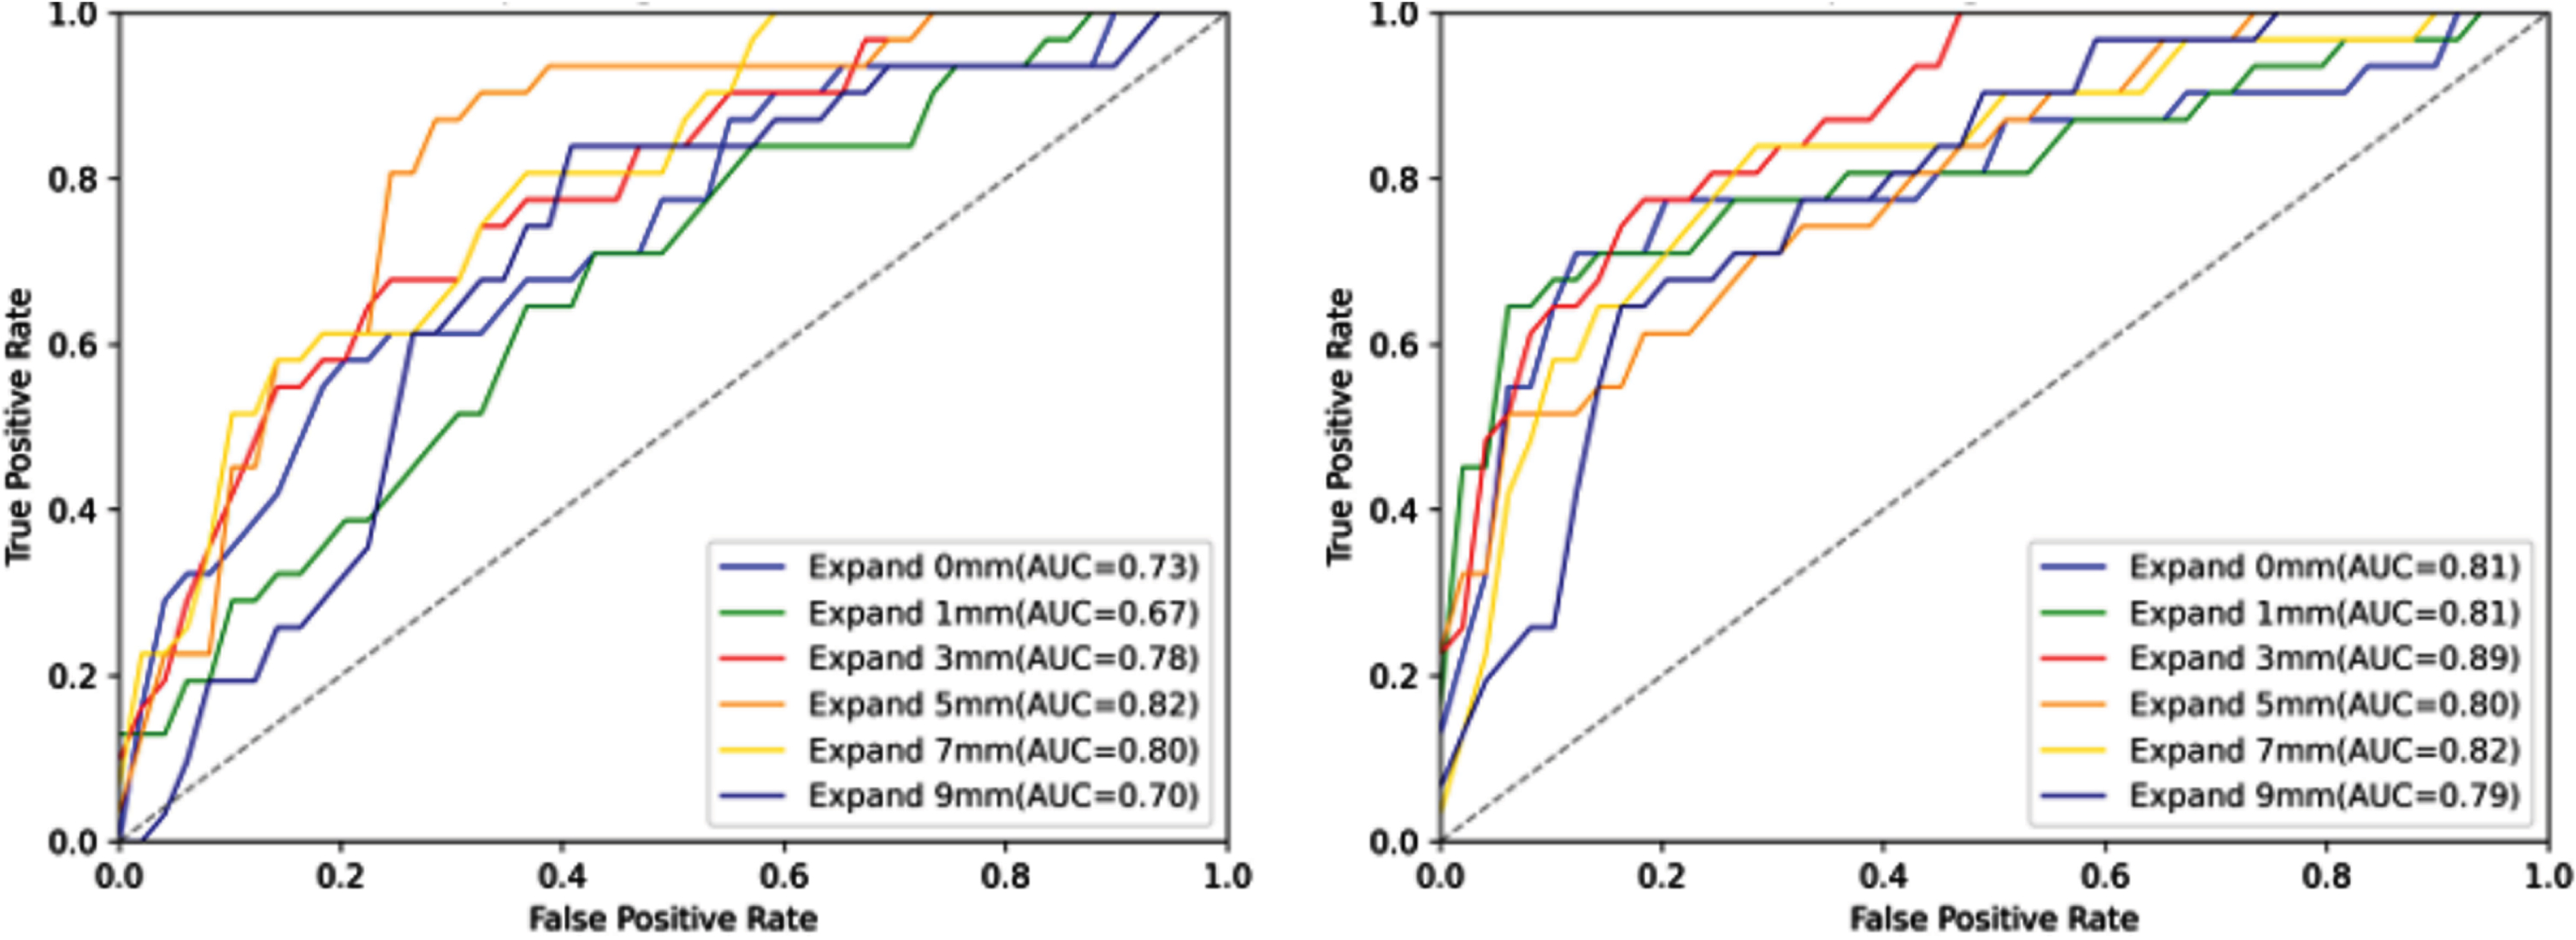
The ROC analysis of models based on LE (let) and RC (right) images with different expanded sizes. ROC, receiver-operating characteristics; LE, low-energy images; RC, recombined images; AUC Area under the curve.
Calcification distribution and morphologic types were classified and summarized as in Table 1. As we used to stratify the risk of calcification on CEM by their types [10], the combination of readers’ subjective evaluation with ML model were performed as follows: For lesions classified by all radiologists as fine linear/fine-linear branching morphology or linear distribution types (high risk) are regarded as malignant, and those classified as typically benign are regarded as benign, regardless of the ML results. While all the other lesions are predicted as complying to the ML results. The diagnostic matrices by ML models, and by combining subjective evaluation with ML models are listed in Table 3. Overall accuracies are similar among models (highest 0.843). The highest sensitivity and NPV rates were seen in reader-ML combination of LE with 5 mm boundary extension (0.871 and 0.931) and RC with 3 mm extension (0.871 and 0.937). The specificity and PPV rates in reader-ML combination of RC with 3 mm extension (0.831 and 0.692) were significantly higher than that of LE with 5 mm boundary extension (0.761 and 0.614). The overall diagnostic performance is best in reader-ML combination of RC with 3 mm extension.
The diagnostic performance using ML model with different expanded size and supplemented with subjective readings
Data are presented as diagnostic rates, with case/ all cases in parenthesis.
The primary findings of our study indicate that by integrating CEM with machine learning-based computer-aided system, we were successful in extracting radiomic features on both LE and RC images from both intra- and peritumoral regions of breast microcalcifications and effectively predicting the malignancy of these lesions. More specifically, we observed that the incorporation of peri-calcification features into ML models significantly improved their performance in distinguishing benign from malignant calcifications. Furthermore, we found that the peritumoral distance extension of 3-5 mm provided the optimal performance for the radiomics models.
Computer-aided system designed for CEM is quite few, and were mainly focusing on automatically detecting and differentiating between benign and malignant masses [29, 30]. But the detection and interpretation of calcifications are quite different from those of mass and other soft tissue changes. Calcifications are more easier to detect because of the relatively high density compared to soft tissue, but are challenging in differentiating because of the quantity of calcium particles and their various spatial relationships, especially those without obvious soft tissue changes on mammogram. The recent result of combined texture analysis and machine learning for risk stratification of suspicious mammographic calcifications achieved AUC around 0.82–0.83 [17]. In one study, a commercially available AI-CAD behaved no better than radiologists (AUC 0.745 vs. 0.722) [4]. In this study, we improved AUC to 0.89 by adding CEM.
In previous studies, peri-tumoral regions have been confirmed to provide additional information about the tumor, which may be the distortion of the surrounding structures, edema or other related changes. On CEM, the peri-calcification region might be tumoral or normal fibroglandular tissue. Our results confirm the assumption that the peri-calcification helps to predict the malignancy of microcalcifications, both for LE and RC images. The combined features were generated from the intra-tumoral regions and the peritumoral regions with sequential distances. Classification performance improvement was observed when using ROIs with different peritumoral distances. Our results not only demonstrate the benefit of peritumoral features in microcalcification classification of LE and RC, but also show that the classification performance of the radiomics models varies with the peritumoral size. A proper extension of the peritumoral distance, 3–5 mm as in this study, improved the model performance both for LE and RC. The 7 radiomic features used in each model captured the heterogeneity and complexity of the tumor tissues. For instance, glcm_Imc2 assesses the correlation between the probability distributions of different intensity levels. Firstorder_Entropy specifies the uncertainty/randomness in the image values. Glcm_Autocorrelation is a measure of the magnitude of the fineness and coarseness of texture. Radiomics features serve as the bridge between medical images and machine learning. In our study, first-order features, shape features, and Textural features were included. Our study thoroughly explored the value of CEM radiomics features to predict breast cancer. Most of the radiomics features included in the LE and RC models were texture features. Texture features quantify the inter-voxel relationships in an image. Such features describe microscopic characteristics in CEM images. Texture features can capture the unique aspects of the biological heterogeneity of breast cancers and contain part of pathological characteristics related to breast cancer.
Most deep learning models for differential diagnosis outperform junior radiologists but no better than senior radiologists, the same in breast calcification lesions [31]. The ML model we created is also limited by the patient number and the unstandardized interpretation of CEM as a newly emerging technique. So we combined subjective reading with ML model. For calcifications appeared as high risk, referring to fine linear and fine-linear branching which are higher than 70% malignant rate from BI-RADS [2] and are also not reliable with non-enhancing appearance on CEM [10], are classified as malignant regardless of the ML scores. Higher sensitivity (0.871) and NPV (0.937) were thus achieved while maintaining accuracy rate (0.843), in order to be of practical use in facilitating clinical decision-making.
Despite the small patient population from a single center, other limitations exist. Firstly, contrast enhancement can lead to a loss of information about the heterogeneity of lesion density present on LE images and potentially obfuscate certain informative features. Secondly, the cost-effectiveness of integrating machine learning with CEM in the clinical diagnosis of breast microcalcifications is high, which might restrict the widespread adoption of the technique. Finally, background enhancement interferes with judgement of lesion enhancing, thus normal areas of the breast might be considered. And optimal selection of the margin size may should be tailored to size and distribution types of the calcifications in setting up the model. Further stratification of the lesion may be necessary to achieve performance. Generalization of our results are restricted by case numbers, and future validation is needed.
Conclusion
By setting up a preliminary computer-aided workflow for detecting, delineating and diagnosing breast calcifications for CEM, the ability of CEM to predict the malignancy status of suspicious breast calcifications were significantly improved by adding enhancing features from recombined images, especially by incorporating peri-calcification features.
List of abbreviations
Abbreviations
Ānomaly Separation Network
Area under the curve
Breast Imaging Reporting and Data System
Computer-aided detection
Contrast-enhanced mammography
Confidence interval
Ductal carcinoma
Kilovoltage peak
Low-energy images
Machine learning
Region of interest
Declarations
Ethics approval and consent to participate
This is a retrospective study. Patients’ informed consent was waivered by the Institutional Review Board.
Consent for publication
Not applicable.
Availability of data and materials
The datasets used and analysed during the current study are available from the corresponding author on reasonable request. The authors declare that they had full access to all of the data in this study and the authors take complete responsibility for the integrity of the data and the accuracy of the data analysis.
Conflict of interest
The authors declare that they have no competing interests.
Funding
Not applicable.
Author contributions
Kun Cao, Chen-Cui Huang and Ying-Shi Sun: study design. Rong Long and Min Cao: imaging data collection. Fei Gao, Fan-Dong Zhang, and Chen-Cui Huang: data processing. Kun Cao and Fei Gao: manuscript writing. Chen-Cui Huang, Yi-Zhou Yu and Ying-Shi Sun: manuscript revision. All authors reviewed the results and approved the final version of the manuscript.
Footnotes
Acknowledgments
Not applicable.