
Abstract
OBJECTIVE:
This study aims to explore the feasibility of DenseNet in the establishment of a three-dimensional (3D) gamma prediction model of IMRT based on the actual parameters recorded in the log files during delivery.
METHODS:
A total of 55 IMRT plans (including 367 fields) were randomly selected. The gamma analysis was performed using gamma criteria of 3% /3 mm (Dose Difference/Distance to Agreement), 3% /2 mm, 2% /3 mm, and 2% /2 mm with a 10% dose threshold. In addition, the log files that recorded the gantry angle, monitor units (MU), multi-leaf collimator (MLC), and jaws position during delivery were collected. These log files were then converted to MU-weighted fluence maps as the input of DenseNet, gamma passing rates (GPRs) under four different gamma criteria as the output, and mean square errors (MSEs) as the loss function of this model.
RESULTS:
Under different gamma criteria, the accuracy of a 3D GPR prediction model decreased with the implementation of stricter gamma criteria. In the test set, the mean absolute error (MAE) of the prediction model under the gamma criteria of 3% /3 mm, 2% /3 mm, 3% /2 mm, and 2% /2 mm was 1.41, 1.44, 3.29, and 3.54, respectively; the root mean square error (RMSE) was 1.91, 1.85, 4.27, and 4.40, respectively; the Sr was 0.487, 0.554, 0.573, and 0.506, respectively. There was a correlation between predicted and measured GPRs (P < 0.01). Additionally, there was no significant difference in the accuracy between the validation set and the test set. The accuracy in the high GPR group was high, and the MAE in the high GPR group was smaller than that in the low GPR group under four different gamma criteria.
CONCLUSIONS:
In this study, a 3D GPR prediction model of patient-specific QA using DenseNet was established based on log files. As an auxiliary tool for 3D dose verification in IMRT, this model is expected to improve the accuracy and efficiency of dose validation.
Introduction
As an advanced radiotherapy technique, intensity-modulated radiation therapy (IMRT) is widely adopted to deliver accurate and safe treatment to cancer patients. IMRT offers high-dose conformity using non-uniform radiation fluence fields at different fixed gantry angles using step and shoot or sliding window techniques [1]. However, the complexity of IMRT requires frequent patient-specific QA to ensure accurate and safe delivery during treatment [2]. Measurement-based patient-specific QA is recommended as the standard method in radiotherapy’s clinical practice. This procedure involves a QA plan recalculation, phantom setup, dose distribution measurement, and data analysis. The implementation of patient-specific QA is limited by high costs and considerable time and labor consumption [3, 4].
The use of machine learning (ML) and other sophisticated models to aid the prediction of patient-specific QA outcomes has become widely popular. Valdes explored automatic QA based on plan complexity metrics and performed model validation in different clinics [5, 6]. Since then, ML/deep learning (DL) prediction models have been developed to predict the outcomes of patient-specific QA. Relevant studies have been performed based on complexity metrics from the patient’s treatment plans [7, 8], radiomics features from gamma images [9], fluence maps using deep learning [10, 11], combined features [12]. Based on these prediction models, the correlation of patient-specific QA outcomes with plan, dose distribution or fluence was clarified showing the promising of ML/DL for dose verification.
However, deviations may occur during delivery, thus resulting in dose differences [13]. For instance, an error of 1 mm in leaf positioning could lead to a 6% dose difference in the planning target volume (PTV) for step-and-shoot and a 5% dose difference for dynamic IMRT [14, 15]. Thus, actual parameters play an important role in the dose difference between the treatment planning system (TPS) and delivery. Huang et al. established a 2D GPR prediction model based on actual parameters recorded in log files, indicating the relationship between the actual parameters and the 2D GPRs [16]. The 3D gamma metric is an extension of the 2D gamma index into another dimension, allowing for consideration and evaluation of the entire volumetric patient dose distribution. However, the relationship between actual parameters and 3D GPRs needs to be explored. Therefore, it is necessary to establish an automated model for 3D GPRs of IMRT based on actual parameters in subsequent research. The parameters of gantry, MU, multi-leaf collimator (MLC) information during delivery is recorded in trajectory log files.
In this study, DenseNet was used to explore the prediction model of IMRT 3D gamma based on actual parameters recorded in log files. The parameters recorded in the trajectory log files were used to form a MU-weighted fluence map, which was used as the input of DenseNet, and the GPR of the prediction model under the gamma criteria of 3% /3 mm, 3% /2 mm, 2% /3 mm, and 2% /2 mm was utilized as the output of the prediction model. This prediction model exhibited potential to improve the accuracy and efficiency of IMRT dose verification.
Materials and methods
Dataset
A total of 55 IMRT plans (including 367 fields) from January 2020 to November 2021 were randomly enrolled in the retrospective cohort in this study, including 18 lung cancer plans, and 37 breast cancer plans. The dose prescriptions comprised 60 Gy in 30 fractions and 50 Gy in 25 fractions for lung cancer plans and 50 Gy in 25 fractions and 40.05 Gy in 15 fractions for breast cancer plans. All these plans were generated in the Eclipse TPS (Varian Medical Systems, Palo Alto, USA) with step-and-shoot. The dose distribution was calculated using the Acuros External Beam (AXB, ver.15.6, Varian Medical Systems) with a dose calculation grid of 2.5 mm. The results were consistent with the clinical requirements for the PTV and organs at risk (OAR).
Dose verification
These patient plans were delivered on Varian’s accelerator equipped with standard-definition millennium MLC (Millennium 120), and 3D dose verification was performed with a stationary OCTAVIUS 4D phantom (PTW-Freiburg, Germany) (OCT4D). The Octavius 4D phantom was generated virtually in Eclipse with the relative electron density set to 1.016. Those patient plans to be verified were transplanted to the Octavius 4D phantom to generate verification plans. Then, the RTdose files were exported to a 3D dose reconstruction algorithm in VeriSoft (PTW-Freiburg, Germany). The verification plans were delivered on Varian’s accelerator under the QA model to simulate the real treatment scenario. Then, dose distribution comparisons were evaluated using the gamma analysis, which was considered a standard procedure for planned dose verification [17]. Moreover, the 3D gamma analysis was performed using gamma criteria of 3% /3 mm (Dose Difference/Distance to Agreement), 3% /2 mm, 2% /3 mm, and 2% /2 mm with global normalization to the maximum dose of the reference distribution. A 10% threshold to remove the low dose signal which contributes to the passing rate.
Preprocessing of log files
The delivery parameters (e.g., gantry, MU, and MLC positions) of the linac were recorded in dynamic log files throughout the treatment delivery sampled at a time interval of 20 ms. The Pylinac library was used to convert the binary file with the actual parameters into a MU-weighted fluence map, which was used as the input of the prediction model. The MU-weighted fluence maps for plans related to the lung and breast are illustrated in the following Fig. 1.
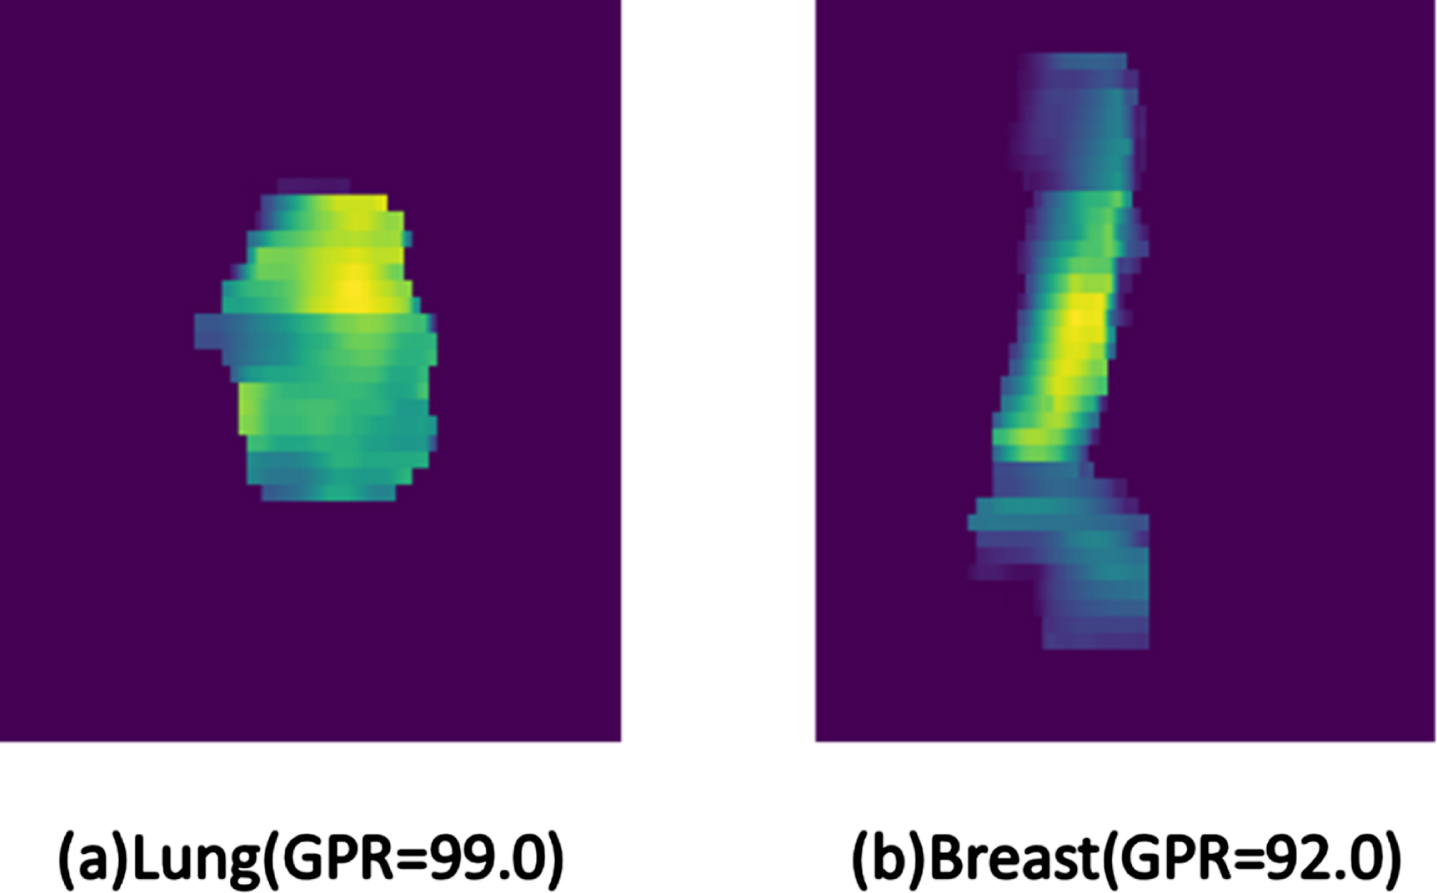
Variations in MU-weighted fluence maps of various treatment sites. ([a]Lung with a GPR of 99.0 under 3% /3 mm criteria; [b]Breast with GPR a GPR of 92.0 under 3% /3 mm criteria.)
DenseNet has certain degree of advantages in parameter efficiency, gradient flow, feature reuse and diversity, training stability, modularity, and reduction of overfitting. The architecture of the GPR prediction model based on DenseNet-121 is illustrated in Fig. 2, including Dense Block and Transition Layer. Compared with the original DenseNet-121 architecture, the network architecture of GPR prediction did not include the SoftMax layer and incorporated a full-connection layer at the end. The regression result of GPR was output under the action of the full-connection layer. The selection and change the network architecture were performed to make up for the loss of image features advanced by the convolutional layer and the pooling layer. Each layer would connect with all previous layers as the input of the next layer in the channel dimension. For the network with the L layer, DenseNet contained a total of L * (L + 1)/2 links as feature fusion, so as to realize feature reuse and higher efficiency.
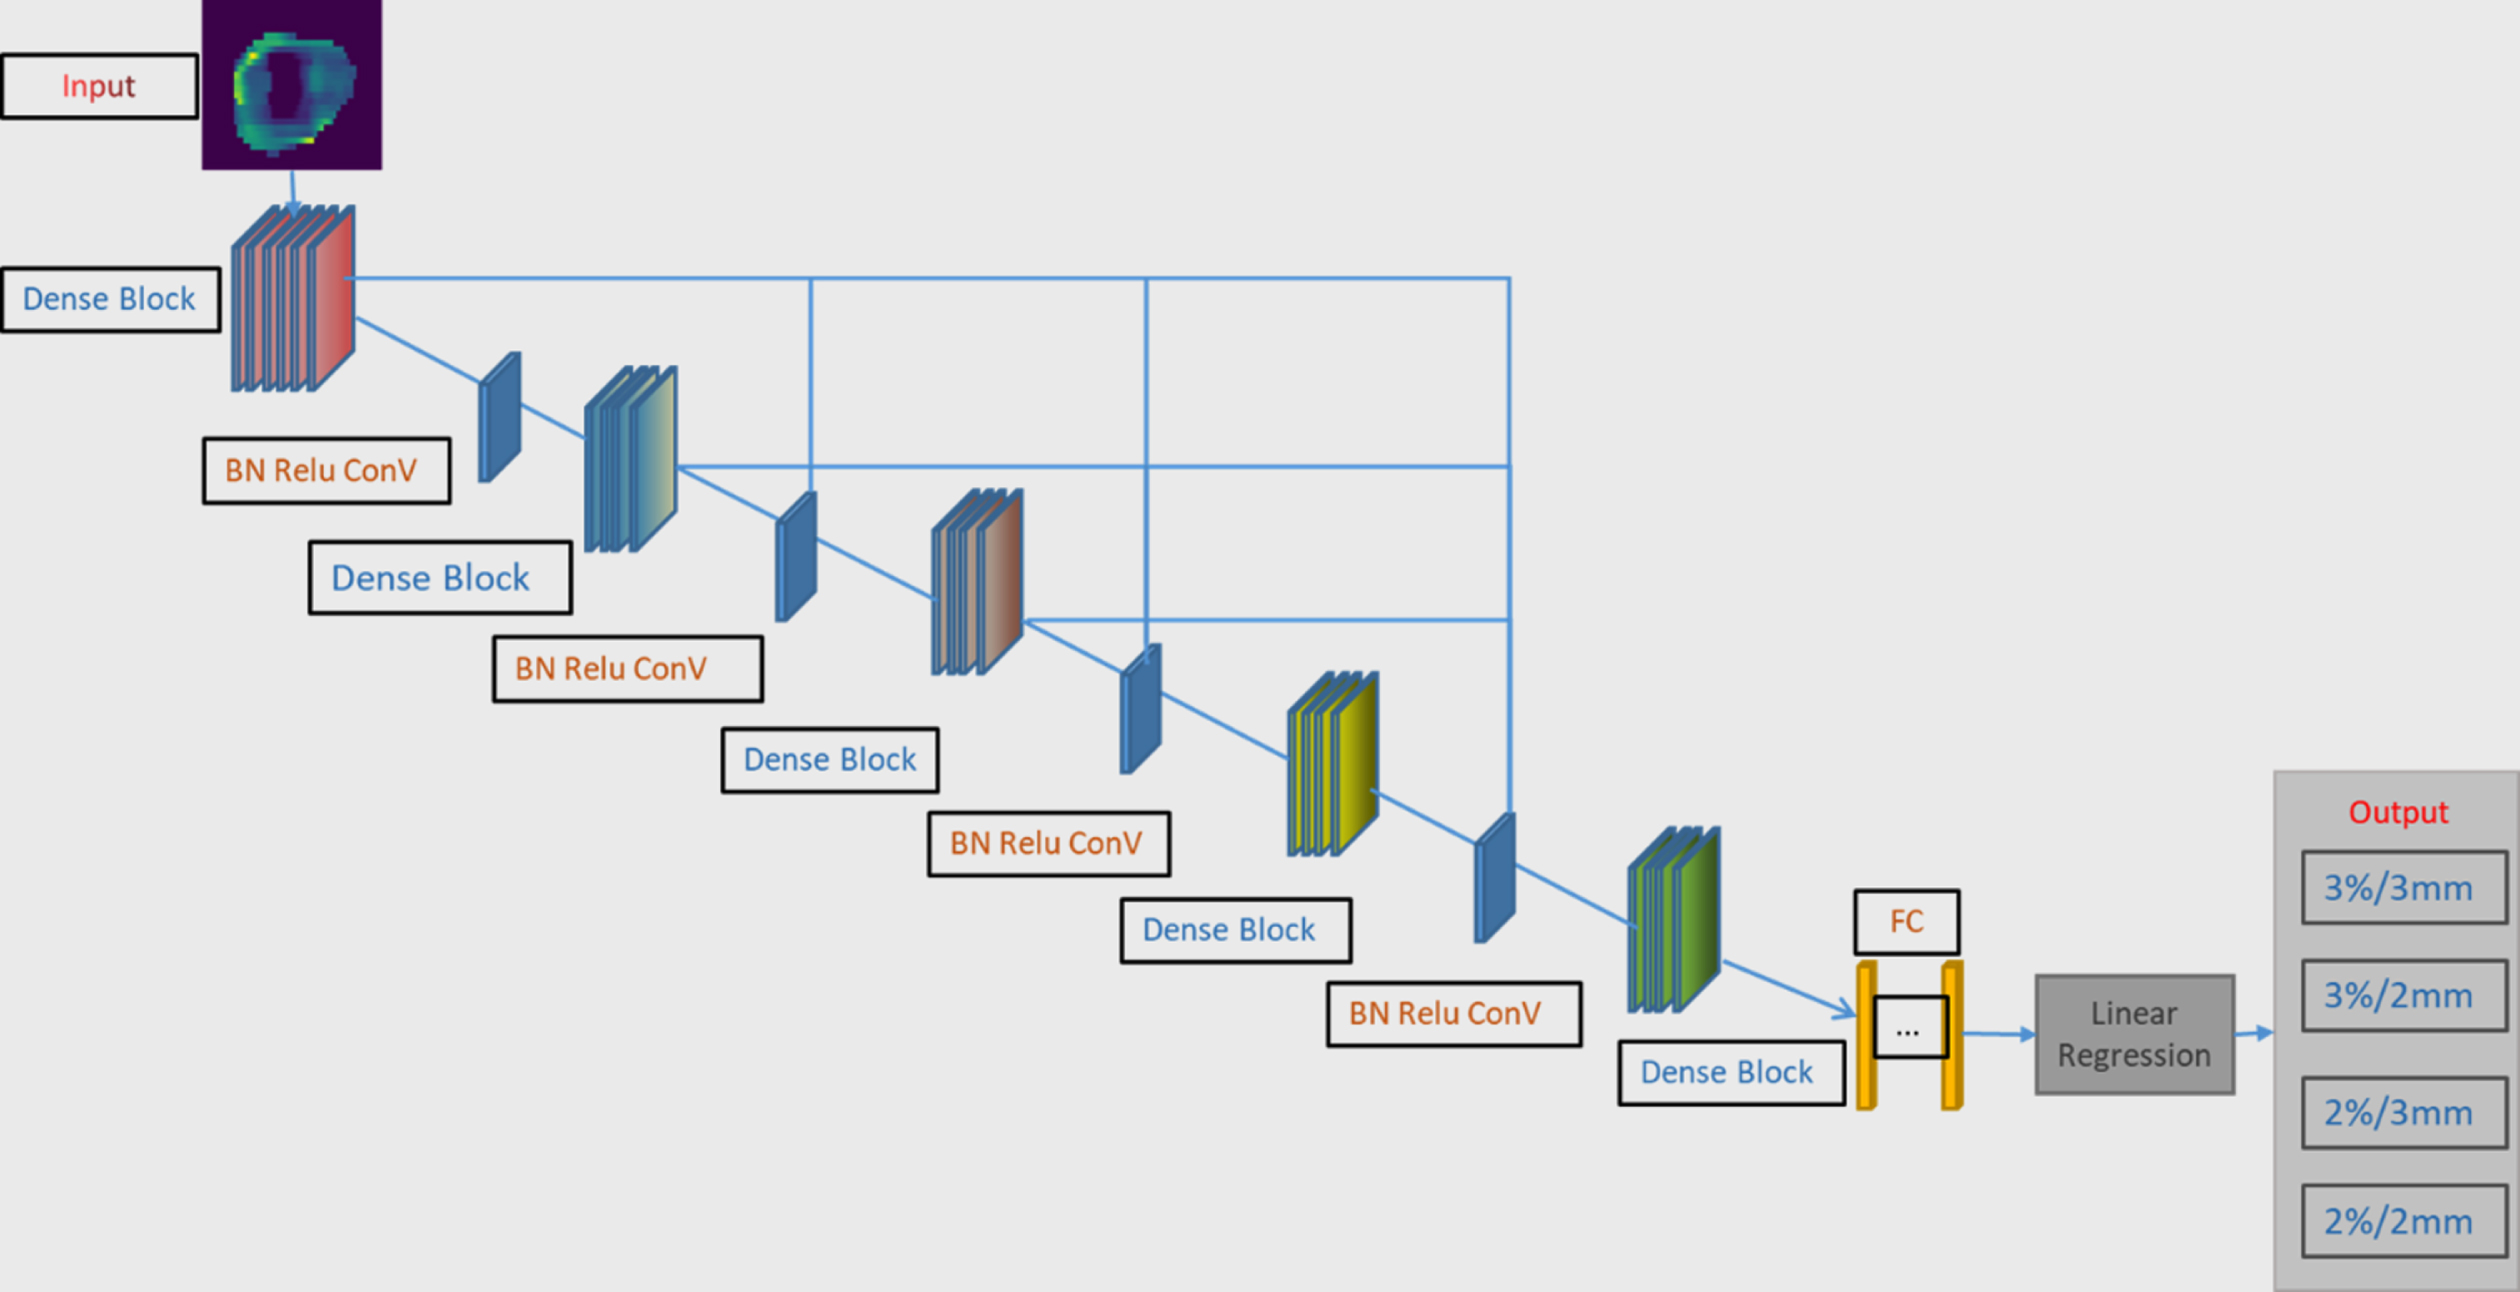
The schematic diagram of the DenseNet architecture for the prediction of GPR values after the input of MU-weighted fluence maps. The network outputs prediction results under four criteria, including 3% /3 mm, 3% /2 mm, 2% /3 mm, and2% /2 mm.
The learning strategy was involved in the optimization of this model by using the dynamic learning rates that decreased gradually with the increase of the epoch. The commonly used Adam optimizer [18] was adopted to learn the back-propagation error. The initial learning rate was set to 0.00001, which was better than that of other learning rates through experimental comparison. The MU-weighted fluence maps with a resolution of 496 * 367 were cut off with redundant information, such as frame and coordinate axis. Flipping (horizontal random lip probability: 0.5; vertical random flip probability: 0.5) and random clipping were used to prevent overfitting. The dataset was randomly divided into three subsets, including 259 training sets, 58 validation sets, and 50 test sets. A Mini batch method was used to train the model, the batch size was set to 6, and the epoch was set to 2000.
The GPR prediction model was constructed by PyTorch, an open-source ML library. About 8 hours were required to complete model training on NVIDIA GTX-3070 GPU.
Model performance evaluation
To evaluate the performance of this model, the mean absolute error (MAE) and root mean square error (RMSE) were calculated in the validation and test datasets. The correlation coefficient (CC) between predicted and measured GPRs was assessed by the Spearman’s rank CC (Sr) method to measure the correlation of two statistical variables. CC >0.8 indicates a high correlation; 0.4 < CC < 0.8 indicates a moderate correlation; CC <0.4 indicates a low correlation. All data analysis was performed by SPSS 22.0.
Results
Measured GPRs
Fig. 3 shows the mean, standard deviation (SD), median, and inter quartile range (IQR) of measured GPRs under the criteria of 3% /3 mm, 3% /2 mm, 2% /3 mm, and 2% /2 mm. The stricter the gamma criteria, the smaller the mean and median GPRs, the larger the SD and the IQR, and the higher the dispersion of the GPR distribution. Under the criterion of 2% /2 mm, the mean and median were the lowest, and the SD and IQR were the largest.

Measured GPRs under different gamma criteria.
Table 1 lists the mean, SD, and median of predicted GPRs, and as well as the MAE, RMSE and the Sr between measured and predicted GPRs. With the implementation of stricter gamma criteria, the mean and median of predicted GPRs decreased, the SD increased, and the MAE and RMSE between predicted and measured GPRs increased. Under the same criteria, there was no significant difference between MAE and RMSE in the validation and test sets. Besides, there was a moderate correlation between measured and predicted GPRs. However, the Spearman’s rank correlation coefficient was not strongly dependent on these gamma criteria.
Results of predicted GPRs (%) under each criterion
Results of predicted GPRs (%) under each criterion
(Abbreviations: MAE, mean absolute error; MSE, mean squared error; RMSE, root mean squared error; Sr, Spearman rank correlation coefficients).
The GPRs predicted by this model were plotted against measured GPRs, as shown in Fig. 4. The center line represents a perfect prediction. If the prediction is ideal, these points will form a diagonal line on the diagram. Although a linear relationship between predicted and measured GPRs was observed each of the four gamma criteria, predicted GPRs deviated from measured values. Moreover, these higher GPRs were closer to the ideal line, while those lower GPRs were significantly extended to the left, which indicated that the low GPRs tended to be overestimate in this model.

The scatter diagram of predicted and measured GPRs under 2% /2 mm, 2% /3 mm, 3% /2 mm, and 3% /3 mm. Diagonal line: perfect prediction.
To further explore the relationship between the accuracy of the prediction model and the GPR value, the MAE of the validation set and test sets with a GPR larger than or equal to 95% and smaller than 95% were evaluated under 3% /3 mm and 2% /3 mm, respectively. In addition, the MAE of the validation and test sets was evaluated under a GPR larger than or equal to 80% and smaller than 80% for 3% /2 mm and 2% /2 mm. The MAE in different groups under different threshold criteria is shown in Fig. 5. It can be found that the MAE of the low GPR group was more than 2 times higher than that of the high GPR group under all gamma criteria. In the test set, the difference of MAE in groups larger than 95% is more obvious than that in groups smaller than 95% for gamma criteria of 3% /3 mm compared with 2% /3 mm. It can be explained that the proportion of GPRs smaller than 95% under 3% /3 mm is smaller than 2% /3 mm resulting insufficient learning ability for the model. The same trend occurred in the comparation of 3% /2 mm and 2% /2 mm. In short, the balance of dataset plays an important role in the performance of the prediction model.
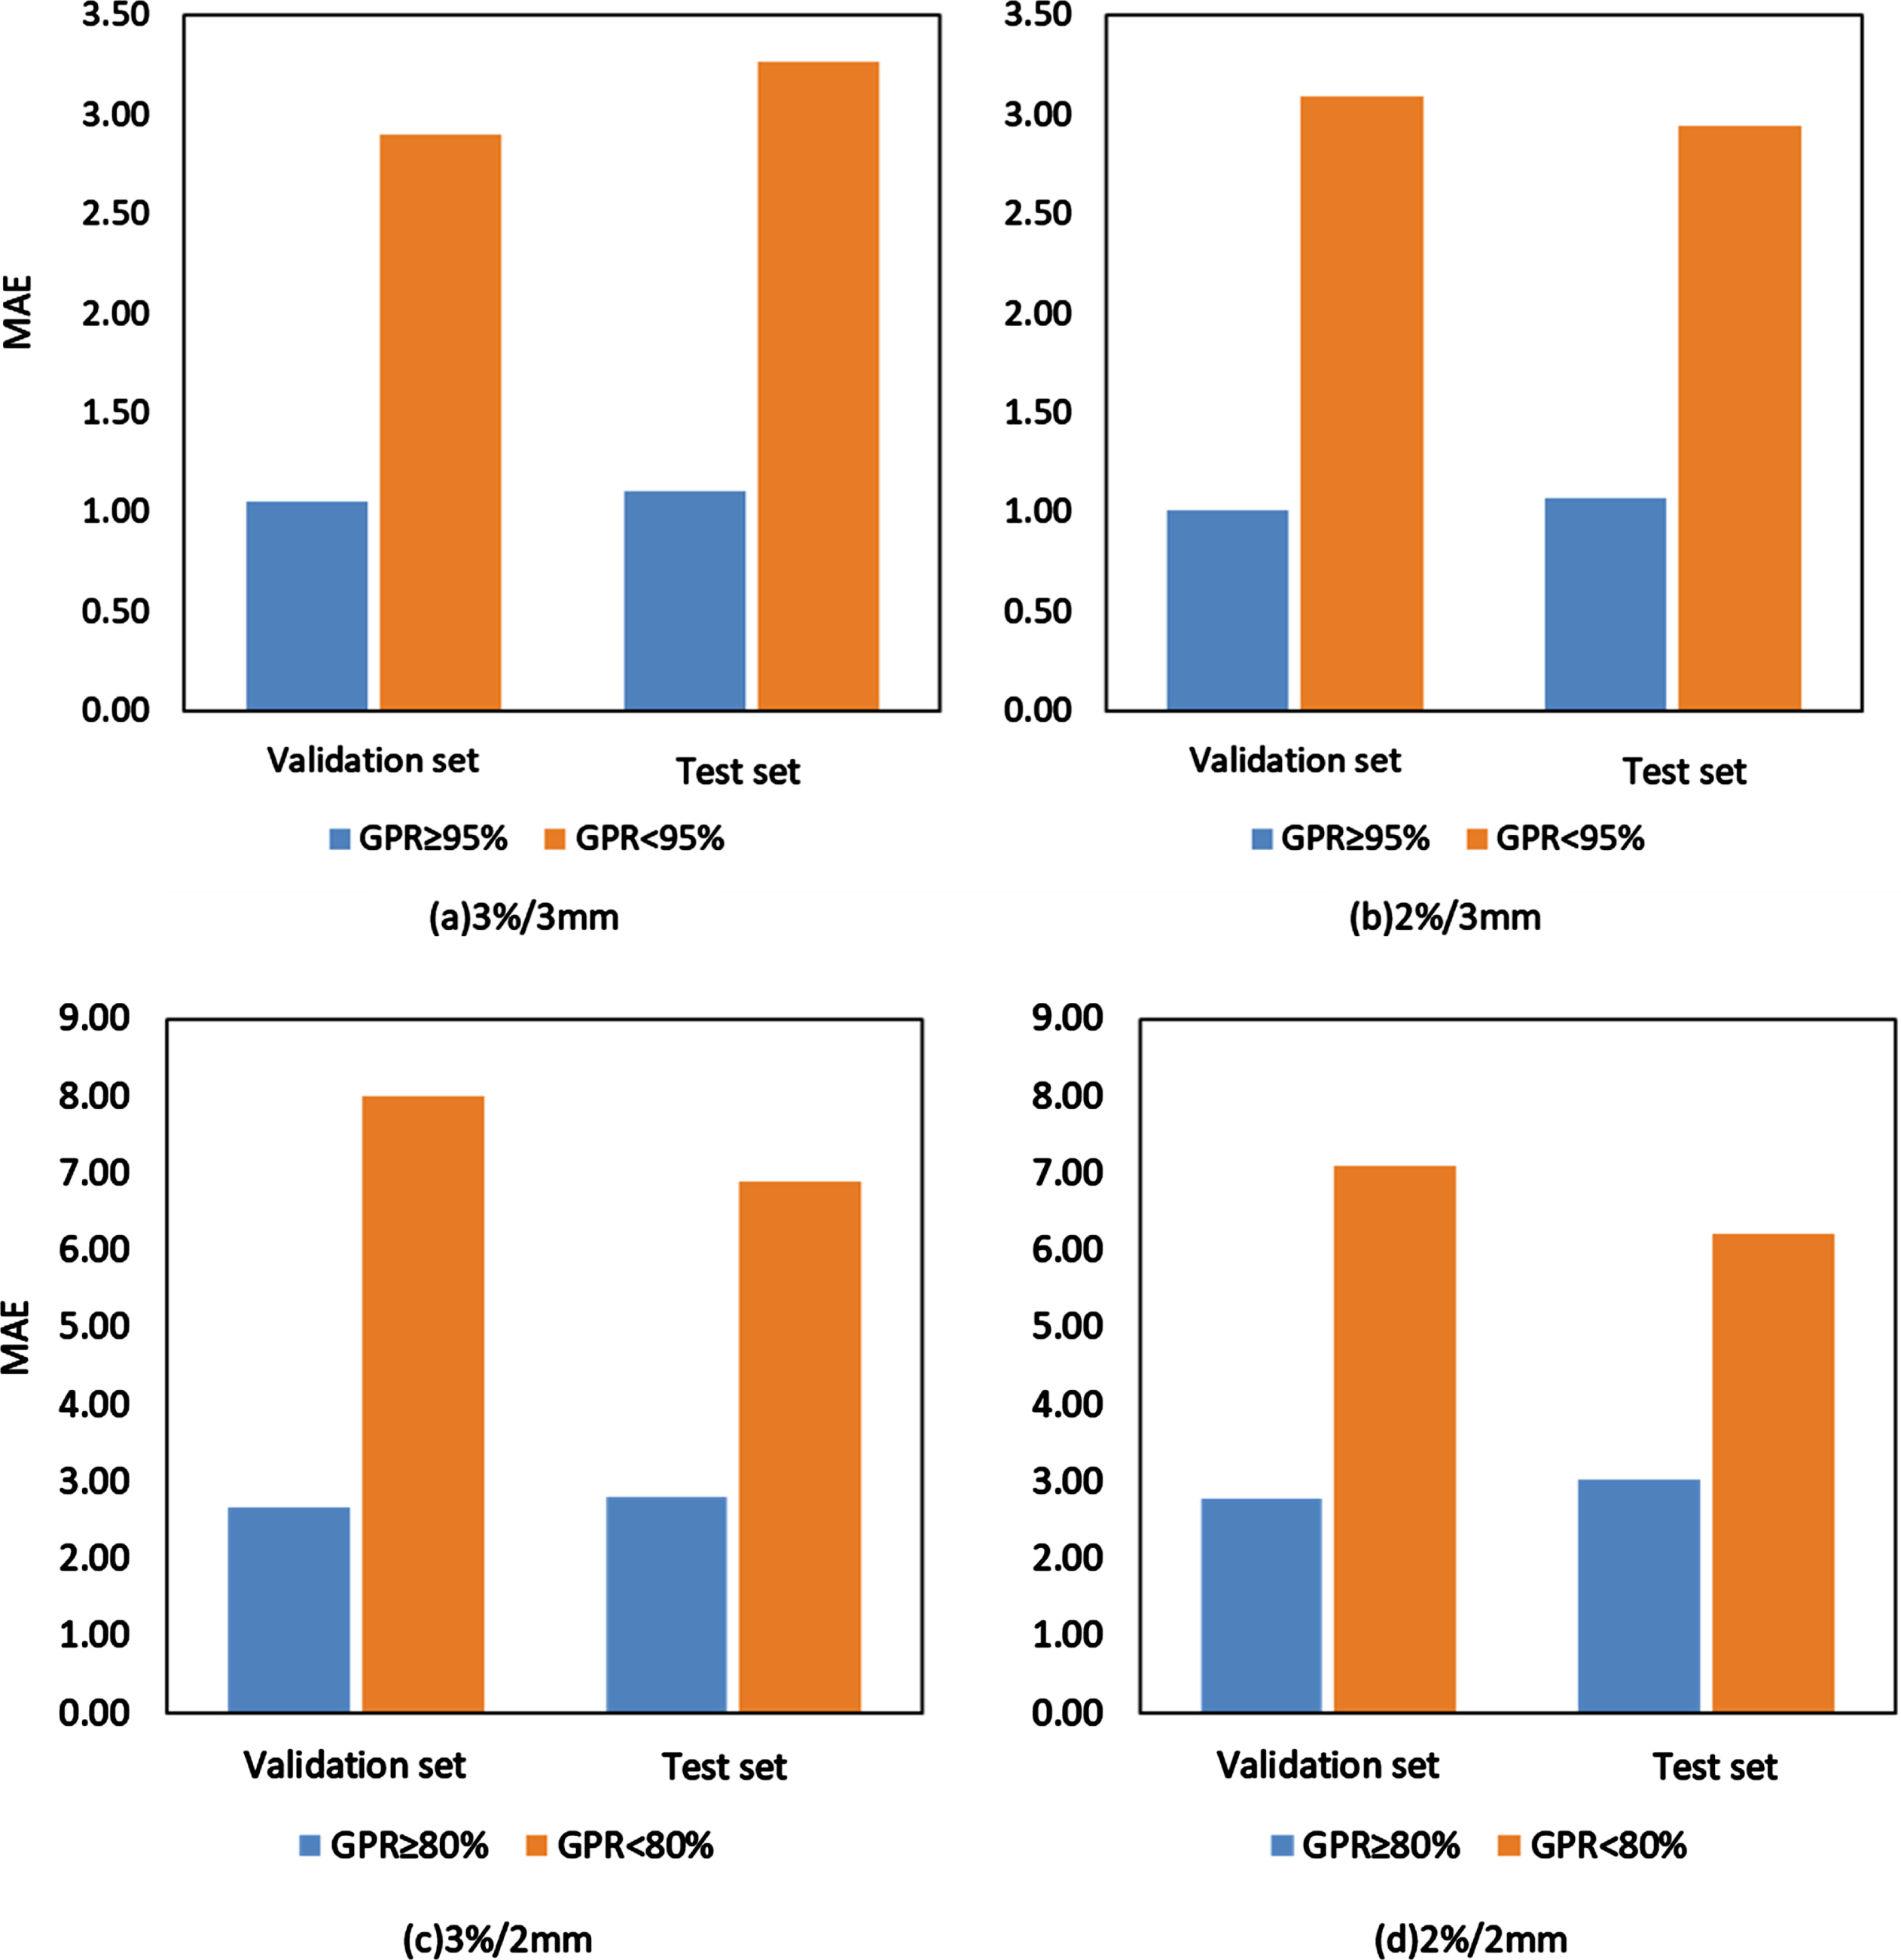
MAEs of different GPR groups
In this study, an automatic model was established for IMRT 3D dose verification using delivery parameters recorded in log files based on DenseNet. This model could accurately predict GPRs under different gamma criteria, which is helpful for work saving of plan transfer, phantom positioning, measurement, and data analysis. Thus, the efficiency of dose verification was improved, and physicists could devote more resources and time to plans that were more likely to fail IMRT QA. According to the predicted results of the proposed 3D GPR prediction model, for the plans that failed to pass the dose verification, we analyzed the sources of error combined with our previous studies on error analysis to guide the plan design [19], avoiding the human cost and confusion caused to patients by repeated adjustment of the plan.
The performance of this prediction model under different gamma criteria was related to the threshold standard of the GPR. It was confirmed that 2% /2 mm was the most stringent among the four threshold criteria examined, and the accuracy was the lowest. In addition, there was a large imbalance in the data, namely that the number of fields with a low GPR was relatively small. There were 17.44% (64/367) and 23.71% (87/367) of fields with a GPR < 95% in the threshold of 3% /3 mm and 2% /3 mm, respectively. The proportion of fields with a GPR < 80% in 3% /2 mm was 12.81% (47/367) and 15.53% (57/367) under 3% /2 mm and 2% /2 mm, respectively. The learning of the prediction model for fields with low GPRs was insufficient, and the performance would get worse. This result was illustrated by the MAE in different GPR groups. Therefore, the proportion of fields with low GPRs should be increased as much as possible to reduce the degree of data imbalance in the future. Clinically, most of these fields were composed of passing data, with a relatively high GPR. Therefore, multi-center cooperation is required to collect more data with low GPRs. Based on that, a more accurate prediction model can be established.
With the application ML/DL in radiotherapy, increasing QA outcome prediction models are being developed [20, 21]. Currently, the automatic dose verification prediction models for IMRT are all based on the plan complexity metrics, dose distribution, fluence, and actual parameters recorded in log files to predict the 2D GPR. Additionally, each model was trained on different datasets, including single institution dataset, multi-institution dataset, single treatment site, multiple sites, different linacs, and different measurement devices. Hence, different prediction results may be obtained in these models. These variations datasets are not conducive to the direct comparison of the performance of these models. The ground truth of the proposed prediction model is the dose verification results of OCTAVIUS 4D, and the outputs of the model are consistent with the ground truth under the condition that the model performance is perfect. Of course, we can also use the results of some other commercial software as the model responses. The effectiveness of the prediction model depends on the model performance.
The machine delivery log-file analysis has been verified to be a more effective and efficient approach in verifying IMRT delivery accuracy in terms of gantry, collimator, jaws, and MLCs [22–24]. Mobius, as a tool for dose verification based on log files, has been confirmed to be one of the effective means for dose verification [24]. However, percentage depth dose (PDD) and profile need to be measured for Mobius before their application, and the beam model needs to be adjusted to fit different accelerators repeatedly [26]. Besides, there are other weaknesses in existing solutions like Mobius 3D that the proposed 3D GPR model can overcome: (1) The price of Mobius 3D is expensive compared to the 3D GPR prediction model. (2) The 3D GPR prediction model used all the information recorded in log files while Mobius 3D used not all log points to speed up the calculation. (3) In terms of calculation time, Mobius 3D takes a few minutes to calculate while for the proposed 3D GPR prediction model, it can be completed in a few seconds for new patients. (4) During the long-term use of these two methods, Mobius 3D needs to collect beam data for calibration regularly, which costs a lot of manpower and material resources. For the proposed 3D GPR prediction model, it only needs to retrain the network based on the previous plans. The Gamma analysis, which is a standard procedure for planned dose verification [27], could be predicted accurately by the prediction model established based on log files [16]. In terms of the application of this prediction model in other centers, the establishment of a beam model is not required and the automatic 3D gamma prediction for the new IMRT plan can be realized by transfer learning based on previous dose verification results. In addition, it is also necessary to conduct explorations into 3D dose distribution prediction based on log files in the future.
There are still some limitations in this study. As the prediction model of QA results was established based on delivery parameters recorded in log files, the accelerator had to be machine-calibrated by an independent QA program (AAPM142) [28] to ensure high temporal and spatial resolution of these parameters recorded in the log file. Besides, the accuracy of this model is limited by the unbalanced dataset. Hence, it is necessary to collect more data to establish a more accurate prediction model in the future direction. Moreover, the robustness of the GPR prediction model on different treatment sites and different MLC models needs to be verified in future by multi-center cooperation.
Conclusions
In this study, a 3D GPR prediction model was established based on log files using DenseNet for patient-specific QA in IMRT. This model could be used to accurately predict GPRs under different gamma criteria. Furthermore, this model may have the potential to improve the efficiency of QA in IMRT.
Conflict of interest
The authors have no conflicts to disclose.
Author contributions
Y. Huang conceived and designed the project. R.X. Cai and K. Ma collected patients’ clinical data. Y. Huang. and Y.F. Pi performed model development. Y.F. Pi and Q. Kong contributed to the interpretation of data. Y. Huang prepared the figures and tables and drafted the manuscript. W.H. Zhuo and Y. Kong revised the manuscript. All authors read and approved the final version of the article.
Footnotes
Acknowledgments
This work was supported by the National Natural Science Foundation of China (Grant No. 12305353), Shanghai Municipal Health Commission Health Industry Clinical Research Special Project (Grant No. 20234Y0018) Science and Technology Innovation Plan of Shanghai Science and Technology Commission (Grant No. 22YF1442600), National Natural Science Foundation of China (Grant. No. 12205120), Wuxi Translational Medicine Research Institute project (Grant No. LCYJ202339). The authors are grateful to the editor and associate editors for their valuable comments and review of this paper. And the authors are grateful to Sichuan Xin YiBai Technology Co., Ltd for their technical support in model development.