
Abstract
BACKGROUND:
The development of photon-counting CT systems has focused on semiconductor detectors like cadmium zinc telluride (CZT) and cadmium telluride (CdTe). However, these detectors face high costs and charge-sharing issues, distorting the energy spectrum. Indirect detection using Yttrium Orthosilicate (YSO) scintillators with silicon photomultiplier (SiPM) offers a cost-effective alternative with high detection efficiency, low dark count rate, and high sensor gain.
OBJECTIVE:
This work aims to demonstrate the feasibility of the YSO/SiPM detector (DexScanner L103) based on the Multi-Voltage Threshold (MVT) sampling method as a photon-counting CT detector by evaluating the synthesis error of virtual monochromatic images.
METHODS:
In this study, we developed a proof-of-concept benchtop photon-counting CT system, and employed a direct method for empirical virtual monochromatic image synthesis (EVMIS) by polynomial fitting under the principle of least square deviation without X-ray spectral information. The accuracy of the empirical energy calibration techniques was evaluated by comparing the reconstructed and actual attenuation coefficients of calibration and test materials using mean relative error (MRE) and mean square error (MSE).
RESULTS:
In dual-material imaging experiments, the overall average synthesis error for three monoenergetic images of distinct materials is 2.53% ±2.43%. Similarly, in K-edge imaging experiments encompassing four materials, the overall average synthesis error for three monoenergetic images is 4.04% ±2.63%. In rat biological soft-tissue imaging experiments, we further predicted the densities of various rat tissues as follows: bone density is 1.41±0.07 g/cm3, adipose tissue density is 0.91±0.06 g/cm3, heart tissue density is 1.09±0.04 g/cm3, and lung tissue density is 0.32±0.07 g/cm3. Those results showed that the reconstructed virtual monochromatic images had good conformance for each material.
CONCLUSION:
This study indicates the SiPM-based photon-counting detector could be used for monochromatic image synthesis and is a promising method for developing spectral computed tomography systems.
Introduction
CT has been utilized widely since the early 1970s to non-destructively visualize the internal structure of materials, and the diagnostic and therapeutic medical arenas [1]. In the United States alone, the number of CT examinations performed has continued to rise, with over 90 million conducted in 2019 [2], which makes CT one of the most important and widespread imaging modalities used for patient care. However, conventional computed tomography technology employs energy-integrating detectors (EIDs) which cannot differentiate between photon energies. As a result, tissues with different elemental compositions can appear indistinguishable in the resulting CT image [3–5]. To surmount the limitations in tissue characterization that traditional CT scans encounter, the initial iteration of spectral CT systems, embodied by rapid kVp switching technology [6, 7], dual-layer technology [8, 9], and dual-source technology [10, 11], introduced a novel imaging paradigm to the radiology field. Compared to spectral CT, which typically uses energy-integrating detectors with additional techniques to differentiate between different energy levels of the X-ray spectrum, photon-counting CT employs pulse-height discrimination to divide the transmitted X-ray spectrum into multiple energy bins, thus achieving improved spectral separation [12] and K-edge imaging [5]. Additionally, the application of an energy threshold enables the rejection of counts due only to measured electronic noise [13]. Therefore, photon-counting CT technology has emerged as a promising next-generation X-ray CT solution [14, 15]. Photon-counting CT improves soft tissue contrast and enables material decomposition by utilizing the different energy bin information of the polychromatic X-ray [16]. This novel imaging modality makes it possible to reconstruct the virtual monochromatic images, which have the potential to reduce beam-hardening artifacts and provide accurate linear attenuation coefficients (LACs) [17]. Therefore, synthetic virtual monochromatic images possess numerous clinical applications, including contrast imaging, urinary calculus classification, and tumor screening evaluation [18].
CdTe and CZT detectors are widely used in virtual monochromatic image synthesis of photon counting CT detectors [4, 19–21]. The superior energy resolution of CdTe/CZT detectors confers significant advantages for multi-color imaging, particularly in the application of K-edge imaging. However, due to the very low mobility of electrons and holes in semiconductors like CZT, detectors need to withstand an extremely high X-ray flux of up to 100 Mcps/mm2 [22], as a result, the pixel size needs to be as small as 100μm or even smaller, leading to a significant charge sharing effect between adjacent pixels, which distorts the energy spectrum response function of the detector. Meanwhile, the fabrication process of CdTe/CZT crystals is complex [23], with high production difficulties and low yield of quality products. The K-fluorescence influence is another adverse effect of CdTe/CZT [24]. The characteristic photons emitted from the K-shell when a primary x-ray photon is photoabsorbed can travel far enough to deposit their energy in neighboring pixels, particularly if the pixels are submillimeter-sized, resulting in double counting [25]. In recent years, SiPM based detectors have been widely used in nuclear medicine imaging systems due to their high detection efficiency, low dark count rate, and high sensor gain [26–28], such as single photon emission computed tomography (SPECT) and positron emission tomography (PET). The manufacturing process of SiPM detectors coupled with YSO is well-established and offers a cost advantage compared to CdTe/CZT detectors. Furthermore, a notable advantage of scintillation detectors lies in their reliance on light transport rather than charge transport, thereby mitigating concerns associated with charge sharing, charge trapping, and polarization [29, 30]. Therefore, the achievement of stable and reliable performance over extended durations is more feasible, as evidenced by the widespread utilization of scintillation detectors in PET and SPECT.
Due to the non-ideal detected spectrum influenced by pulse pile-up and fluorescence emission of the detectors, direct reconstruction from the detected spectrum without any calibration will yield inaccurate LAC results [21, 32]. One method is to model the non-ideal factors of the photon-counting detector, and then use the basis material decomposition image to synthesize the virtual monochromatic image [5, 34]. Another widely used method is the empirical method of direct polynomial fitting to synthesize virtual monochromatic images without the x-ray spectra and the response function of the detector [35–39].
Previously, we have developed a photon-counting X-ray detector using SiPM and FPGA-only MVT digitizer [40] and developed the photon-counting X-ray security inspection imaging system using an MVT digitizer based on a time-varied threshold [41]. However, previous research has predominantly focused on transmission imaging which only allows for basic material classification of scanned objects based on projection values, while our current study aims to develop a benchtop photon-counting CT system capable of conducting experimental two-dimensional imaging of scanned objects and evaluate its performance in synthesizing virtual monochromatic images. We utilized empirical virtual monochromatic image synthesis through polynomial fitting to accurately estimate the linear attenuation coefficients. The accuracy of this method was evaluated by comparing reconstructed images with reference images in terms of MRE and MSE.
Methods
In this section, we describe the theoretical background and implementation of the empirical virtual monochromatic image synthesis technique developed in the YSO/SiPM based prototype system for dual-material experiments, K-edge imaging experiments, and rat biological soft-tissue imaging experiments. Also, we will provide details on phantoms and algorithm implementation.
Image acquisition
The DexScaner L103 detector
The DexScaner L103 photon-counting X-ray detector (manufactured by Suzhou Raymeasure Medical Technology Co, Ltd.) has 64 channels with a pixel pitch of 1.6 mm, and it utilizes four constant thresholds and comparators to sort the pulse energy into corresponding energy bins (Fig. 1). It consists of a scintillation detector unit and an MVT digitizer unit. The scintillation detector unit consists of a 1×4 array of YSO/SiPM detector blocks, and each YSO/SiPM detector consists of a 1×16 YSO array and a 1×16 SiPM array which is coupled one by one. The YSO array is manufactured by Suzhou JT Crystal Technology and the SiPM is FC10035 from SensL, and the YSO array consists of 1.2×1.2×5 mm3 crystals with a 0.4 mm gap.

DexScanner L103 detector.
The MVT digitizer unit utilizes two FPGA-only MVT digitizer boards, each of which provides 32 sampling scintillation pulses, unlike ADCs, the MVT method takes timing samples concerning the amplitude. In our previous work, we demonstrated an FPGA-only MVT digitizer based on this method and developed several modularized PET detectors. Based on the MVT method, a digitizer could be easily implemented using voltage comparators and time-to-digital converters.
As is shown in Fig. 2, the digitizer board amplifies the signal in each channel with a gain of 40 and an analog bandwidth of approximately 250 MHz before sampling. After amplification, the pulse is divided into four channels, each connected to a positive end of the Low Voltage Differential Signal (LVDS I/O in the FPGA. The opposing end of the LVDS I/O in the FPGA is connected to a DAC channel, allowing for separate settings of the voltage thresholds. However, it is necessary to calibrate the bias voltage between the thresholds and the applied voltage when using the LVDS I/O as a voltage comparator. The output signal from the LVDS is connected directly to a module for time measurement and event identification. In this module, a valid event is identified as a pulse that exceeds the lowest threshold and has a duration above the threshold for at least 5 ns. A module for pulse counting is utilized to tally and produce the count of verified events within a specified time interval.
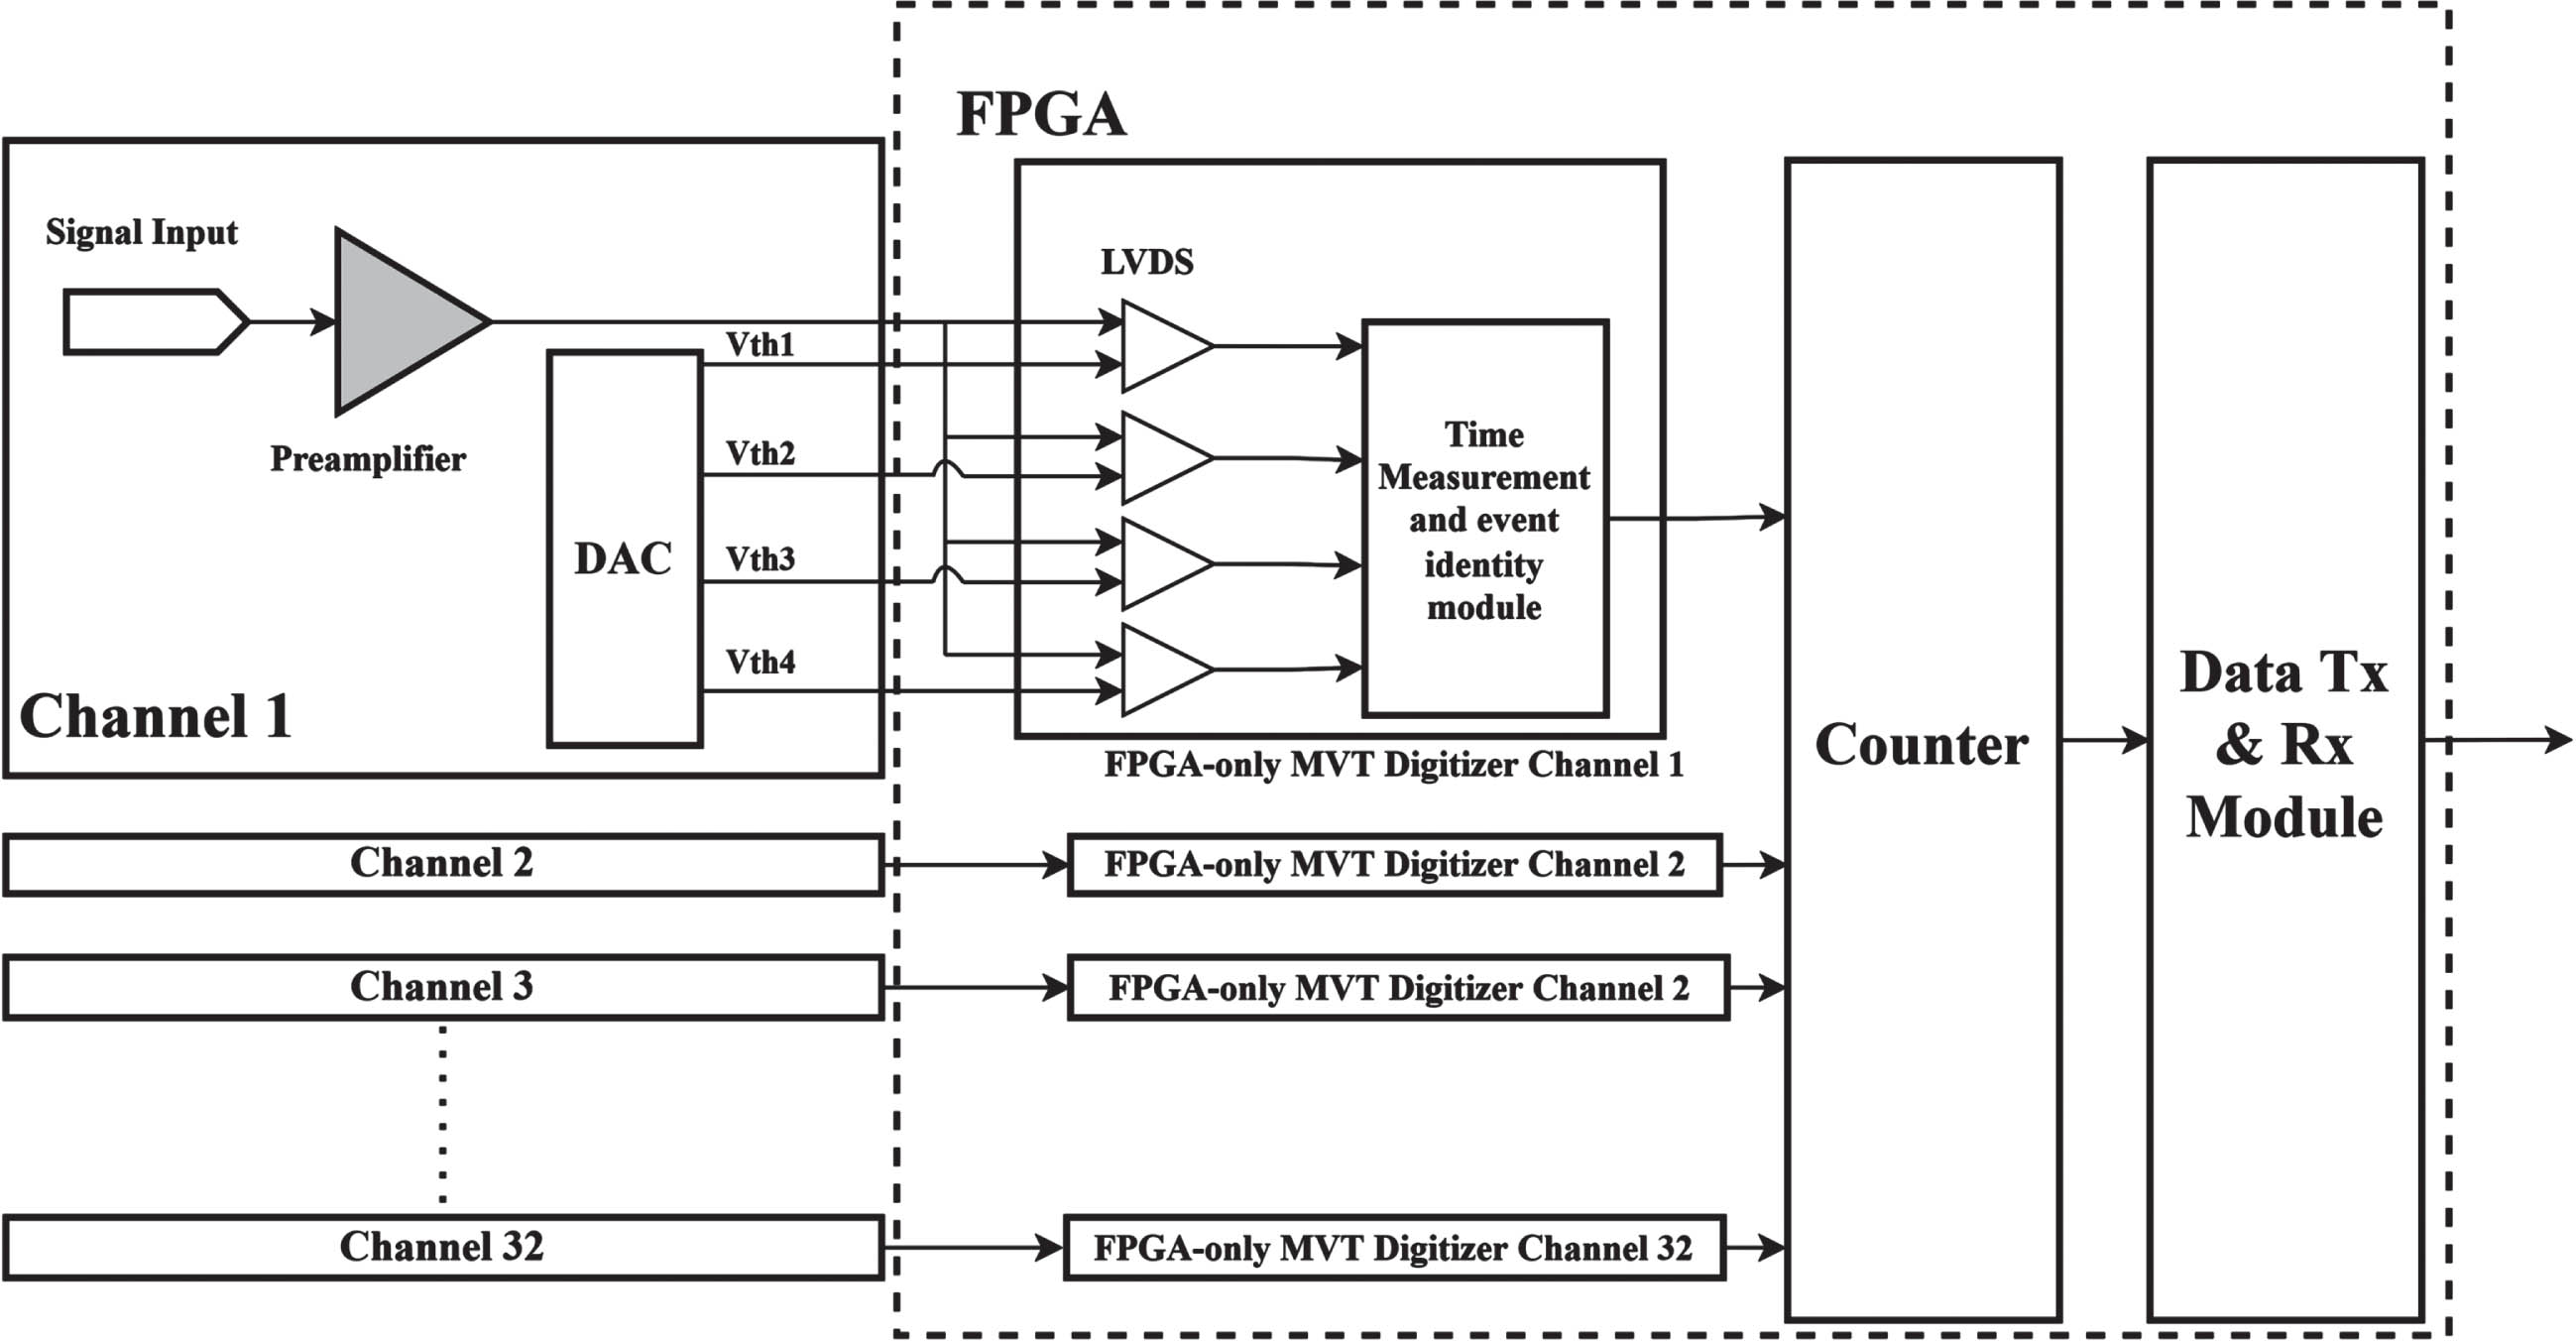
The schematic of the FPGA-only MVT digitizer unit.
As is shown in Fig. 3, a photon-counting CT system was set up using the DexScaner L103 photon-counting X-ray detector. Tomographic measurements were conducted using an experimental photon-counting CT scanner that operated on a direct-drive rotating gantry. The system was designed with a microfocus x-ray source (Hamamatsu L9181-02), incorporating the source-to-detector distance of 271 mm and the source-to-object distance of 135 mm. The linear detector had a pixel matrix of 1×128, with each native pixel measuring 1.6×1.6 mm2. By employing a magnification factor of approximately 2.0, an effective pixel size of 0.8×0.8 mm2 was attained.The tube anode current and voltage were configured at 20μA and 75 kVp for dual-material calibration experiments, 60μA and 59 kVp for the K-edge imaging experiment, and 10μA and 90 kVp for rat biological specimens experiments. In all experiments, we acquired the projection through a full rotation with the step angle of 0.6667° to get the sinogram of different energy bins for photon-counting CT image reconstruction. We set an aluminum filter with a thickness of 0.5 mm to reduce the beam-hardening effect.
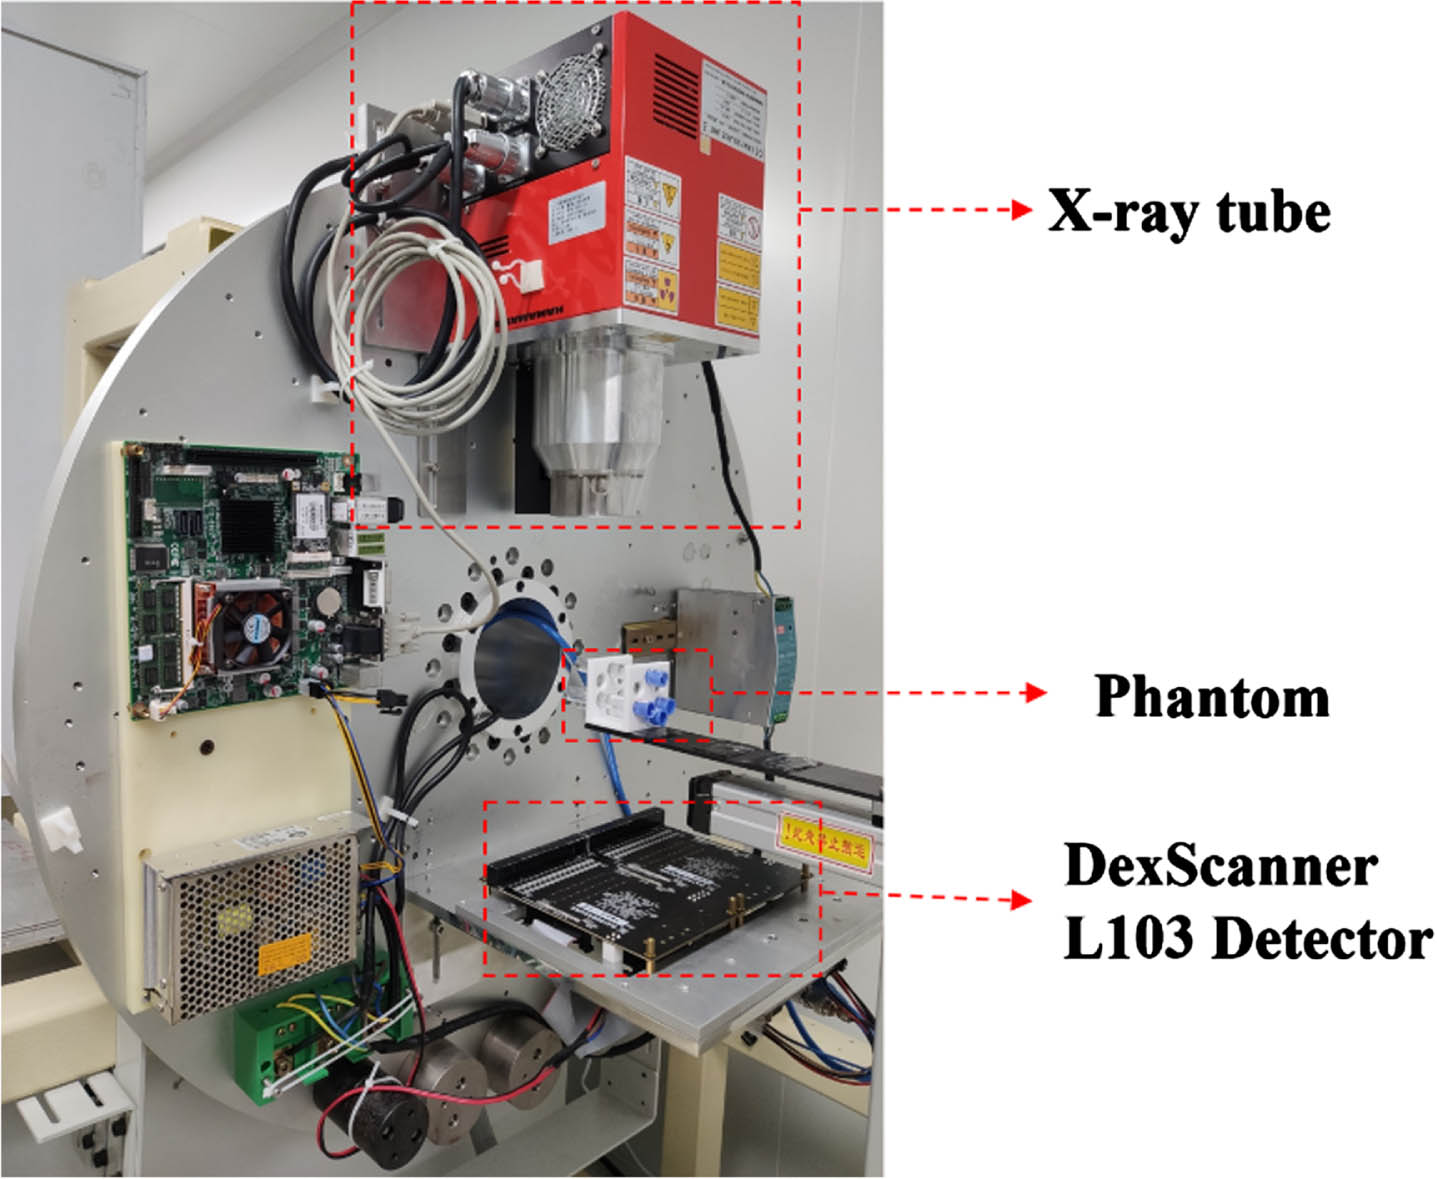
Photograph of the pre-clinical photon-counting CT system used for this study.
Let p
i
be the desired virtual monochromatic images, and q
j
the sinogram image of different energy bins.
D is a series linear combination of the column polynomial basis function and the weighted coefficients are c
n
:
And let the polynomials
Our goal is to find the calibration coefficients
The target image μ
i
(r) is a priori knowledge of the linear attenuation coefficient using the following formula:
The variable α is introduced to account for the presence of air in the region, albeit with limited significance, and the values of boundary pixels, which remain unknown, are therefore disregarded by assigning them a weight of zero.
The algorithm implementation of empirical virtual monochromatic image synthesis can be summarized as follows: Step 1. Different sinogram images q1, q2, q3 of low, middle, and high energy bins were obtained by CT scanning of the calibration phantom. Step 2. Reconstruct the low, middle, and high images directly from the q1, q2, and q3 sinogram images. The real position of the calibration module is determined according to the reconstructed image, then an appropriate weight for air, ranging from 0 to 1, and obtain the weight image according to the formula (6). Step 3. Obtain the accurate mass attenuation coefficients of the calibration phantom from an open source package using the mass fraction percentage of the elemental as inputs, and obtain the target image according to the formula (5). Step 4. Set polynomial order K = L=M=3, a set of projections is obtained by a polynomial combination of low, middle, and high energy projections b
n
(q1, q2, q3). Step 5. Perform reconstruction of the projected data after the polynomial combination via conventional cone-beam FDK [43] with Shepp-Logan filtering, then get a set of polynomial basis image images fi. Step 6. According to the objective function in Eq. (4), three sets of polynomial coefficients are obtained by the Least Squares Method. Step 7. Reconstruct the test phantom image using the EVMIS. Firstly, a set of polynomial basis image images is obtained by following steps 1, 4, and 5, Then, the polynomial coefficients obtained in step 6 of the calibration phantom are applied to the group of reconstructed images. Thus get the final virtual monochromatic images under Energy E1, E2, and E3.
Evaluation of the accuracy of virtual monochromatic images
The MRE of each material linear attenuation coefficient was calculated to compare the attenuation distribution of each material reconstructed by EVMIS and the real attenuation coefficient. The MRE is defined as follows:
MSE represents the similarity between the reconstructed virtual monochromatic and reference images. The MSE is defined as follows:
Dual-material experiments
In the dual-material experiment, three energy windows of the photon-counting detector were set at [30,45 keV], [45,60 keV], and [60,75 keV]. The target virtual monochromatic images were selected as 37, 52 keV, and 67 keV. We conducted calibration experiments to obtain polynomial fitting coefficients and then conducted test experiments to verify the effectiveness of the EVMIS method. Without the knowledge of X-ray spectra and the response function of the photon-counting detector at the test phantom, we could reconstruct the virtual monochromatic images only using the polynomial fitting coefficients. Further, we verified the stability of our detector by testing the accuracy of the linear attenuation coefficient recovery from the experimental results.
K-edge imaging experiments
To further evaluate the detector’s performance, materials with the K-edge phenomenon were added. In the K-edge imaging experiment, we also conducted calibration experiments to obtain polynomial fitting coefficients and then conducted test experiments to verify the effectiveness of the EVMIS method. Since the K-edge energy of the iodine element is about 33.2 keV, the three energy windows of the photon counting detector were set as [22, 33], [33, 46], and [46, 59] keV, respectively. The target virtual monochromatic images were selected as 26, 39 keV, and 52 keV.
Rat biological soft-tissue imaging experiments
To further evaluate the quantitative imaging capabilities of the detector in complex biological structures, we conducted biological soft-tissue imaging experiments. Approval of all ethical and experimental procedures and protocols was granted by the Ethics Committee of the Institute of Artificial Intelligence, Hefei Comprehensive National Science Center (Approval No. IAI2024051701). In this study, we performed polymethylmethacrylate (PMMA) and aluminum (Al) calibration experiments to obtain polynomial fitting coefficients. Subsequently, we conducted imaging experiments on rat biological soft tissue to verify the effectiveness of the EVMIS method. The three energy windows of the photon-counting detector were set to [20–40 keV], [40–60 keV], and [60–90 keV] and the target virtual monochromatic images were selected as 30, 50 keV, and 75 keV.
Phantoms
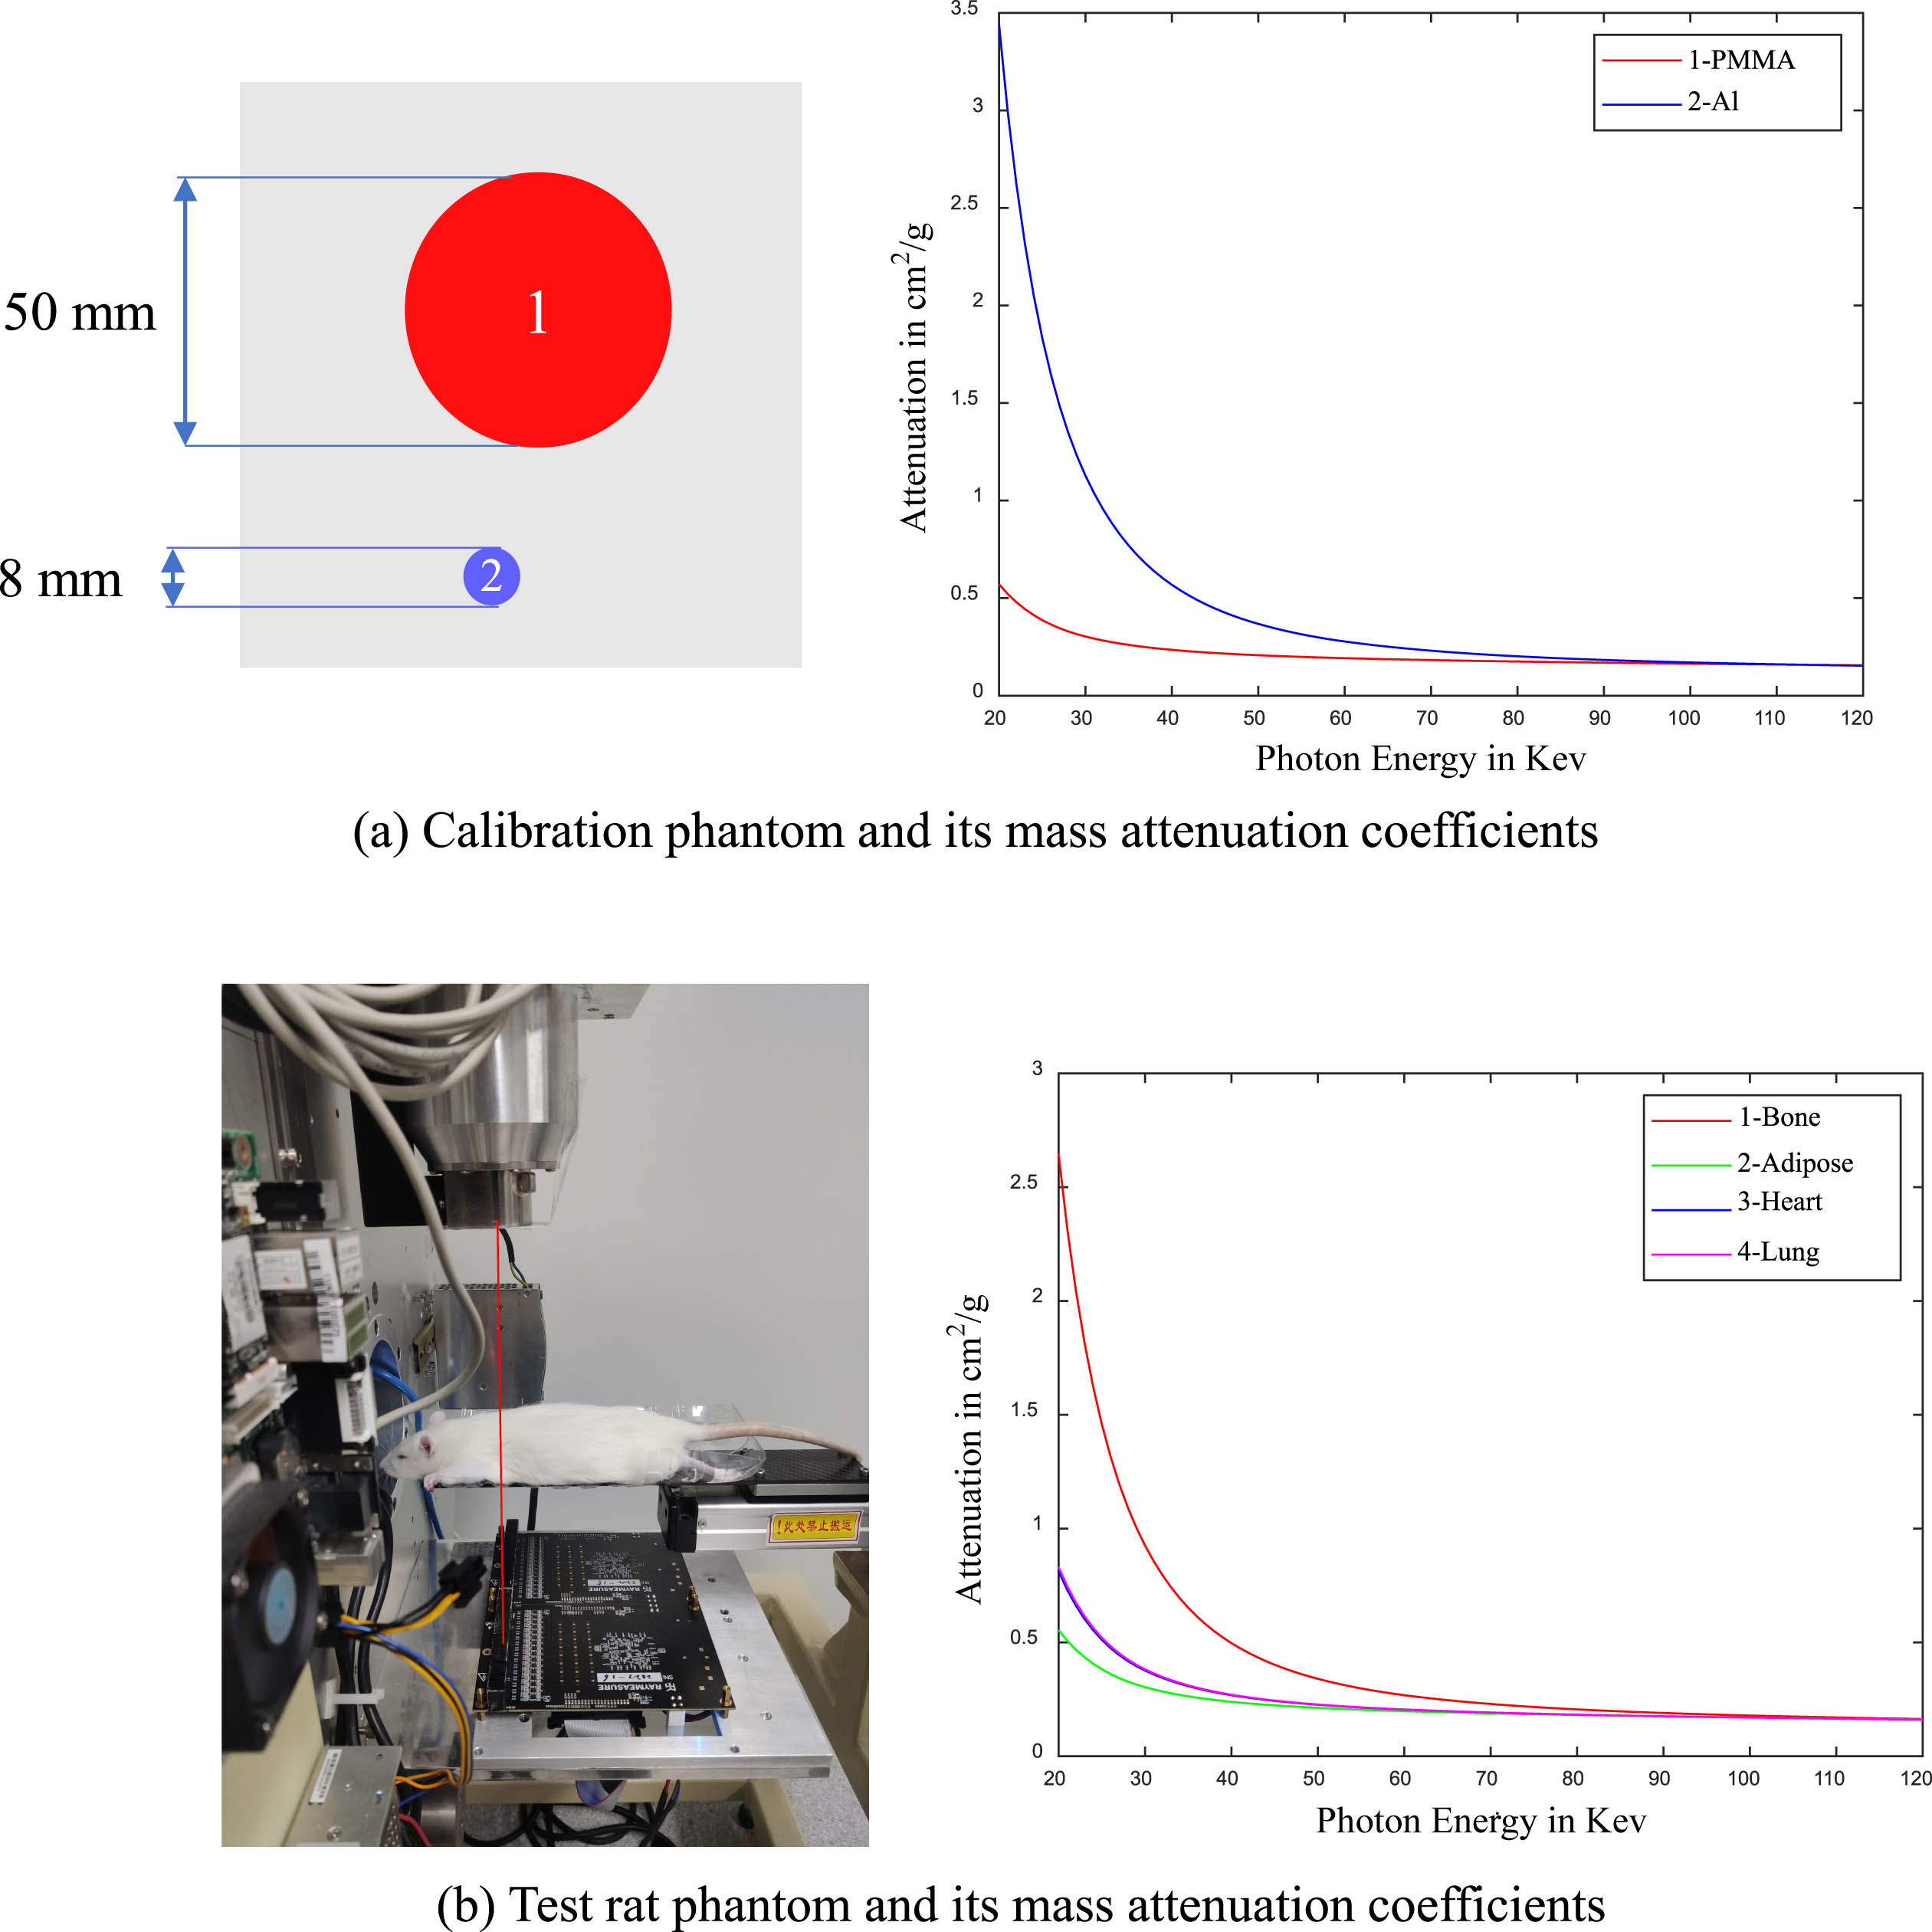
Dual material calibration, K-edge imaging experiments, and rat biological soft-tissue experiments were conducted in this study. As shown in Figs. 4–6, while the calibration phantom was used to calculate the coefficients of the polynomial fitting functions, the test phantom was used to determine the quantitative accuracy of the virtual monochromatic images. In the dual-material calibration experiments (Fig. 4), the calibration phantom was composed of four materials: ➀ H2O, ➁ 5% NaCl solution, ➂ 10% NaCl solution, and ➃ 15% NaCl solution. The test phantom was composed of three materials: ➀ H2O, ➁ 5% NaCl solution, and ➂ 10% NaCl solution. In the K-edge imaging experiments (Fig. 5), ➀ 10% Na2CO3 solution, ➁ 20% KI solution, and ➂ 20% NaCl solution were used as calibration material. We randomly selected 5% Na2CO3, 10% KI, and 15 % NaCl, and added a fourth material – water as the test phantom.
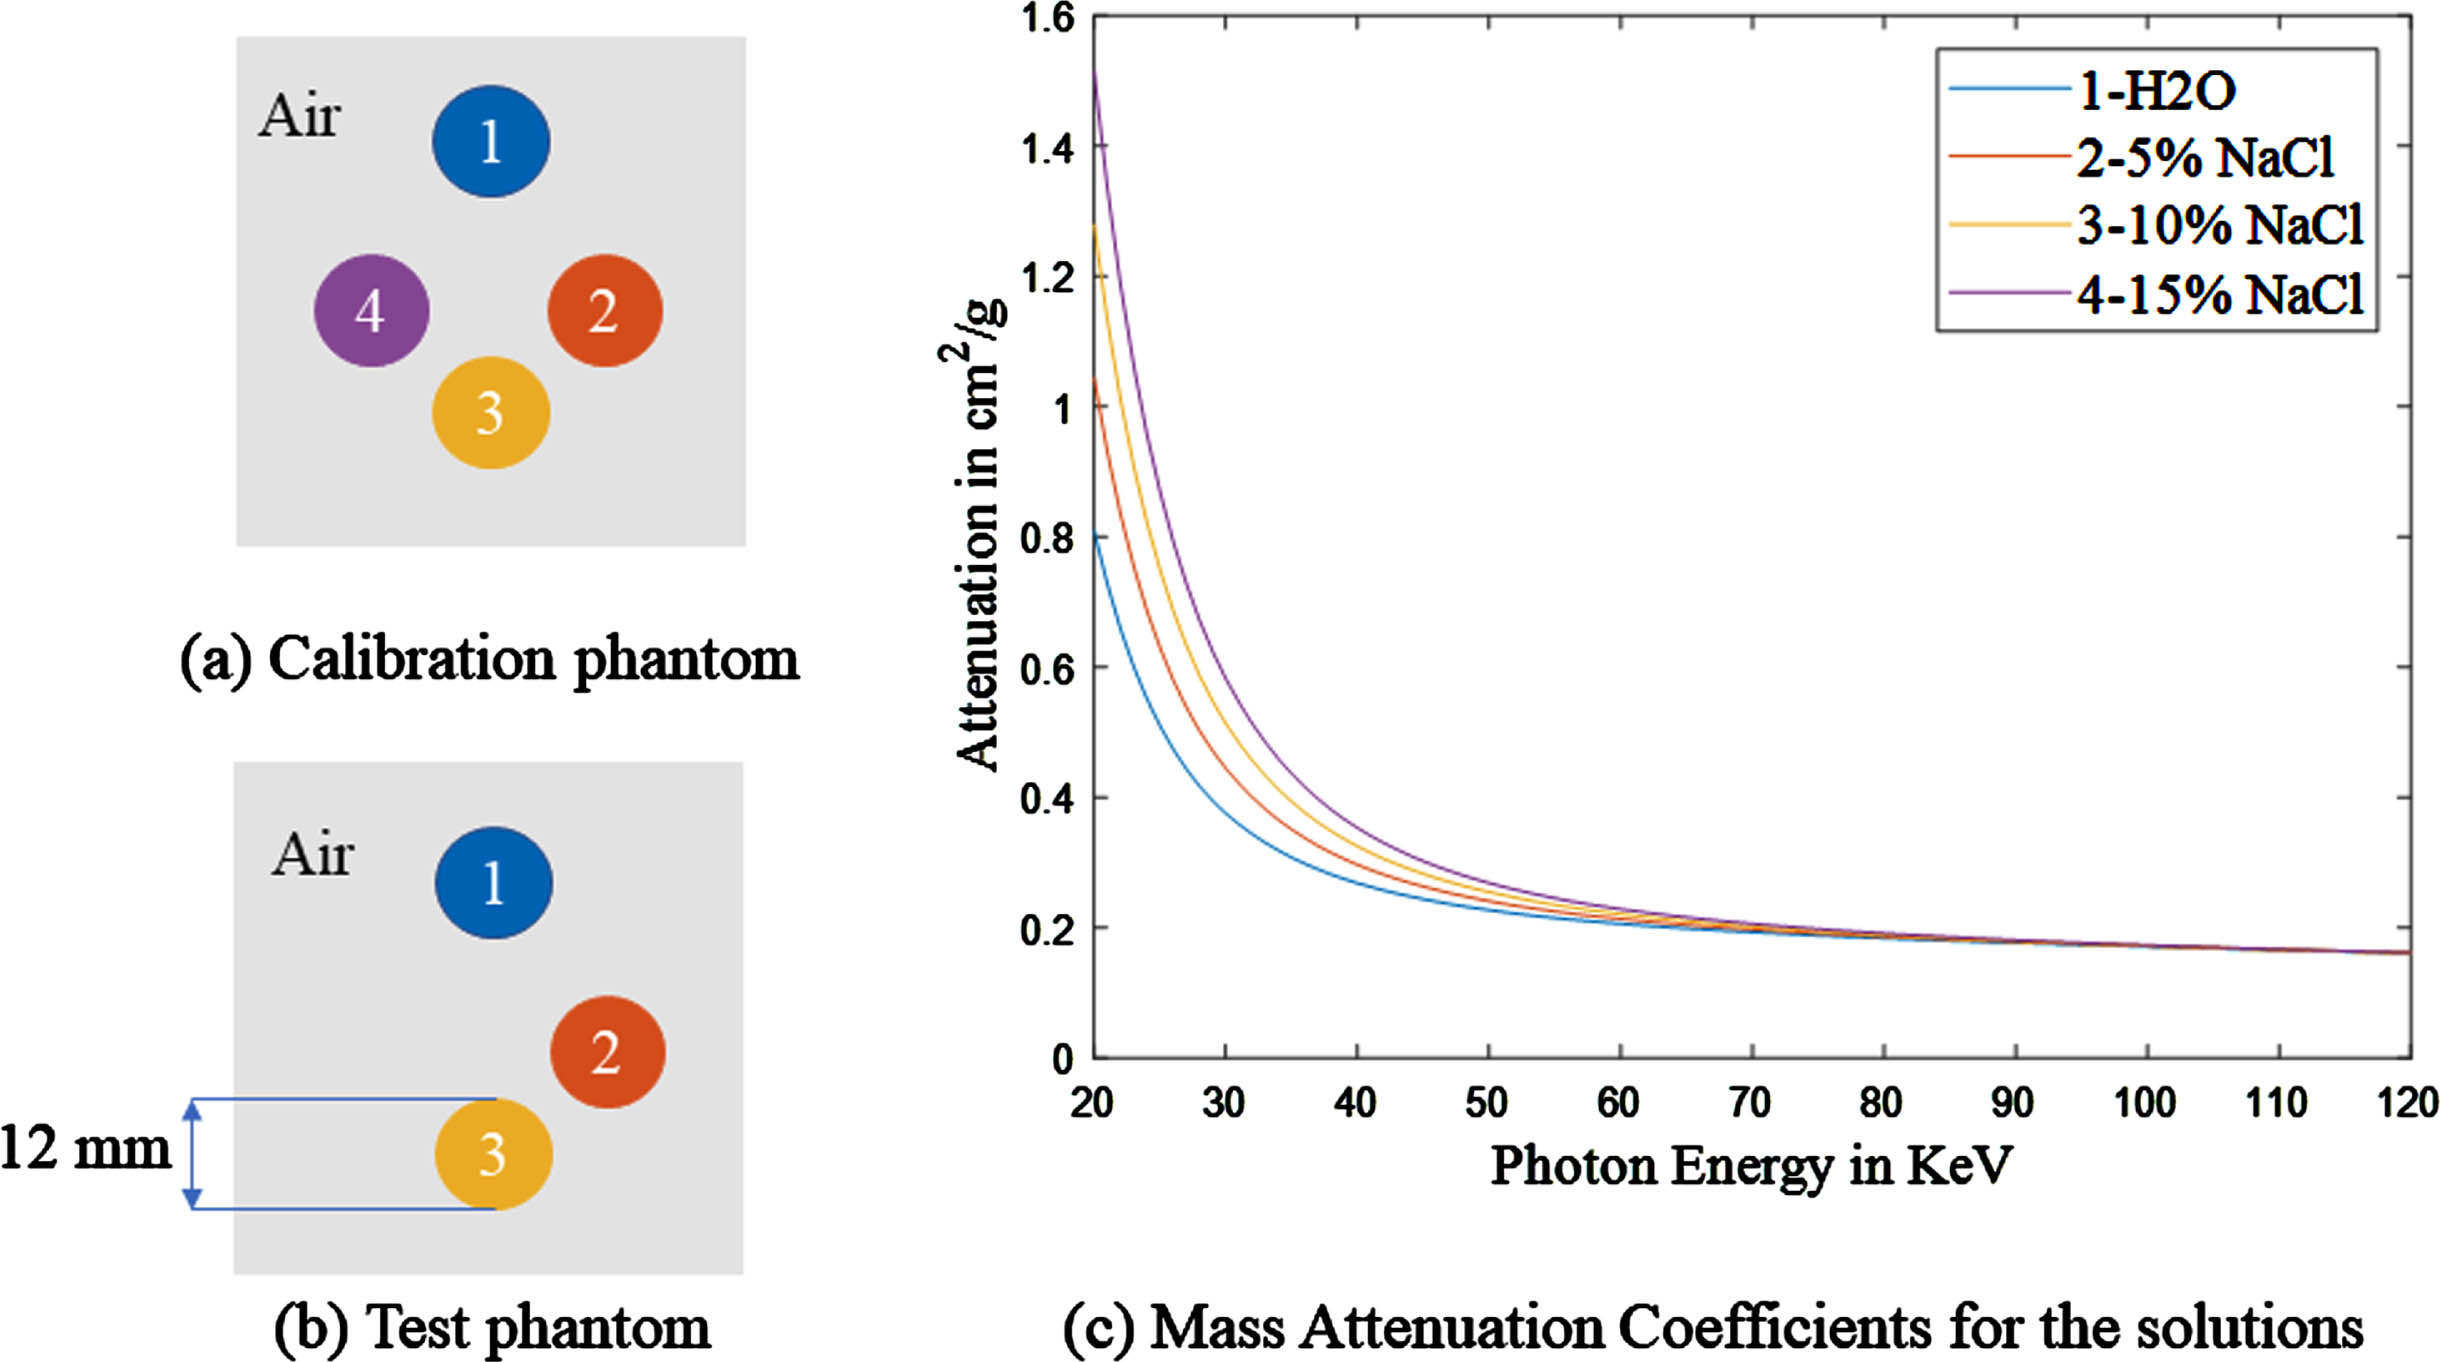
Dual-material calibration experiments.
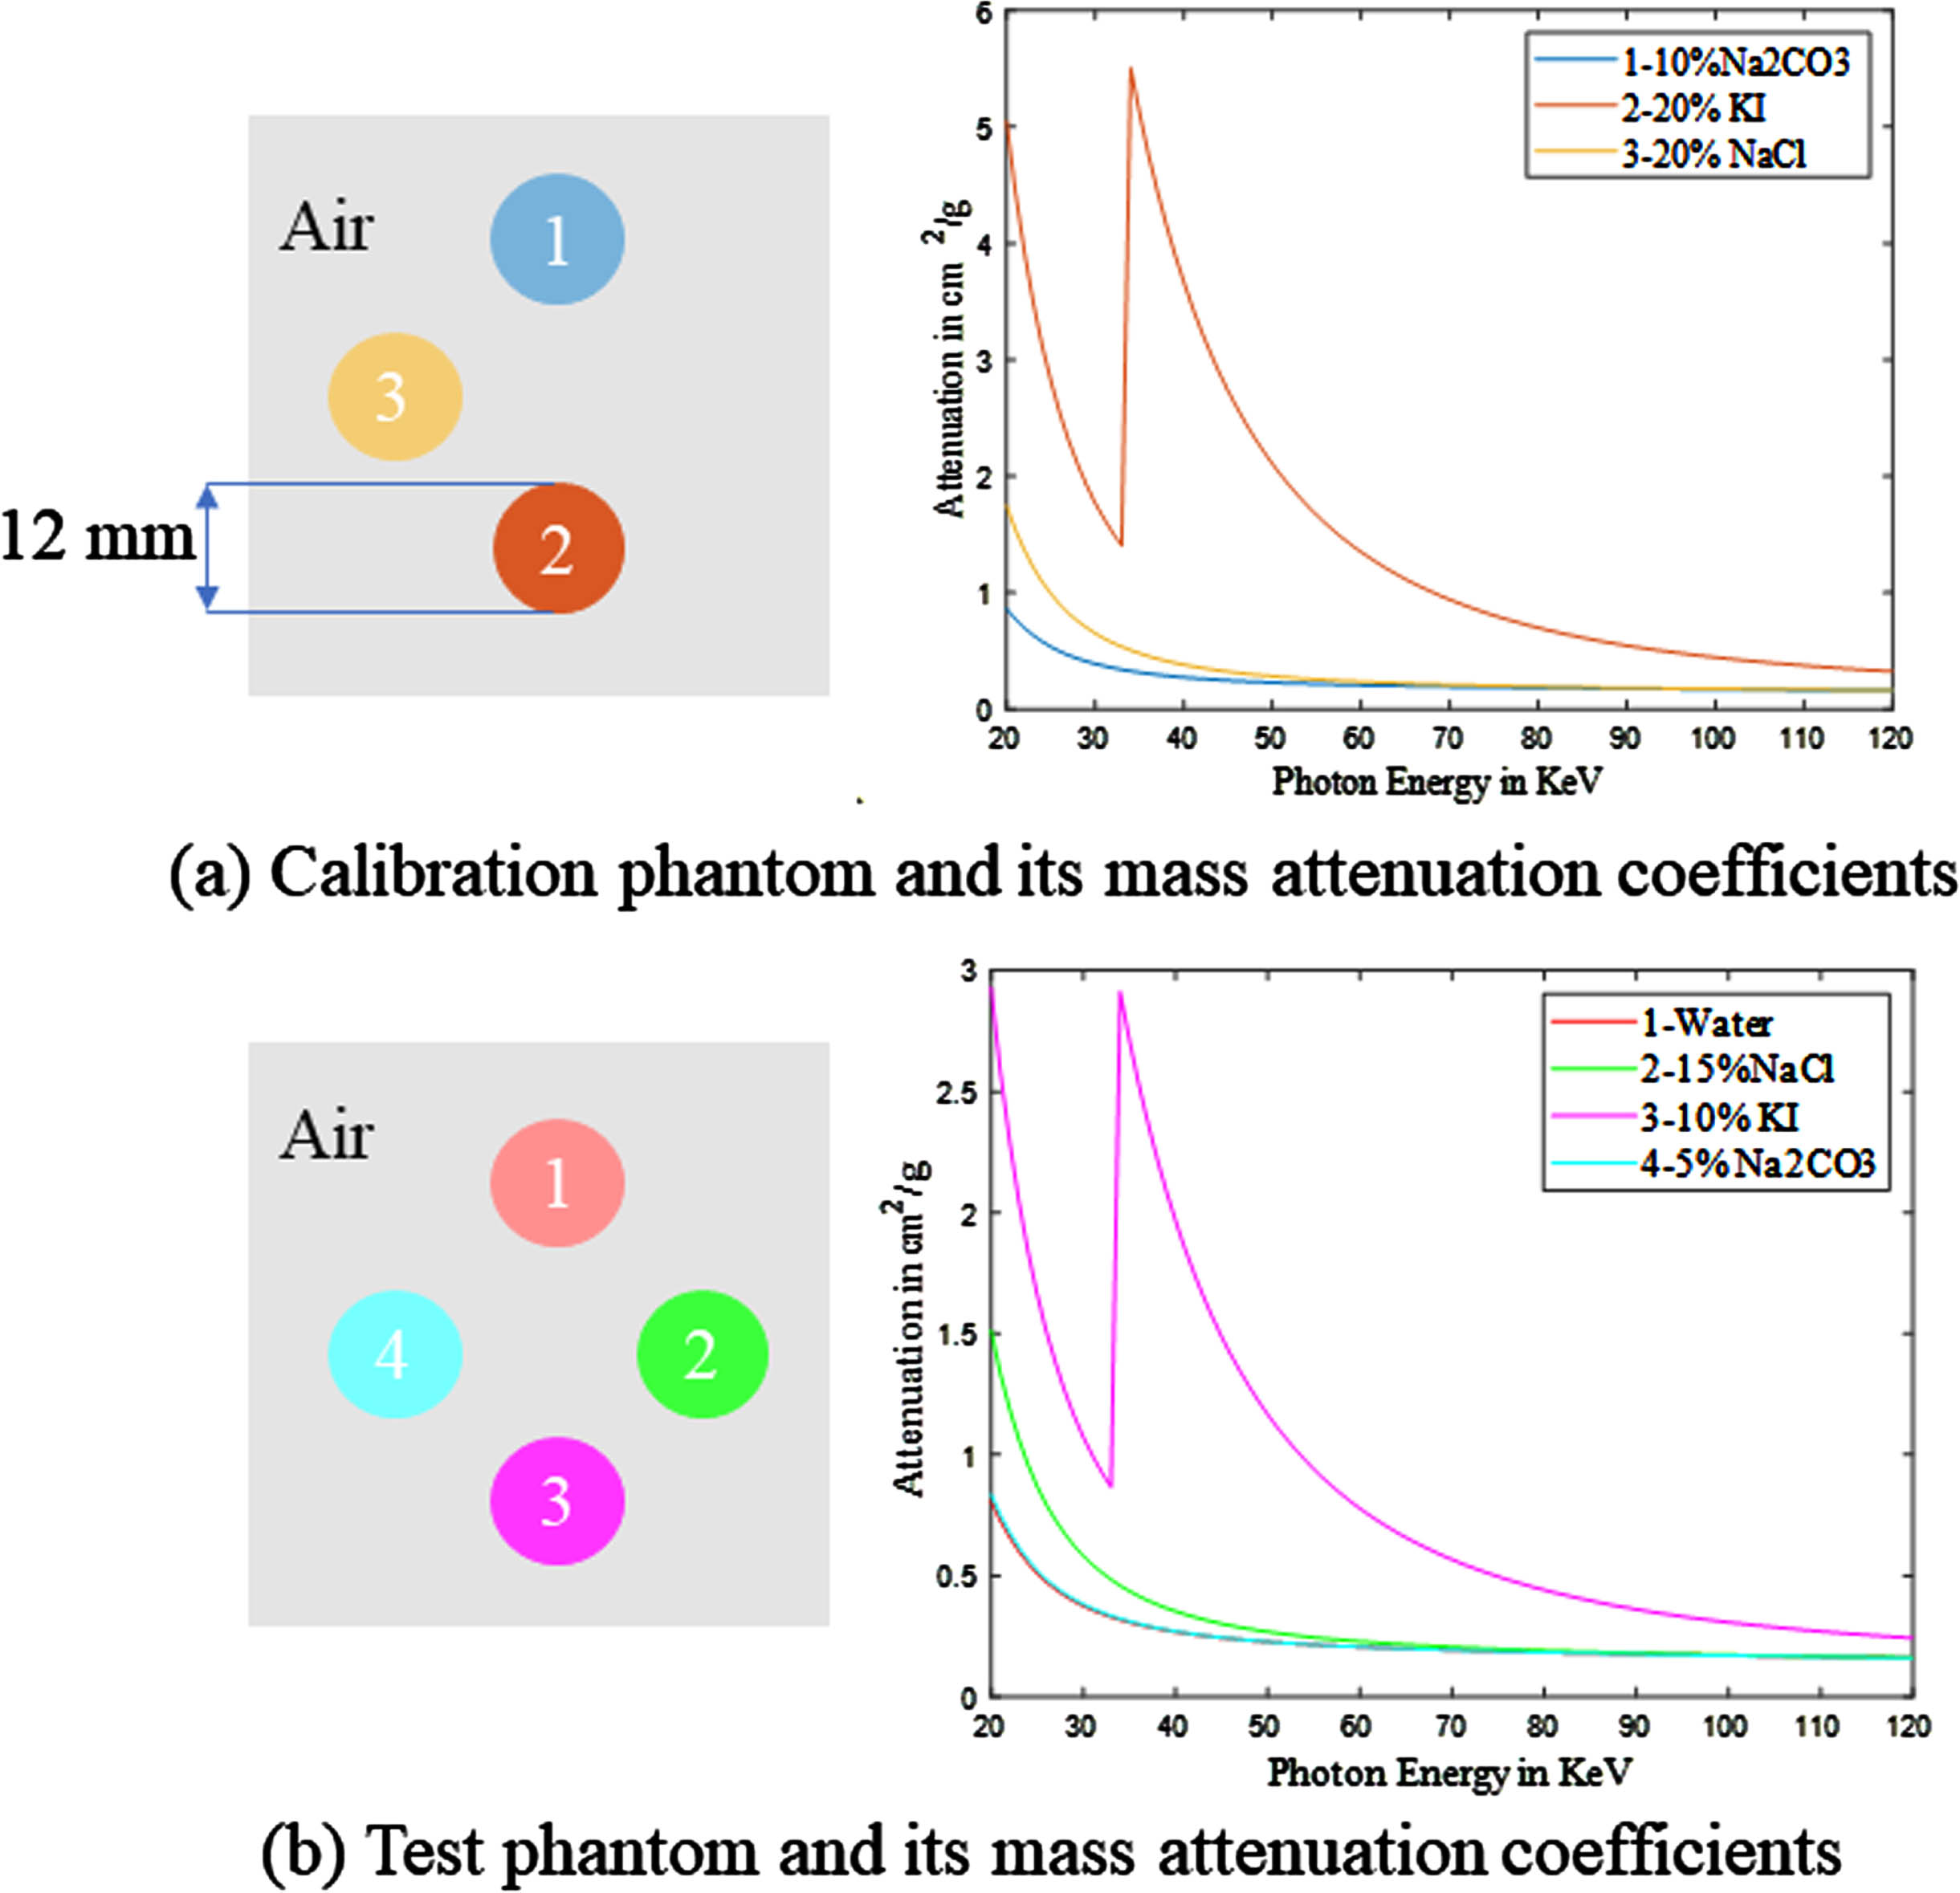
K-edge imaging experiments.
When utilizing the EVMIS method to synthesize virtual monochromatic images of rats (Fig. 6), the calibration of the photon-counting system necessitates careful consideration of two key aspects of the calibration phantom: its constituent materials and the geometric configuration along with its dimensions. Given the comparable attenuation properties to those observed in rats, PMMA and Al are deemed suitable basis materials due to their similarity in behavior to soft and bone tissue. The longest path length is defined by the length of the rat. The cylinder diameter is therefore determined by the composition of the rat along the longitudinal axis. Approximately, this would result in 50 mm soft tissue (replaced with PMMA) and 8 mm bone (replaced with Al).In the rat biological soft-tissue imaging experiments, the components and their mass attenuation coefficients of rat biological tissues (bone, adipose, heart, lung) are sourced from the XCOM database [44].
Rat biological specimens experiments
Dual-material imaging experiment
The directly reconstructed energy bin images are displayed in Fig. 7(a), while the weight images and the corresponding target images are shown in Fig. 7(b) and Fig. 7(c), respectively. Since the template image only included 15% NaCl solution and water, we can concurrently assess the LAC outcomes for both the 5% NaCl solution and 10% NaCl solution to represent the predictive discrepancy. We set the weight of air to 0.23, and the evaluated 5% NaCl and 10% NaCl solutions to 0. The EVMIS results are shown in Fig. 7(d), with the central profiles of the calibration phantom displayed in Fig. 7(e). The estimated polynomial weights demonstrate that calibration has achieved its objective, as the reconstructions of 5% NaCl and 15% NaCl align well with the actual LAC. Quantitative error analyses are evaluated by MRE and MSE of the local regions for all solutions (Table 1). The MRE of virtual monochromatic images at 37 keV, 52 keV, and 67 keV with a concentration of 5% NaCl were determined to be 5.28%, 0.30%, and 2.98%, respectively, while those with a concentration of 10% NaCl were found to be 0.60%,1.86%, and 2.99%.

Dual-material imaging results of calibration phantom by EVMIS. (a) The directly reconstructed Energy Bin Image. The grayscale is [0 0.5]. (b) Weight Images. The weight for air is 0.02 and for the unknown material (materials 2 and 3), it is 0. (c) Target Images. The LAC at 37 keV, 52 keV, and 67 keV for H2O and 15% NaCl ROIs. (d) The reconstructed virtual monochromatic images. (e) Profiles of (d) for different solutions along blue lines as marked in (e). Results show that the reconstructed LAC of 5% NaCl and 10% NaCl matches well with the ground truth.
Results of energy spectrum calibration using EVMIS in dual-material imaging
The calibration polynomial coefficients obtained from the dual-material imaging were utilized to reconstruct virtual monochromatic images (Fig. 8). Furthermore, a detailed comparison was conducted on the MRE and MSE of attenuation coefficients for each material (Table 2). The reconstructed monochromatic images demonstrated excellent conformity for H2O, 5% NaCl, and 10% NaCl materials, with MRE values ranging from 7.98% to 0.03% for fitting functions and MSE values ranging from 2.04×10⁻³ to 2.96×10⁻⁴ cm–2. Additionally, the detector’s measurement of the material attenuation coefficient exhibited excellent stability, as demonstrated by the calibration phantom’s matching concentration with that of the unknown material in the test phantom.
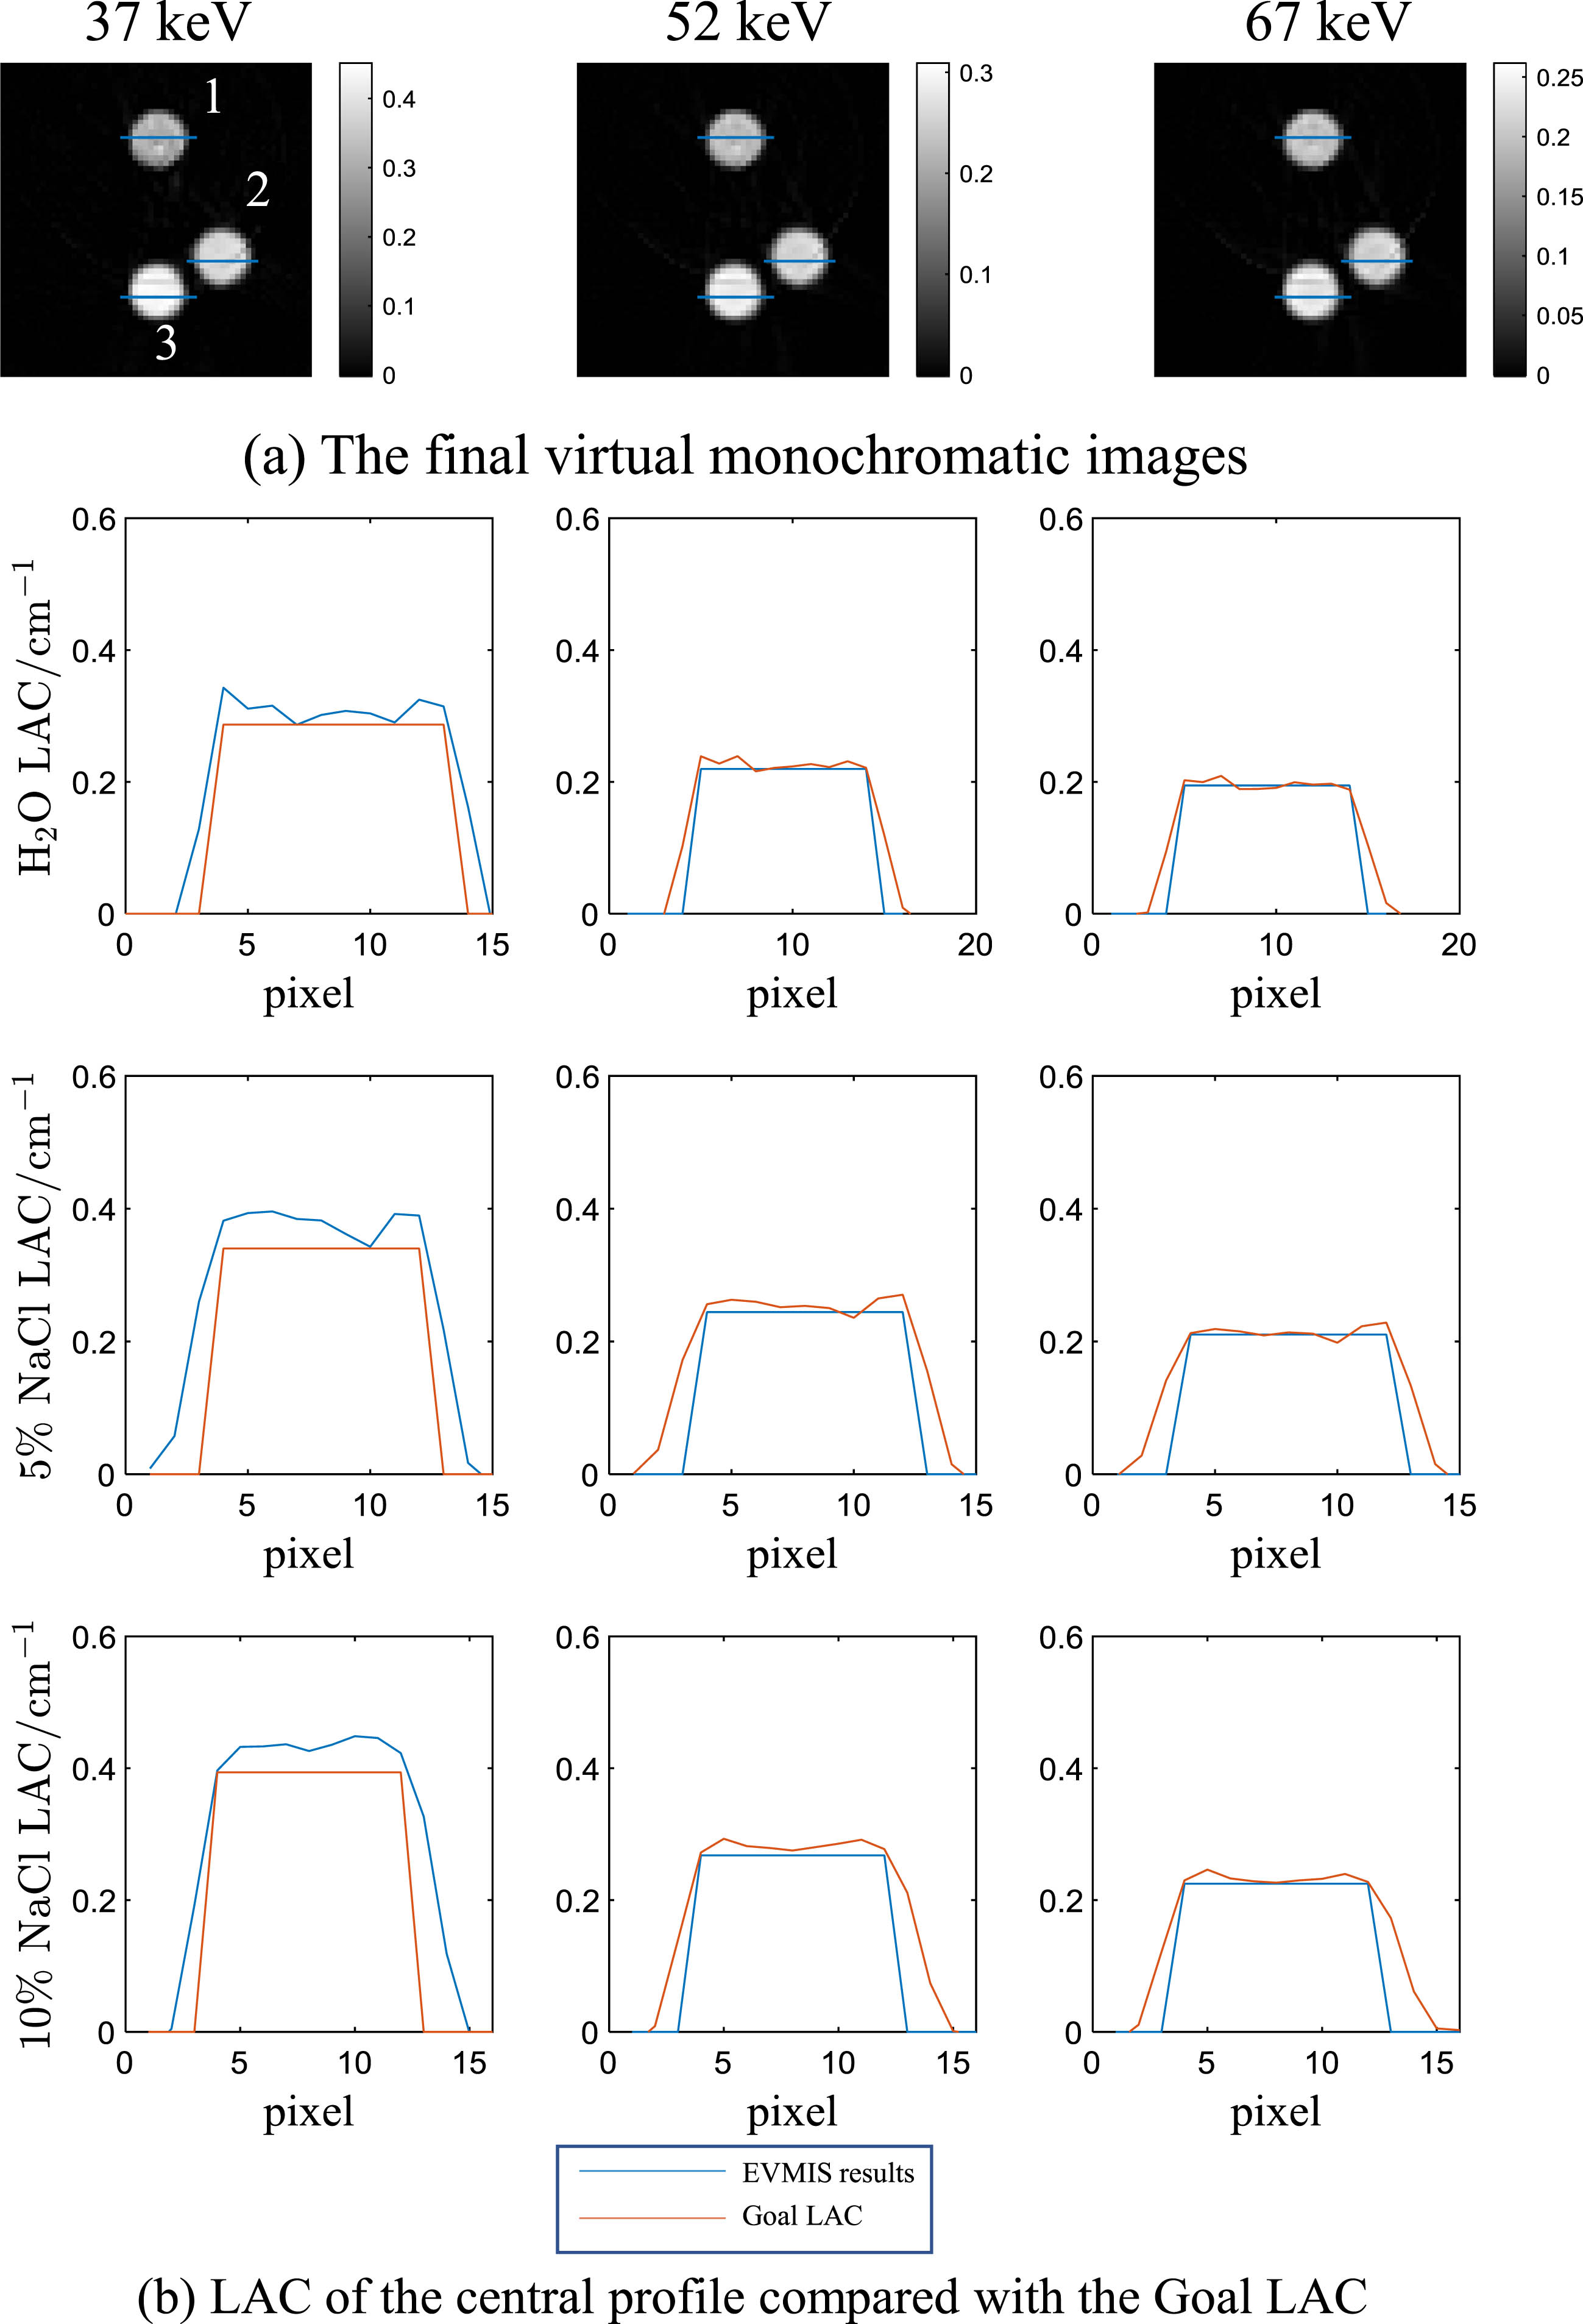
Validation of the efficacy of EVMIS from calibration of the phantom on test phantom. (a) The final virtual monochromatic images. (b) The solutions in the test phantom correspond to known truth: H2O, 5% NaCl, 10% NaCl, and 15% NaCl, respectively.
Comparison of results using EVMIS to reconstruct test phantom in dual-material imaging
The whole calibration process of K-edge imaging is shown in Fig. 9. First, a CT scan was performed on the calibration phantom to obtain three energy bin reconstruction images (as shown in Fig. 9 (a)). Based on the reconstruction results, to reduce the influence of the image edge volume effect, we set a circle weight mask (Fig. 9 (b)) with a radius slightly smaller than the object, and the three calibration material weight was 1, the air weight set as 0.11 and the weight of the test tube wall and the outer part of the FOV were 0. After obtaining the real line attenuation coefficient under the target quasi-energy, we have successfully acquired the target image (as shown in Fig. 9 (c)). Polynomial coefficients were calculated according to the calibration process steps 1–6. After that, the final virtual monochromatic images of the test phantom were reconstructed, and the EVMIS results as shown in Fig. 9 (d) with the central profiles of the calibration phantom displayed in Fig. 9(e).
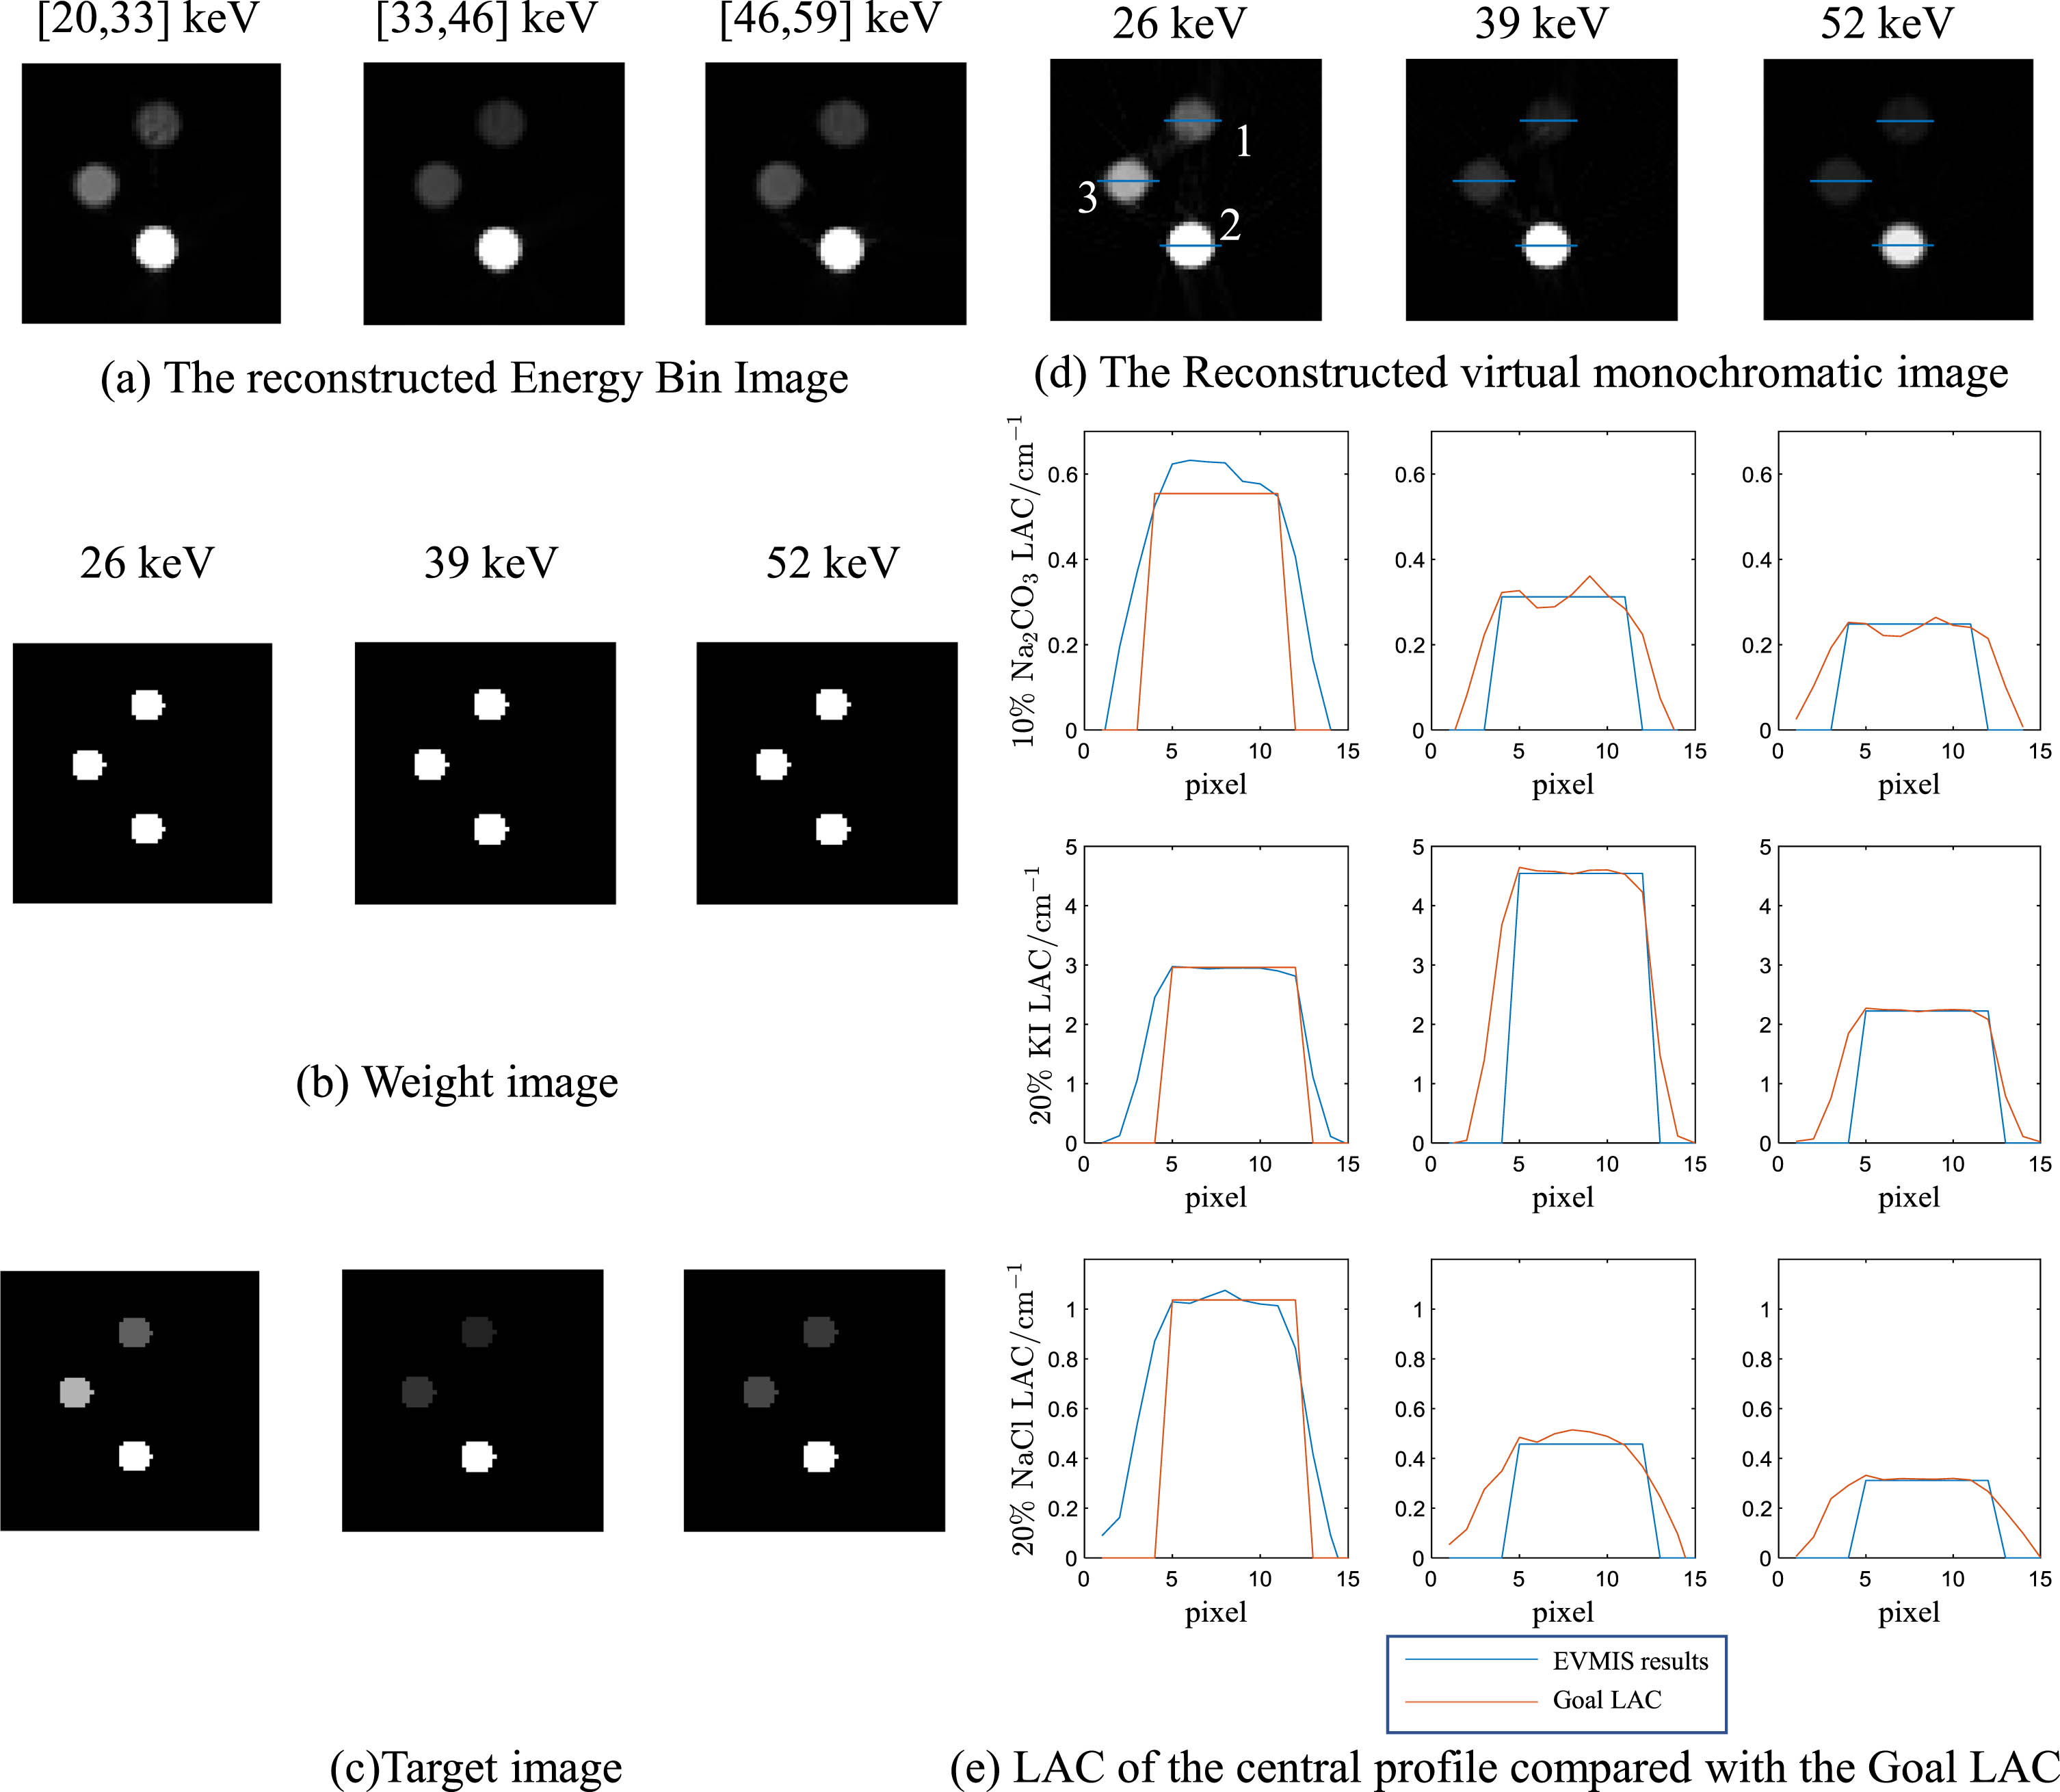
K-edge imaging results of calibration phantom by EVMIS. (a) The directly reconstructed Energy Bin Image. The grayscale is [0, 5]. (b) Weight images. The LAC was at 36 keV, 52 keV, and 67 keV for 10% Na2CO3, 20% KI, and 20% NaCl ROIs. (c) Target images. The weight of air equals 0.11. (d) The reconstructed virtual monochromatic images. (e) Profiles of (d) along blue lines. Results match well with Goal LAC.
The calibration polynomial coefficients obtained from the K-edge imaging were utilized to reconstruct virtual monochromatic images (Fig. 10). Furthermore, a detailed comparison was conducted on the MRE and MSE of attenuation coefficients for each material (Table 4). The reconstructed monochromatic images exhibited excellent conformity for H2O, 15% NaCl, 10% KI, and 5% Na2CO3 materials, with MRE values ranging from 8.54% to 0.09% for fitting functions and MSE values ranging from 2.07×10⁻³ to 2.67×10⁻⁴ cm–2. K-edge imaging experiments demonstrate that materials exhibiting the K-edge effect can be utilized for generating virtual monochromatic images through simple polynomial fitting techniques. The average error of the synthesized virtual monoenergetic images of the four test materials is 4.50% ±1.78% for low-energy 26 keV, 3.51% ±3.41% for medium-energy 39 keV, and 4.10±3.13% for high-energy 52 keV.
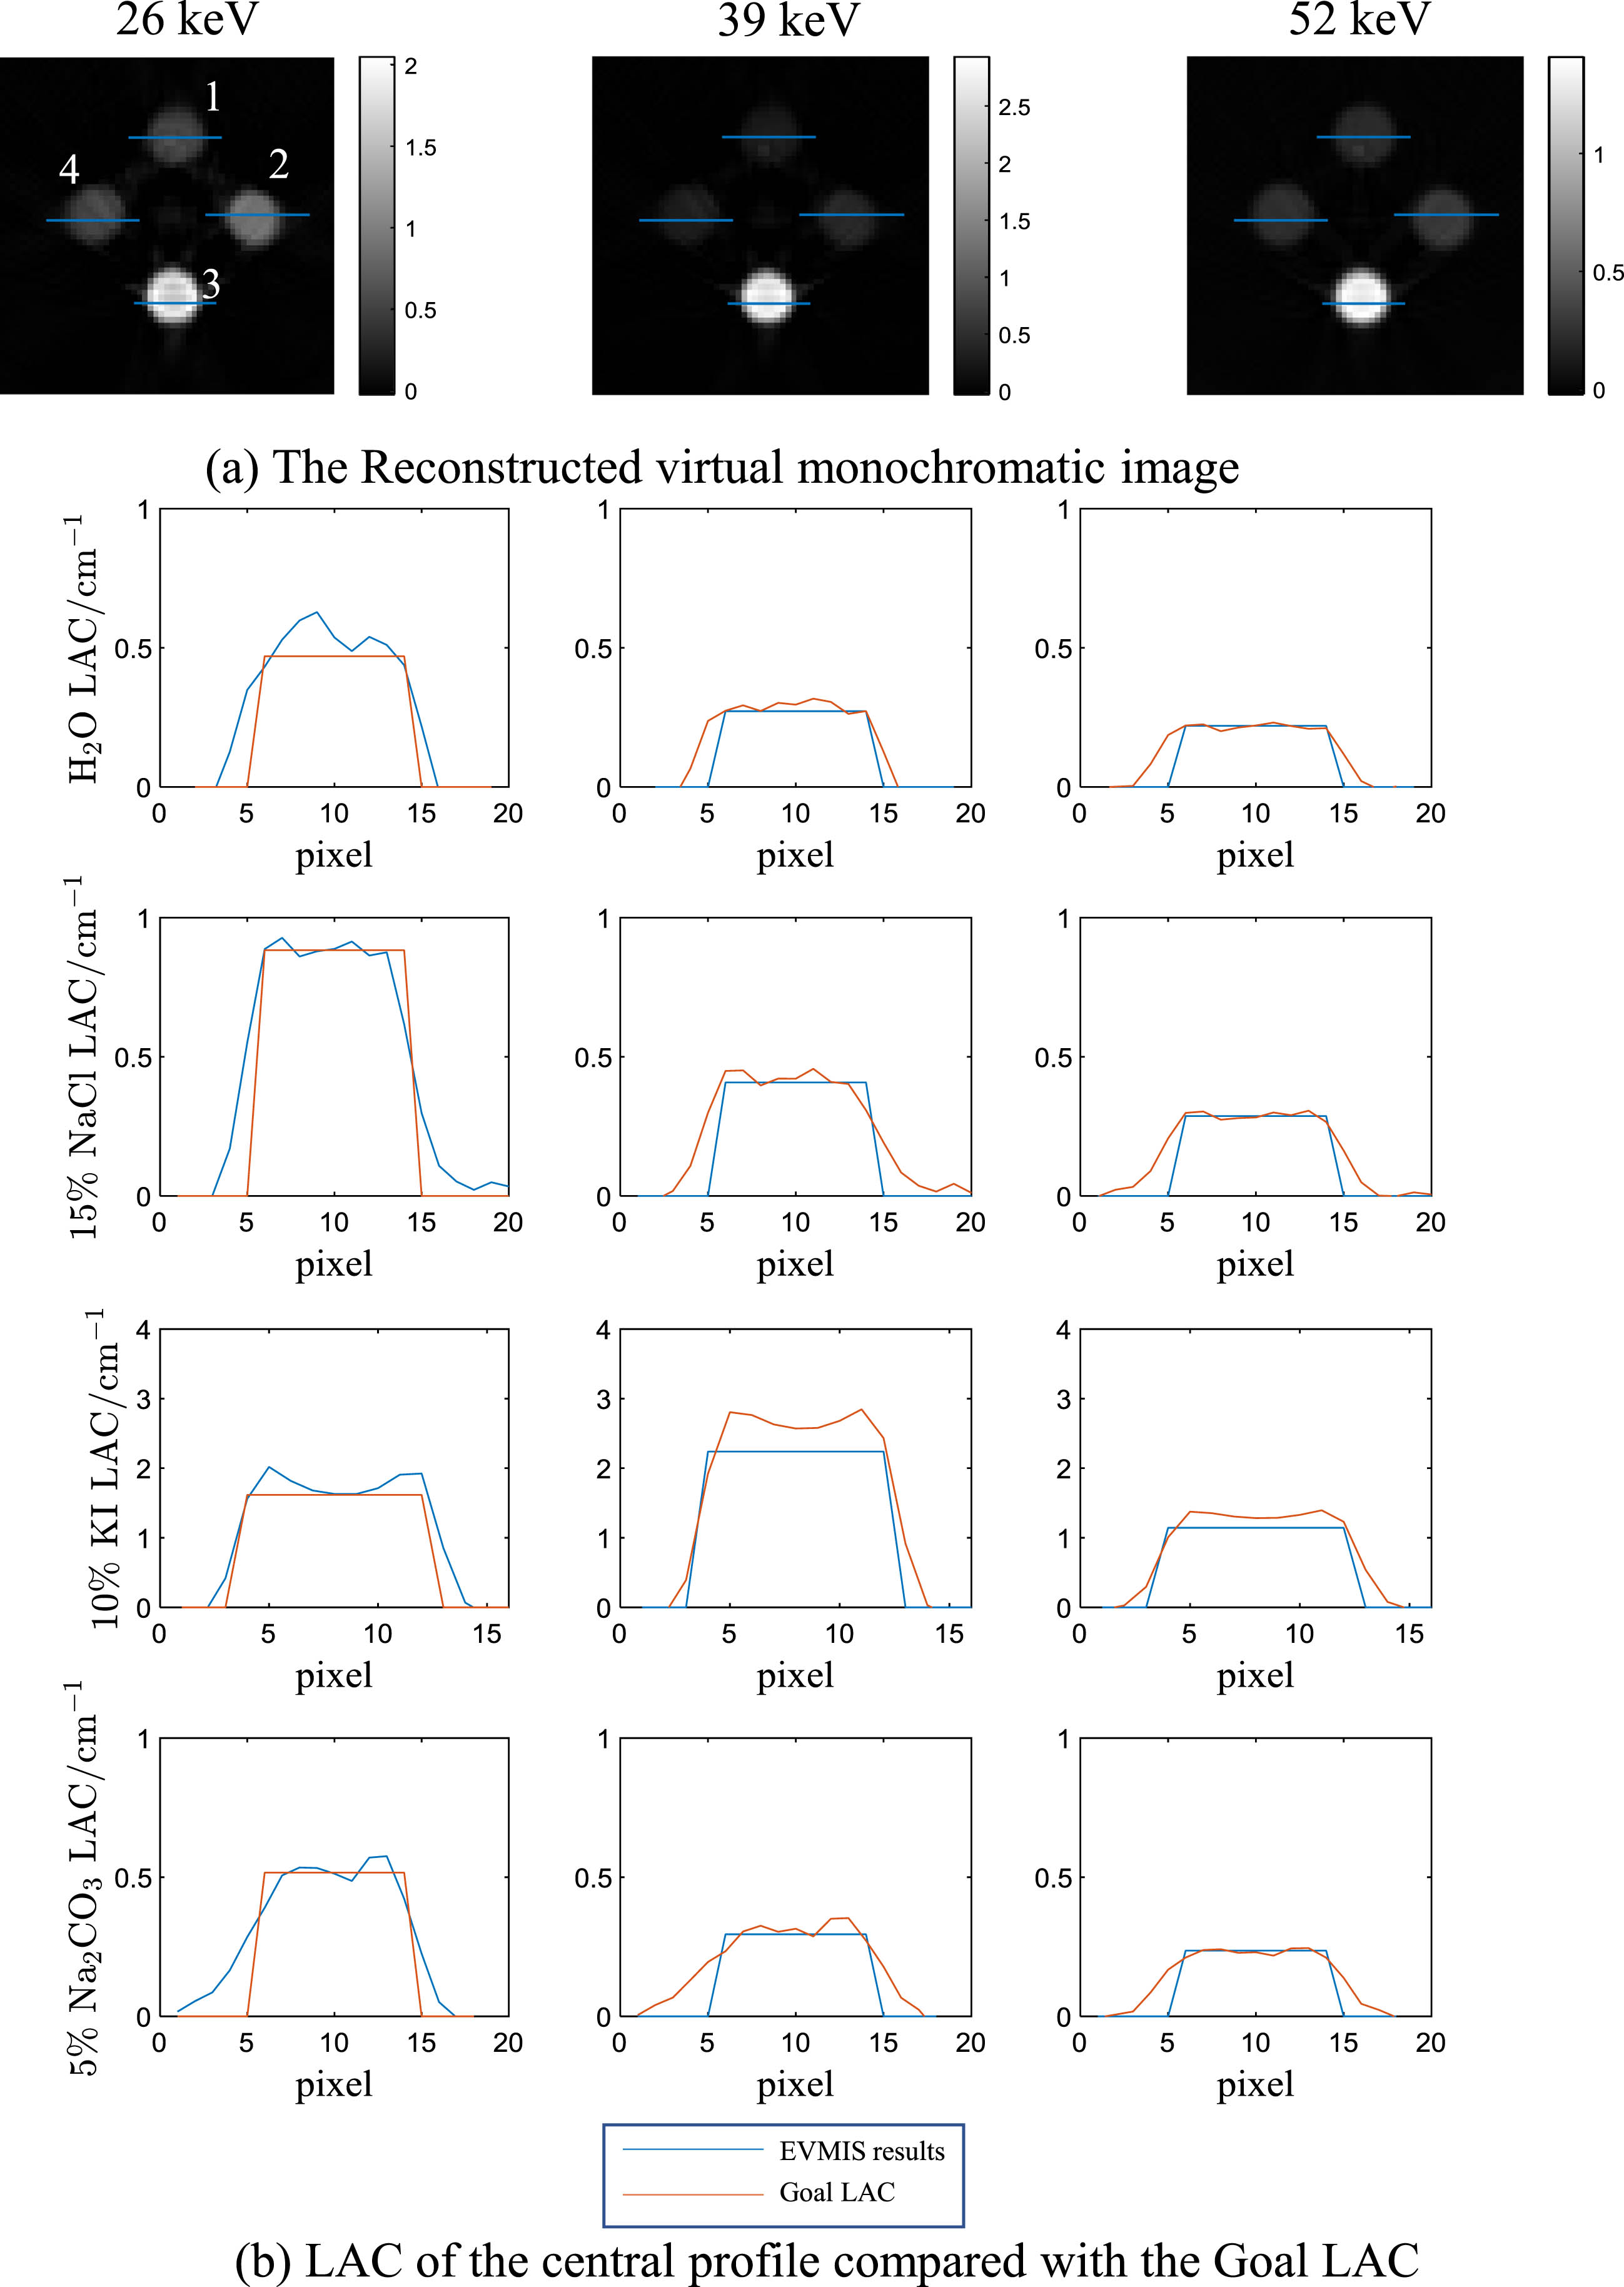
Validation of the efficacy of EVMIS from calibration of the phantom on test phantom of K-edge imaging. (a) The final virtual monochromatic images. (b) The solutions in the test phantom correspond to known truth: H2O, 15% NaCl, 10% KI, and 15% Na2CO3, respectively.
Results of energy spectrum calibration using EVMIS in K-edge imaging
Results of energy spectrum calibration using EVMIS in K-edge imaging.
The complete calibration process for rat biological soft-tissue imaging experiments is illustrated in Fig. 11. Initially, a CT scan was conducted on the PMMA and Al calibration phantom to acquire three energy bin reconstruction images (as depicted in Fig. 11 (a)). Based on the reconstruction results, to mitigate the influence of the image edge volume effect, we employed a circular weight mask (Fig. 11 (b)) with a radius slightly smaller than that of the object. The weights for the three calibration materials were set to 1, while the air weight was set to 0.20. By obtaining the actual line attenuation coefficient at the target quasi-energy, we successfully obtained the target image (as depicted in Fig. 11 (c)). Polynomial coefficients were determined through the calibration process steps 1–6. Subsequently, the final reconstructed virtual monochromatic images of the rat were obtained, and the EVMIS results are presented in Fig. 11 (d), along with the central profiles of the calibration phantom displayed in Fig. 11(e). Quantitative error analyses are conducted by evaluating the MRE and MSE of local regions for PMMA and Al phantoms (Table 5). The MRE values for virtual monochromatic images at 30 keV, 50 keV, and 75 keV with PMMA were found to be 0.10%, 0.26%, and 0.28% respectively, while those with Al were determined to be 0.07%, 0.23%, and 0.26%.
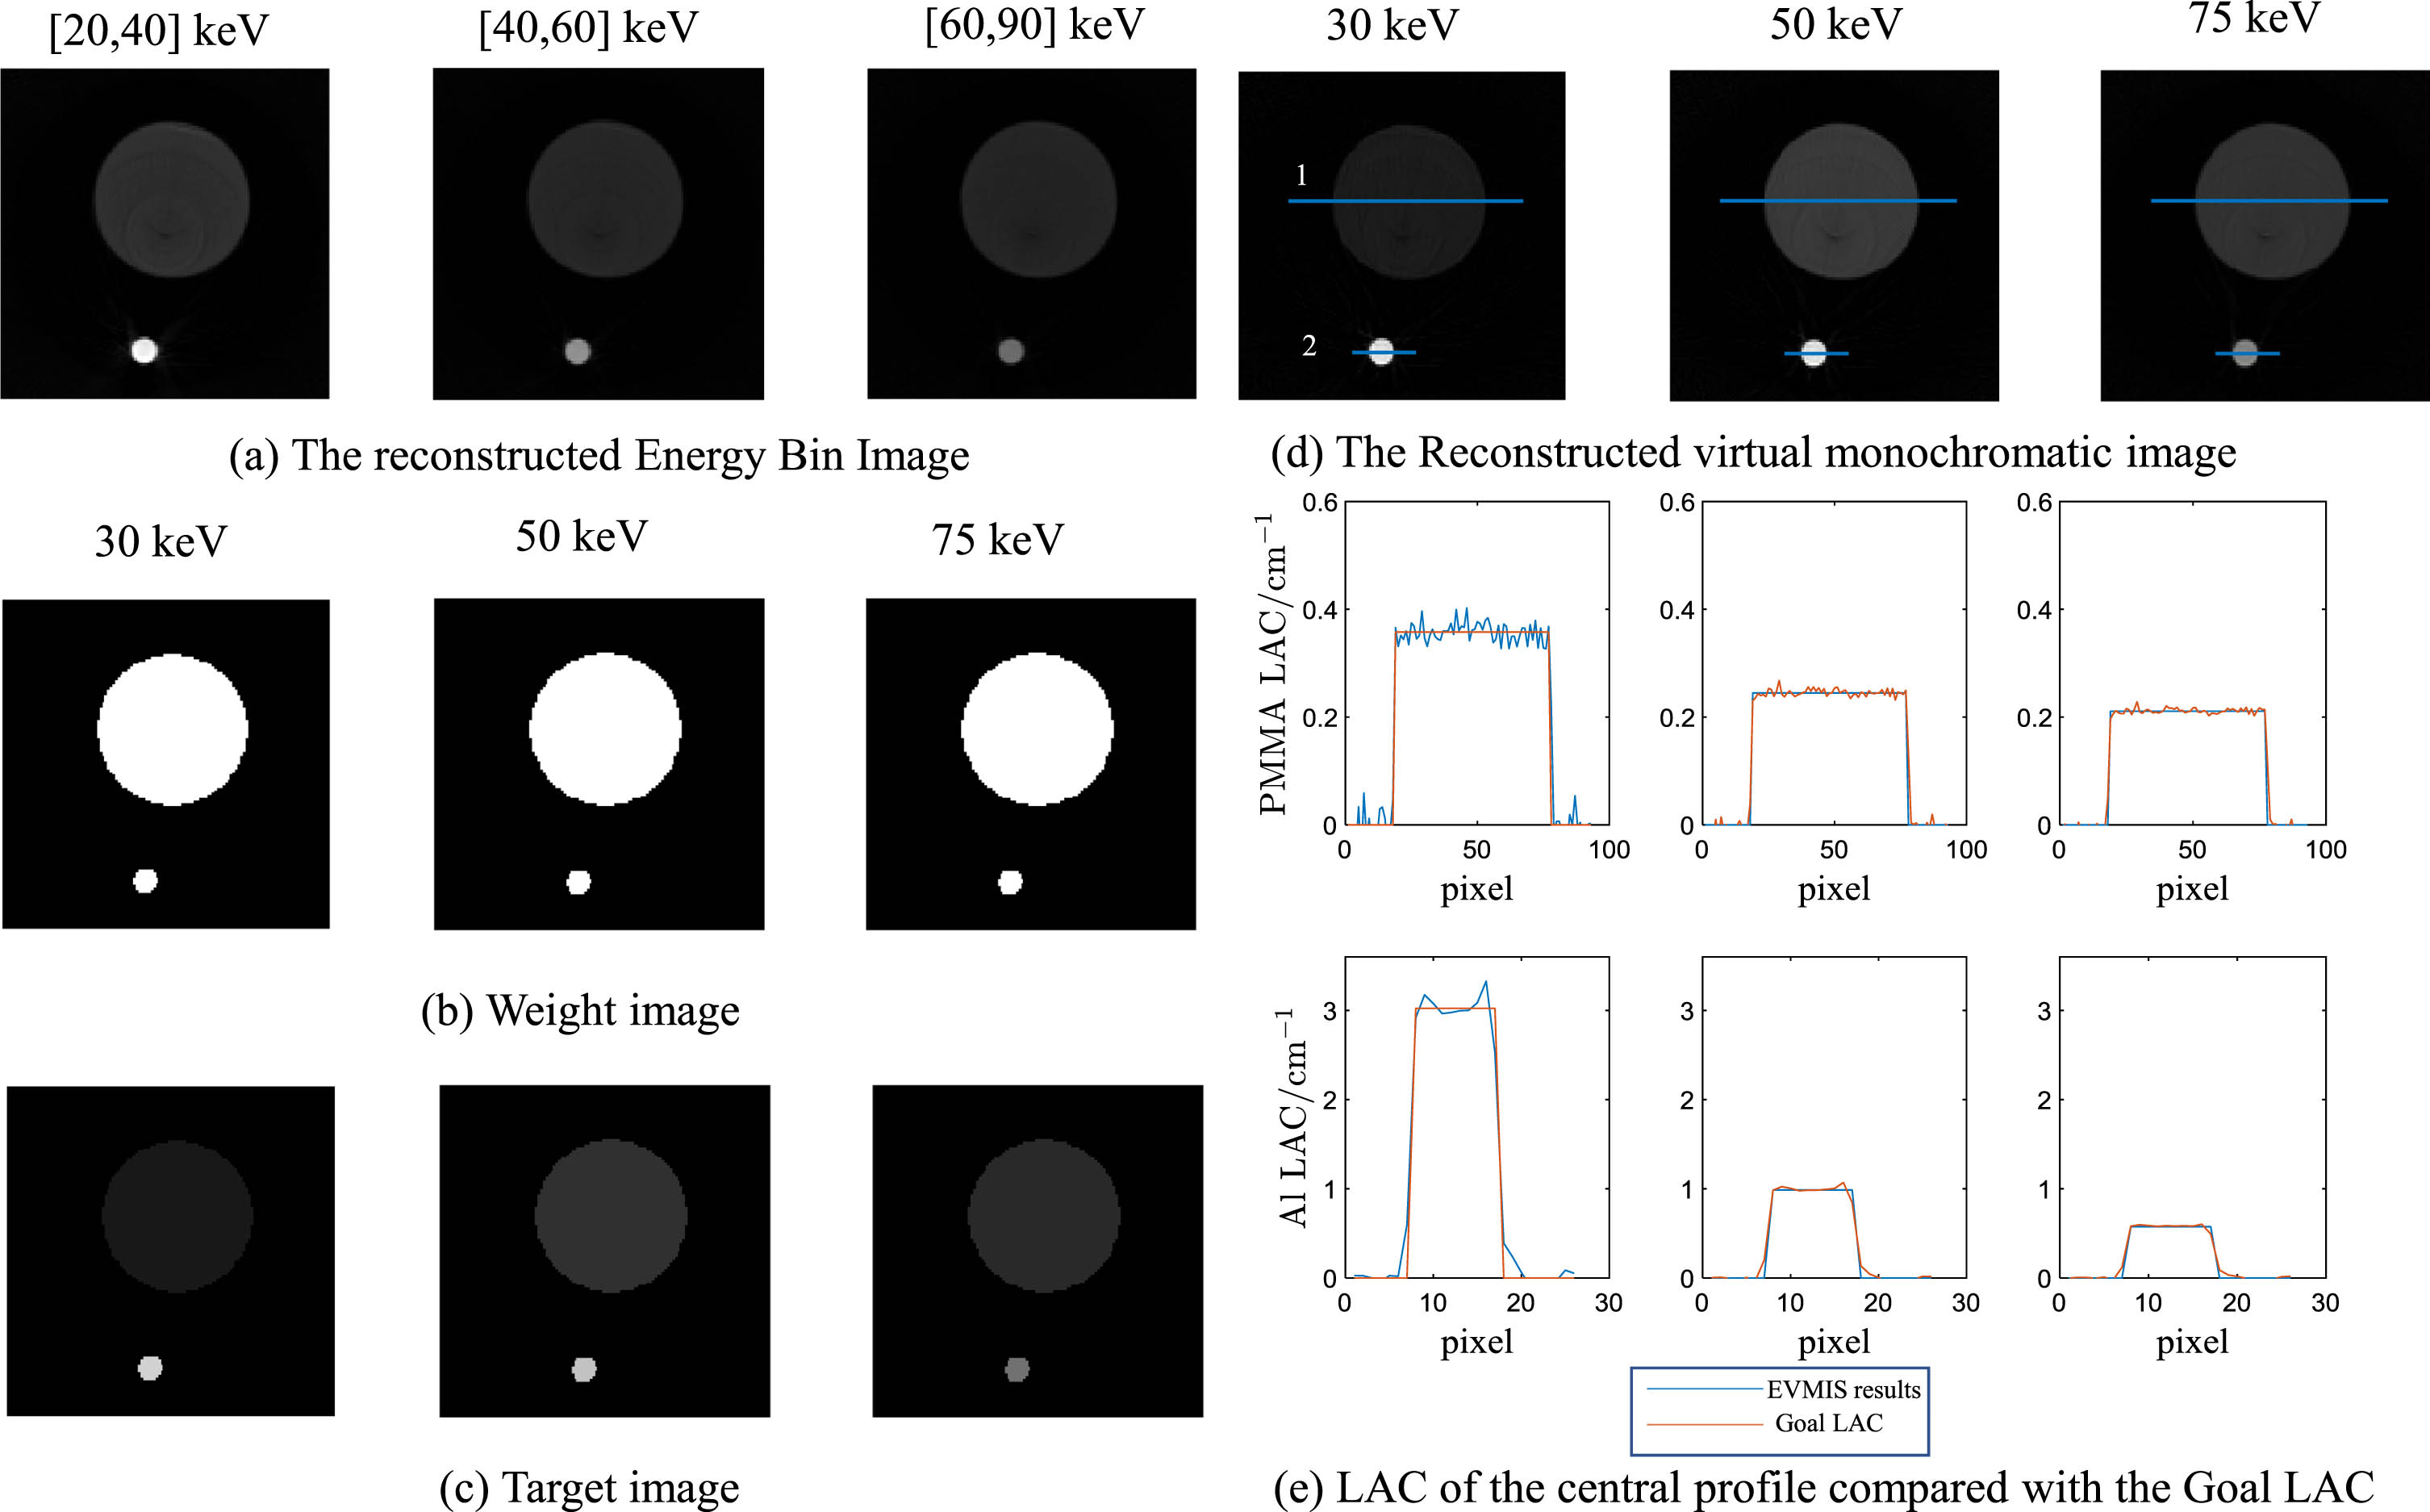
Rat biological soft-tissue results of Al and PMMA calibration phantom by EVMIS. (a) The directly reconstructed Energy Bin Image. The grayscale is [0 0.15]. (b) Weight Images. The weight of air is 0.20. (c) Target Images. The LAC at 30 keV, 50 keV, and 75 keV for PMMA and Al ROIs. (d) The reconstructed virtual monochromatic images. (e) Profiles of (d) for different solutions along blue lines as marked in (e). Results show that the reconstructed LAC of PMMA and Al matches well with the ground truth.
Results of energy spectrum calibration using EVMIS in rat biological specimens experiments
The calibration polynomial coefficients obtained from the PMMA and Al calibration phantoms were utilized to reconstruct virtual monochromatic images (Fig. 12). Using the EVMIS method, the linear attenuation coefficients of voxels within the ROIs of four types of tissues were determined. Furthermore, the detailed linear attenuation coefficients (mean±standard deviation) for each tissue are summarized in Table 6. Further utilizing the mass attenuation coefficient information for each tissue, densities for each tissue were calculated for each pixel using the least squares method. The predicted densities of the various rat tissues are as follows: bone density is 1.41±0.07 g/cm3, adipose tissue density is 0.91±0.06 g/cm3, heart tissue density is 1.09±0.04 g/cm3, and lung tissue density is 0.32±0.07 g/cm3.
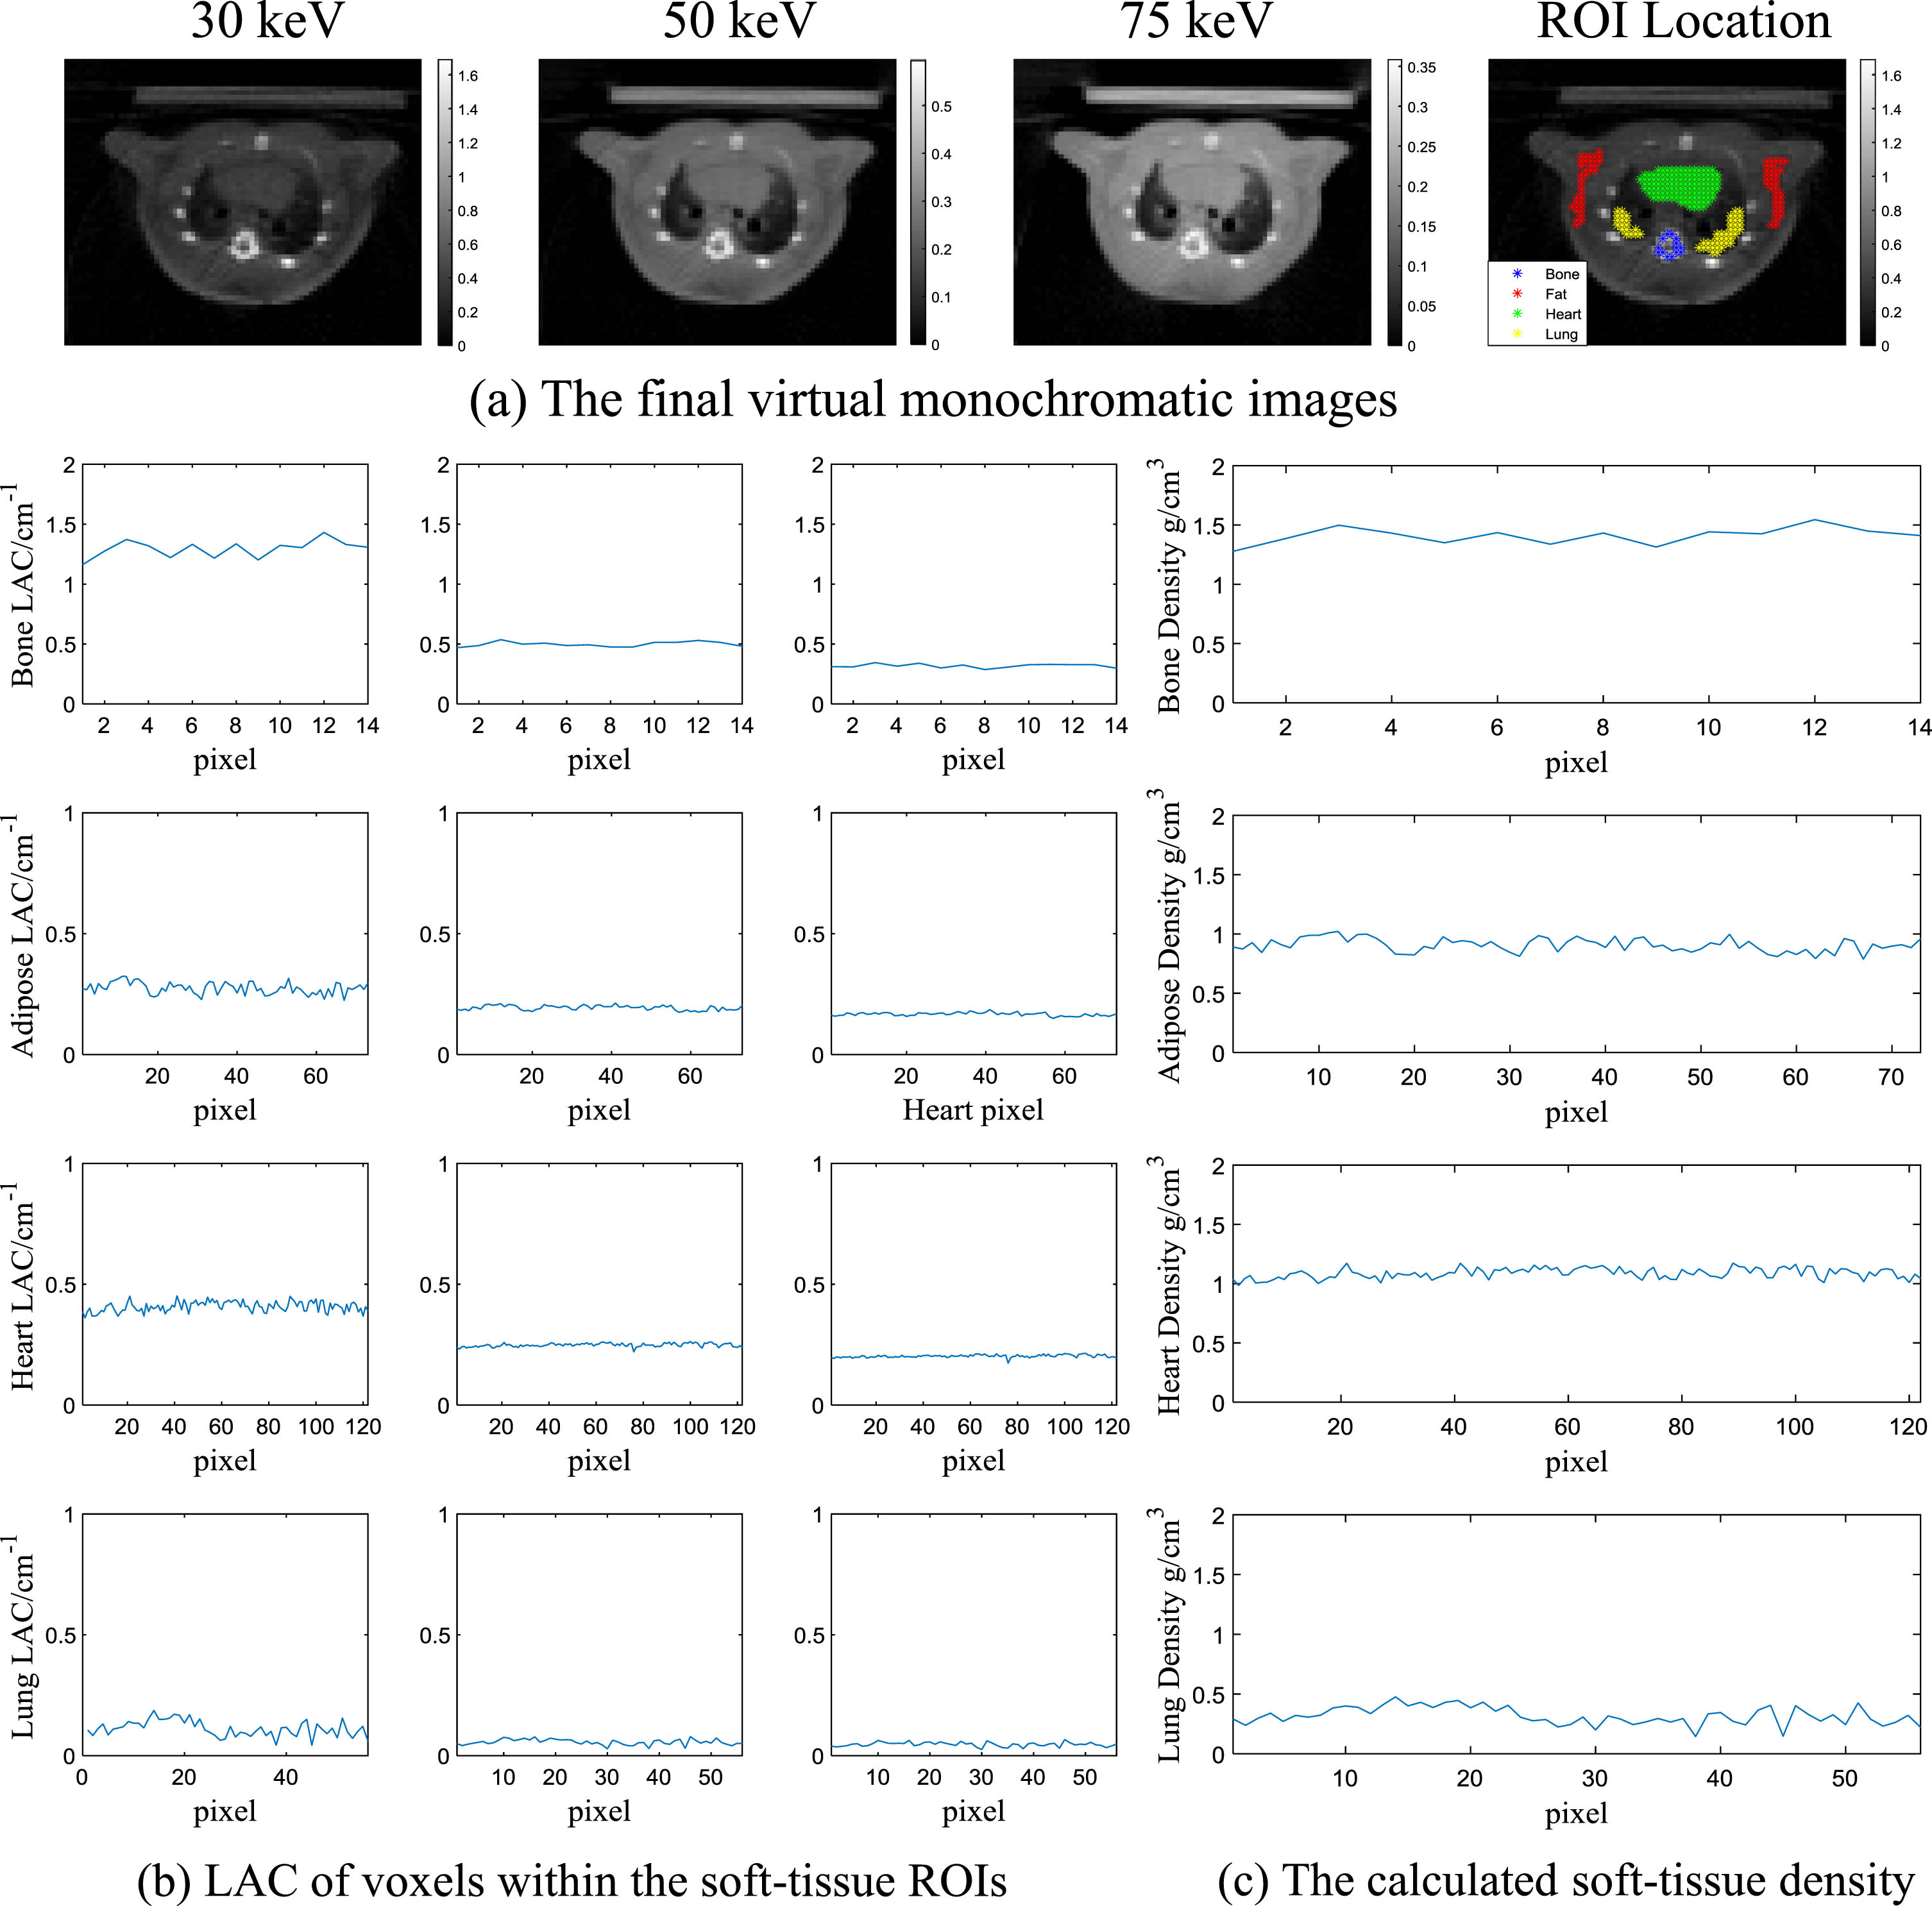
Validation of the efficacy of EVMIS on rat biological soft-tissue imaging experiments. (a) The final virtual monochromatic images. The grayscale is [0 1.5] (b) The LAC of each rat tissue within the ROI.
The values of LAC and estimated tissue density within each tissue ROI
In this paper, the virtual monochromatic images were accurately synthesized in the dual-material imaging experiments, the K-edge imaging of different solutions, and rat biological soft-tissue imaging experiments using the linear photon-counting X-ray detector by employing a YSO/SiPM detector and FPGA-only MVT Digitizer. Further decomposition to basis material composition with monochromatic LAC can be easily done afterward. For material identification or medical diagnosis, it is often necessary to analyze the reconstructed images based on the virtual monochromatic images (i.e., the attenuation distribution of each material at monoenergetic energy). Therefore, we directly obtain the virtual monochromatic images by polynomial fitting the relationship between the projection data and the line integral of the attenuation coefficients at monoenergetic energy, without knowing the spectral information. This method only requires the determination of the substances used for calibration in the phantom, rather than all material information. The empirical dual energy calibration (EDEC) method still magnifies image noise [35, 45]. However, the EVMIS method improves upon the traditional EDEC method by converting the material decomposition goal images into virtual monochromatic images. These virtual monochromatic images have the effect of reducing noise and increasing the signal-to-noise ratio (SNR) [46, 47]. Additionally, as shown in Figs. 7–12 and Tables 1–6, the virtual monochromatic images of the scanned objects at high energies (67, 52, and 75 keV) exhibit a lower noise standard deviation compared to the virtual monochromatic images at the other two energies. In dual-material imaging, the overall average synthesis error for three monoenergetic images of different substances is 2.53% ±2.43%. Similarly, in K-edge imaging experiments, the overall average synthesis error for three monoenergetic images of four materials is 4.04% ±2.63%. Experimental results demonstrate that EVMIS can calibrate photon-counting CT systems for dual-material imaging using two basis materials and reconstruct K-edge-containing substances for K-edge imaging.
Currently, our proof-of-concept photon-counting CT system employs 1.2×1.2×5 mm3 crystals with a 0.4 mm gap, resulting in a fill factor of merely 56%, thereby leading to diminished system sensitivity. Our next-generation detector aims to optimize the active fraction by reducing the thickness of the BaSO4 reflector to 0.1 mm[48], resulting in an increased active fraction of 73.47%. Alternatively, employing scintillators with Enhanced Specular Reflector film could further enhance this optimization by reducing the thickness to 0.065 mm[49], leading to a remarkable active fraction of 81.41%. Additionally, advancements in high-reflection film preparation technologies [50–52], such as the electron beam evaporation method [51] and Hot wall Evaporation technique [52], have the potential to enable a thickness of up to 3μm for the reflection film (comprising 48 layers of TiO2/SiO2/HfO2) [51, 53]. Furthermore, current research is focused on the development of cutting-edge laser-induced optical barrier techniques that demonstrate minimal dead zones and possess the potential to achieve exceptional resolution, such as 0.2 mm pixels [29, 55].
In this study, due to the decay time of the YSO scintillation crystal being approximately 50 ns, the width of the output scintillation pulse is around 500 ns [41]. Consequently, the maximum saturation count rate of the detector reaches 2.0 Mcps/pixel. However, the photon-counting detectors currently required in high-flux CT imaging systems for human clinical applications need to achieve 100 Mcps/mm2, which is the major challenge that any photon-counting detector for clinical CT is facing. Under high-flux CT imaging conditions, our detector would suffer from severe pulse pile-up effects, leading to incorrect energy determination of photons in various energy ranges and consequently reducing the accuracy of synthesized virtual monochromatic images. Subsequently, our objective is to optimize the count rate and spatial resolution of scintillator detectors to fully exploit their potential in clinical applications. The influence of scintillator decay time on the count rate of SiPM-based scintillation detectors is emphasized as a critical factor. In future endeavors, we intend to transition towards scintillators with shorter decay times, such as LaBr3:Ce (16 ns) [29]. The advancement shows potential in enhancing the count rate performance of the detector. The count rate for nonparalyzable-like counting approached an asymptotic value exceeding 20 Mcps/pixel, demonstrating a remarkable resemblance to the performance levels achieved by CdTe/CZT detectors[29, 30]. The potential for achieving counting rates up to 100 Mcps/mm2 in clinical photon-counting CT can be realized by further reducing the detector size to 400μm or less, while simultaneously ensuring a higher fill factor [29].
Special attention must be paid to scatter contamination when conducting photon-counting CT imaging [56–58]. In our present investigation, the scatter is not mitigated by a post-patient collimator during the calibration and phantom experiments, particularly in instances involving fan beam scanning. In subsequent experiments, we envisage the inclusion of a post-collimator positioned in front of the photon-counting detector to address this aspect.
Our future research will focus on decomposing the basis material in the projection domain using Al and PMMA step wedge phantoms [21, 60]. We will then reconstruct the distribution of effective atomic number, electron density, and linear attenuation coefficient at any desired energy using our YSO/SiPM based photon-counting detector. This future experiment will further demonstrate the feasibility of photon counting CT based on a YSO/SiPM detector.
Conclusion
We developed a proof-of-concept benchtop photon-counting CT system utilizing DexScanner L103 photon-counting detectors developed within our research group and synthesized the virtual monochromatic images by polynomial fitting the relationship between the projection data and the line integral of the attenuation coefficients at monoenergetic energy, without knowing the spectral information. The results of dual-material imaging, K-edge Imaging and rat biological soft-tissue imaging experiments show that the empirical polynomial direct fitting method can achieve accurate quantitative imaging of the virtual monochromatic images in three-energy bins photon-counting CT and the SiPM-based photon-counting detector is a promising method for developing spectral computed tomography systems.
Footnotes
Acknowledgments
This work was supported in part by the National Natural Science Foundation of China under Grant No. 62250002 and 62201194, and in part by the start-up fund of the USTC-Total solid angle PET-EPR multi-modality intelligent imaging.