
Abstract
Investigation of the electrochemical behavior using cyclic voltammetry and detection of [Mn2+(thiophenyl-2-carboxylic acid)2 (triethanolamine)] with adsorptive stripping differential pulse voltammetry. The electrochemical behavior of a manganese(II) complex [Mn2+(thiophenyl-2-carboxylic acid)2(triethanolamine)] (
Introduction
Manganese is a key cofactor for a broad range of metalloenzymes, including oxidases and dehydrogenases, deoxyribonucleic acid (DNA) and ribonucleic acid (RNA) polymerases, kinases, decarboxylases, and sugar transferases.1,2 Its compounds are important in several biological systems involving an electron transfer reaction, such as reactions involving photosystem II (PSII) and supreoxide dismutase (SOD).3,4 A few manganese complexes have been reported to show anti-reactive oxygen species (ROS) activity, 5 while Mn(II) and Mn(III) complexes have shown promising results for DNA binding and cleavage activity.6,7 Reported Mn-SOD enzymes have a redox potential that is between the redox potentials corresponding to the reduction and oxidation of the superoxide radical (200-450 mV vs normal hydrogen electrode [NHE]). 8 Therefore, the electrochemical properties of manganese compounds are in direct relation with some of the most significant biological procedures in nature and could be very helpful to clarify the mechanism of these procedures. Furthermore, manganese complexes could have toxic effects or therapeutical properties. This implies that it is necessary to develop sensitive, fast, cost-effective detection assays of manganese complexes.
Manganese complexes are mainly used as catalysts because they contain a central metal with variable oxidation states.9,10 However, manganese complexes with acyclic multidentate ligands are still very limited. 9 In analytical chemistry, they have been utilized as chemical modifiers of electrode surfaces for the electrochemical determination of analytes such as NO and peroxynitrite ions.10,11 In addition, manganese complexes have been used as hybridization indicators for determining infectious agents and for monitoring sequence-specific hybridization events. 12 14 Thiophenyl-2 saturated car-boxylic acid is known for its anti-inflammatory activity and its ability to coordinate with a broad range of metallic ions and produce complexes with anti-inflammatory, SOD mimetic, and other actions. 15 Meanwhile, triethanolamine is a biologically relevant ligand with great coordinative ability and flexibility. 16 Triethanolamine is widely used in cosmetology, and it belongs to the group of tripodal ligands that have been studied for their biological application as complex models for the redoxidative reaction of metal proteins. However, only few manganese complexes containing thiophenyl-2 saturated carboxylic acid (HL) and triethanolamine (H3tea) have been reported in the literature. 15 19
Techniques such as cyclic voltammetry (CV) and differential pulse voltammetry (DPV) are widely used in order to understand the redox behavior of metal complexes. On the other hand, adsorptive stripping voltammetry (AdSV) is a stripping electroanalytical technique, 20 where the deposition of the analyte is accomplished by a physical or chemical interaction with the electrode surface. Once sufficient deposition of the analyte is achieved, the potential of the working electrode is swept to strip the analyte from the electrode surface, with the associated faradaic current being measured to quantitatively determine the analyte's concentration. Only a few studies exist in the literature, where manganese/ligand systems or manganese complexes were electroanalytically investigated. 21
Electrochemical investigation of manganese complexes, such as [Mn2+(thiophenyl-2-carboxylic acid)2(H3tea)], that is, [Mn2+(L)2(H3tea)] (
Methods
Materials and reagents
All reagents were of analytical grade and used as received. Dimethyl sulfoxide (DMSO) was obtained from Alfa Aesar. Graphite powder (50870, p.a. purity 99.9%, and particle size <0.1 mm) was purchased from Fluka. Manganese(II) complex (Fig. 1) was prepared as previously reported.7 Then, thiophenyl-2 carboxylic acid (HL) was dissolved in MeOH and NaOH was added. After 30 minutes of stirring, triethanolamine was added, and after 15 minutes of stirring, MnCl2·4H2O dissolved in methanol was also added dropwise. The pale yellow mixture was slightly heated and stirred for additional 1 hour and then concentrated to half the volume. Colorless crystals of compound were obtained by slow evaporation after 2 days.

Chemical structure of (
Instruments
Experiments were carried out using a μ Autolab potentiostat/galvanostat (Eco Chimie) and controlled by GPES 4.9.0005 Beta software. A platinum wire as a counter electrode and Ag/AgCl/3 mol L−1 KCl as a reference electrode were used. A CPE was used as a working electrode. The CPE was prepared by thoroughly mixing by hand adequate amounts of graphite powder and paraffin oil in 75/25 mass ratio. A portion of the resulting mixture was packed into the bottom of a polytetrafluoroethelene (PTFE) sleeve. The surface was manually polished to a smooth finish on a piece of weighing paper before use. All the experiments were performed at room temperature.
Stock solution preparation
Stock solutions of (
Procedure for the electrochemical study of (A)
Suitable amounts of the stock solution of (
Procedure for the electrochemical detection of (A)
A freshly smoothed CPE surface was immersed into 0.1 mol L−1 acetate buffer at pH 4.6 containing 0.02 mol L−1 KCl and the appropriate amount of (
Results and Discussion
Effect of mass concentration of (A) and scan rate on CV
Figure 2 describes the effect of mass concentration of (

CVs of (
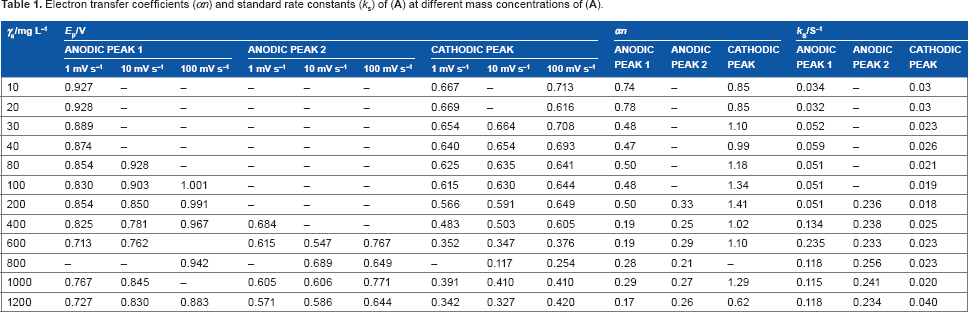
Electron transfer coefficients (αn) and standard rate constants (ks) of (
Further, Figure 3 illustrates the typical cyclic voltammograms obtained for different mass concentrations of (
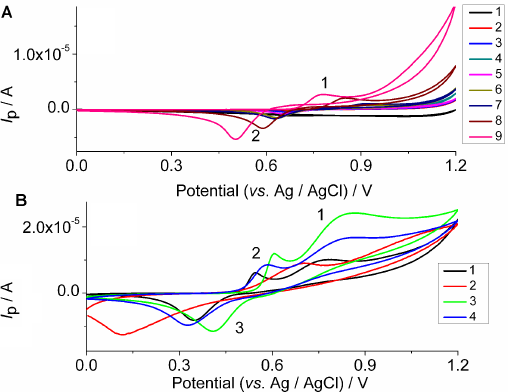
CVs of (
The cyclic voltammograms of varying mass concentrations of (

CVs of (
In addition, the absence of a second cathodic peak on the cyclic voltmmograms (Figs. 2–4) indicates the presence of at least one chemical reaction step in the electrochemical procedure. The anodic and cathodic peak current heights were different, which is typical of a nonreversible electrochemical reaction. A crossover appeared, which is typical of the formation of a new phase involving a nucleation process and growth (Figs. 2A and B, 3A, and 4A).22,23 The anodic peak current increased as the mass concentration of (
It was mentioned that when the mass concentration of (
At 100 mV s−1, the peak current height of peak 1 (Fig. 4A) was increased up to 100 mg L−1. At further incensement of the mass concentration of (
The reduction peak became rounder when the scan rate and mass concentration were increased (Figs. 2–4). The intensity of the peak current increased at all of the studied scan rates (Figs. 2–4). This means that the reduction of the oxidized product of (
The current of peak 1 was linearly decreased with the scan rate of up to 1,000 mg L−1, when the scan rate was raised from 1 to 20 mV s−1, while for higher scan rates, the dependence was not linear (data are not shown). The current of peak 2 was linearly increased with the scan rate from 1 to 20 mV s−1, but for higher scan rates, it linearly decreased (data are not shown). The cathodic peak current linearly increased from 50 to 600 mg L−1 and then linearly decreased when the scan rate was increased (data are not shown). These facts are indicative of adsorption. 32
The peak potential of all the peaks was directly proportional to the logarithm of scan rate in all of the studied mass concentrations (data are not shown). From the slope of this diagram, the electron transfer coefficient was calculated (Table 1). Generally, the electron transfer coefficient of anodic peaks 1 and 2 was decreased as the mass concentration of (
It was found that the current function Ip/γυ1/2 of all peaks decreased, when the scan rate was increased in the studied range of mass concentration (data are not shown), which is a further indication of the participation of adsorption in the oxidation and reduction. 33 Moreover, the linear shape of Ip/γ vs γ graph of all peaks at low mass concentrations is consistent with the presence of adsorption in the oxidation and reduction (data are not shown). 33
The Laviron's equation was used to estimate the standard rate constant (ks) values (Table 1).
34
From Table 1, it is obvious that ks was increased up to 600 mg L−1 for anodic peak 1, after which it decreased, while for anodic peak 2 and cathodic peak, it remained almost constant. Generally, large values of ks indicate the high ability of (
Effect of the buffer pH on CV
Two levels of mass concentration of (
One anodic and a cathodic (Fig. 5A) peak appeared at 50 mg L−1, when the pH ranged from 3.8 to 5.8. At pH 5.6 and 5.8, the anodic peak split into two peaks, when the mass concentration was 50 mg L−1 (Fig. 5A). This split could be related to the adsorption of the oxidized (
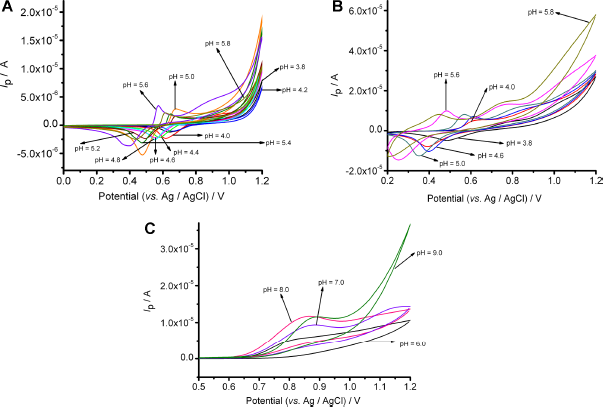
CVs of (
The anodic peak at 50 mg L−1 and the second anodic peak at 600 mg L−1 could be assigned to the oxidation of (
At 600 mg L−1, one anodic peak (Fig. 5C) was evident, when the pH ranged from 6.0 to 10.0. The magnitude of this peak potential was close to that of H3tea. 35 At pH higher than 10.0 at both mass concentrations, the decrease in the oxidation and reduction peak current, as well as the brown color of the solution, was probably due to the increasingly competitive production of Mn(OH)4.
The peak potential of anodic and cathodic peaks was found to be linearly proportional to pH at both mass concentrations. At 50 mg L−1, the obtained slope for the oxidation peak was calculated to be -184.6 ± 2.01 mV/pH, which is close to the theoretically predicted value from the Nernst equation (177.5 mV/pH) for a six-proton and two-electron reaction. At 600 mg L−1, the slopes obtained for the first and second anodic peaks were found to be -175.6 ± 2.13 mV/pH and -177.6 ± 3.61 mV/pH, respectively, which are close to the theoretical value (177.5 mV/pH) for a three-proton and one-electron reaction. The experimental values of the slope at 50 and 600 mg L−1 for the reduction peak were found to be -116.4 ± 0.89 mV/pH and -112.3 ± 2.26 mV/pH, respectively. These values are close to the theoretical value (118.4 mV/pH) for a four-proton and two-electron reaction. In the case of the oxidation peak at pH values higher than 6.0, the slope was calculated to be equal to 26.80 ± 1.42 mV/pH, which is favorably close to that of H3tea. 35
Proposed oxidation-reduction mechanism
The following electron electron chemical (EEC) mechanism is envisaged for the anodic deposition of (
Subsequently, at lower concentration of (
The oxidation of [Mn2+(L)2(H3tea)]surf to [Mn4+(L)2(Htea)]ads suggests the simultaneous oxidation of a water molecule, as shown by Equation 3.
26

On the other hand, the [Mn3+(L)2(H3tea)]+ads is dissociated according to Equation 4.
26

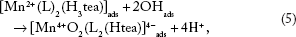
The produced above mentioned adsorbed on CPE's surface hydroxyl radical (Equation 3) was subsequently reacted with [Mn2+(L)2(H3tea)]ads (Equation 4) and formed [Mn4+O2(L)2(Htea)]4-ads on CPE's surface according to Equation 5 (peaks 1, 2 and 3 in Fig. 2A and B and peaks 1 and 2 in Fig. 4A).
26
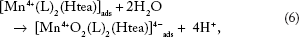
Meanwhile, [Mn4+(L)2(Htea)]ads is hydrolyzed according to Equation 6, Figures 2A and B, 3A, and 4A.
26
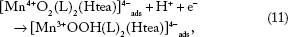
Alternatively, the oxidation of (

Nucleation of [Mn4+O2(L)2(Htea)]4- at low scan rates and mass concentrations is due to the presence of the MnO2 unity and is dominated by an equilibrium involving a Mn3+ intermediate, Equations 4 and 7 (Figs. 2A and B and 3A).
22
Subsequent growth of [Mn4+O2(L)2(Htea)]4- involves the reduction of [Mn4+O2(L)
2
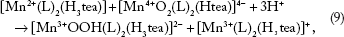
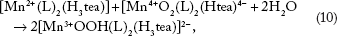
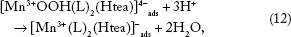
(Htea)]4- surfaces by [Mn2+(L)2(H3tea)] in solution to form [Mn4+(L)2(Htea)] and/or [Mn3+OOH(L)2 (H3tea)]2- (Equation 9 and 10), depending on the local pH and potential (Figs. 2A and B and 3A)
23
:
This means that at low mass concentrations, the diffusion of (
At high mass concentration (Figs. 2C, 3B, and 4B), it is more likely that the oxidation proceeded according to Equations 1, 2, 7, and 8 because protons and electrons that participated to these equations fulfill the experimental ones. Thus, the first oxidation peak is attributed to Equations 1, 2, and 7 and the second oxidation peak to Equation 8 (Figs. 2C, 3B, and 4B). At low scan rates, the nucleation of [Mn4+ O2(L)2(Htea)]4- also took place according to Equations 9 and 10 (Fig. 2C).
The reverse process in scanning the potential in a negative direction is ECE mechanism (Equations 11–13) (Figs. 2–4), assuming perfect stoichiometry of the MnO2 unity:

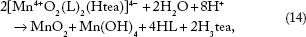
In fact, there are several different crystalline forms of the MnO2 unity, which could influence the ease of reductive dissolution.26,29,30,37 In addition, [Mn4+ O2(L)2(Htea)]4- could be hydrolyzed according to Equation 14.
Electrochemical detection of (A)
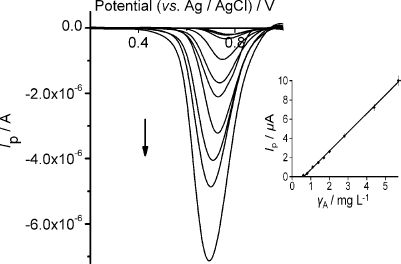
Figure 6 shows the differential pulse voltammograms that correspond to the oxidation of (

DPVs under selected conditions at different mass concentrations of (
Figure 7 shows the differential pulse voltammograms that correspond to the reduction of (
DPVs under selected conditions at different mass concentrations of (
Calibration curves (inset of Figs. 6 and 7) were plotted under selected conditions (Table 2), and the analytical features are given in Table 2. The limits of detection and limits of quantification were calculated to be 3 X sb/a and 10 X sb/a, respectively, where sb and a are the standard deviation of the intercept and the slope of the calibration plot, respectively.
38
Thus, the results of the proposed electrochemical determination assay of (
selected conditions and detection analytical features of (
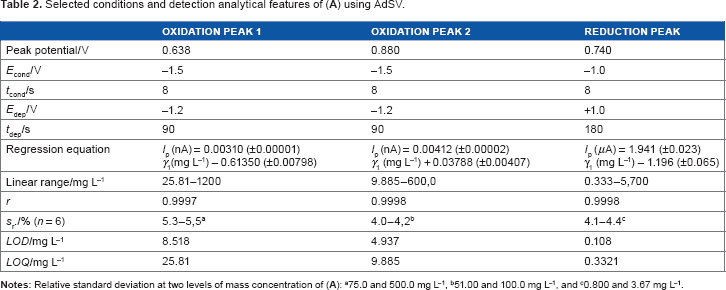
a75.0 and 500.0 mg L−1,
b51.00 and 100.0 mg L−1, and
c0.800 and 3.67 mg L-1.
There is always the possibility of interference of other ionic metallic species to the detection of (
Conclusions
The oxidation and reduction mechanism of (
The combination of AdSV and CPE has been shown to produce an effective and fast electroanalytical technique for the determination of (
However, the proposed methodology bears the limitations provided by the use of the CPE. This means that a well-skilled person must be employed to handle the carbon paste in order to achieve the maximum reproducibility of the fabricated electrode. Furthermore, this electrode is operative only to positive potentials. On the other hand, manganese is also a difficult metal to handle, owing to its flexible valence. In addition, the nucleation process of the MnO2 entity of the resulted Mn4+ compound onto CPE proceeded slowly, suggesting the existence of an induction time for the deposition. 23 The selection of the proper potential in the preconcentration step overcomes this limitation. Finally, it is possible that some other metallic ions such as Co2+, Fe2+, Ni2+, Zn2+, or Cu2+ could interfere.
Author Contributions
Conceived and designed the experiments: SK. Analyzed the data: SK. Wrote the first draft of the manuscript: SK. Contributed to the writing of the manuscript: SG. Agreed with manuscript results and conclusions: SG. Jointly developed the structure and arguments for the paper: SG. Made critical revisions and approved the final version: SG. All authors reviewed and approved the final manuscript.