
Abstract
Melanoma antigen family (MAGE) genes are widely expressed in various tumor types but silent in normal cells except germ-line cells lacking human leukocyte antigen (HLA) expression. Over 25 MAGE genes have been identified in different tissues, mostly located in Xq28 of human chromosome and some of them in chromosome 3 and 15, containing either single or multiple-exons. This in silico study predicted the genes on hTERT location and identified a distant relative of MAGE gene located on chromosome 5. The study identified a single exon coding ∼850 residues polypeptide sharing ∼30% homology with Macfa-MAGE E1 and hMAGE-E1. dbEST search of the predicted transcript matches 5′ and 3′ flanking ESTs. The predicted protein showed sequence homology within the MAGE homology domain 2 (MHD2). UCSC genome annotation of CpG Island around the coding region reveals that this gene could be silent by methylation. Affymetrix all-exon track indicates the gene could be expressed in different tissues particularly in cancer cells as they widely undergo a genome wide demethylation process.
Introduction
Human telomerase, a cellular reverse transcriptase, is a ribonucleoprotein enzyme that catalyzes the synthesis and extension of telomeric DNA. 1 Telomerase activity appears to be associated with cell immortalization and malignant progression. 2 Usually human telomerase is found in hemopoietic and in germ cells but not in normal somatic cells. Active telomerase is one of the key factors that enable malignant cells to proliferate indefinitely. 3 However, molecular mechanisms triggering various telomerase activities still remain elusive.
In this post-genomic era, in silico techniques for gene finding process or identifying the location of the protein-coding regions (ORF), within uncharacterized genomic DNA sequences, constitute a central issue in the field of bioinformatics 4 and are of much interest to biologists. A number of computational techniques for the prediction of distinctive features of protein-coding regions have been proposed along with the standard molecular methods. In general, the two main approaches of structural gene prediction are intrinsic (based on statistical properties of exons, splice sites, and other signals) and extrinsic (based on homology with known genes). 5
In this study, the human chromosome 5p13.1–p15.33 region containing the telomerase (hTERT) gene was investigated by using both intrinsic and extrinsic method of gene prediction. In addition to hTERT ORF, two additional ORFs named gene2 and gene3 were identified. Interestingly, predicted gene2 revealed significant sequence homology with human tumor specific antigen, melanoma antigen family gene (MAGE), E1.
Materials and Methods
Complete sequence of human telomerase reverse transcriptase (hTERT) was retrieved from NCBI (gi:82399156, Accession no. DQ264729.1).
In Silico Identification of ORFs
The coding sequences of hTERT were identified using NCBI's ORF Finder (http://www.ncbi.nlm.nih.gov/gorf). The sequence (DQ264729.1) was further analyzed using various ab initio gene finding programs (GENSCAN, FGENESH and AUGUSTUS) and by comparative gene prediction (TWINSCAN) methods. The genomic location of the hTERT was studied using the UCSC Genome browser (http://genome.ucsc.edu/cgibin/hgGateway). This browser was also used to identify the CpG Island track and EST's around the predicted ORF. The 5′-UTR of the predicted transcription start site (TSS), the start codon and the 3′-UTR, 1000 bp downstream from the stop codon were searched using BLASTn, against the EST database (dbEST).
Homology Study of the Predicted ORFs
The homologous sequences of the predicted genes were identified from successive iterations using PSI-BLAST. Multiple sequences were aligned using ClustalW (1.83) (http://www.ebi.ac.uk/tools/clustalw). Secondary structure of the predicted gene2 was analyzed using the program Hierarchical Neural Network (HNN: http://www.expasy.org/tools/). The repeated pattern motifs were analyzed using the program Rapid Automatic Detection and Alignment of Repeats RADAR (http://ebi.ac.uk/radar/).
Comparative Genomics Analysis of the Predicted Gene2
Global alignment of the coding sequence of gene2 with Chimpanzee (Pan troglodytes) and Orangutan (Pongo pygmaeus-abelii) genomic sequence was performed with the program AVID using a window size of 100 bp and a conservation level of 70%. Results were viewed with the program VISTA. 6 Finally, the nucleotide sequence of the Chimpanzee TERT (Pan troglodytes chromosome 5 genomic contig, reference assembly, Accession no. NW_001235370, region: 211936–253254) was further analysed by using GENSCAN to confirm the presence of conserved gene2 in Chimpanzee genome.
Prediction of the Function of the Gene2
The function of gene2 was predicted using two protein function prediction program PFP 7 and SVMProt. 8 For comparative analysis, function of MAGE-E1 was also predicted using these two programs.
Result and Discussion
Table 1 showed the gene prediction analysis of hTERT by different programs. GENSCAN 9 had predicted 4 genes within the same hTERT location. Interestingly, apart from the known hTERT splice variant (gene1 and gene4 on the +strand), this program also predicted two additional genes in the reverse strand, namely gene2 (9155–5064 bp) and gene3 (16386–12458 bp) both of which consists of 3 exons. AUGUSTUS 10 also identified two genes in the reverse strand at a slightly different location- gene2 (7869–5617 bp) consists of a single exon whereas gene3 (14225–12469 bp) consists of two exons. The predicted genes in the reverse strand were confirmed by the FGENESH and ORF Finder. Homology-based program TWINSCAN 11 also predicted two reverse strand genes in the same way as FGENESH and ORF Finder (Table 1).
Summary of the gene prediction analysis result of gene2 and gene3.

In UCSC genome browser, two different gene prediction tracks NSCAN and GeneID also predicted the location of the gene2 and gene3 (Fig. 1). Tissue-specific expression pattern of the predicted genes was hypothesized by observing Affymetrix all-exon track. The genome browser also predicted the CpG island around the predicted genes. A good number of ESTs were identified at the 5′ and 3′ flanking regions for both the predicted gene2 and gene3. The predicted ESTs showed different expression profiles in different tissue types. Interestingly for the predicted gene2 it has been found that in some tissue types the gene is expressed in developmental stages and in others expressed in different cancer cell lines (Fig. 1). Similar patterns were also observed for the predicted gene3 and revealed that it shares good 5′ flanking region (∼99% identity) with the clone collection from IMAGE cDNA, mRNA database sequences (Supplementary data).
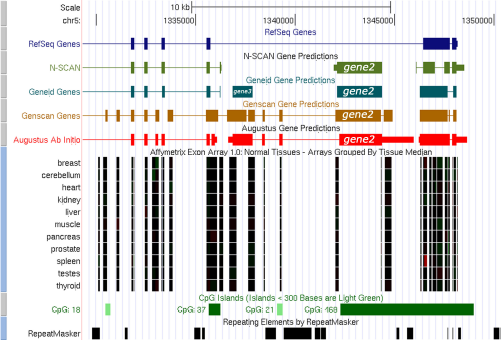
UCSC Genome Browser analysis showing the location of the predicted genes. Affymetrix All Exon Chip-Array tracks are used for tissue specific gene expression. CpG Island is also observed around the predicted gene.
VISTA plot of the AVID alignment (Fig. 2) indicated that majority of the region in gene2 is highly conserved (>92% identity) in Chimpanzee and Orangutan genome. No larger repeats (LINE, SINE, and LTR) were observed within that region. Further GENSCAN analysis of the corresponding TERT region on Chimpanzee chromosome 5 indicated that this region also contain a putative gene encoding 748 amino acids protein which is very much similar (82% identity and 84% similarity) to the predicted gene2 of hTERT region (Supplementary data). Identification of the blocks of genes with evolutionary conserved order in multiple genomes is an important issue in comparative genomics. These synteny blocks help in tracing back the evolution of genomes in terms of rearrangement event. Presence of conserved blocks of genes in multiple genomes may indicate functional relatedness of their products or presence of functionally important conserved non-coding regions. 12 Through comparative genomics analysis of our predicted gene2, we have found that this gene is conserved in different genomes in terms of gene order.

Conservation of gene2 in Chimpanzee (Pan troglodytes) and orangutan (Pongo pygmaeus-abelii) on VISTA browser.
BLAST results indicated that gene2 shared some homology (∼38%—41%) with the MAGE E1, a member of type II melanoma antigen family (Table 2). MAGE family is a large family which comprises over 25 members identified in human. Most members of the MAGE family are clustered at the Xq28 region of human chromosome. 13 The overall structure of MAGE-E1, and Macfa MAGE-E1 are larger proteins with extended N or C-termini. The N-terminal domain of MAGE-E1, contains a loosely conserved region of ∼220 amino acids, termed MHD2 domain. 14 Global alignment in ClustalW showed loosely conserved regions for both amino-terminal and carboxy-terminal domain of gene2 with human MAGE family E1 (accession no.AAH50588.1) and MAGE1_Macfa, Melanoma associated antigenE1 (accession no.Q9BE18) (Fig. 3).
Summary of the homologous sequences of predicted gene2.


Global alignment of gene2 with MAGE homology domain (MHD).
Identification of the novel members of a large protein family is very difficult as the similarity searching programs are designed to highlight the most similar sequences. As a result, about 5% of the novel protein family members may remain unrecognized. 15 In an example by Retief et al, 15 the large family of known glutathione transferase proteins was first subjected to multiple sequence alignment, and a phylogenetic tree was made by distance methods to identify classes of proteins within the family. These proteins represented a broad range of phylogenetic context and included classes with sometimes less than 20% identity. 16 Thus, in spite of having ∼40% sequence homology with MAGE-E1, predicted gene2 may be a novel member of melanoma antigen family (MAGE).
Expression pattern of different members of the MAGE family genes are different and tissue specific, some encodes tumor specific antigens and some are expressed in normal cells.17,18 Besides, co-expression pattern of some tumour associated antigen (TAA) including 5 MAGE-A genes with human telomerase reverse transcriptase was observed in non-small cell lung carcinoma (NSCLC) such as adenocarcinoma, squamous cell carcinoma and bronchiolocarinomas. 19 5′ flanking EST analysis of predicted gene2 revealed that most of the ESTs are expressed in several cancer cells. As human telomerase activity is observed only in germline and cancer cells 2 and its co-expression patterns was observed with some MAGE gene, our predicted gene2 may be co-expressed with telomerase in cancer cells.
Transcriptional regulation of MAGE gene family is dependent on various factors. Promoter methylation is one of these factors. Methylated CpG point in the promoter region is responsible for transcriptional silencing of the MAGE gene. 20 Demethylation of the MAGE1 promoter appears to be sufficient to activate this gene in tumor cell lines. 21 From UCSC genome browser, we have observed the presence of CpG island around our predicted gene2. That's why, it can be inferred that the hypermethylation of this CpG island is responsible for silencing of gene2 in normal cells and this gene may be activated through transformation dependent loss of DNA methylation in cancer cells.22–24
Repeated insertion appears to have played a major role during evolution of MAGE family. For instance, the long C-terminal domain of MAGE-D3 was most probably formed by serial duplications of decapeptide repeats. Also the N-terminal domains of MAGE-C1 and MAGE-D1, are highly repetitive, must have undergone sequential duplication events.13,25 29 repeated short peptides containing ∼12 amino acids were identified in gene2 protein by using the program RADAR 26 (Table 3). Although, function of these repeats is unknown, it revealed that gene2 may be evolved from repeated insertion as found in MAGE family. To compare the repetitive pattern of gene2 with MAGE family protein, we have analyzed the repeats of MAGE-E1, MAGE-D1 and MAGE-D3 proteins (supplementary data). It was found that the repeats in these MAGE family members are not identical and in some cases several variations in amino acids are found. The pattern of MAGE-D1 repeat is WQX-PXX 14 which is completely different from MAGE-D and MAGE-E1. However, these MAGE family members are univocal in that sense that they all contain repeats (may be identical or different). On the other hand, our predicted gene2 contains TPG repeat which is found at several position of MAGE-E1.
Repeated sequence motif of the predicted gene2 analyzed by RADAR.

The predicted secondary structure of gene2 showed more extensive β-strands (∼44%) and coil region (∼55%) distributed along the sequence (Fig. 4). From the secondary structure of entire MAGE-E1, it was found that N-terminal MHD2 domain contains extensive coil and some β-stranded region but C-terminal MHD1 domain contains more α-helical regions along with some β-stranded regions. We have further analyzed the secondary structure pattern of repeats on MAGE-E1, MAGE-D1 and MAGE-D3 (supplementary data). Overall secondary structure pattern within the repeat region of these three family members was coil followed by β-strands but no α-helices which are very much likely to the secondary structure pattern of gene2 repeats although the amino acid composition of the repeats is slightly different.
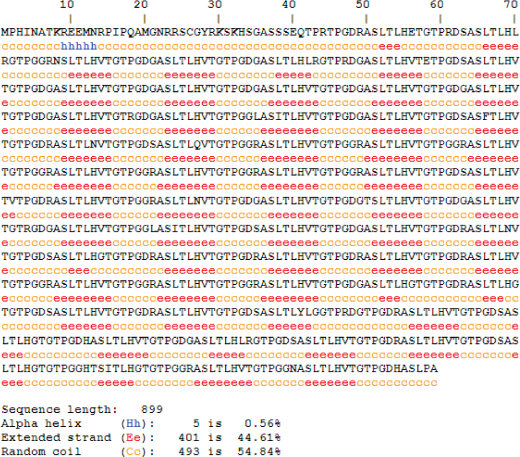
Secondary Structure Prediction of gene2 using HNN.
To understand the functional association between gene2 and MAGE-E1, we have analyzed the protein function prediction result using two programs SVMProt and PFP. SVMProt results indicated that both gene2 and MAGE-E1 belong to Zinc-binding protein family (Table 4). PFP result classified the function of protein according to the GO annotation categories. In the biological process categories, MAGE-E1 belongs to glia cell migration, nerve growth factor receptor signaling pathway, neuronal migration, brain development etc (Table 5) and gene2 belongs to neurogenesis whose specific outcome is the progression of nervous tissue over time, from its formation to its mature state which is very much likely to MAGE-E1. In the molecular function categories, gene2 matches with MAGE-E1 in exo-alpha-sialidase activity and inositol-polyphosphate 5-phosphatase activity.
Comparative function prediction of MAGE-E1 and gene2 using SVMprot.

Comparative function prediction of MAGE-E1 and Gene2 using PFP.

In the cellular component categories, both gene2 and MAGE-E1 belong to dendrite, dystrophin-associated glycoprotein complex, actin cytoskeleton and nuclear region. Some differences in the prediction categories between gene2 and MAGE-E1 are observed. This may be due to the limited functional analysis on MAGE family protein and still now we don't know enough about the expression and function of MAGE family proteins. 14 From these analyses, it can be inferred that as a distant member, there are some functional alliance of gene2 with MAGE family protein.
However, low amino acid sequence homology was found for gene3 protein. But it showed high homology (99% identity) with some human ESTs (Supplementary data). For this reason, we are predicting that this gene is a novel one or it may have functions in regulation rather than coding.
Conclusion
Even though these predicted genes should be further characterized by laboratory means before their existence can be conclusively affirmed, the results presented in this study suggested and identified the location of a structurally similar gene of MAGE family on human chromosome 5. The findings can provide new insight in transcriptional activation of novel genes during malignant melanoma.
Disclosures
The authors report no conflicts of interest.