




Abstract
With rapid advances in DNA sequencing technologies, whole exome sequencing (WES) has become a popular approach for detecting somatic mutations in oncology studies. The initial intent of WES was to characterize single nucleotide variants, but it was observed that the number of sequencing reads that mapped to a genomic region correlated with the DNA copy number variants (CNVs). We propose a method RefCNV that uses a reference set to estimate the distribution of the coverage for each exon. The construction of the reference set includes an evaluation of the sources of variability in the coverage distribution. We observed that the processing steps had an impact on the coverage distribution. For each exon, we compared the observed coverage with the expected normal coverage. Thresholds for determining CNVs were selected to control the false-positive error rate. RefCNV prediction correlated significantly (r = 0.96–0.86) with CNV measured by digital polymerase chain reaction for MET (7q31), EGFR (7p12), or ERBB2 (17q12) in 13 tumor cell lines. The genome-wide CNV analysis showed a good overall correlation (Spearman's coefficient = 0.82) between RefCNV estimation and publicly available CNV data in Cancer Cell Line Encyclopedia. RefCNV also showed better performance than three other CNV estimation methods in genome-wide CNV analysis.
Introduction
Copy number variants (CNVs) are defined as DNA structural variants that result in either gain or loss of a chromosomal region, which can cause abnormal biological functions in the cell. In cancer, somatic copy number aberrations are frequently observed. 1 The amplification of oncogenes or the deletion of tumor suppressor genes identified in tumor cells can be used for understanding the progression of the disease and for predicting drug sensitivity. In the absence of a matched germline specimen, the identified alterations in a tumor sample cannot be classified as somatic, only the copy number state differs from normal. In the past decade, traditional genome-wide CNV detection methods used single nucleotide polymorphism (SNP) array and array comparative genome hybridization (aCGH),2–5 both of which required high-density probes and large sample sizes to detect small variants (less than 100 bps). Recently, whole exome sequencing (WES) was developed to target exonic regions for sequencing. This technology is primarily used for identifying single nucleotide variants and short indels but has been observed to be able to identify CNVs within the target regions as well. A recent study evaluated the performance of four well-known WES-based CNV detection tools and showed that none of the exome-based CNV detection methods can perform well in all situations. The authors provided a comprehensive and objective comparison to assist researchers in choosing the most suitable tools of WES data for their research needs. 6
In this study, we developed an algorithm RefCNV, which is the gene-based CNV detection for WES data. Instead of using a matched control, we use a collection of normal well-characterized controls as references to build a whole exome-based linear regression model to predict normal coverages using library sizes (total mapped reads) as a predictor and summarize the CNV predictions (deletion, normal, and amplification) at each exon within a gene to report gene-level CNVs. We compared CNVs of three genes (MET, EGFR, and ERBB2) predicted by RefCNV with digital polymerase chain reaction (dPCR) experimental data in 13 cancer cell lines in which CNVs of three genes has been well characterized.7–14 We evaluated RefCNV performance in genome-wide CNV change by comparing our results of 10 cell lines with publicly available SNP array-based CNV data in Cancer Cell Line Encyclopedia (CCLE). 15 We then compared RefCNV performance in global gene-based CNV prediction with three existing CNV prediction algorithms CONTRA, 16 cn.MOPS, 17 and ExomeCNV 18 using the same data sets. Our results show that RefCNV prediction is correlated well with CNV data measured by dPCR and has performance better than other three CNV estimation methods globally.
Materials and Methods
Cell Culture and DNA Extraction
The DNA sample of HapMap cell line NA12878 was purchased from Coriell Institute for Medical Research, and all tumor cell lines were purchased from American Type Culture Collection. Cells were cultured using vendor-recommended conditions. DNA from freshly frozen cell pellets was extracted using the AllPrep DNA/RNA mini kit (Qiagen) according to the vendor instruction manual. DNA samples were quantitated by Qubit (ThermoFisher).
Digital PCR
Digital PCR (dPCR) assays were performed using a QX200 Droplet Digital PCR System (Bio-Rad). dPCR reactions consisted of 2x dPCR Supermix for Probes (no dUTP) (Bio-Rad), 900 nM final concentration target gene forward primer, 900 nM final concentration target gene reverse primer, 250 nM target gene probe, 20x Taqman human RNase P (RPPH1) Copy Number Reference assay (Life Technologies; Cat#4403328), and 10 ng of the prepared DNA. Target gene primers and probes EGFR (forward primer sequence CAGTCGGCCTGAACATAA; reverse primer sequence CCTGAAATTATCACATCTCCATCA; probe sequence CCTTGGGATTACGCTCCCTCAAGG, FAM, Black Hole Quencher), ERBB (forward primer sequence CTCATCGCTCACAACCAAGT; reverse primer sequence GGTCTCCATTGTCTAGCACG; probe sequence ACCCAGCTCTTTGAGGACAACTATGC, FAM, BlackHole Quencher), and MET (forward primer sequence AGTGATGTGATCTTTCACCTGT; reverse primer sequence AATGAGCGTCCGGCATAAA; probe sequence TATC CAGACAGGTAGGAGACCCAGC, FAM, Black Hole Quencher) were purchased from Integrated DNA Technologies. Droplets were generated using a QX200 Droplet Generator (Bio-Rad) and then transferred to a 96-well PCR plate. The plate was heat sealed with a foil seal and placed on a C1000 Touch Thermal Cycler (Bio-Rad). Amplification was performed as follows: 95 °C 10 minutes; 40 cycles: 94 °C 30 seconds, 60 °C 60 seconds; 98 °C 10 minutes; and 4 °C hold. Upon completion of amplification, droplets were analyzed on a QX200 Droplet Reader (Bio-Rad) using the CNV experiment setting. Copy number data for ERBB2, EGFR, and MET genes were analyzed using QuantaSoft software version 1.7.4.0917. Copy number was calculated as two times the ratio of positive target droplets to positive RPPH1 reference gene droplets within the same sample. Mean of the data points from replicates was used to represent copy number for a cell line.
Whole Exome Sequencing
A total of 500 ng of genomic DNA was sheared to 150–200 bp by Covaris E220 sonication (Covaris). After AMPure XP beads (Beckman Coulter) cleanup, the samples were checked for correct size distribution using 2100 Bioanalyzer system (Agilent). For manual library preparation, the fragmented genomic DNA samples were processed with end-repair, dA addition, ligation of sequencing adaptors, and two rounds of six cycles preamplification using SureSelect XT Target Enrichment System for Illumina Paired-End Sequencing library construction kit (Agilent). Next, 750 ng of amplified DNA was hybridized with a biotinylated RNA bait set (SureSelectXT Human All Exon V5; Agilent) at 65 °C for 24 hours. The captured genomic DNA fragments were enriched by DynalMyOne Streptavidin T1 beads (ThermoFisher) and amplified with barcoded index-attached primers for 12 cycles. The AMPure XP-purified libraries were checked for size distribution (300–400 bp) using Agilent Bioanalyzer and quantified using Library Quantification Kit (Kapa Biosystems). For robotic library preparation, the same conditions and procedures were applied by using Sciclone G3 NGS Work station (Perkin Elmer). A pooled library made by mixing two final libraries at equal molar ratio were clustered at 11 pM per flow cell lane using the Illumina cBot prior to sequencing on an Illumina HiSeq 2000 platform (Illumina). Sequencing reactions were run using 2 x 100 paired-end mode. Demultiplexed FASTQ files were generated with Casava v1.8.2 configureBclToFastq.pl (provided by Illumina) from the. bcl files. The multiple FASTQfiles generated by this script were concatenated and primer trimmed using the ea-utilsfastq-mcf tool with the following options: “-l 30 -q 10 -u -P 33” to remove Illumina PCR and sequencing primers from the sequences. The trimmed sequences were mapped to human genome hg19 reference sequence using the Burrows-Wheeler Aligner v0.6.2 aln and sample mode in default settings. 19 The resulting SAM files were converted to BAM format, sorted, deduplicated, and indexed using samtools and Picard. 19 We also applied samtools to calculate the coverage as the number of total reads mapped in each defined capture regions. In addition, we also applied the principle component analysis (PCA) to investigate the coverage distribution based on the matrix of number of coverages for all 221,749 capture regions from whole genome.
CNV Detection Method
For a given exon e, we fitted the linear regression model with the reference samples:

In the model, Yei is the coverage of exon e and sample i. Xi is the total number of mapped reads in sample i and ∊
ei
is the independent random error, which we assumed follows a normal distribution with mean 0 and variance parameter
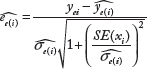
where yei is the observed coverage for sample i in exon e and

where
Number of References
We examined the effect of the number of reference samples on the stability of the CNV estimates. For seven robotic reference samples, we tested RefCNV using subsamples between the size of three to six references and calculated the MSRs of genes EGFR, ERBB2, and MET and then compared with the results of dPCR from 13 cell lines using Spearman's correlation.
Results
Coverage Distributions, Scaling Factors, and Slope between Two Library Preparation Methods
To build a whole exome-based linear regression model as reference, the NA12878 hapmap sample was chosen because it is a reference genome in Genome in a Bottle Consortium and has been well characterized for structural variants. 21 A total of 18 replicates of WES were performed by two different library preparation methods: manual or robotic (nine samples for each method). As shown in Figure 1, the scatter plot of the first two principal components of all 18 references of NA12878 computed on the coverage distribution and three distinct clusters were found. The coverage distributions were different between two library preparation methods of robotic and manual. In addition, two robotic samples were clustered together on the bottom with a unique coverage pattern because these two samples were run on a different sequencing machine from all the other samples. For CNV detection using this read depth-based method, it is important to choose the references with the same library preparation method and run on the same sequencing machine.

Scatter plot of first two principal components (PCs) from PCA of all replicated reference NA12878 prepared by two library preparation methods (red: robotic; black: manual).
For constructing the distribution of MSRs for all genes with more than two exons from whole genome, we separately fitted the linear regression model in each exon from seven samples prepared by robotic method (we removed two samples that ran on different sequencing machines) and nine samples prepared by manual method. Among all the 215,676 exons, 212,644 exons (∼98.6%) are less than 500 bps. For those exon regions less than 500 bp, Supplementary Figure 1 shows the scatter plots of
Constructing MSRs and Selecting the Thresholds for CNV Detection Method
For each exon, the standardized residuals of each replicate were predicted by the LOOCV method and separately analyzed by library preparation methods (manual and robotic). The MSRs were calculated by taking the median of all standardized residuals from all capture regions covered by a single gene. For gene-based results, we only select genes that have more than two exons (80.1% genes have more than two exons from whole genome in our data sets). The MSRs of all manual and robotic replicates are summarized in Supplementary Figures 2 and 3. Our proposed method shows expected normal coverage distribution and considers coverage variability between controls. Under the assumption that all genes have a copy number status of 2, we used 2.5% and 97.5% of all MSRs as thresholds for deletion (equal or less than one copy) and amplification (more than two copies) as predicting a new sample by setting the type I error rate α = 0.05 for CNV detection method. In summary, the 2.5% and 97.5% quantile MSRs are -1.93 and 2.06 for manual replicates and -1.34 and 3.38 for robotic replicates, respectively.
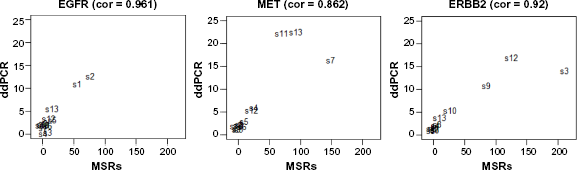
Scatter plot of median standardized residuals (MSRs) and digital PCR of 13 cell lines on genes MET, EGFR, and ERBB2.
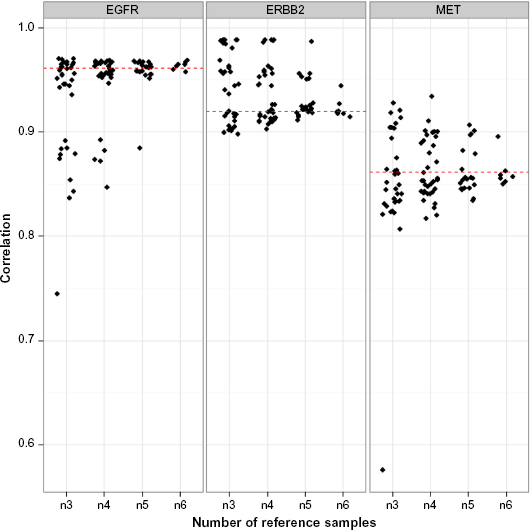
Correlation between MSRs and dPCR of 13 cell lines for genes EGFR, ERBB2, and MET.
RefCNV Prediction vs Digital PCR Experimental Results
Copy number variation of MET, EGFR, and ERBB2 genes has been reported previously in most of these cell lines, such as MET amplification in cell lines C-32, Hs746T, NCI-H1993, and SNU-5; EGFR amplification in cell lines A-431 and BT-20; and ERBB2 amplification in cell lines BT-474, MDA-MB-361, and MDA-MB-453.7–14 Table 1 shows the dPCR measured copy number results of MET, EGFR, and ERBB2 in 13 cell lines and CNV estimated by RefCNV using seven references replicates of NA12878 prepared by robotic method (two replicates sequenced on a different machines were excluded, Fig. 1). All of the cell lines reported previously were consistent between our CNV predictions of amplification and dPCR results from 13 cell lines. In summary, our predicted MSRs and dPCR from the cell line data were highly correlated (scatter plot in Fig. 2). The Spearman's correlation values between MSRs and dPCR are 0.961, 0.862, and 0.92 for genes EGFR, MET, and ERBB2, respectively. We also successfully estimated CNVs for the case of one copy deletion and two cases of one copy gain in the cell line Daoy, the dPCR values of genes MET, EGFR, and ERBB2 are 2.97, 3.12, and 1.15, respectively.
Copy number variation predicted by RefCNV and corresponding dPCR results.

Genome-Wide Copy Number Association with DNA Copy Number Reported by CCLE
We then performed a genome-wide comparison between RefCNV-estimated MSR values and copy number values measured by SNP array in 10 cancer cell lines from the CCLE. 15 A total of 15,613 genes with both available CNV data from both RefCNV and CCLE were used for this analysis. Since RefCNV cannot directly estimate the exact copy number, we used Spearman's correlation to test the gene copy number association between MSR values and copy number values reported by CCLE. The average Spearman's correlation among 10 cell lines from whole genome is 0.82. Supplementary Figure 4 shows the scatter plot of our MSR values and copy numbers from CCLE separated by cell line.
We then performed the same genome-wide correlation with CCLE data using gene-based CNV estimations from three other methods CONTRA, ExomeCNV, and cn.MOPS. The average Spearman's correlation values among 10 cancer cell lines from whole genome were 0.67, 0.57, and 0.39 using CONTRA, ExomeCNV, and cn.MOPS, respectively. There were only 11,127 genes (57.1% from whole genome) reported by CONTRA because P value threshold 0.05 was used for selecting the significantly changed regions in CONTRA; however, the missing rate is still high (77%) among 11,127 overlap genes. In addition, we also set up P value threshold 1 in CONTRA to keep all CNV predictions, and the average Spearman's correlation increased from 0.67 to 0.71. Both ExomeCNV and cn.MOPS kept more than 99% genes in gene-based CNV prediction but gave lower performance as compared with data in CCLE. Supplementary Figures 5–7 show the scatter plot of copy number predictions of CONTRA, ExomeCNV, and cn.MOPS and copy number predictions of CCLE separated by cancer cell line.
Correlation between MSRs and Copy Number Measured by dPCR Using Difference Number of Reference Sets
Figure 3 shows the Spearman's correlation between predicted MSRs using all subsamples of size three to six robotic references and the dPCR results of genes EGFR, ERBB2, and MET in 13 cell lines. We found that RefCNV can achieve more accurate (small variation) CNV estimations as increasing the number of references.
Discussion
With the reduced cost of new sequencing technologies, WES has become more affordable and replaced other traditional array-based approaches such as SNP array or aCGH for CNV analysis. In this study we developed an algorithm RefCNV to estimate gene-based CNV using WES data from a set of normal reference controls. By assuming the linear relationship between library size and coverage in each exon, we used the number of mapped reads as a predictor to estimate the coverage in each exon with a linear regression model, and the MSRs were applied to summarize the results from exons into gene-based estimates. First, we fit the linear regression model of coverage regressed on the library sizes from replicated controls. Second, the standardized residuals of all exons from each replicate were calculated by the prediction of coverages using the LOOCV procedure. Third, we summarized the results from exon-based into gene-based by taking the median of the standardized residuals from all exons covered by a gene to construct the expected normal coverage distribution. Finally, the prediction of gene-based CNVs is as follows: deletion, normal (diploid), and gain were identified by 2.5% and 97.5% (α = 0.05) quantile of all MSRs from the LOOCV procedure from controls using the same library preparation and sequencing method.
In this study, we showed RefCNV has the following novelties and advantages. (1) It does not require matched controls. Instead, RefCNV requires a set of normal reference data set, which can model the technical variability in coverage between samples to construct the normal coverage distribution. (2) We demonstrated that RefCNV prediction became more stable (less variation) as the number of reference samples was increased (more than six reference samples). There are still some limitations to our approach. RefCNV considers only genes with more than two exons, which retains 80.1% genes from the whole genome, but we kept more genes than CONTRA (57.1%) by setting P value threshold 0.05 and we show better performance in genome-wide association than ExomeCNV and cn.MOPS as compared with copy number value estimated by CCLE. Also, RefCNV cannot estimate the exact number of copies for CNVs. We have observed that a value of 5 for the MSR scale maps to one DNA copy and provides a guide for the interpretation of the MSR values in practice. In addition, RefCNV assumed that all genes in the reference samples are diploid, which may be wrong for few sites; however, Parikh et al, developed a method to define a set of true structural variants of insertions and deletions within NA12878, 22 which can be incorporated in our proposed algorithm to reduce the false-positive rate for CNV detection method. The knowledge of known CNVs in the reference set can be used to mask those regions and avoid false calls. We have also identified some key factors that are required when creating a reference set for calling CNVs with WES. Samples in the reference set should be processed and sequenced in the same way as the new samples.
We observed that a few of RefCNV calls were discordant from copy number measured by dPCR in Table 1. Especially, copy number of three genes measured by dPCR in HOP-92 (A vs 1.89 for MET, A vs 1.95 for EGFR, and N vs 1.25 for ERBB2) tended to be lower than RefCNV calls. Similar results were observed for MET and EGFR in BT-474. We examined the copy number of RNaseP (RPPH1) gene reported by four methods and found that the RPPH1 is significantly amplified in HOP-92 (5.18 by cnMOPS, 4.17 by exomeCNV, CONTRA failed to call this gene, and RefCNV did not call as less 3 exons in this gene) and BT-474 (4.1 by cnMOPS, 4.2 by exomeCNV, CONTRA failed to call this gene, RefCNV did not call as less 3 exons in this gene), while the copy number is normal in other cell lines. Because the copy number of RPPH1 is used to normalize in dPCR measurement, the RPPH1 amplification causes underestimation of copy number by dPCR method.
We have implemented our algorithm in an R script RefCNV, which is available at GitHub from https://github.com/lunching/RefCNV. The program can take output of coverage generated by bedtools 23 (http://bedtools.readthedocs.org/en/latest) as input. We provided background information and tutorial to facilitate researchers when using our algorithm to predict gene-based CNV estimates.
To summarize, RefCNV allowed the identification of gene-based CNVs and paved the way for selecting replicated controls for CNV study. The RefCNV algorithm is empirically based and allows for local adjustment for differences in sequence read coverage across genomic regions. The method is based on establishing a set of normal reference controls, and we indicated an important issue to consider when assembling a reference set, which can be a complementary tool to existing methods for CNV prediction.
Author Contributions
Supervised the whole project: EP. Analyzed the data: LCC, EP. Wrote the first draft of the manuscript: LCC. Agree with manuscript results and conclusions: LCC, BD, CJL, HS, CC, PM, EP. Jointly developed the structure and arguments for the paper: BD, CJL. Performed partial statistical analysis: HS. Made critical revisions and approved final version: EP, CJL. Performed all the bench work: BD, CJL, CC, PM. All authors reviewed and approved of the final manuscript.
Supplementary Materials
Footnotes
Acknowledgments
We are grateful to Dr. Richard Simon for his advice and suggestions for improving the methodology. The abstract of this paper has been published in advance of a presentation to be given at JSM2016 in Chicago.