
Abstract
We aimed to find clinically relevant gene activities ruled by the signal transducer and activator of transcription 3 (STAT3) proteins in an ER(–) breast cancer population via network approach. STAT3 is negatively associated with both lymph nodal category and stage. MYC is a component of STAT3 network. MYC and STAT3 may co-regulate gene expressions for Warburg effect, stem cell like phenotype, cell proliferation and angiogenesis. We identified a STAT3 network in silico showing its ability in predicting its target gene expressions primarily for specific tumor subtype, tumor progression, treatment options and prognostic features. The aberrant expressions of MYC and STAT3 are enriched in triple negatives (TN). They promote histological grade, vascularity, metastasis and tumor anti-apoptotic activities. VEGFA, STAT3, FOXM1 and METAP2 are druggable targets. High levels of METAP2, MMP7, IGF2 and IGF2R are unfavorable prognostic factors. STAT3 is an inferred center regulator at early cancer development predominantly in TN.
Introduction
Cancer is one of the major killing diseases worldwide. Among them, breast cancer (BC) has quickly become the most commonly diagnosed malignancy of women in Taiwan during the past decade. 1 Such a global disease has its own heterogeneity clinically and molecularly. Up to now, ER(–) breast cancer population still needs as many efficient therapies as ER(+) one has. The poor prognostic features for both triple negatives (TN) and ERBB2+ have been considered as the top two killing subtypes in breast cancer. 2 A recent review on TN tumors 3 pointed out that TN is a heterogeneous group of multiple molecular subtypes of breast cancer.
To resolve the complexity of disease like cancer using systems approaches, which have integrated transcriptomic data into molecular network, they show promise in their ability to classify tumor subtypes, predict clinical progression, and inform treatment options.4,5 We proposed to search for the transcription factors critical to a subset of ER(–) breast tumor development with the aid from the new statistical approach 6 on analyzing genome-wide gene expression data of 91 infiltrating ductal carcinoma (IDCs).
Many transcription factors have been predicted to be determinants of clinical indices in 91 IDCs. Their clinical niches are under investigation. In this study, we are interested in unraveling the role(s) for the most recognized signal transduction pathways in both mammary gland and breast cancer development involving the STAT3 protein,7–10 which is a transcription factor (TF). The Stat family of transcription factors is known to have diverse roles in mammary gland development. 7 STAT3 is widely overexpressed in breast cancers. 11 It has been classified as a proto-oncogene 8 and suggested as a therapeutic target of cancers in model systems. 12 Up to now, roles of STAT3 in clinical breast cancer population study remain either controversial or not completely understood. For instance, the prognostic value of STAT3 in human breast cancer remains controversial and associations range from favorable to unfavorable. 13 We revisit this research topic because we noticed an elevated expression of STAT3 in triple negatives as compared to that in ERBB2+ in the cohort (77A). This could be subtype enriched transcriptional activities in causing unique pathological phenotypes. We would like to use this established method of ours—CIDUGPCC to unravel the potential network activities of STAT3 in a subtype enriched manner. Network medicine may be desirable in future medicine.14,15
Here, we proposed the diagnostic and/or prognostic roles of STAT3 transcriptional regulatory network to be predicted at a global transcriptome scale in a clinical breast cancer population. Furthermore, the annotated gene activities of STAT3 subnetworks will be supported by inferred biochemical pathways, patients diagnostic result(s), clinical outcome and published research evidence by others.
Materials and Methods
Features of surgical specimens in 103 breast cancer gene expression profiles
We obtained 91 specimens of primary infiltrating ductal carcinoma of breast (IDC) consisting of five subgroups. They are triple negatives(48/91), ERBB2+(29/91), ER(–)PR(+)HER(–)(5/91), ER(–) PR(+)HER(+)(6/91) and ER(–)PR(+) but HER(?) (3/91). Five specimens for metaplastic carcinoma of breast (MCB) were included in this study. Seven non-tumor samples were surgically taken from breast tissue adjacent to some of 91 ER(–) IDC breast tumors as a control. Those samples were obtained from patients who underwent surgery at National Taiwan University Hospital (NTUH) between 1998 and 2007. Breast cancer samples containing relatively pure cancer as defined by greater than 50% tumor cells per high-power field examined in an adjacent section of tumor sample are for this study. 16 All patients had given informed consent according to the guidelines approved by the Institutional Review Board at NTUH. Total dataset for 103 gene expression profiles (103A) used in this study has been submitted to NCBI-GEO. Its accession number is GSE32641. Both TN and ERBB2+ are major subpopulations among four subtypes of ER(–) breast cancer cohort. In addition, the mRNA levels of both STAT3 and MYC are elevated in TN but are in low expression mode in ERBB2+ (Fig. 3). We decided to only pick up those two subtypes of ER(–) IDCs (77 IDCs) for entire network study to control the confounder from a small number (N = 14A) of other subtypes in 91 IDCs. However, some comparisons were made among 91 IDCs, 5 MCBs and 77 IDCs in this study.
Immunohistochemical (IHC) stain of paraffin-embedded breast cancer slides
A standard biotin-streptavidin-peroxidase procedure with automated IHC systems (Benchmark, Ventana Medical Systems, USA) was used. For visualization of immunostain, we applied diaminobenzidine as a chromogen (i view™ DAB Detection Kit, Ventana Medical Systems, USA). The primary antibodies described inside parentheses were used for detection of ERα (ER-SP1, Ventana Medical Systems, Inc., Tucson, AZ, USA), PR (PGR-5D10, Abnova, Taipei City, Taiwan) and ERBB2 (polyclonal antibody against human c-erbB2 antigen, Dako Cytomation, Denmark) (dilution ratio at 1:800), respectively. The final IHC stains of ER, PR and ERBB2 (HER) on slides were examined by two experienced pathologists (SMJ and HCL). For ERBB2 (IHC score: 2+), determination of Her-2/neu gene copy number by chromogenic in situ hybridization (CISH) was performed (Figs. 4A and B). The CISH study results were evaluated with a regular light microscope (Nikon E600) and they were counted by a pathologist (SFH). 17
A noninvasive vascularity detection in vivo and baseline characteristics of the studied patients
Mammography has been the mainstay of breast cancer screening worldwide. It can detect the microcalcification in breast lesions for stage 0 breast cancer patients. However, microcalcification in breast lesion is difficult to be detected by mammography for Asian women as compared to Caucasian women. Alternatively, a noninvasive Doppler ultrasound has been applied for breast cancer screening in Asian women population (e.g. Taiwanese women) who have the morphological view of breast tissue denser than those of Caucasian women. 18 Both vascular patterns and vascular density are quantitatively measured in tumor section using this technique in coupling with a computed image processing system, which automatically calculate the density of vascular signals (designated as “vascularity index”) within the tumor tissue of interest. 19 Vascularity index (VI) measures both microvasculature and macrovasculature at once. In particular, color Doppler ultrasound was reported to be able to depict larger vessels of approximately 100 μm or larger in diameter in vivo.20,21 Clinically, the in situ detection of biochemical activity for a sonogram of interest via immunohistochemistry reveals the remodeling vascularity in tumor section may be traced by sonograms. The angiosonograms are in vivo evidence of angiogenesis. The performance for detecting angiogenesis activities of breast tumors using color Doppler ultrasound that now is routinely used at NTUH. We have gathered some angiosonograms for patients in this study. The following clinical variables were studied: ER, PR, HER, lymphovascular invasion (LVI), lymph node metastasis (LYM), number of lymph node positive (LNM), age (years: <48 or >48), tumor size (in centimeters), histological grade (including nuclear pleomorphism (NP), mitotic count (MC) and tubule formation (TF)) and clinical stage (Table 2).
Microarray data analyses
A gene profile per breast tumor specimen was analyzed using Human 1A (version 2) oligonucleotide microarray (half a genome size: 22k). 16 We used a new measure of association called coefficient of intrinsic dependence (CID) in combination with Galton Pearson's Correlation Coefficient (GPCC) to analyze the continuous variables (e.g. the gene expression profiles) genome-wide. We built a transcriptional regulatory network by performing the analysis of CID-TFUGPCC (Fig. 1). The brief flow of entire analyses involving the CID procedure explains how those get extended in this study (Fig. 2).

The core methodology of CID-TFUGPCC. A procedure for producing a transcriptional regulatory network of interest in silico via performing the combined method—CIDUGPCC is presented as follows. A selected dataset, which contains gene expression profiles of a population with mixed categories of interest, was chosen for study. The mRNA levels of a selected transcription factor in the given dataset were analyzed by the combined statistical measures (i.e. CID and GPCC) to produce 2 2 possible sets of results. Before CID measurement, a clustering strategy is applied to divide a pool of data, which contains different mRNA levels of a TF, into several subpools based on the similarity in mRNA expression patterns of the TF within each subpool.

The flow chart of steps involved in establishing the transcriptional regulatory network in relation to biochemical phenotypes, malignant phenotypes and clinical outcomes. A self-contained summary of the CID procedure is presented. A major scheme (linked by dark arrows) includes (1) ANOVA test on a TF of interest against seven clinical indices; (2) CID-TFUGpCC analyses on a selected population based on its significant features evaluated by ANOVA; (3) Venn Diagram analysis on the selected gene pools (networks) from the results of step (2); (4) Functional validation of a subnetwork of interest derived from step (3) by its gene expression patterns in different clinical indices, by its prediction in clinicopathological features and by its supporting literature documentation. A side scheme (linked by light arrows) is based on the same dataset but using a different TF to carry on steps (2)–(4).
The correlation between the mRNA level of a selected TF and the clinical index was analyzed by applying analysis of variance (ANOVA) to dichotomous and multichotomous indices, respectively. 22 We, therefore, selected the clinical significant subpopulations for network approach using the analysis of CID-TFUGPCC.
CID has the advantage of identifying indirect (or non-linear) regulatory association between a TF and its target gene. On the other hand, GPCC preferentially identifies direct (or linear) regulatory association between a TF and its target gene. Thus, it is necessary to combine both unique regulatory actions of a TF on its target gene to construct a TF mediated transcriptional regulatory network. The rationale of using both methods together has been described in Liu et al. (2009). 6 In this study, we use hierarchical clustering 23 to subgroup data before CID measurements that is to replace quantile clustering described previously. 6 It is the key clustering strategy in mimicking a pre-programmed transcriptional activity mediated by a selected TF to be clustered into a subgroup for CID analysis. We also take advantage of a unique feature of CID in measuring the association for a small N in each subgroup (N ≈10). After hierarchical clustering on the data in a given sample population, we set the final number of subgroups to be rounding number for 1/10th the total sample number (i.e. 8 subgroups for 77A) before CID measurement. The mRNA data partitioning for a perturbed transcription factor in a given population may be clustered based on the similar gene expression patterns. Only some unique situations may need other clustering strategies 24 before CID measurement. We evaluate significance (P ≤ 0.05) of both statistical measurements. If either one or both show significance, we point arrows from the TF toward its predicted target gene pool to form a network (Fig. 1).
We used Gene Spring GX7.3.1 (Agilent Technologies, USA) for generating Venn Diagrams. This analysis allows gene pools to be extracted from overlapped network and/or non-overlapped ones when two networks of interest are compared. In addition, for biochemical pathway profiling of a selected transcriptional regulatory network, we included gene pools in the signal transduction pathways from both KEGG and NCBI databases to be compared with those in the network. We also evaluated the common gene pools shared by network and clinicopathological parameter(s). Based on current version of gene annotation from NCBI database, we were able to do functional prediction on gene lists in subnetworks within the selected network. We demonstrated gene expression patterns of those subnetworks in heatmaps along with (1) their relevant clinical categories; (2) their prediction power for the new clinicopathological feature(s); and (3) their supporting literature documentation to further functionally validate network results.
The heatmaps showing gene expression patterns were displayed after unsupervised hierarchical clustering. Three steps are included as follows. First, the log2 ratio for each gene was first centered by subtracting the mean across all samples to discriminate the subclass of the dataset. Then, the selected gene expression profiles were fed into software for displaying gene list (Y axis) and patient arrays (X axis) based on unsupervised hierarchical clustering analysis on gene profiles of selected arrays. Lastly, to generate feature color bars underneath of the heatmap, we only locate each feature of interest based on the final heatmap display.
We evaluated the significance (P ≤ 0.05) for a time course changes in the number of survival cases after surgical removal of tumor parts in two patient groups by Kaplan-Meier curves of overall survival. 25 Those two groups were split from a given population based on their mRNA expression levels of a probe of interest (i.e. the ranking status for high expression levels of a selected probe in a group is at top 10% of the given population as compared to that in another group.) or were two selected patient groups based on their distinct features. 25 Those two selected patient groups have follow-up data extending for less than 20 year period.
Computing P-values for results from univariate CID and GPCC analyses
The univariate CID result for a given TF was designated as CID-TF. Instead of all subgroups having an equal size (N ≈ 10), 2 we divided the cohort by hierarchical clustering 23 (described in method as above) to mimic biological systems in which similar expression pattern in a subgroup may reflect the similar biological event shared by the members within a subgroup. The subgroup was designated as j. For instance, each subCID value of the assigned subgroup (j) is determined in part by the sample size of the subgroup j, a constant value and the two times square of difference between cumulative distribution function (CDF) of the mRNA levels for a gene Y in the subgroup j and the average CDF of the mRNA levels for a gene Y in a given population. Gene Y stands for a potential target gene of a TF of interest. Total CID value demonstrates the degree of dependence between a TF and its target gene. 6
To access the significance of univariate CID values generated via in silico analyses and to facilitate comparison among data derived from different types of methods, the univariate CID value, S, was compared with the values generated by random sampling mimicking the data distribution of gene Y that is independent on the data partitioning of an assigned TF. In 77A study, the independent data distribution was derived from randomly drawing 77 simulated values for an artificial gene and put the appropriate number of data for this gene in each subgroup that is the same as the sample size in each pre-clustered subgroup. We re-computed the subCID value of each subgroup and added them together to be a new CID value (K). This was repeated 1,000 times and yields 1,000 of CID values (K i , i = 1–1,000). The P value was determined by an equation (i.e. P = (1+ N(ki≥S))/1,001, where N(ki≥S) is the number of K i values greater than S). The P values for GPCC measurements were computed using asymptotic normal theory. 26 We set the cut off point for P value of both methods to be significant when P ≤ 0.05.
Results and Discussion
STAT3 is critical to ER(–) breast tumor development
CID-STAT3UGPCC pulls a gene pool containing potential target genes of STAT3. Based on current version of functional annotation for each potential target gene of STAT3 (NCBI database), we have only observed a few cancer related activities described in the text below. Most of those genes are shared determinants of seven clinical categories. The global pathophysiological activities of STAT3 are not visible because the limiting factor (i.e. each gene expression profile per tumor sample containing half a genome size of probes is used for analysis) allows the amount of genes in a network being partially retrieved. Importantly, a few malignant phenotypes as well as prognostic factors are reflected by the gene components in the selected STAT3 subnetworks indicating the important role of STAT3 in an ER(–) breast cancer population (Tables 1 and 3).
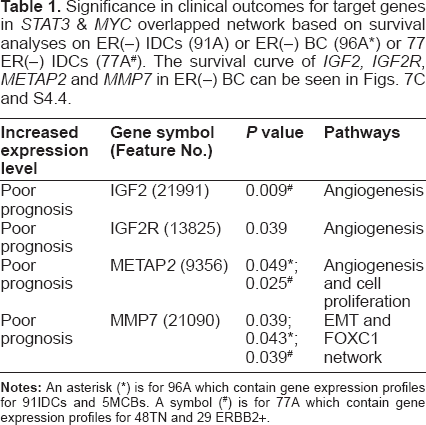
Significance in clinical outcomes for target genes in STAT3 & MYC overlapped network based on survival analyses on ER(–) IDCS (91A) or ER(–) BC (96A*) or 77 ER(–) IDCS (77A#). The survival curve of IGF2, IGF2R, METAP2 and MMP7 in ER(–) BC can be seen in Figs. 7C and S4.4.
The pathological information (Clinicopathological parameters) for ERBB2+, triple negatives (TN) and metaplastic carcinoma of breast (MCB).

Up regulated cancer related genes in the overlapped network of clinically significant (CS) STAT3 or of CS MYC & STAT3 and their predicted phenotypes.

Major clinical implications of STAT3 in 77 breast cancer gene expression profiles
STAT3 is a negative determinant of lymph nodal category and of stage in ER(–) infiltrating ductal carcinoma of breast (Fig. 3). We selected those gene pools, which contain STAT3 and are relevant in two clinical indices, to find their shared gene cluster by Venn Diagram analysis (Fig. 4C). We observed that both ARNT (also known as HIF1B: the beta subunit of a heterodimeric transcription factors –HIF1 and HIF2) and MYC were two transcription factors in a STAT3 cluster for two clinical indices (Table S1.1). Only MYC but not ARNT was predicted to be a target gene of STAT3 transcriptional regulatory network (Table S1.2) although there were at least 70 transcription factors and/or their sub-units within this network. The inferred STAT3 target genes in clinically significant (CS) STAT3 transcriptional regulatory network (4,418 probes) has broad effects on seven clinical categories typically in NP, LNM and stage (Data not shown). Only a few genes are also found in Warburg effect (IDH3G), metastasis (BOP1, FOXC2 and MMP17) and angiogenesis (TYMP)(Table 3). Whereas transcription factor ARNT but no STAT3 was found to be in a MYC cluster for three clinical indices (Table S1.3). Interestingly, a MYC transcriptional regulatory network shared by those three clinical indices predicted STAT3 to be a MYC target gene (Fig. 5B and Table S1.4). This indicates both MYC and STAT3 mutually regulating each other (Fig. 5A). Therefore, we hypothesized that clinical roles of STAT3 may be mainly the combined effect of MYC and STAT3 regardless of more than 70 transcription factors being inferred target genes of STAT3 (Table S1.2).

Upper panel, univariate analyses of STAT3 mRNA levels on seven clinical indices—HER, LVI, lymph nodal category (LYM, LNM), age, tumor size, grade (Nuclear pleomorphism, Mitotic count, Tubule formation) and stage in ER(–) IDCs (

Examples of ERBB2 status determined by results of both CISH (left side picture) and IHC (right side picture) in (
MYC is known to be an oncogene. 27 We observed aberrant expressions of both MYC and STAT3 predominantly in TN as compared to those in ERBB2+ (Fig. 3). Its pathological roles in TN are of our interest. We selectively investigated a STAT3 mediated transcriptional regulatory network involving co-regulation with MYC in TN during tumor progression. Many transcription factors were statistically identified to be target genes of both MYC and STAT3 (Tables S1.4 & S1.5). Differential expressions of 268 probes were predicted to be significantly regulated by MYC and STAT3. They are commonly found in three clinical indices (LNM, LVI and Stage) of 77 ER(–) IDCs (Fig. S3.8 and Table S1.6). The potential pathological roles contributed by this core network are summarized in a bar chart (Fig. 4E). Major clinical niches of this core network fall into two categories (LNM, stage). In addition, we found LVI, NP, LYM, MC, grade, size, TF and age to be also determined by STAT3 in coupling with MYC, in part. Major gene activities of this core network (241/268) were found to be commonly significant in TN subtype and relevant to those clinical categories except 27 probes (27/268) (Table S1.7 and Fig. S3.8). The annotation for their biological and cancer related roles are in Table S1.7. Notably, both MMP17, STAT5a were predicted to be up-regulated by MYC and STAT3 (Fig. S3.8). Membrane-type 4 matrix metalloproteinase (MMP17) promotes breast cancer growth and metastases. 28 Deregulated MYC expression up regulates a known antiapoptotic survival pathway in vivo involving STAT5a. 29 As such, those authors speculated that MYC may require activation of STAT5 as a mechanism to avoid apoptosis in the processes of tumor initiation and progression. Other annotated gene functions in 268 probes (Table S1.6) should not be only limited as they are now because each gene product may have more than one function to potentially predict its sum activities driven by MYC and STAT3 in relation to breast cancer development. Future studies will be needed to support our findings.
Hunting for malignant phenotypes indicated in STAT3 network in relation to multiple steps of tumorigenesis
We reasoned that STAT3 is mainly coupling with MYC to be involved in activities of tumorigenesis in STAT3 network. They may include activities documented from in vitro studies by others.
Firstly, we tested TN enriched MYC & STAT3 overlapped transcriptional regulatory network for their predicted gene activities in signal transduction pathways. Nine common signal transduction pathways (Fig. 4F and Tables S2.1–2.9) were tested to be regulated by both MYC and STAT3, in part. Genes within overlapped network of MYC & STAT3 in seven signal transduction pathways showed their expression patterns in heatmaps (Tables S3.1–S3.7). We determined the most relevant biochemical activities as the candidates for identification of malignant phenotypes enriched in TN.
In addition, we observed genes involved in epithelial mesenchymal transition (EMT) and Warburg effect to be in an overlapped network of MYC & STAT3 (Table S1.5). As a result, we selected four STAT3 subnetworks co-regulated by different combination of TFs (Figs. 5C–F). Those subnetworks and their corresponding dynamic changes during tumor development are presented in Figure 6. We concluded that four enriched activities are sustained angiogenesis, cell proliferation, EMT and Warburg effect. Two distinctive subnetworks were further illustrated along with their relevant clinical implications (Fig. 7).

Functional analyses on STAT3 gene partners in TN via (1) predicted subnetworks derived from genes in STAT3 & MYC overlapped network in both TN and ERBB2+ breast cancer gene expression profiles (

Heatmaps for subnetworks of MYC & STAT3 differentially coupling with ARNT, FOXM1 in different clinical indices and subtypes of breast cancer. Non-tumor part (NT) serves as a control. Unsupervised gene expression patterns were clustered for subnetworks of three altered biological events (

Further evaluation on two novel gene sets predicted to be involved in tumor angiogenesis and mitotic count promotion, respectively. Two heatmaps are displayed for subnetworks of MYC & STAT3 differentially coupling with ARNT/HIF1A, ARNT/HIF2A, and FOXC1 in three subtypes of breast cancer (TN, MCB, and ERBB2+) (
Four functional subnetworks to be present in biochemical and/or malignant phenotypes enriched in TN
In this study, only five metaplastic carcinoma of breast (MCBs) were available to be compared with two subtypes of ER(–) IDCs by their heatmaps although a large number samples will be needed for future validation. Five MCBs 16 are triple negatives (Table 2) and were included to test if MYC & STAT3 regulatory activities are shared among ER(–) breast cancer subtypes.
A metabolic transcriptome involving STAT3 network
Warburg effect in ER(–) IDCs was mainly due to MYC directed transcriptional up regulation on PC, OGDH, GLS, LDHB and IDH3G that was predicted by MYC transcriptional regulatory network. Only PC, OGDH and IDH3G were predicted to be co-regulated by STAT3 (Figs. 5D and 6B). In TN enriched MYC network, GLS and LDHB were predicted to be downregulated by ESRRG and to be ESRRG target genes. No significant tumor suppressive event predicted to be regulated by ESRRG was found except that down regulation of LDHB may decrease mitotic counts (Fig. 6D and Table S4.1) in ER(–) breast cancer. Interestingly, LDHB was up-regulated in non-tumor part which may suggest its physiological role. In addition, ESRRG may up regulate HK1 in ERBB2+ that is a determinant of LVI and of tumor size (Table S4.1 and Fig. 5D). We observed that MCBs show similar gene expression patterns for Warburg effect as compared to TNs (Fig. 6B).
Phenotype like mesenchymal stem cells in tumor pathogenesis involving action of STAT3 network
Both MYC and STAT3 have been identified to contribute in Stemness. 30 In triple negatives, we observed up-regulating expressions of TWIST1, SNAI1, FOXC1 and FOXC2, in the overlapped network driven by MYC and STAT3 to suggest some of EMT gene activities. Part of their roles is known as epithelial repressing TFs or mesenchymal activating TFs. 31 After clinicopathological characterization of those subnetworks, we immediately observed FOXC1 to be heavily involved in cell proliferation and MELK related proliferative activities (Figs. 5C, F, 6C, D, Table S4.1). MELK is a determinant of histological grade and of mitotic count in ER(–) IDCs (Table S4.1). MELK has been documented to be up-regulated during mammary carcinogenesis, a poor prognostic factor of breast cancer and a promising therapeutic target for multiple cancers.32–35 Many transcription factors besides FOXC1 in MYC & STAT3 overlapped network are also determinants of mitotic count (Table S4.1). In addition, it predicted KLF4 and NOTCH1 to be up-regulated predominantly in TN via MYC and STAT3 co-regulation. This suggests that some of ES like phenotype ruled by MYC & STAT3 transcriptional regulation(s) may increase the invasiveness of TN. On the other hand, the counter parts of TN tumor specimens also express some of those transcription factors (the pluripotent factors) supporting the finding for breast stem/progenitor cell markers in both normal and tumor samples. 36 Those gene activities of TWIST1 and SNAI1 in normal development of the ductal network during mammary gland development as well as in promoting distance metastasis for breast cancer progression have been documented. 37
Other published data showed that HIF1 and HIF2 actively induced EMT event via coupling with the existing STAT3 in tumor setting. 38 It supported the prediction shown in Figure 5E. Typically, they found that HIF2 α correlates with distant recurrence and poor outcome in invasive breast cancer. 38 However, no significant findings for the potential role of HIF2 α (EPAS1) based on this study (Table S4.1). We observed high expression level of HIF2 α mRNA in the heatmap of tumor adjacent counterpart (Fig. 6C), although all the current research evidence by others suggested no critical role for HIF2 a during mammary gland development. Its protein level is undetectable in some non-tumor part. 39 Therefore, our finding on a relatively high mRNA expression level of HIF2 α in non-tumor samples deserves future study in a large cohort. For this subnetwork, MCBs show similar gene expression pattern with a subset of TN and ERBB2+ (Fig. 6C).
Increased tumor survival mechanism via sustained angiogenesis involving STAT3
We hypothesized a pathway for sustained angiogenesis, which is proved to be significant in the overlapped network of MYC & STAT3. Fig. 5C shows that it includes the IGF2–IGF2R-PLC_2 axis 40 and VEGF signaling (KEGG database). Based on network approach and signal pathway profiling, it infers both HIF1 and HIF2 interacting with STAT3 to lead a functional transcriptome mainly consisting of METAP2 and VEGFC possibly for sustained angiogenesis. VEGFA is a direct target gene of HIF1 41 and STAT3. 42 In the meantime, we observed both MYC and STAT3 networks that may rule both VEGF and PDGFRB signal transduction pathways to sustain angiogenesis during ER(–) breast tumor development. The cross talking between two pathways for the sustained angiogenesis is via STAT3 (Fig. 7B).
The activation of PDGFRB signal transduction pathway has been documented 43 during lymphangiogenesis involving activity of VEGFC. It involves STAT3-mediated MYC expression for Src transformation and PDGF-induced mitogenesis. 44 We observed the predicted actions of ARNT in regulating PDGFRB, VEGFC and VEGFA during stage progression. In addition, METAP2 is within STAT3 & ARNT overlapped network and were predicted to be regulated during LVI progression (Data not shown). We also found that c-Src mRNA expression was associated with LVI in ER(–) IDCs (Table S4.1). C-Src is activated by METAP2 45 that allows the activation of STAT3 to functionally regulate STAT3 network (see the mechanism in a paragraph below). We, therefore, hypothesized that other transcriptional regulatory pathways, such as HIF1/STAT3 and HIF2/STAT3, may control in expressions of VEGFA, VEGFC and METAP2 during tumor angiogenesis in ER(–) population.
In the meantime, we observed from the heatmaps (Figs. 7A and S3.6) that the non-tumor part showed relatively low expressions of genes in PDGFRB signaling pathway, suggesting that it may slightly participate in VEGFC induced vascularity as well as in constitutive activity of METAP2 for physiological states in non-tumor part of breast tissue. Further comparison on the relative mRNA levels of a few key angiogenesis related genes in box plots (Fig. S4.3) revealed difference among TN, ERBB2+ and non-tumor part. MCBs appear to have sustained angiogenesis and their gene expression patterns are similar to subsets of patients in both TN and ERBB2+ (Fig. 7A).
Based on the hypothesis shown in Figure 7B, we suspected that blocking the activities of METAP2 will indirectly inhibit angiogenesis in ER(–) IDCs. The supporting data by others are (1) C-Src is activated by METAP2 that is involved in the cotranslational removal of protein initiator methionine of c-Src 45 ; (2) Functional c-Src is found to activate transcriptional activity of STAT3 via tyrosine phosphorylation on Y705 45 ; (3) Both VEGFA and VEGFC are target genes of STAT3.46,47 Together, we proposed that the inhibitory mechanism on angiogenesis by targeting METAP2 may be not only through c-Src but through other molecules which are activated via translational and posttranslational regulation by this bifunctional protein—METAP2/eIF2 alpha binding protein.48,49
Tumor proliferative activities regulated by network of STAT3 and/or that of other TF(s)
Dynamic changes in expressions of a few candidate biomarkers are mediated by STAT3 during tumor development. We found that inappropriate expression and activation of STAT3 lead to pathogenesis at early stage of disease progression. As a consequence of STAT3 action, one of its target genes—FOXC1 determines part of cell proliferation during grade promotion typically shown in tubule formation (Table S4.1). On the other hand, mRNA expression of METAP2 is predicted to be suppressed by MYC and STAT3 (Fig. 5C). It may suggest its proliferative activity 50 to be at relatively late stage of tumor development. Interestingly, METAP2 is the determinants of stage, LYM, LVI, NP and tumor size (Table S4.1). Other line of research evidence suggested METAP2 to be an oncogene 50 that supports our findings. Both FOXC1 and FOXM1 are two gene partners of STAT3 for grade development. This is a TN enriched event. We observed MELK to be up-regulated by both FOXM1 and FOXC1, respectively (Fig. 5C). MELK is a grade determinant. Both MELK and DEK are determinants for mitotic counts (Fig. 6D) in ER(–) IDCs suggesting FOXC1 network interacting with FOXM1 network for uncontrolled proliferative activities. MCB shares the gene expression patterns with TN and a subset of ERBB2+ (Fig. 6D and part of Fig. 6A). The role of up-regulated DEK in non-tumor part deserves further investigation in a larger sample size. FOXC1, MELK and DEK are known as markers for poor prognosis.25,33,51,52 Gefitinib is known to suppress FOXM1 expression. 53 Moreover, FOXC1, MELK and DEK may be candidates of druggable targets for anticancer treatments of subsets of TN, MCB and ERBB2+.
Validation of major functional MYC & STAT3 subnetworks in TN and ERBB2+
The STAT3 network predicted STAT3, METAP2, VEGFA and FOXM1 to be druggable targets for treating subsets of TN, MCB and ERBB2+ patients (Figs. 5A and C). A few transcription factors are within multiple routes of transcriptional regulation on their target genes via interacting with STAT3. They significantly take part in building up not only some biochemical phenotypes (Fig. 4F) but a few morphological phenotypes (Figs. 5, 6 and 7) for subsets of patients in both TN and ERBB2+. Each protein encoded by a target gene of STAT3 may have multiple functions and its clinical impacts may just start to be unraveled through connecting with the functional transcriptomes of those major transcription factors via network approach. We predicted their functions in vivo by their gene annotations, pathway profiling and their aberrant expression during tumor development.
We were able to validate those statistically predicted transcriptome within STAT3 network in relation to sustained angiogenesis in vivo (Fig. 7A). We examined the color Doppler vascularity and mRNA expressions of angiogenesis-related molecules within MYC & STAT3 networks of each patient (see the heatmaps in Fig. 7A). As a result, those patients whose breast tumors expressed a transcriptome coding for proteins in sustained angiogenesis were detected to be positive in vascularity (see angiosonograms in Fig. 7a, c and d). Figure 7b has invisible vascularity but having high VEGFA mRNA expression that suggests tumor vascularity of that patient to be below the sensitivity limit of color Doppler ultrasound. We further evaluated the prognostic power of those genes (see Fig. 7C) within functional MYC & STAT3 overlapped network in ER(–) breast cancer populations (77A, 91A or 96A). High level of METAP2 mRNA expression is an independent prognostic factor associated to reduced breast cancer–specific survival in ER(–) population (P = 0.049, 96A; P = 0.025, 77A). So are to MMP7 mRNA expression (P = 0.039, 91A; P = 0.039, 77A), IGF2R mRNA expression (P = 0.039, 91A) and IGF mRNA expression (P = 0.009, 77A) (Table 1 and Fig. S4.4).
Dynamical changes of network activities mediated by STAT3 and MYC enriched in TN
MYC & STAT3 overlapped network is known heavily involved in both stem cell and breast cancer development. Both MYC and STAT3 are master TFs. We observed that they have broad spectrum effects on tumor development due to numerous TFs to be their gene partners in each individual network (Tables S1.1–S1.7). For instance, we observed a set of TFs differentially expressed in MYC network and some are clinicopathological determinants (Fig. 5B and Table S4.1). There are multiple transcription factors within MYC & STAT3 overlapped network. As such, the oncogenic activities of this network in contributing to clinicopathological categories will provide functional links between gene pools and their potential niches in breast cancer development.
In reality, the transcriptional regulatory network approach is beyond the scale of individual TF alone but involving more interactions among TFs. We did identify four oncogenic activities—Warburg effect, EMT, cell proliferation and angiogenesis based on their gene profiles predicted to be driven by a few combined co-regulatory events among five major TFs—MYC, STAT3, ARNT/HIF1α, ARNT/HIF2α and FOXM1. Therefore, multivariate portion of its network should play important role in interpreting causal mechanisms for their downstream gene pools. More druggable targets are expected to be discovered in this study. An established STAT3 transcriptional regulatory network indicates STAT3 to be a center regulator in ER(–) breast cancer.
This approach is promising because one of subnetwork activities—sustained angiogenesis was validated by angiosonograms (Figs. 7A–D). The annotated gene functions within the predicted subnetwork were linked to functional signal pathway profiling (Fig. 4F). Gene expression patterns within MYC & STAT3 overlapped network indicate that two transcriptional regulatory pathways involving STAT3 may be all toward sustained angiogenesis demonstrated in Figure 7B. It suggests a hypothesis of cross talking between two possible signaling pathways that may promote tumor angiogenesis. For those patients with that signature subnetwork, they may have suppressed local metastasis indicated by a clinicopathological category—LNM (see both STAT3 and MYC actions on LNM indicated in Fig. 3 and Table S4.1). Importantly, FOXC1 is predicted to be one of STAT3 & MYC shared target genes. FOXC1 core network may serve as a poor prognostic signature. We found 10 probes (10/14) within FOXC1 network to be preferentially up-regulated in TN (Figs. S4.1 and S4.2) and several of them were previously implicated to be poor prognostic factors by others.25,33,51,52 However, we can not prove our prediction based on network result (see Fig. 7F). We suspect that it may be because majority of the cohort was recruited around 4–6 years ago (The breast tumor sampling was performed mainly in 2005–2007) and the subcohorts for this prediction are small (total N = 38) in this study. FOXC1 is a low risk factor which was predicted to be a poor prognostic factor by survival analysis (for patients with .2 years after surgically removal of breast tumors). 25 Lastly, elevated MYC and some of its target genes lead to Warburg effect are enriched in TN (Fig. 5D) that has been predicted by network approach. The most recent in vivo evidence supports our prediction that MYC up regulates a subset of gene expressions involved in Warburg effect in TN. 54
Conclusion
STAT3 appears to be a center regulator mainly in early development of an ER(–) breast cancer model system based on our network prediction. STAT3 is known to be a proto-oncogene and a multifunctional protein. In this hypothesis testing study, we concluded not only more than 70 transcription factors are potentially regulated by STAT3 (Table S1.2) but total four functional subnetwork activities to be enriched in TN that are part of STAT3 network activities (Figs. 5C–F).
Major findings based on network approach are: (1) The subtype enriched gene activities revealed due to both MYC and STAT3 predominantly being up-regulated in TN. A subset of gene pool shared by regulatory networks of both MYC and STAT3 was found to participate, in part, in maintaining stem cell phenotype, cell proliferation, Warburg effect and sustained angiogenesis. This indicates that STAT3 may also initiate cancer metastasis through three major mechanisms: promotion of sustained angiogenesis (Figs. 5C, 6A, and 7A), induction of tumor cell epithelial-mesenchymal transition (EMT) (Figs. 5E, 6C, D and Table 3), and activation/induction of proteolytic enzyme mediating tumor cell invasiveness (e.g. MMP7 in Fig. 5F; MMP17 in Table S1.6 and Fig. S3.8); (2) Both MYC and STAT3 are also relevant determinants to a few clinical indices (Fig. 3); (3) The predicted feedback regulatory action between MYC and STAT3 (Fig. 5A) enriched in TN indicates both networks to be mutually cooperative. Evidence on common gene activities governing a range of clinical indices is within the core network co-driven by MYC and STAT3 (Fig. 4E). Notably, MMP17, BOP1 and STAT5a were predicted to be up regulated by both MYC and STAT3 in a subset of patients that indicates the promotion on metastasis, anti-apoptosis, respectively (Tables 3 and S1.6, Fig. S3.8). Moreover, STAT3 may be a key transcription factor in ER(–) BC. MYC, FOXM1, ARNT/HIF1α and ARNT/HIF2α are predicted to be its major partners to differentially regulate proliferation, Warburg effect, angiogenesis and ES like phenotype.
Novel findings based on STAT3 network should be not limited by (a) four poor prognostic factors-MMP7, IGF2, IGF2R, and METAP2; (b) four druggable targets- VEGFA, STAT3, FOXM1 and METAP2; (c) clinical relevant; (d) subtype enriched. The summary for predicted clinical roles of components in those subnetworks (Fig. 5F) and in core network of MYC (Fig. 5B) suggests that the clinical implications of STAT3 should be not limited to LNM and stage (Fig. 3) but should be extended to other clinical indices when this center regulator interacts with different partner transcription factor(s) that may cooperate with STAT3 to determine tumor cell fate predominantly in TN. Many downstream transcription factors in STAT3 network may have interactions with STAT3 and MYC in ER(–) breast cancer to be mostly unexplored before. Further dissecting the roles of STAT3 by building multivariate space of STAT3 mediated transcriptional regulatory network would advance our understanding for this master transcription factor in ER(–) BC.
Disclosures
Author(s) have provided signed confirmations to the publisher of their compliance with all applicable legal and ethical obligations in respect to declaration of conflicts of interest, funding, authorship and contributorship, and compliance with ethical requirements in respect to treatment of human and animal test subjects. If this article contains identifiable human subject(s) author(s) were required to supply signed patient consent prior to publication. Author(s) have confirmed that the published article is unique and not under consideration nor published by any other publication and that they have consent to reproduce any copyrighted material. The peer reviewers declared no conflicts of interest.
Footnotes
Abbreviations
Acknowledgements
The financial support of this work was mainly from grants (NSC95-2314-B-002-255-MY3 and NSC98-2314-B-002-093-MY2) (to Dr. Fon-Jou Hsieh). Both Dr. Shih-Ming Jung and Dr. Huang-Chun Lien did the scoring for both ERα and PR proteins in tumor sections of breast cancer specimens. We owe many thanks to the great assistance from the office of medical record (Cancer Registry, Medical Information Management Office, NTUH) for accessing medical records of those patients who agreed on providing their specimens for microarray study. We appreciate Miss. Fu-Chin Chen at NTUH providing the great assistance in gathering breast sonographic images for this study.
Supplementary Data
A combined PDF file has included the following contents except supplementary file 3 displayed below:
Table of content—a PDF file contains a brief description for supplementary files.
Supplementary file 1—a PDF file contains Tables S1.1–S1.7.
Supplementary file 2—a PDF file contains Tables S2.1–S2.9.
Supplementary file 4—a PDF file contains Table S4.1 and Figures S4.1–S4.4.
The following data (i.e. supplementary file 3) further interprets part of results in supplementary file 2. Here, we would like to illustrate that the same signal transduction pathway in different subtypes of breast cancer as well as non-tumor part has differential gene expression patterns due to a perturbed network driven by MYC & STAT3 enriched in the tumor compartment. The phenotypic changes are expected mainly for promoting tumor development by MYC & STAT3 overlapped transcriptional regulatory network. To evaluate those critical genes in a perturbed network, we examined differentially expressed network components in the heatmaps for seven signal transduction pathways. In addition, we demonstrated a core network of MYC & STAT3, which is TN enriched and clinicopathologically relevant, via the heatmap display in Figure S3.8. NT stands for non-tumor part. TN stands for triple negatives. MCB stands for metaplastic carcinoma of breast. ERBB2+ stands for ER(–)PR(–) HER2/neu(+).