




Abstract
Mining of gene expression data to identify genes associated with patient survival is an ongoing problem in cancer prognostic studies using microarrays in order to use such genes to achieve more accurate prognoses. The least absolute shrinkage and selection operator (lasso) is often used for gene selection and parameter estimation in high-dimensional microarray data. The lasso shrinks some of the coefficients to zero, and the amount of shrinkage is determined by the tuning parameter, often determined by cross validation. The model determined by this cross validation contains many false positives whose coefficients are actually zero. We propose a method for estimating the false positive rate (FPR) for lasso estimates in a high-dimensional Cox model. We performed a simulation study to examine the precision of the FPR estimate by the proposed method. We applied the proposed method to real data and illustrated the identification of false positive genes.
Keywords
Introduction
Establishing prognoses of clinical outcomes on the basis of microarray data is often performed in this decade.1–4 In cancer research, not only the prediction of response to treatment but also the prediction of time to such events, eg, overall survival (OS) and relapse-free survival (RFS) are investigated. 5 To precisely predict such outcomes, we need to identify the genes that are highly correlated with them and are called the outcome-predictive genes. This is difficult, however, because the number of genes p in the high-dimensional microarray data exceeds the number of patients n. Several researchers have attempted to identify the outcome-predictive genes in the n < p data settings by using traditional statistical methods, but the accuracy of the prediction based on the genes identified in this way is not very satisfactory. For example, van't Veer et al 3 and Van de Vijver et al 2 analyzed the gene expression profiles of 78 lymph node-negative breast cancer patients in order to establish gene signatures related to the risk of distant metastasis. Using a “three-step supervised classification method”, they identified 70 genes that categorize patients into “good” and “bad” prognostic groups. Wang et al 4 also analyzed the gene expression profiles of 115 patients for the same purpose. They identified 76 genes by using the univariate Cox's proportional hazard regression analysis, which evaluates the relationship between the level of expression and the distant-metastasis-free survival for each gene. Notably, both studies had only 3 genes in common. Furthermore, the predictive performance based on both gene signatures drastically decreased when applied to other data sets. 6 Thus, the problem lies in the difficulty of precise identification of the outcome-predictive genes in high-dimensional data.
To address this difficulty, researchers have been emphasizing the penalized regression methods. Among them, the least absolute shrinkage and selection operator (lasso), which selects the outcome-predictive genes and simultaneously estimates the regression coefficients in the Cox regression model, is a typical penalized regression method.7,8 This method shrinks all regression coefficients toward zero, and automatically sets many of them to exactly zero, depending on the amount of regularization employed. This can be useful, in particular, in high-dimensional data, and the prediction performance for microarray data have been widely studied by many researchers by using this method.9,10 Several researchers showed that the lasso outperforms the simple variable selection methods such as the univariate Cox regression analysis,9,11 with respect to the accuracy of prediction.
In the lasso, the amount of shrinkage varies, depending on the value of the tuning parameter, which is often determined by cross validation. 12 The number of genes selected as the outcome-predictive genes (ie, the genes included in the Cox model) generally decrease as the value of the tuning parameter increases. The optimal value of the tuning parameter that maximizes the prediction accuracy is determined; however, the set of genes identified using the optimal value contains the non-outcome-predictive genes (ie, false positive genes) in many cases. 10 Inclusion of such genes in the Cox model may yield an inaccurate prediction for the time-to-event outcome in patients. It is difficult to completely eliminate the false positive (FP) genes, even if we use the other penalized regression models. One idea to improve the identifiability of the outcome-predictive genes is to determine the FP genes, and subsequently, exclude them from the Cox model. To realize this, we developed a method for estimating the proportion of FP genes, ie, false positive rate (FPR), among the total identified genes. Specifically, the FPR is calculated using a mixture distribution based on the coefficients estimated by the lasso. We formulate the mixture distribution by considering the features of the lasso. By identifying the FP genes using the proposed method and excluding them from the Cox model, we are able to improve the prediction accuracy of the model. The accuracy of the FPR estimated by the proposed method is examined by simulation studies. We present the illustration of the proposed method using a well-known data set containing gene expressions from patients with diffuse large B-cell lymphoma (DLBCL) along with their survival time. 1
We organize the remainder of this study as follows. In the Methods section, we introduce the Cox regression model, the lasso, and our proposed method for estimating the FPR. In the Simulation Studies section, we examine the accuracy of the estimated FPR through simulation studies with the situations observed in typical cancer prognostic studies with microarrays. In the Application section, we illustrate the identification of FP genes by the proposed method by using the well-known DLBCL data. Finally, in the Discussion and Conclusion section, we discuss the characteristics of the proposed approach in further detail.
Methods
Cox proportional hazard model
Consider a sample of size n from which the relationship between the timing of an event and gene expression levels x1 …, x p of p genes need to be estimated. Due to censoring, for i = 1, …, n, the ith datum in the patient is denoted by (t i , δ i , xi1, …, x ip ), where δ i is the censor indicator and t i is the event time if δ i = 1 or censored time if δ i = 0, and x i = (xi1, …, x ip )T is the vector of the gene expression levels of p genes for the ith patient. The Cox proportional hazard model is the most popular method to evaluate the relationship between gene expression and survival outcomes. 13 The hazard function of an event at time t for a patient i with the gene expression levels x i is given by

where β = (β1 …, β p )T is a parameter vector and h0(t) is the baseline hazard, which is the hazard for the respective individual when all variable values are equal to zero. In the general setting with n > p, the coefficients are estimated by maximizing Cox's log partial likelihood as follows:

where R(t) is the risk set that contains the patients whose survival time or censored time is at least t i .
The Lasso
Tibshirani7,8 introduced a novel parameter estimating method that simultaneously executes parameter estimation and variable selection by adding the L1 norm to log likelihood function. The penalized likelihood function l p of the lasso in the Cox's proportional hazard model is as follows:

where λ is the tuning parameter, which determines the amount of shrinkage, and l(β) is the Cox's log partial likelihood. The parameters are estimated by maximizing Equation (3). In this study, the parameters were estimated using the efficient gradient ascent algorithm. 14
When performing the lasso, we need to determine the value of λ, which affects the lasso estimates. As the value of λ increases, the number of the selected genes monotonically decreases. The optimal value is often determined by the cross-validation log partial likelihood. 12 The K-fold cross-validated log partial likelihood is given by

where
Estimation of false positive rate (FPR)
In this section, we propose the method to estimate the FPR for a fixed value of λ determined by the cross validation by assuming a mixture distribution for the lasso estimates. The mixture distribution is developed on the basis of the following 2 features of the lasso: (i) the lasso selects at most n variables, because of the nature of the convex optimization problem when n < p,15,16 and (ii) in the Bayesian framework, the lasso estimate is derived as the posterior mode under independent Laplace prior distribution as follows:

where f
L
(y; a, b) = (2b)−-1exp (–|y – a|/b) is the probability density function of Laplace distribution with location parameter a and scale parameter b.
7
On the basis of these features of the Lasso, the mixture distribution is assumed to

where π0 and πc are mixed proportions
The mixture distribution defined by Equation (6) is formulated on the basis of the following concepts. Since the lasso selects at most n genes in the n < p setting, the coefficients for at least p – n genes are shrunken toward exactly zero; therefore, Equation (6) consists of 2 terms, ie, n/p term and 1 – n/p term. In the n/p term, the C + 1 component mixture distribution comprising the Laplace and normal distributions. Specifically, the Laplace distribution with location parameter 0 and scale parameter τ-1,
Using the estimated mixture distribution, we defined a FPR for a cut-off value ζ (>0) as follows: given the cut-off value ζ, the area under the Laplace distribution in the n/p term is the estimated proportion of FP genes, and can be written as follows:

Next, the estimated proportion of true positive (TP) genes for the cut-off value ζ is given by the following:

Using Equation (7) and Equation (8), we obtain the FPR estimator for the cut-off value ζ as follows:

Based on the cut-off value ζ used, the estimated proportions of FP and TP genes and the corresponding estimated FPR are found to vary. We determined a cut-off value based on the target FPR specified in priori. Specifically, by sequentially changing ζ, we determined the cut-off value that allowed the estimated FPR to be less than or equal to the target FPR. For example, if the target FPR was 0.05, we used the minimum cut-off value that would make the estimated FPR ≤ 0.05.
Simulation Studies
Simulation Setting
We performed simulation studies to examine the precision of the FPR estimated by the proposed method. In the simulation studies, the number of patients n is set to 200. The number of genes p is set to 1,000, including the p1 (= 5, 30) outcome-predictive genes, ie, TP genes. The coefficient for gene j (j = 1, …, p) β j is set to 1.5 for the outcome-predictive genes (j = 1, …, p1) and 0 for the non-outcome-predictive genes (j = p1 + 1, …, p). The number of component C is set to 1 throughout. We may not be able to assume independence among genes, since the expression levels among the outcome-predictive genes are likely to be correlated because of gene co-regulation. It may be reasonable to assume that the expression levels among the non-outcome-predictive genes as well as those between the outcome-predictive genes and the non-outcome-predictive genes are independent. 17 The gene expression levels for patient i, x i , are generated from the multivariate normal distribution with mean vector 0 and covariance matrix Σ with variance 1, so that the correlation among the expression levels of the outcome-predictive genes is 0.0, 0.2, or 0.5, and is constant among the outcome-predictive genes. The survival time for patient i is generated on the basis of the exponential model as follows:

where U is the uniform random variable between 0 and 1.
18
We set λ to 10–30 by 5 in the simulation studies in order to evaluate the precision of the estimated FPR for various values of λ, although the optimal value of λ is determined by cross validation in practice. The value of ζ is defined as the minimum value among
Simulation Results
Table 1 shows that the average of the genes with
Accuracy of the FPR estimated using the method proposed in the simulation studies.

Application to DLBCL data
We illustrated the exclusion of the FP genes from the genes selected by the lasso through the application of the proposed method to a real data set comprising the overall survival in 240 DLBCL patients with the expression of 7,399 genes. 1 The survival times were observed in 138 patients, and the censored times, in 102 patients. The median follow-up time was 3.9 years, and the median survival time was 2.8 years.
We divided the 240 patients into 2 groups; the training data comprised 160 patients, and the validation data, 80 patients, as described by Rosenwald et al. 1 We determined that the optimal value of λ was 27 by performing 5-fold cross validation, resulting in the selection of 12 genes as the outcome-predictive genes. Table 2 shows the GenBank accession number, description, and coefficient estimate for each of the 12 genes selected by the lasso.
The GenBank accession numbers, descriptions, and coefficient estimates of 12 genes selected by the lasso.

Given the estimated coefficients
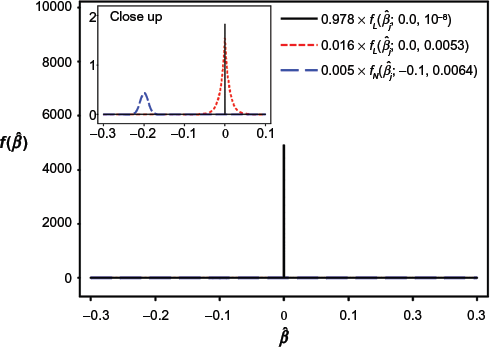
The estimated mixture distribution assuming the lasso estimates in the DLBCL data; f
L
and f
N
are the probability density functions of laplace and normal distributions, respectively,

The mixed proportions of the Laplace and normal distributions in the n/p term were too small; therefore, we enlarged the part including these distributions in Figure 1. In addition, according to the estimated mixture distribution, the outcome-predictive genes that increase the risk of death, ie, genes with
Table 3 shows that the estimated numbers of FP and TP genes and the corresponding estimated FPR for various cut-off values. The estimated FPR was less than 5.0% for the cut-off value ζ > 0.03, indicating that 3 genes might be TP genes, although the FPR might be underestimated according to the results of the simulation studies. In order to determine 9 genes that were most likely to be FP genes, we calculated the AICs of all possible models consisting of 3 genes selected among 12 genes, ie, 220 models in total. The model including 3 genes with
The estimated numbers of TP and FP genes and the estimated FPR for the cut-off values from 0.0001 to 0.05.

Gene Set Enrichment Analysis
As an alternative method for the exclusion of the FP genes from the genes selected by the lasso, we used the Gene Set Enrichment Analysis (GSEA), 20 a computational method that assesses whether an a priori defined set of genes shows statistically significant relevance to survival time. The set of genes to be assessed by GSEA is generally defined based on the functional/biological relevance of gene expression profiles, such as genes encoding products in a metabolic pathway, located in the same cytogenetic band, or sharing the same Gene Ontology (GO) category. In this study, for the application of the GSEA to the DLBCL data, we identified 1,454 sets of genes based on the GO categories. Of these, 53 gene sets included at least 1 of the 12 genes selected by the lasso method. It should be noted that 5 genes (eg, M20430, AA805575, M63438, LC_29222, and LI9872) were not included in any of the gene sets. For this study, we implemented the modified GSEA for survival time proposed by Lee et al. 21 Table 4 shows 38 gene sets with false discovery rate (FDR) < 0.50 estimated by the modified GSEA. According to Table 4, the gene sets, including AF044323 and K01171, showed lower P-value and FDR, and therefore, we determined these genes as TP genes, and the remaining 10 genes were conveniently considered FP genes.
Gene sets with FDR < 0.5 in the GSEA.

Prediction Accuracy
We demonstrated that the 9 genes identified did not impact the survival outcome by comparing the prediction accuracy between the models consisting of the aforementioned 3 and all 12 genes. Furthermore, we also compared the prediction accuracy between the models by which 3 TP genes were identified by the proposed method and 2 TP genes were identified by the GSEA. For the validation data including 80 patients, the following 3 criteria were calculated: P-value for the log-rank test, P-value for the prognostic index, and deviance. The 80 patients were categorized into 2 groups by the boundary of the median of prognostic index
Three criteria for model evaluation.


Kaplan-Meier curves of overall survival for the 2 groups; (
Discussions and Conclusions
In this study, we developed a method to estimate FPR by assuming the mixture distribution comprising the Laplace and normal distributions on the lasso estimates. In practice, we identified the outcome-predictive genes by performing the lasso, and subsequently, removing the FP genes using the proposed method.
Although the penalized regression analyses including the lasso are attractive in the high-dimensional microarray data, it is difficult to identify the outcome-predictive genes without FP genes by using these methods. Utilizing the proposed method, we can validate the results of the lasso, and identify the outcome-predictive genes more precisely. The assumed mixture distribution was formulated considering the 2 features of the lasso, although it may be a “somewhat complex” distribution. The validity of this assumption was demonstrated through the simulation studies. Specifically, the accuracy of the FPR estimated by the proposed method was satisfactory in many cases. The accuracy was slightly decreased for the larger value of tuning parameter λ, but the underestimation of FPR may be acceptable in practice, as discussed in the Simulation section.
In the section on Application to the DLBCL Data, the utility of the proposed method was illustrated. We were able to eliminate the FP genes from the genes selected by the lasso with λ = 27, and improved the accuracy of prediction of the model. We further identified the TP genes and examined the prediction accuracy of overall survival based on them, using the proposed method and GSEA. Both methods identified no TP genes in common. The prediction accuracy using the 3 genes identified by the proposed method outperformed that using the 2 genes identified by the GSEA. The GSEA introduced by the Subramanian et al 20 evaluates microarray data at the level of gene sets. The gene sets are defined based on prior biological knowledge, eg, published information about biochemical pathways or coexpression in previous experiments. In contrast, the proposed method evaluates microarray data at the level of genes and does not use prior biological knowledge when identifying the outcome-predictive genes.
Some variants of the lasso and penalized regression methods are used, eg, smoothly clipped absolute deviation penalty (SCAD), 22 adaptive lasso,23,24 elastic net, 16 and ridge regression, 25 but of these, we chose the lasso in this study, because of our concerns regarding the high possibility of missing the true positives for the SCAD and adaptive Lasso, the difficulty in choosing 2 penalties for the elastic net, and the absence of any property to select genes for ridge regression. 10
The determination of the value of the tuning parameter is required when performing the lasso. The value of λ is frequently determined on the basis of the cross validation that evaluates the adequacy of the model, as explained in the Methods section. By utilizing the proposed method, we could also determine the value of λ by considering not only the prediction accuracy but also the FPR.
In conclusion, the lasso allows us to efficiently select the outcome-predictive genes in the high-dimensional microarray data, but the difficulty lies in the inclusion of the FP genes among the selected genes. The use of the proposed method allows us to eliminate these genes and improve the prediction accuracy of the Cox model.
Author Contributions
Conceived and designed the experiments: SK, AH. Analysed the data: SK, AH. Wrote the first draft of the manuscript: SK, AH. Contributed to the writing of the manuscript: SK, AH, CH. Agree with manuscript results and conclusions: SK, AH, CH. Jointly developed the structure and arguments for the paper: SK, AH, CH. Made critical revisions and approved final version: SK, AH, CH. All authors reviewed and approved of the final manuscript.
Disclosures and Ethics
As a requirement of publication author(s) have provided to the publisher signed confirmation of compliance with legal and ethical obligations including but not limited to the following: authorship and contributorship, conflicts of interest, privacy and confidentiality and (where applicable) protection of human and animal research subjects. The authors have read and confirmed their agreement with the ICMJE authorship and conflict of interest criteria. The authors have also confirmed that this article is unique and not under consideration or published in any other publication, and that they have permission from rights holders to reproduce any copyrighted material. Any disclosures are made in this section. The external blind peer reviewers report no conflicts of interest.