
Abstract
Mutations in two major genes, BRCA1 and BRCA2, account for up to 30% of families with hereditary breast cancer. Unfortunately, in most families there is little to indicate which gene should be targeted first for mutation screening, which is labor intensive, time consuming and often prohibitively expensive. As BRCA1 is a tumor suppressor gene involved in various cellular processes, heterozygous mutations could deregulate dependent pathways, such as DNA damage response, and disturb transcriptional activity of genes involved in the downstream signaling cascade. We investigated gene expression profiling in peripheral blood lymphocytes to evaluate this strategy for distinguishing BRCA1 mutation carriers from non-carriers. RNA from whole blood samples of 15 BRCA1 mutation carriers and 15 non-carriers from BRCA1 or BRCA2 families were hybridized to Agilent Technologies Whole Human Genome OligoMicroarrays (4 × 44 K multiplex format) containing 41,000 unique human genes and transcripts. Gene expression data were analyzed with Welch's t-tests and submitted to hierarchical clustering (GeneSpring GX software, Agilent Technologies). Statistical analysis revealed a slight tendency for 133 genes to be differentially expressed between BRCA1 mutation carriers and non-carriers. However, hierarchical clustering of these genes did not accurately discriminate BRCA1 mutation carriers from non-carriers. Expression variation for these genes according to BRCA1 mutation status was weak. In summary, microarray profiling of untreated whole blood does not appear to be informative in identifying breast cancer risk due to BRCA1 mutation.
Keywords
Introduction
Breast cancer is the most common cancer in women in the western world, of which approximately five to ten percent of cases are of hereditary origin. Two major susceptibility genes, BRCA1 and BRCA2, were identified through positional cloning in 19941 and 19962 respectively. Mutations in these genes account for up to 30% of families with hereditary breast cancer. These genes are risk factors with by far the highest predictive value, and they may be targeted for analysis according to the familial phenotype. BRCA1 mutations are associated with female breast and ovarian cancer, while BRCA2 mutations are rather associated with female and male breast cancer and to a lesser extent with ovarian cancer. Despite these differences in familial phenotype, the majority of families present only early onset breast cancer and there is little to indicate which gene should be targeted first for more efficient mutation screening or if in fact one of the BRCA1 or BRCA2 gene is at cause.
BRCA1 is a tumor suppressor gene involved in various cellular processes, notably DNA damage response, cell cycle control, chromatin remodeling, ubiquitination and transcriptional regulation.3,4 The involvement of BRCA1 in these processes is highlighted by its interaction with a variety of proteins, including DNA damage repair proteins (RAD50, RAD51, BRCA2, MLH1, FANCA), transcriptional activators and repressors (RNA polymerase II, RNA helicase A, histone deacetylase 1, CtBP1, ERalpha, AR, STAT1) and cell cycle checkpoint proteins (p53, cyclins and cyclin dependent kinases). 5 Microarray studies have shown that BRCA1 transcriptionally regulates genes involved in breast tumorigenesis, most notably those coding for p21WAF1/CIP1, GADD45, 14-3-3σ, c-Myc and cyclin D1. 6 Hemizygosity for BRCA1 could thus have an effect on expression levels of these genes.
Microarray studies have also shown that constitutional mutations in BRCA1 and BRCA2 influence the gene expression profile of malignant tissues.7–13 In primary tumors from breast epithelium, Hedenfalk et al. showed that there are different gene expression profiles in BRCA1 positive tumors, BRCA2 positive tumors and sporadic tumors. 8 Comparison of gene expression patterns in ovarian cancers showed that BRCA1 and BRCA2 associated tumors differ significantly in their gene expression profiles. 12
With regard to healthy tissues, studies of fibroblasts cultured from breast 14 and skin biopsies 15 showed that irradiated cells from heterozygous BRCA1 mutation carriers display gene expression profiles different from those of non-carriers 14 and those of BRCA2 mutation carriers. 15 These results demonstrate the involvement of BRCA1 and BRCA2 in DNA damage response and the potential existence of a distinct functional heterozygous phenotype for BRCA1 carriers. This hypothesis was assessed through studies of irradiated human lymphocytes from heterozygous BRCA1 and BRCA2 mutation carriers.16–18 These studies analyzed the cellular phenotype of irradiated lymphocytes and showed a deficit in DNA damage response resulting in micronuclei formation in irradiated G0 cells17,18 and in an increased level of chromosomal aberrations after irradiation. 16
These different studies show that gene expression profiles associated with BRCA1 or BRCA2 mutation status can be found in malignant tissues and in irradiated healthy tissue. However, these two approaches cannot be easily applied to diagnostic screening: the first case requires a tumor sample and the second case requires irradiation (or treatment with other DNA damaging agents) of fresh lymphocytes or cell lines. We therefore proposed to examine gene expression profiles of BRCA1 mutation carriers and BRCA1 or BRCA2 non-carriers in an accessible tissue such as peripheral blood mononuclear cells (PBMCs). Our aim was to assess if a BRCA1-carrier profile could be identified in untreated samples. If so, this profile could allow the development of a test for flagging likely BRCA1 mutation carriers. The interest of working with untreated samples is the broader range of samples accessible for testing, notably those drawn at distant locations and sent to the laboratory by mail. The routine treatment of such samples with DNA damaging agents in a timely and homogeneous manner would not be practical.
The use of untreated PBMCs is relevant in light of the established links between DNA damage response, immunity and cancer. 19 Other studies have successfully used PBMCs to demonstrate that breast cancer affects gene expression patterns in peripheral blood cells during early stages of disease development. 20 Inter-individual variation observed in peripheral blood21–23 was shown to be minimal in comparison to that observed associated with various diseases and disorders21,23 such as cancer or infectious disease.
In the present study, we compared gene expression profiles in peripheral blood cells of BRCA1 mutation carriers who belong to high-risk breast cancer families with gene expression profiles of BRCA1 or BRCA2 mutation non-carriers in order to evaluate the possibility of setting up a microarray-based preliminary screening tool.
Materials and Methods
Case Selection Criteria
All samples were taken from members of high-risk breast cancer families ascertained through the Oncogenetic consultation at the Centre Jean Perrin. Individuals were asked to provide a blood sample and to sign an informed consent form approved by the CCPPRB regional ethics committee (Auvergne). Fifteen samples from patients with germline mutations of BRCA1 and fifteen samples from family members without the familial mutation were selected for analysis. Mutation screening was performed by direct sequencing.
RNA Isolation
Peripheral Blood Mononuclear Cells (PBMCs) were isolated on a density gradient. Briefly, 3 ml of Pancoll (PAN Biotech GmbH, Aidenbach, Germany) was added to a LeucoSep tube (Dutscher, Brumath, France) and centrifuged to position the porous LeucoSep membrane on the Pancoll surface. Approximately 6 ml of heparinized blood was poured onto the membrane, and the tubes were centrifuged at 1000 g for 10 min at room temperature. After centrifugation, the interface containing PBMCs was collected and washed twice with PBS (Invitrogen, Carlsbad, CA). Total RNA was extracted with TRIzol reagent (Invitrogen, Carlsbad, CA) according to the manufacturer's instructions. RNA quantity and quality were determined using the RNA 6000 Nano Assay kit on an Agilent 2100 BioAnalyzer (Agilent Technologies, Palo Alto, CA), as recommended. A commercial pool of total RNA (ref. 636580 BD Biosciences Clontech, Heidelberg, Germany) extracted from normal human peripheral leukocytes of 13 healthy male/female Caucasians was used as a reference RNA cohybridized with the test sample (carriers or controls) in each microarray.
cRNA Amplification and Labeling
Total RNA was amplified and labeled with Cyanine 5 for test samples (carriers and controls) and with Cyanine 3 for the reference using Agilent's Low RNA Input Linear Amplification Kit (Agilent Technologies, Palo Alto, CA) following the detailed protocol described in the kit manual (Manual Part Number G4140–90050 version 5.0.01). Briefly, 1 μg of total RNA was reversed transcribed to double-strand cDNA using a poly dT-T7 promoter primer. Primer, template RNA and quality-control transcripts of known concentration and quality were first denatured at 65 °C for 10 min and incubated for 2 hours at 40 °C with 5X first strand Buffer, 0.1 M DTT, 10 mM dNTP, MMLV RT, and RNase-out. The MMLV RT enzyme was inactivated at 65 °C for 15 min. cDNA products were then used as templates for in vitro transcription to generate fluorescent cRNA. cDNA products were mixed with a transcription master mix in the presence of T7 RNA polymerase and CY5 labeled or CY3 labeled-CTP and incubated at 40 °C for 2 hours. Labeled cRNAs were purified using QIAGEN's RNeasy mini spin columns and eluted in 30 μl of nuclease-free water. After amplification and labeling, cRNA quantity and cyanine incorporation were determined using a nanodrop ND.1000 UV-VIS-Spectrophotometer version 3.2.1(Agilent Technologies, Palo Alto, CA).
Sample Hybridization
For each hybridization, 825 ng of Cyanine 3 labeled cRNA (reference) and 825 ng of Cyanine 5 labeled cRNA (carriers or controls) were mixed, fragmented, and hybridized at 65 °C for 17 hours to an Agilent 44 K Whole Human genome Oligo Microarray containing 45,015 features representing 41,000 unique probes. After washing, microarrays were scanned using an Agilent DNA microarray scanner. Feature extraction software (Agilent Technologies, Palo Alto, CA) was used to assess fluorescent hybridization signals and to normalize signals using linear regression and a Lowess curve-fit technique. Reproducibility and reliability of each single microarray was assessed using Quality Control report data (Feature extraction, Agilent Technologies). Self-self and dye swap hybridizations were performed to check data quality and evaluate the importance of dye bias. For self-self hybridizations, aliquots of the same RNA sample were separately labeled with CY3 and CY5 fluorescent dyes and cohybridized to the same microarray.
Data Analysis
Gene expression analysis was carried out using GeneSpring GX software (Agilent Technologies, Palo Alto, CA). Expression ratios were calculated (CY5 processed signal was divided by CY3 processed signal), and normalized per chip to the 50th percentile and finally normalized per gene to medians. We worked on a pre-screened list of 16,997 genes obtained after filtering the data for outliers, negative and positive controls, and on the quality flag CY5 and CY3 signals being “well above background”. To pass this last flag, CY5 and CY3 net signals needed to be positive and significant, with g(r) BGSubSignal greater than 2.6 g(r) BG_SD.
To determine if there were genes differentially expressed between mutation carriers and controls, we performed two Welch's t-tests (P < 0.01) on this pre-screened list of genes: one without correction and one with Benjamini and Hochberg's correction. Average linkage hierarchical clustering analysis was applied using Euclidean distance, and differentially expressed genes were annotated using the information from the Gene Ontology Consortium. Panther, Ingenuity Pathways Analysis (Ingenuity Systems®, www.ingenuity.com) and FatiGO software were used to assess whether specific biological processes or molecular functions were differentially expressed, through the over-representation of groups of genes with functional links, rather than individual genes. Global molecular networks and comparison of canonical pathways were generated using Ingenuity Pathways Analysis.
Allele-Specific Transcript Expression
Single-nucleotide primer extension was performed as described in the Supplementary Methods with the ABI Prism SnaPshot multiplex Kit (Applied Biosystems, Evry, France).
Results
Sample Characteristics
Sample characteristics are listed in Table 1. We selected a group of fifteen BRCA1 mutation carriers belonging to 11 distinct high-risk breast and ovarian cancer families and for whom 10 different BRCA1 mutations were identified by direct sequencing. At the time of blood sample collection, all mutation carriers were healthy and not undergoing treatment, although some of them had had breast or ovarian cancer 3 to 20 years previously. All mutations were deleterious nonsense codons or frameshifits, and were scattered throughout the gene. A comparison group of fifteen healthy relatives without familial BRCA1 or BRCA2 mutation was collected. The absence of mutation was verified by direct sequencing for the mutation known to concern each family. Gender distribution was similar between carriers and controls (3 male and 12 female carriers; 4 male and 11 female controls). Age distribution was slightly lower among controls: 57 years for mutation carriers (range 26–76), versus 42 years for controls (range 22–67).
Sample characteristics for BRCA1 mutation carriers and non-carriers.

Non-carriers are healthy relatives tested negative by direct sequencing for a known BRCA1 or BRCA2 mutation present in their family. Only familial BRCA1 mutations are described in this table.
None:
When non-carriers belong to a BRCA2 family, the BRCA2 familial mutation is not described.
Distribution of Signal Intensity and Abundance of Transcripts
Signal intensity in lymphocytes was low. Although the dynamic range for the red and green channels was wide (from 30 to 60,000 for net signals), the median intensities were around 80 for both channels. As presented in Figure 1, the average BRCA1 signal, and therefore expression, was very low. The second major susceptibility gene involved in breast cancer risk, BRCA2, was not significantly expressed in PBMCs. Among transcripts coding for BRCA1-interacting proteins, transcriptional regulation proteins were more highly represented than those involved in DNA damage repair or cell cycle checkpoints. Proteins related to estrogen signaling (androgen and estrogen receptors) were not significantly expressed. Most of the known transcriptional targets of BRCA1 were well represented.

Mean of CY5 processed signal over 30 experiments for selected BRCA1-interacting proteins and transcriptional targets.
Unsupervised Analysis
The mutation carrier and non-carrier samples were cohybridized with an internal reference to Agilent 44 K Whole Human genome Oligo Microarrays. Data were normalized using Feature Extraction software (Agilent Technologies, Palo Alto, CA) and analyzed with Genespring GX software (Agilent Technologies, Palo Alto, CA), resulting in a pre-screened set of 16,997 genes. An unsupervised method was used to reveal distinct clusters according to different parameters, such as BRCA1 mutation status, gender, age or diagnosis. Average linkage clustering analysis using Euclidean distance was performed in both gene and experiment dimensions. This analysis did not show any clear subgroup of samples with similar expression patterns that associated with BRCA1 mutation status (Fig. 2). The two main clusters observed in this dendogram were not associated with any of the parameters described above (family number, gender, age, diagnosis, BRCA1 mutation status). Some samples from the same family grouped together (three samples from family 2001: R673-R674-R683 and two samples from family 1541: R443-R609) regardless of gender or BRCA1 mutation status, although other samples from the same family were distant in the clustering.

Hierarchical clustering performed on all samples «15 BRCA1 mutation carriers versus 15 non-carriers» in both the experiment and the gene dimensions using a pre-screened list of 16,997 genes. Branches are color coded according to the family number of each sample.
Supervised Analysis
Supervised analysis was performed to identify genes differentially expressed between BRCA1 mutation carriers and controls, using a t-test based on the BRCA1 mutation status of each sample on the previous set of 16,997 genes, with a p-value fixed at <0.01. This analysis revealed 133 genes differentially expressed between BRCA1 mutation carriers and controls.
Hierarchical Clustering
Hierarchical clustering in both gene and experiment dimensions using these 133 genes (Fig. 3) showed two main clusters with a positive predictive value of 100% and a negative predictive value of 80%. The dendogram branches show eleven of the 15 BRCA1 mutation carriers grouped together in a first cluster, while the second cluster contains three subgroups in which four BRCA1 mutation carriers are misclassified with non-carriers. These four samples were not distinguishable from other BRCA1 mutation carriers by their gender, age, diagnosis, BRCA1 mutation type or by the functional domain affected by the mutation. None of their characteristics allowed us to exclude them from further analysis.
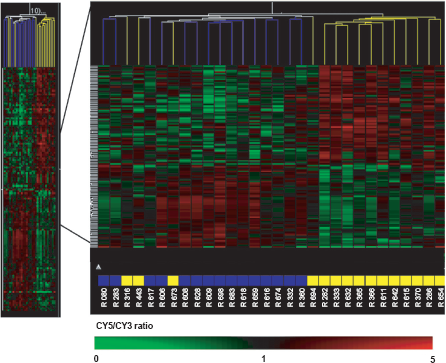
«15 BRCA1 mutation carriers versus 15 non-carriers» were subjected to hierarchical clustering in both the experiment and the gene dimensions using the 133 differentially expressed genes. Branches are color coded according to the BRCA1 mutation status of each sample. Blue, non-carriers; Yellow, BRCA1 mutation carriers.
Gene List Annotation
Among the 133 differentially expressed genes, 105 corresponded to known genes with a unique identifier, and 81 could be classified in a Panther database (listed by function in Table 2). Transcription and translation functions were fairly well represented, with a subunit of RNA polymerase I (POLR1D), a putative RNA helicase (DDX55), and zinc finger transcription factors (ZZEF1, ZFYVE28, PRDM1) tending to be over-expressed in the BRCA1 mutation carrier group. Immune-response genes were also well represented, with nine genes, including an antigen of the major histocompatibility complex (HLA-E), an antibacterial response protein (C1QBP), and a tumor suppressor gene involved in B-cell differentiation (KLF6) differentially expressed. Biological processes linked to other BRCA1 functions such as cell cycle control and DNA repair were less represented. Three genes involved in oncogenesis, including the oncogenes VAV 3 and YES1, tended to be up-regulated in the BRCA1 mutation carriers group.
Gene list for 81 annotated genes selected from the 133 transcripts found to be differentially expressed between BRCA1 mutation carriers and non carriers after t-test with a p value < 0.01.

Using Ingenuity Pathways Analysis software, 67 genes could be used to generate global molecular networks, which identified 13 independent networks mainly involving genes linked to cancer disease. No overlap was observed between these 13 networks with the BRCA1 global molecular network, since no genes were common to our set of 133 genes and the global molecular network of 35 genes connected to BRCA1 and selected from the Ingenuity's Knowledge database. A search of all molecules upstream and downstream of BRCA1, for all types of relationships, yielded 314 genes linked to BRCA1. Comparison of this list to the 133 differentially expressed genes identified two in common (DDB2 and CCL5), both coding for proteins whose expression was previously shown to be induced by BRCA1.24,25
The transcript DDB2 codes for Damaged DNA Binding Protein and was shown to be transcriptionally up-regulated by wild type BRCA1 in a p53-dependent manner upon DNA damage. 25 In our dataset, it tended to be slightly over-expressed in BRCA1 mutation carriers, even though BRCA1 should be less functional in this group. The other transcript, CCL5, codes for an interferon-inducible gene involved in apoptotic cell death, and has been found to be up-regulated by BRCA1 in breast cancer cell lines. 24 Like DDB2, this gene tended to be slightly overexpressed in BRCA1 mutation carriers in our dataset.
None of the other BRCA1-interacting proteins and transcriptional targets cited previously and presented in Figure 1 were present among the 133 differentially expressed genes (Table 2). Fold-changes in gene expression for differentially expressed genes had little amplitude, and the standard deviation within the same group was large. As an example, in Figure 4A, although the VAV3 transcript tended to be slightly more represented in BRCA1 mutation carriers, the log ratio variation between the two groups was significant but weak.
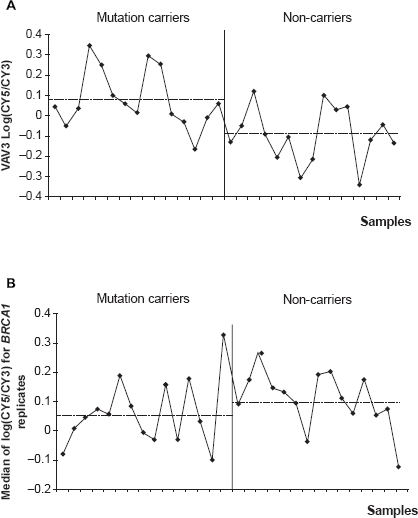
Distribution of log ratios between 15 BRCA1 mutation carriers and 15 non-carriers for VAV3 and BRCA1 transcripts. Dashed lines represent mean log ratios in each group (mutation carriers and non-carriers) (
Supervised Analysis with Correction of False Discovery Rate
In order to limit the number of significant genes due to random chance among the 16,997 tested genes, we performed a t-test with Benjamini and Hochberg multiple testing correction with a p-value less than 0.01. This analysis did not show any genes differentially expressed between BRCA1 mutation carriers and controls.
Supervised Analysis of BRCA1-Interacting Proteins and Targets
Expression profiles of 52 BRCA1-interacting proteins and transcriptional targets were compared to mutation status. None of these genes appeared significant in a t-test with a p-value less than 0.05. Two genes, STAT1 and TERT, had p-values less than 0.10. BRCA1 gene expression levels are Genes are classified into 9 categories according to their function. Fold change indicates the relative change between the mean of BRCA1 mutation carriers expression ratios and the mean of non-carriers expression ratios. Negatives fold changes correspond to genes down regulated in BRCA1 mutation carriers group and positives fold changes correspond to genes up regulated in BRCA1 mutation carriers group. shown in Figure 4B; no significant changes in gene expression were observed (p = 0.16).
Discussion
We compared gene expression profiles of untreated PBCMs from 15 BRCA1 mutation carriers and 15 non-carriers. Of 16,997 genes tested, statistical analysis revealed 133 to be differentially expressed at p ≤ 0.01. This number was smaller than the approximately 170 genes expected by random chance. Hierarchical clustering performed on the 133 differentially expressed genes revealed four BRCA1 mutation carrier samples misclassified in the non-carrier group. Among this list of differentially expressed transcripts, 60% could be annotated through Panther and FatiGO databases: these were mainly involved in cellular metabolic processes and to a lesser extent in immune response and transcription. There was a weak variation in their log-ratio expression between BRCA1 mutation carriers and non-carriers. Although supervised analysis revealed a tendency for these genes to be differentially expressed in BRCA1 mutation carriers, these genes could not be used to define a robust and reliable signature for BRCA1 heterozygosity in PBMCs. The variation in expression was too weak between carriers and controls, and they did not allow us to discriminate all BRCA1 mutation carrier samples from BRCA1 or BRCA2 non mutation carrier samples.
Considering the very large number of genes tested (nearly 17,000) and the small number of samples (30), it is likely that random chance will yield some genes which are not really significant even though they appear to discriminate between the two populations. Using a more stringent test to control this false discovery rate, we did not find any genes passing this statistical restriction filter. Moreover, BRCA1 itself had low signal intensity in PBMCs and, like its partners and transcriptional targets, did not show any significant changes in gene expression correlated to its mutation status.
This lack of difference in gene expression patterns between BRCA1 mutation carriers and controls could be due in part to an mRNA surveillance pathway, Nonsense Mediated Decay (NMD), which eliminates mRNAs harboring truncating mutations, thus limiting the production of truncated proteins with downstream deleterious effects. The majority of the mutant BRCA1 transcripts were tested for NMD (Supplementary Fig. 1) in PBMCs and most showed significantly reduced levels of the mutant allele compared to the wild-type allele. This reduction of BRCA1 mutant transcript may limit any deleterious effects of mutant BRCA1 protein on its transcriptional targets or partners, resulting in a recessive effect at the cellular level. This elimination of the mutant transcript, however, did not result overall in detect-ably lower levels of expression of BRCA1 itself; it seems that inter-individual variation was too great for direct detection of mutation carriers. This inter-individual variation could be due to confounding factors, such as time of blood sampling, menstrual cycle phase, stress, dietary patterns and/or intake of medications.
Another source of error to consider is 3′-end bias. Reverse-transcription using oligo-dT primers biases this study in favor of detecting the 3′end of transcripts in the hybridization step, and is not suitable for detecting variants alternatively spliced far upstream of the 3′end. To address this issue, other strategies could be employed, notably random priming of the RT-PCR reaction, 26 and the use of exon-specific arrays, in which probes designed to interrogate variant transcripts are included in the array.
Comparing our results with microarray data from other groups obtained after irradiation confirms that BRCA1 is a response gene, and a stimulus such as DNA damage is necessary to reveal the phenotype. This haploinsufficiency is not detectable in the absence of exceptional stress. Cancer risk associated with BRCA1 mutation can thus be explained by two models. First, random loss of the wild-type allele in sensitive tissues such as breast and ovary results in a small population of BRCA1-null cells, which are now highly susceptible to oncogenesis. This model is borne out by the observation that loss of the wild-type allele is indeed a very common and early step in breast oncogenesis in mutation carriers. A second, non-exclusive model proposes that a single allele of BRCA1 is sufficient for normal cellular metabolism, but is insufficient to adequately respond to genotoxic stress. Irradiation thus reveals a phenotype not otherwise detectable. The sub-normal response to DNA damage may result in the fixation of mutations and the early steps of oncogenesis.
Previous studies demonstrate that gene expression profiles can be a powerful tool to predict BRCA1 mutation status in malignant tissue or in irradiated healthy tissue.8,10,12,14,15 However, the different studies rarely retain the same differentiating genes and a large number of false positives are to be expected due to the small population sizes. 27 By examining gene expression profiles of BRCA1 mutation carriers and non-carriers in untreated PBMCs, it seems difficult to accurately distinguish carriers from non-carriers. This lack of a sufficiently robust BRCA1 mutation carrier signature in untreated samples unfortunately inhibits the development of a pre-screening tool based on samples that are drawn at some time and distance from the analyzing laboratory or which for other reasons cannot undergo treatment appropriate to reveal the heterozygous phenotype.
Disclosure
The authors report no conflicts of interest.