
Abstract

During the last decade, advances in the field of magnetic resonance imaging (MRI) have led to the design of numerous innovative imaging techniques. These techniques have not only facilitated structural visualization of anatomy, but also have provided a wealth of functional information regarding biological processes. Diffusion tensor imaging (DTI) is one such MRI technique that has generated tremendous amount of interest both in the clinical and laboratory fields. DTI attempts to analyze the magnitude and orientation of random microscopic motion of water molecules in brain tissue. It is based upon the phenomenon of water diffusion known as Brownian motion. This technique provides details on tissue microstructure and organization well beyond the usual image resolution. With diffusion tensor MR imaging, diffusion anisotropy can be quantified and subtle white matter changes not normally seen on conventional MRI can be detected. These features have encouraged scientists to evaluate the integrity and direction of the fiber tracts in various pathological conditions using DTI. Tissue maladies studied by DTI in this review include cerebral ischemia and wallerian degeneration, epilepsy, multiple sclerosis, Alzheimer's disease, schizophrenia, metabolic disorders, infections and brain tumors. We have only included the common clinical conditions to keep this review precise.
Physical Principles
DTI relies on thermally driven random motion of water molecules also known as Brownian motion, to supply tissue microstructural information in vivo (Le Bihan et al 1986; Chenevert et al 1990) In unconstrained water molecules in a pure liquid environment free of impediments diffusion is equal in all directions. This situation is referred to as “isotropic.” In brain tissue, however, water diffusion is considerably reduced due to numerous barriers such as myelin sheaths, cell membranes and white matter tracts. Diffusion of the water molecules is less restricted along the long-axis of a group of aligned tissue fibers than perpendicular to it. The condition of directionally-dependent diffusion is referred to as “anisotropic.” In diffusion weighted imaging, (DWI) diffusion is described using a scalar parameter, the diffusion coefficient D. In the presence of anisotropy, diffusion can be characterized by a tensor D, which describes the mobility of the molecules in each direction and the correlation between these directions Quantities related to diffusion can be determined from the tensor (matrix). The two most commonly used DTI metrics are fractional anisotropy (FA) and mean diffusivity (MD). FA (Equation 1) measures the degree of directionally of diffusion while MD (Equation 2) measures the magnitude of diffusion.
Potential Clinical Applications of DTI
Although, DTI is not used routinely as a clinical tool in most institutions however, an increased interest in evaluation of the role of DTI for examination of the brain and spine has lead to intensive research and resulted in several reports. We will review some of the clinical situations in which DTI has been shown to be of interest.
Fiber Tracking
Diffusion-based tractography is a technique based on the directional movement of water, which is determined by the brain microstructure and imaged with diffusion-sensitive MRI (Le Bihan et al. 2001; Beaulieu, 2002; Mori and Zhang, 2006) to generate virtual, three-dimensional representations of the white matter fiber tracts in the human brain (Mori and van Zijl, 2000; Shimony et al 2004) The main assumption that underpins tractography is that the dominant direction of water motion, the principal axis of the diffusion tensor aligns with the predominant orientation of the fibers in an imaging voxel. Recently, DTI-based fiber tracking has generated a great deal of interest because it is a unique approach that can achieve the noninvasive tracking of the white matter pathways of the brain in vivo (Mesulam, 2005; Ciccarelli et al. 2008). DTI tractography provides a network approach to neurocognitive disorders and can detect changes in the brain at an early stage of the neurodegenerative process (Catani, 2006; Ciccarelli et al 2008) Reduced FA has been found in the cingulum, hippocampus, and the posterior corpus callosum of individuals who are cognitively healthy but have an increased genetic risk of dementia (Persson et al 2006). In patients with Alzheimer's disease, changes in FA have been shown in the long-range association tracts of the temporal lobe involved in memory functions but no changes were seen in the visual radiations, usually spared in these patients (Taoka et al 2006). Thiebaut et al provided a tracking method for establishing anatomo-functional correlations by estimating the cortical areas connected in normal subjects, or disconnected by white matter lesions (Thiebaut et al 2008) This method will help researchers and clinicians to identify the neural bases of cognitive abilities and the behavioral consequences of brain lesions. The potential of tractography for the mapping of eloquent white matter pathways for the purposes of neurosurgical planning and neuronavigation has been described in several studies (Chen et al. 2007a, b). Nimsky et al showed that white matter tracts, such as the internal capsule, shifted between -8 mm to +15 mm in a series of 37 patients who had surgery to remove gliomas (Nimsky et al. 2005). These findings emphasize the importance of an intraoperative update of navigation systems during resection of deep-seated tumors that are near to eloquent brain areas Disruption of fibers associated with language or motor functions has been shown in glioma patients during surgery (Bello et al 2008). The clinical relevance of this approach comes from the fact that it should further enhance surgical safety maintaining a high rate of functional preservation.
Neurodevelopmental Studies
Fetal Development
Anatomical MRI has provided valuable information about human brain development (Chong et al 1996; Inder and Huppi, 2000; Kostovic et al 2002). In contrast to conventional anatomical imaging, DTI has the potential to provide information about the micro structural organization within the neural tissue (Le Bihan, 2003). Animal and human studies have shown that diffusion anisotropy is related to microstructural organization during brain development (Mori et al. 2000; McKinstry et al 2002; Mass et al 2004; Partridge et al 2004) A number of DTI studies have shown detectable cortical anisotropy in preterm neonates that gradually diminishes with maturation (Mass et al. 2004; Partridge et al. 2004; Mukherjee and McKinstry, 2006) Gupta et al. have shown pattern of laminar organization of the human cerebrum from DTI in fetuses ranging from 15 to 37 weeks GA and postulated that the early increase in cortical FA value reflects neuronal migration along the radial glia upto mid-trimester and the subsequent decrease in the FA value is due to maturation and loss of radial orientation (Gupta et al 2005). (Fig. 1). This postulate of Gupta et al. has been verified recently by performing immunohis-tochemical analysis in the different cortical regions of fetal brains and correlating with DTI derived metrics (Gupta et al 2008). The ability to monitor region-specific cortical migration and maturation processes noninvasively in vivo should greatly improve our understanding of the normal developmental pattern of cortical gray matter and aid in the early diagnosis of developmental disorders.

FA maps modulated by the principal eigenvectors showing changes in the cortical anisotropy in the cerebrum at different gestational ages: (A) 17 weeks, (B) 22 weeks, (C) 27 weeks, (D) 37 weeks, and (E) 133 days. The small arrows (white and yellow) indicate the direction of the principal tensor eigenvector. The FA in the periventricular germinal matrix (thick white arrow) shows a gradual decrease from A–C and disappears subsequently in D. The color coding is shown in E (lower right corner): red (right-left), green (anterior-posterior), blue (superior-inferior).
Normal Developing Brain, Maturation and Aging
Normal human brain maturation begins in utero and continues after birth into adolescence, with the most dramatic changes in myelination in the first few years of life. Characteristic MRI signal changes on Tl- and T2-weighted images may reflect a decrease in brain water content and an increase in white matter myelination during brain maturation in children. Quantitative analysis with newer techniques provides more information in assessing brain maturational process than conventional MRI. Diffusion anisotropy in white matter is related in part to the water content of the tissue, the degree of myelination of the tissue, and the extent to which the tissue shows organization of the tightly packed bundles, the latter two factors provide barriers to diffusion and allowing preferential diffusion along a given direction (Beaulieu and Allen, 1994; Neil et al 1998; Shimony et al. 1999; Beaulieu, 2002). Previous studies have shown that MD decreases and the FA increases as the gestational age increases in premature to near-term babies (Miller et al. 2002) and newborns (Sakuma et al. 1991; Nomura et al 1994; Huppi et al 1998; Neil et al 1998; Shimony et al. 1999; Boujraf et al. 2002). This observation of decreasing MD and increasing diffusion anisotropy continues into childhood until maturation and young adulthood (Mukerjee et al. 2001; McGraw et al. 2002; Suzuki et al 2003; Snook et al. 2005). A recent DTI study has reported age-related changes in the normal cerebral and cerebellar white matter in children ranging from birth to 132 months (Saksena et al 2008) (Fig. 2).

Axial and coronal images in a 8-year old child showing normal cerebral white matter (genu and splenium of corpus callosum, posterior limb of internal capsule) and cerebellar white matter (middle cerebellar peduncles, superior cerebellar peduncles and inferior cerebellar peduncles). T2-weighted image, MD, FA, and color-coded FA maps at the level of third ventricle (A, B, C, D), pons (E, F, G, H) and fourth ventricle (I, J, K, L) showing region-of-interest(s) placed on color-coded FA maps on genu and splenium of corpus callosum, posterior limb of internal capsule, middle cerebellar peduncles, superior cerebellar peduncles and inferior cerebellar peduncles respectively. The cut off value for the color-coded FA map for display is kept at 0.2 above which the color-coded regions reflect the white matter only red (right-left), green (anterior-posterior), and blue (superior-inferior).
DTI has also been used in normal aging to detect age related degenerative changes A decrease in the ADC and increase in FA have been found to occur as the adult's age (Pfefferbaum et al. 2000; Nusbaum et al. 2001; Sullivan et al 2001; Salat et al 2005; Sullivan and Pfefferbaum et al. 2006; Yoon et al 2008). These findings however may indicate underlying physiologic processes, gradual demyelination or loss of axonal fibers and increased extracellular space that occurs in normal aging.
Cerebral Ischemia and Wallerian Degeneration
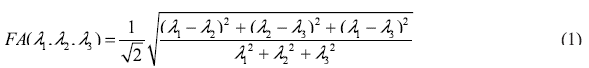
Brain ischemia occurs when blood vessels carrying oxygen and other nutrients to a specific part of the brain are occluded or damaged. A cascade of biochemical mechanisms is triggered within the ischemic tissue when cerebral blood flow decreases below 10–15 mL/100 g/minute. The rapid failure of high energy metabolism and associated ionic pumps results in an influx of water from the extracellular compartment into the cell and this causes the cell to swell, termed as cytotoxic edema (Astrup et al 1997) Diffusion imaging has been used to detect the acute and chronic ischemic changes when conventional MRI appears normal (Moseley et al 1990; Warach et al. 1992; Ricci et al 1999) In acute phase, MD initially reduces then pseudonormalizes in the subacute phase and subsequently increases in the chronic phase. An acute elevation in FA has been also observed in ischemic white matter followed by a significant reduction in FA during the chronic phase of cerebral ischemia (Sorensen et al. 1999) These changes are believed to be due to loss of organization in normal structures when their cytoarchitecture is disrupted. It has been reported that diffusion anisotropy remains significantly lower in the infarcted area than in the homologous contralateral region of the brain (Fig. 3), even 2–6 months after an ischemic stroke (Werring et al 2000). Combining MD and diffusion anisotropy data, it is possible to assess the severity of strokes and predict outcome (Yang et al. 1999).
T2-weighted image (A), fluid-attenuated inversion recovery (FLAIR) image (B) and MD map (C) show an infarct in the left frontoparietal region (arrow) in a 30-year old female patient. The corresponding FA map (D) show low FA in the infarcted region (arrow) at six weeks after the onset of stroke. The color-coded FA fused with MD map (E) shows the abnormality more clearly.
Wallerian degeneration (WD) refers to antegrade degeneration of axons and their myelin sheaths as a result of proximal axonal injury or death of the cell body. Previous studies have shown severely reduced diffusion anisotropy and increased MD in WD using DTI (Castillo and Mukherji, 1999; Wieshmann et al 1999; Werring et al 2000) The mechanism responsible for these changes is considered to be axonal loss after ischemic stroke. DTI has been shown to be more sensitive than T2-weighted imaging in detecting WD and has the potential to distinguish primary stroke lesions from the areas of WD (Pierpaoli et al 2001). Gupta et al. demonstrated lesion related focal WD changes in different segments of corpus callosum using DTI in patients with large middle cerebral arterial territory stroke. Significant temporal decline in FA values along with increased MD values (Fig. 4) suggest cortico-callosal WD in these patients (Gupta et al 2006).

T2-weighted image (A) and MD (B) map showing an infarct (arrow) in the left fronto-parieto-temporal region in a 50-year-old male patient. The corresponding FA map (C) and the color-coded FA fused with the MD map (D) show low FA in the infarcted region (arrow) at six weeks. The MD (E-K), FA (F-L) and color-coded FA (G-M) maps at three different time points (6, 10, and 24 weeks) are also shown.
Neurotrauma
Seizure Disorders
DTI has been used in detecting the abnormalities in patients with epilepsy. In patients with chronic epilepsy and hippocampal sclerosis, increased diffusivity and reduced anisotropy have been reported suggesting the loss of structural organization and expansion of the extracellular space (Wieshman et al. 1999; Yoo et al. 2002) In patients with malformations of cortical development (MCD), higher diffusivity and lower anisotropy were demonstrated not only within MCD (Arfanakis et al 2002), but also in the surrounding brain that appeared normal on conventional MRI (Rugg-Gunn et al. 2001; Arfanakis et al 2002). Changes in diffusivity and anisotropy in normal-appearing brain tissue beyond the origin of seizures have also been reported in other studies (Rugg-Gunn et al. 2001; Arfanakis et al. 2002; Yoo et al. 2002; Thivard et al. 2005; Gross et al. 2006; Kimiwada et al. 2006; Kim et al 2008). This may provide more information in detecting occult epileptogenic regions as well as defining the extent of lesion for surgical resection. DTI has been used to demonstrate the existence of significant pathology beyond the obvious lesions seen on the T2 and FLAIR images in chronic traumatic brain injury patients with or without epilepsy (Gupta et al 2005) The extent and severity of the DTI-observed pathology may help in separating post traumatic epilepsy from those without epilepsy in chronic traumatic brain injury patients on the basis of reduced regional FA ratio (Gupta et al 2005) (Fig. 5) These findings could improve the understanding of the pathophysiology of epilepsy and in planning specific surgical strategies related to post traumatic epilepsy.

T2-weighted image (A) and MD (B), FA (C), and color-coded FA fused with MD (D) maps through the normal ventricles shows normal distribution of white matter anisotropy in a 26-year old normal control. Note the elliptical regions of interests placed in both frontal lobes (C) to calculate FA and MD ratios. A 24-years male was on regular follow-up for the last 2 years after a closed head injury. Imaging was performed at 2 years after injury to look for the changes on imaging (E–H). T2-weighted (E) and FLAIR images (F) show a large area of hyperintensity (arrow) in the right frontal region extending to the sylvian fissure. FA map (G) shows a small area of low FA at the right fronto-temporal region posterior to the FLAIR abnormality. Color-coded FA fused with MD map (H) shows the abnormality more clearly. The cut-off value for the color-coded FA is kept at 0.2. A 32-year-old man had a closed head injury about 2.5 years before imaging and was first seen with seizures (l-L). T2-weighted image (I) through the lateral ventricles shows encephalomalacia in the left frontal region with gliosis more prominently visible on FLAIR imaging (J). FA map (K) shows low FA in the large focal area on the left side. Color-coded FA map fused with MD map (L) further confirms the large region in the left lobe that appears normal on T2 and FLAIR images.
Spinal Cord Injury
Spinal cord injury (SCI) results in transient or permanent interruption of motor, sensory, or autonomic functions. It results in acute as well as progressive secondary destruction of local and distant nervous tissue through WD and initiation of endogenous neuroprotective and regenerative responses (Anderson et al. 2007). The lesion in end stage is more or less static except for the continuously advancing WD of spinal tracts above and below the level of lesion and plasticity on the neuronal synaptic network (Kakulas, 2004) Besides the acute and chronic degenerative effects of SCI, a certain amount of spontaneous recovery occurs in patients with complete SCI. A number of animal studies have shown reorganization of the sensorimotor cortices following SCI (Ramu et al. 2007). This reorganization of cortical representation may also account for recovery of tissue function after injury as stated in previous report of SCI (Moore et al. 2000).
Conventional MRI can sometimes reveal changes in brain regions where secondary fiber degeneration has been florid. MRI may sometimes show increased T2-weighted signal intensity of the affected tracts even if atrophy is not severe (Kuhn et al 1989). However, the high signal intensity appears on T2-weighted imaging only of patients in late clinical stages DTI has the potential to provide information about the reorganization and integrity of compact white matter fiber tracts such as corticospinal tract (CST). FA considered as an index of injury to white matter, has shown promise in the characterization of pathological changes and predicting the outcome in patients with traumatic central nervous system injury (Ptak et al 2003) Retrograde pyramidal tract degeneration although extensively studied in animal models of SCI, its extent and nature in human spinal cord still remains unclear.
In a recent study, Guleria et al used DTI metrics (FA and MD) to assess the long term changes in regions rostral to the site of injury in complete SCI patients to unravel the extent of retrograde WD and the effects of cortical plasticity (Guleria et al. 2008) (Fig. 6). Temporal changes in the DTI metrics suggest progressing degeneration in different regions of CST. These spatio-temporal changes in DTI metrics suggest continued WD in injured fibers along with simultaneous reorganization of spared white matter fibers which may contribute to changing neurological status in chronic SCI patients.

Sagittal T2-weighted image (A) in a SCI patient showing abnormality at the C4–C5 level. T2-weighted image, FA, and color-coded FA maps at medulla (B–D), pons (E–G), midbrain (H-J), posterior limb of internal capsule (K-M), and corona radiata (N–P) with region(s)-of-interest placement on color-coded FA maps at various levels of corticospinal tract. The cut-off value for the color-coded FA map for display is kept at 0.2 above which the color-coded regions reflect the white matter only [red (right-left), green (anterior-posterior), and blue (superior-inferior)].
Neurodegeneration
Multiple Sclerosis
Multiple sclerosis is an inflammatory demyelinating disease of the central nervous system. In multiple sclerosis studies, there are many advantages to have a sensitive and reliable in vivo method for investigating the specific pathological changes of white matter and its integrity during the disease process. MRI has been considered to be the most informative method to diagnose and monitor disease progression in patients with multiple sclerosis (Miller et al. 1998). However, conventional T2-weighted images are unable to distinguish inflammation, edema, demyelination, gliosis, and axonal loss, because all of these lesions have identical high signal on T2-weighted images. Moreover, T2-weighted images can not detect occult tissue damage within normal appearing white matter, which may contribute to the disability of patients with multiple sclerosis (Miller et al. 1998). As a consequence, DTI provides unique in vivo information about the pathological processes that affect water diffusion as a result of brain microstructural damage. DTI offers quantitative information complementary to that provided by other imaging techniques in evaluating the structural damage occurring in multiple sclerosis lesions and normal appearing white matter (Werring et al 1999; Bammer et al 2000; Filippi et al. 2001; Iannucci et al. 2001; Guo et al. 2002; Ge et al. 2005; Hasan et al. 2005; Vrenken et al 2006; Andrade et al. 2007). A number of studies have shown that in comparison to normal-appearing white matter, multiple sclerosis lesions show elevated MD values and diminished FA values (Fig. 7) with the anisotropy indices being more sensitive in detecting the white matter abnormalities in multiple sclerosis than MD (Werring et al. 1999; Filippi et al 2001; Guo et al. 2002; Ge et al. 2005; Hasan et al. 2005) An important question in patients with multiple sclerosis is whether the structural changes that are shown as abnormal diffusion indices contribute to functional brain reorganization. Audoin et al. reported on the extent of white matter damage as well as the structural plasticity of the bundles involved in the working memory of patients at the clinical onset of multiple sclerosis using quantitative DTI tractography (Audoin et al. 2007).
Axial T2-weighted image (A) of a tumefactive multiple sclerosis patient shows a well defined hyperintense lesion in the left periventricular region which appears hypointense on axial T1-weighted image (B). On MD map (C), lesion is hyperintense in the centre with hypointensity on the periphery. The corresponding FA map (D) and color-coded FA map fused with MD map (E) shows predominantly low FA in the centre with areas of high FA (>0.2) in the centre of the lesion along with periphery.
Alzheimer's Disease
Although the Alzheimer's disease is believed mainly to affect gray matter, postmortem studies (Brun and Englund, 1986) have revealed loss of axons and oligodendrocytes within the white matter as well. These pathological changes originate in the medial temporal region, in the entorhinal cortex and hippocampus, subsequently spreading over the entire limbic cortex and then into neocortical association areas (Braak and Braak, 1998), which results in progressive cognitive decline. In patients with Alzheimer's disease, lower anisotropy has been reported in the genu and splenium of corpus callosum compared to sex- and age-matched controls, probably due to axonal loss or demyelination in these areas (Hanyu et al 1999) DTI studies conducted in the early stages of the disease have demonstrated reduced anisotropy within the association white matter fiber tracts, including the temporal stem, cingulate fasciculus corpus callosum, and superior longitudinal fasciculus, as well as the hippocampus (Rose et al 2000; Kantarci et al 2001; Zhang et al. 2007; Cho et al 2008) Mild cognitive impairment (MCI) has been defined as a transitional state between normal aging and Alzheimer's disease (Charlton et al 2006; Medina et al 2006; Cho et al. 2008). Cognitive functions such as attention and memory depend on the cooperation of multiple brain regions that are connected by white matter fibers. Various neuronal degenerative diseases and age-related cognitive impairments, are assumed to be related to the disconnection of these neuronal networks. A few DTI studies have reported micro-structural changes in different white matter regions in Alzheimer's disease and MCI (Medina et al. 2006; Zhang et al 2007). The correlation between changes of FA and MD in some specific white matter region and mini mental state examination scores has been demonstrated suggesting white matter damage in patients with Alzheimer's disease related to decline of cognitive function (Duan et al. 2006). Thus, the mapping of the diffusion parameters may be potentially useful to track progressive changes in Alzheimer's disease and could possibly be used in the future to evaluate the treatment.
Schizophrenia
Many neuroimaging studies have reported abnormalities in the brain of patients with schizophrenia (Wible et al. 2001; Hulshoff Pol et al 2002; Lawrie et al 2002; Potkin et al. 2002). The findings of volume reduction of the gray matter and subcortical regions in schizophrenic patients have been indicated by MRI studies (Wible et al. 2001; Hulshoff Pol et al. 2002). Functionally abnormal findings in the frontal, temporal and parietal lobes thalamus and basal ganglia from positron emission tomography and functional MRI suggest that the clinical and pathological features of schizophrenia may be explained by the disruption of dynamic circuit models implicating compromised connectivity among brain structures (Lawrie et al. 2002; Potkin et al. 2002) However, abnormalities in white matter have not been consistently identified by conventional structural MRI which is relatively insensitive to white matter microstructure. DTI is shown to be useful in evaluating the existence of microstructural disturbance in brain white matter. Buchsbaum et al. demonstrated lower relative anisotropy in the white matter of the prefrontal cortex based on statistical probability maps (Buchsbaum et al. 1998). Lim et al. showed widespread lower FA in the white matter despite an absence of a white matter volume deficit in ten men with schizophrenia compared with ten age-matched healthy subjects (Lim et al. 1999). Increased ADC and reduction of FA were found in the splenium but not in the genu of the corpus callosum in schizophrenic patients compared with those in healthy controls (Foong et al. 2000). A significant FA reduction in the splenium of the corpus callosum and adjacent regions in the bilateral occipital white matter was found in schizophrenic patients (Agartz et al 2001). MD was increased in the total white and grey matter volumes of schizophrenic patients compared with that in healthy subjects (Agartz et al. 2001). Reduced FA have been reported in the left uncinate fasciculus and left arcuate fasciculus in 30 patients with schizophrenia compared with 30 matched controls (Burns et al 2003). These findings provide evidence suggesting disconnectivity in the cerebral white matter in patients with schizophrenia. Okuwaga et al. reported significantly reduced FA values in the middle cerebellar peduncles in patients with schizophrenia suggesting that neural disconnectivity between the cerebellum and cerebrum may be involved in the pathology of schizophrenia (Okugawa et al 2005). In a recent study, Skelly et al. compared DTI images of 25 schizophrenia patients and 25 matched healthy controls and performed voxel-wise correlational analyses using the patient's DTI data and their severity scores of positive and negative symptoms (Skelly et al. 2008). Diffuse deficits were found in multiple types of white matter tracts in schizophrenia, and an inverse relationship of FA values with positive symptom scores in association fibers, further supported a disconnection” hypothesis of positive symptoms in schizophrenia (Skelly et al. 2008).
Metabolic Disorders
This group includes a wide spectrum of inherited neurodegenerative disorders that affect the gray and white matter to varying degrees DTI technique has been performed to evaluate the abnormalities related to demyelination in patients with adrenoleukodystrophy (ALD) (Ito et al. 2001; Eichler et al 2002) and Krabbe disease (Guo et al 2001) Eicher et al. demonstrated reduced FA and increased MD in patients with X-linked ALD (Eichler et al 2002). The changes in FA and MD values within the affected white matter correlated with the well-recognised histopathological zones described in this study (Schaumburg et al. 1975) suggesting increase in free water and loss of the integrity of the myelin sheaths and axons in the white matter Krabbe's disease, is an autosomal recessive disorder that results from deficiency of the lysosomal enzyme, galactocerebroside b-galactosidase (Barone et al. 1996; Zafeiriou et al 1996) Deficiency of this enzyme blocks the degradation of b-galactocerebroside, a major component of the myelin sheath (Barone et al 1996) DTI has provided a sensitive and quantitative means for detecting dysmyelination in patients with Krabbe's disease and may be a marker of treatment response (Guo et al. 2001). DTI has been found to be superior to conventional MRI in differentiating dysmyelinating disorders from demyelinating disorders (Ono et al. 1997). The existence of diffusional anisotropy in dysmyelinated lesions and the lack of diffusional anisotropy in demyelinated lesions have been verified in both animal and human studies (Ono et al 1997).
Neuroinfection
Brain Abscess
A brain abscess is characteristically defined as a focal suppurative process within the brain parenchyma (Venkatesh and Gupta, 2001). MR imaging techniques such as proton MR spectroscopy and diffusion-weighted imaging has been used in the differentiation of abscesses from nonabscess lesions with considerable success (Holtas et al 2000; Shukla-Dave et al. 2001; Mishra et al 2004). Although most abscesses show restricted diffusion, there are reports showing high diffusivity in the treated abscesses and restricted diffusion in cystic metastases (Holtas et al. 2000; Mishra et al. 2004). Gupta et al reported for the first time in literature remarkably high FA values (Fig. 8) from the cavity of brain abscess in five patients with restricted MD in comparison to nonabscess cases (Gupta et al 2005). The DTI-derived FA values were correlated with the neuroinflammatory molecules quantified from the brain abscess cavity aspirate of the patients as well as from the heat-killed S. aureus-treated cell lines (Gupta et al 2008) It has been demonstrated that increased FA values inside the abscess cavity are due to the oriented neuroinflammatory molecules (Gupta et al. 2008). FA may be used as a noninvasive surrogate marker for activity of the disease at the site of local infective process.

A 26-day-old male patient presenting with multiple pyogenic brain abscess. Axial T2-weighted image (A) shows a well defined hyperintense lesion with hypointense wall. The lesion appears hypointense on axial T1-weighted image (B). On post contrast T1-weighted image (C) the lesion shows rim enhancement. Abscess cavity appears hypointense on MD map (D). The FA (E) and color-coded FA map fused with MD map shows (F) orientation in the abscess cavity similar to what is observed in the white matter.
Meningitis
Gadolinium (GD)-DTPA MRI can detect abnormal meningeal enhancement (Kastrup et al. 2005) High FA values has been demonstrated in enhancing as well as non-enhancing cortical ribbon in adults as well as in neonates with bacterial meningitis compared to age matched controls (Nath et al 2007; Trivedi et al. 2007). The authors have proposed that the oriented inflammatory cells in the sub-arachnoid space as a result of up-regulated immune response in meningitis are responsible for increased FA values. Increased FA values in the enhancing as well as non-enhancing cortical regions suggest diffuse inflammatory activity in the pia-arachnoid in meningitis patients (Fig. 9) It also suggests that FA may be a better indicator of active and diffuse meningeal inflammation than post contrast T1-weighted imaging. Periventricular white matter of neonatal brain is known to be vulnerable to oxidative and hypoxic/ischemic injury secondary to neuro-infections A recent DTI study, demonstrated decreased FA values in the periventricular white matter regions of neonates with bacterial meningitis compared to age/sex matched healthy controls suggesting microstructural white matter injury (Malik et al 2008).

A14-years-old meningitis patient associated with sub-dural collection of pus in fronto-temporal region and interhemispheric fissure. T2-weighted axial image (A) shows hyperintensity in the left frontal region and interhemispheric fissure which appear hypointense on T1-weighted image (B) and shows wall enhancement on post-contrast T1-weighted (C) image. Post-contrast T1-weighted (C) image also shows meningeal enhancement consistent with meningitis. FA map (D) shows increased FA values in subdural collection as well as cortical grey matter region enhanced on post-contrast T1-weighted image. The abnormality is more clearly visible on color coded FA (E) (arrow) modulated by the principal eigenvector. DWI image (F) shows areas of restricted diffusivity in the subdural collection of pus in fronto-temporal region and interhemispheric fissure.
Subacute Sclerosing Panencephalitis
Subacute sclerosing panencephalitis (SSPE), a rare progressive degenerative disease is caused by persistent infection with a defective measles virus. Imaging in these patients is not used for diagnosis but for following the course of disease. To date, no significant correlation between conventional MRI and clinical staging has been demonstrated; even severely affected patients may show normal MRI (Brismar et al 1996) DTI has shown decreased FA values and increased MD values in periventricular white matter region of frontal and parietooccipital lobe in patients with near normal conventional imaging compared to controls (Trivedi et al. 2006) (Fig. 10). Quantitative DTI can be used to detect the changes in the white matter in the patients with SSPE earlier than conventional MR imaging and may have be helpful in prognostication of these patients.

A 6-years-old healthy control (A-C). T2-weighted (A), FA (B), and color coded FA fused with MD (C) through the lateral ventricles shows normal distribution of white matter. A 12-years-old-boy (D-F) with clinical findings of SSPE appears normal on T2-weighted image (D). FA map (E) shows bilateral significantly low FA values in the white matter. Color-coded FA fused with MD map (F) shows the abnormality more clearly. A 8-years-old –boy (G-I) with SSPE has hyperintensities on T2-weighted image (G) in the bilateral frontal region (arrow). FA map (H) shows widespread bilateral abnormal white matter and thinning of genu and splenium of corpus callosum. Color coded FA fused with ADC map (I) shows the abnormality more clearly.
Tumors
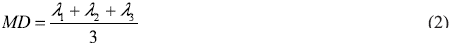
The specification and grading of brain tumors is limited, although conventional MRI with contrast-enhanced T1- and T2-weighted sequences has been used to characterize the location and extent of these tumors. DTI has been increasingly used to investigate different tumor components and to differentiate tumor invasion from normal brain tissue or edema (Brunberg et al. 1995; Krabbe et al 1997; Castillo et al 2001; Bastin et al 2002). Highes ADC values have been found in cystic or necrotic regions (Brunberg et al 1995) while lower ADC values in the contrast-enhancing part of a tumor compared to the cystic or necrotic areas and the edema (Brunberg et al. 1995; Krabbe et al 1997; Castillo et al 2001; Bastin et al. 2002) Previous studies have correlated the ADC values with the type and grade of tumor (Castillo et al. 2001; Gfauvain et al. 2001). Low-grade astrocytoma has higher ADC values (Fig. 11), whereas high-grade malignant glioma has lower ADC values (Fig. 12) reflecting more restricted diffusion from increasing tumor cellularity. It has been shown that FA values which are reduced in tumors, suggesting structural disorder might not be able to provide extra information on the tissue differentiation (Sinha et al 2002) However, FA may help in identifying the disorganization of the white matter tracts and the effects of tumor on white matter pathways which cannot be obtained with conventional MRI (Mori et al 2002). Understanding the effect of brain tumor on white matter fibers may be important in presurgical planning and evaluation of surgical treatments (Lazor et al 2006) Data obtained from both animal models and human studies suggest that diffusion imaging may be sensitive to tumor response to therapy (Dzik-Jurasz et al. 2002; Mardor et al 2003). Early increasing ADC values during therapy may relate to therapy-induced cell necrosis while the subsequent drop in tumor ADC to pretreatment levels is thought to indicate tumor regrowth. In a recent study, DTI has been able to predict the patterns of glioma recurrence and allow better individualisation of tumour management and stratification for randomised controlled trials (Price et al 2007).

A 50-year-old woman with right fronto-parietal low-grade astrocytoma. T2-weighted axial image (A) through the lateral ventricle shows hyperintense mass on the right side with perifocal edema and mass effect. The lesion appears hypointense on T1-weighted image (B) and shows rim enhancement on post-contrast T1-weighted image (C). MD map (D) shows high diffusivity and FA map (E) shows little anisotropy. Color-coded FA fused with MD map shows no orientation in the cavity.
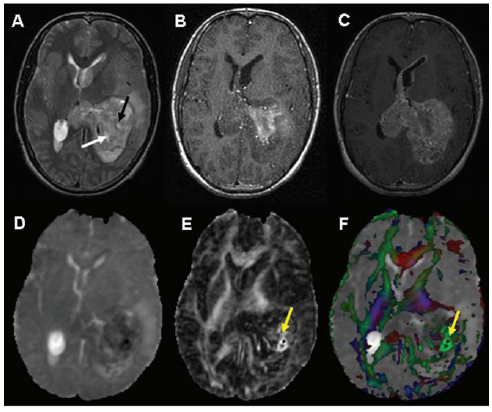
Glioblastoma multiforme in the left fronto-parietal region involving thalamus and lateral ventricles in a 24-year-old male with hemorrhagic lesion. T2-weighted image (A) shows areas of hyperintensity (white arrow) and hypointensity (black arrow) within the mass. On T1-weighted images (B) these areas are hyperintense suggestive of hemorrhage. Post-contrast T1-weighted imaging (C) shows tumoral enhancement. These regions show hypointensity on the MD map (D). The corresponding FA map (E) and the color-coded FA fused with MD map shows high anisotropy in the hemorrhagic regions (yellow arrow).
Conclusion
DTI is a powerful noninvasive technique to study the complex brain tissue architecture. It has shown to be of value in studies of fiber tracking and neurodevelopment. In addition, it also has tremendous potential in a broad variety of pathologies such as cerebral ischemia, epilepsy, and spinal cord injury, neurodegenerative disorders like multiple sclerosis, Alzheimer's disease, schizophrenia, metabolic disorders, infections and brain tumors. The current applications of DTI to neurological disorders show that it has the potential to improve our understanding of damage and recovery in diseases of the brain and spinal cord. Further applications are almost inevitable as research continues to help make the technique more robust and easier to apply, and as more scientists and clinicians gain an understanding of DTI.
Disclosure
The authors report no conflicts of interest.
Footnotes
Acknowledgements
This study was supported by Department of Biotechnology (Grant no. BT/PR5009/MED/14/581/2004) Indian Council of Medical Research (Grant no. 5/4-5/12/Neuro/2005-NCD-I) and Life Sciences Research Board-Defence Research and Development Organization (DLS/81/48222/LSRB-129/ID/2007) New Delhi, India. Sona Saksena acknowledges the financial assistance from the Indian Council of Medical Research, New Delhi, India.