



Abstract
The ability to drive is associated with independence and mobility. However, aging, medical conditions, and neurological injury have been linked to declines in cognitive capacity, vision, and physical abilities that may impair a person’s ability to drive safely (Anstey, Wood, Lord, & Walker, 2005; Duchek et al., 2003). Although there must be a balance between public safety and the privilege to drive, licenses should not be repealed on the basis of age or medical diagnoses alone, because many older adults and many people who have medical conditions are fit to drive (Dickerson et al., 2007; Duchek et al., 2003; Hird, Vetivelu, Saposnik, & Schweizer, 2014; Ott et al., 2008). The consequences of allowing an unfit driver to drive are readily apparent; however, there are also consequences associated with driving cessation. It has been linked to depression (Fonda, Wallace, & Herzog, 2001; Ragland, Satariano, & MacLeod, 2005), decreased activity and community participation (Fairhall et al., 2014; Marottoli et al., 2000), reduced mobility (Neven et al., 2013; Rosenbloom, 2001), and increased likelihood of nursing home placement (Freeman, Gange, Muñoz, & West, 2006). Thus, it is essential that the decision to revoke a driver’s license be based on both valid and reliable measures.
Although the gold standard to assess fitness to drive is an on-road test completed by a trained examiner or occupational therapist with specialized training (Dickerson, 2013; Dickerson, Meuel, Ridenour, & Cooper, 2014; Weaver & Bédard, 2012), it would be more efficient and safer to determine fitness to drive solely with off-road tests, if possible. A variety of off-road tests have been suggested (Ball et al., 2006; Bowers et al., 2013; De Raedt & Ponjaert-Kristoffersen, 2001; Dickerson et al., 2014; Hoggarth, Innes, Dalrymple-Alford, Severinsen, & Jones, 2010; Kantor, Mauger, Richardson, & Unroe, 2004; Wood, Anstey, Kerr, Lacherez, & Lord, 2008); however, each individual test is not sufficiently precise in a clinical context, characterized by considerable diagnostic uncertainty (Bédard, Weaver, Darzins, & Porter, 2008).
Even the use of several off-road tests together can be problematic in assessing fitness to drive. For example, McKenna, Jefferies, Dobson, and Frude (2004) used a cognitive test battery to identify people in need of a driving test after brain injury or pathology. The sensitivity and specificity were 37% and 85%, respectively, for study participants age 70 yr or older. 1 Similarly, Aslaksen, Ørbo, Elvestad, Schäfer, and Anke (2013) determined that three neurological tests (California Computerized Assessment Package [CalCAP; Miller, 1990], Trail Making Test Part A [Trails A; Reitan & Wolfson, 1993], and Grooved Pegboard [Reitan & Wolfson, 1993]) were the best predictors of the on-road test results for people with traumatic brain injury or stroke. For these tests, sensitivity ranged from 77% to 85% and specificity from 23% to 29%, resulting in the misclassification of nearly one-quarter of participants.
Hoggarth and colleagues (2010) used two statistical modeling techniques—binary logistic regression (BLR) and nonlinear causal resource analysis (NCRA)—to determine the ability of demographic variables and a number of cognitive, sensory–motor, and personality tests to predict driving test results in healthy older adults. Low values from the leave-one-out cross-validation analyses for both sensitivity and specificity (50% and 70.5%, respectively, for the BLR model, and 62.5% and 63.6%, respectively, for the NCRA model) led them to conclude that neither approach could be used in isolation to predict fitness to drive.
Wood and colleagues (2008) used several vision, cognitive, and motor tests to explore safe and unsafe performance during a driving test of community-dwelling older adults. They concluded that a visual motion sensitivity detection test, color choice reaction time, postural sway, and a measure of self-reported driving exposure yielded 91% sensitivity and 70% specificity on fitness to drive on the on-road test. In addition, Carr, Barco, Wallendorf, Snellgrove, and Ott (2011) administered a cognitive test battery to people with dementia referred for driving assessment and compared it with the outcomes of their driving tests. They found 98% sensitivity and 24% specificity in their best model. Although the sensitivity was good in both of these studies, the low specificity illustrates the difficulties in preventing false positives (i.e., safe drivers being labeled as unfit) and the risk that older drivers may be unfairly prevented from driving. For example, assuming a specificity of 95%, the battery of tests developed by Wood and colleagues would yield a sensitivity of approximately 50%. Barco, Wallendorf, Snellgrove, Ott, and Carr (2014) developed a calculator of probability of road test failure that used results from Trails A (Reitan, 1958) and the Snellgrove Maze Task® to predict on-road driving test outcomes. However, they noted that although they reported cutpoints, determining an acceptable level of sensitivity and specificity was a challenge. This issue has also been reiterated by others (Kay, Bundy, Clemson, Cheal, & Glendenning, 2012).
Recognizing concerns with cutpoints on pencil-and-paper tests to screen for driving abilities, Molnar, Byszewski, Rapoport, and Dalziel (2009) have encouraged clinicians to use serial trichotomization to evaluate fitness to drive. Beginning with Test 1 (i.e., a pencil-and-paper test used to assess fitness to drive, such as the Clock-Drawing Test [CDT; Shulman, 2000] or Trail Making Test), clinicians should rate a client as “Pass,” “Fail,” or “Indeterminate.” This rating should continue with Test 2 (i.e., another pencil-and-paper test used to assess fitness to drive) and so on. At the end of the assessment, drivers will have been funneled through the process, and presumably the majority will be rated as either fit (Pass) or unfit (Fail) to drive. Those remaining in the Indeterminate category would require a more comprehensive driving evaluation conducted by a clinician with specialized training. One obvious advantage of this approach is that it can be done relatively quickly with tests used routinely and without having to compute a composite score. Hence, the purpose of this study was to illustrate how serial trichotomization could work using upper and lower cutpoints reflecting 100% sensitivity and 100% specificity for five tests of cognition commonly used to assess fitness to drive.
Method
Research Design
This study used a cross-sectional research design to analyze the in-clinic assessments and driving tests of people referred to the Driver Assessment Program (DAP) at St. Joseph’s Care Group (SJCG) for a comprehensive driving evaluation between January 1, 2009, and February 28, 2014. Ethics approval was granted for this study from the research ethics boards at Lakehead University and SJCG in Thunder Bay, Ontario, Canada.
Participants
Participants were obtained from the DAP. All drivers who received the comprehensive driving evaluation were deemed eligible for this study regardless of the reason for referral. Although this created a heterogeneous group, it is reflective of people who are assessed at the DAP.
Measures
All participants completed the standard DAP protocol, which comprises tests of vision, physical strength and coordination, and cognition as well as an on-road driving test. All assessments were administered by the occupational therapist associated with the DAP. Measures of cognition used in this study included the CDT; the Montreal Cognitive Assessment (MoCA; Nasreddine et al., 2005); the Motor-Free Visual Perception Test, Third Edition (MVPT–3; Colarusso & Hammill, 2003); and both parts of the Trail Making Test (Trails A and B).
The CDT is used as a screening tool to detect cognitive impairment in older adults. A review of published studies on the CDT found high mean sensitivity (85%) and specificity (85%) in identifying cognitive impairment (Shulman, 2000). The scoring system used in our study resulted in scores ranging from 0 to 7, with a higher score representing better cognition. This scoring system has also been used by others to identify fitness to drive (Freund, Gravenstein, Ferris, Burke, & Shaheen, 2005; Oswanski et al., 2007). However, Manning, Davis, Papandonatos, and Ott (2014) used a 7-point scoring system, as well as an on-road driving test, as the gold standard and found that just over three-quarters of participants were rated as Indeterminate on the CDT (i.e., those with scores between 3 and 6 inclusively).
The MoCA is a paper-based cognitive screening tool that takes approximately 10 min to complete (Nasreddine et al., 2005). MoCA scores range from 0 to 30; higher scores indicate better cognition, and scores ≤25 indicate impairment. The MoCa has excellent sensitivity and specificity in detecting mild cognitive impairment (Nasreddine et al., 2005; Smith, Gildeh, & Holmes, 2007). Rapoport and colleagues (2013) failed to find any statistically significant associations between the MoCA and several driving practices of older adults (e.g., frequency of driving in challenging situations, avoidance of difficult driving situations, self-imposed driving restrictions, perceived driving abilities, driving comfort). In more recent work, Kwok, Gélinas, Benoit, and Chilingaryan (2015) found that a cutpoint of 25 on the MoCA (i.e., positive test = MoCA ≤25) yielded the best sensitivity (84.5%) and specificity (50.0%) in predicting the outcome of an on-road driving evaluation. They cautioned, however, that this measure should not be used in isolation to screen for fitness to drive.
The MVPT–3 was developed to measure various aspects of visual–perceptual skills (Colarusso & Hammill, 2003). Potential raw scores range from 0 to 65, with higher scores indicting fewer deficits in visual–perceptual functioning. 2 Mazer, Korner-Bitensky, and Sofer (1998) used the MVPT–3 to predict the outcome of on-road testing in people with stroke, calculating sensitivity and specificity (calculated from Figure 2 of Mazer et al., 1998) as 61% and 85%, respectively. Oswanski and colleagues (2007) used the MVPT to predict the outcome of on-road testing in older adult drivers and suggested that the optimal cutpoint to determine failure is <32. However, this cutpoint had relatively low sensitivity (60%) and specificity (80%).
Trails A and B measure visual–motor tracking, divided attention, and executive function (Reitan, 1958). They have been used in numerous driving studies. In a review of measures used to assess driving after stroke, the outcomes of on-road driving tests have been significantly predicted by both Trails A (p =.002–.05) and Trails B (p = .001–.003) scores (Marshall et al., 2007). Classen, Wang, Crizzle, Winter, and Lanford (2013) determined 106.7 s to be the most favorable cutpoint on Trails B (sensitivity = 76%; specificity = 67%) in their study of healthy older adults. A recent systematic review found that 180 s was the most supported cutpoint on Trails B to identify unfit drivers (Roy & Molnar, 2013).
The on-road driving test was administered by both the occupational therapist with specialized training in driver assessment and a professional driving evaluator from a Ministry of Transportation of Ontario–approved driving school. The driving evaluator was blind to the results of the in-clinic assessments. Each drive took approximately 45 min to complete and was conducted in a vehicle equipped with dual brakes to reduce risks. The drive followed a route standardized to meet transportation ministry requirements regarding maneuvers to be executed (e.g., number of left turns) and perceived level of difficulty. It consisted of various types of roadways and speeds, merging situations, and left and right turns at controlled and uncontrolled intersections.
Procedures
Upon completion of the in-clinic assessment and the driving test, the occupational therapist and driving evaluator used a consensus process to determine one of three possible outcomes: (1) recommendation to cease driving, (2) further training required, or (3) successful. Participants in the further training required category were offered the opportunity to take part in a second on-road evaluation. If they did so, we used only the second driving test outcome for our data. A research assistant extracted relevant personal and medical data from participants’ electronic medical records.
Data Analysis
All personal and medical data were entered into an EpiData (Version 3.1; EpiData Association, Odense, Denmark) database, and analyses were performed using IBM SPSS Statistics (Version 21; IBM Corp., Armonk, NY). We produced receiver operating characteristic (ROC) curves for each test and calculated the area under the curve (AUC). Using the ROC curve data, we selected upper and lower cutpoints that achieved 100% sensitivity and 100% specificity in predicting the outcome of the on-road driving test. With these cutpoints, participants’ test scores were categorized into three groups: Pass (test scores better than the 100% sensitivity cutpoint), Fail (test scores worse than the 100% specificity cutpoint), and Indeterminate (test scores between the cutpoints; i.e., the gray area). Finally, we used serial trichotomization (Molnar et al., 2009) to filter participants into Pass or Fail categories. Participants whose scores were Indeterminate were funneled to the next cognitive test. At each step in this funneling process, we selected (from the tests that remained) the test with the smallest gray area. This process was repeated until no further tests remained.
Results
The study included 83 participants (mean age = 60.78 yr; standard deviation = 15.36): 62 men (74.7%) and 21 women (25.3%). Major medical issues that precipitated referral to the DAP included cerebrovascular accident (n = 32, 38.6%), traumatic brain injury (n = 13, 15.7%), cognitive deficits (n = 10, 12.0%), amputation of leg or arm (n = 6, 7.2%), spinal injury (n = 3, 3.6%), multiple sclerosis (n = 3, 3.6%), and other (e.g., physical injury, mental illness, chronic pain; n = 16, 19.3%). All participants completed both the clinic evaluation (i.e., in-office tests) and the first on-road driving test. Twenty drivers were successful on the driving test, 17 were unsuccessful, and 46 required further training. During the second driving test of these 46, 35 successfully passed, and 11 were unsuccessful. Thus, 55 (66.3%) drivers were rated as fit to drive, and 28 (33.7%) were not.
Descriptive statistics for the CDT, MoCA, MVPT–3, and Trails A and B are found in Table 1. The table also includes cutpoints to achieve 100% sensitivity and 100% specificity for each test. AUCs ranged from .841 to .979 for the five tests. After establishing the upper and lower cutpoints for each test that achieved 100% sensitivity and 100% specificity, we ranked the tests from the smallest to the largest gray area, that is, Trails B (33.7% of participants), CDT (63.4%), MVPT–3 (65.1%), Trails A (66.3%), and MoCA (80.7%). We then funneled participants’ results in this order using serial trichotomization. After each test, we removed participants rated as Pass or Fail and proceeded with the next test with participants rated as Indeterminate (Figure 1).
Cognitive Tests Used in the Comprehensive Driving Evaluation
Note. AUC = area under the curve; CDT = Clock-Drawing Test; CI = confidence interval; M = mean; MoCA = Montreal Cognitive Assessment; MVPT–3 = Motor-Free Visual Perception Test, Third Edition; SD = standard deviation; Trails A = Trail Making Test Part A; Trails B = Trail Making Test Part B.
Of drivers who were unfit to drive on the basis of the behind-the-wheel assessment, 100% had test scores equal to or greater than this value for Trails B and Trails A or equal to or less than this value for CDT, MVPT–3, and MoCA.
Of drivers who were fit to drive on the basis of the behind-the-wheel assessment, 100% had test scores equal to or lower than this value for Trails B and Trails A or equal to or greater than this value for CDT, MVPT–3, and MoCA.
Measured in seconds.
Numbers in parentheses are the prorated values, assuming a 42-point scale.
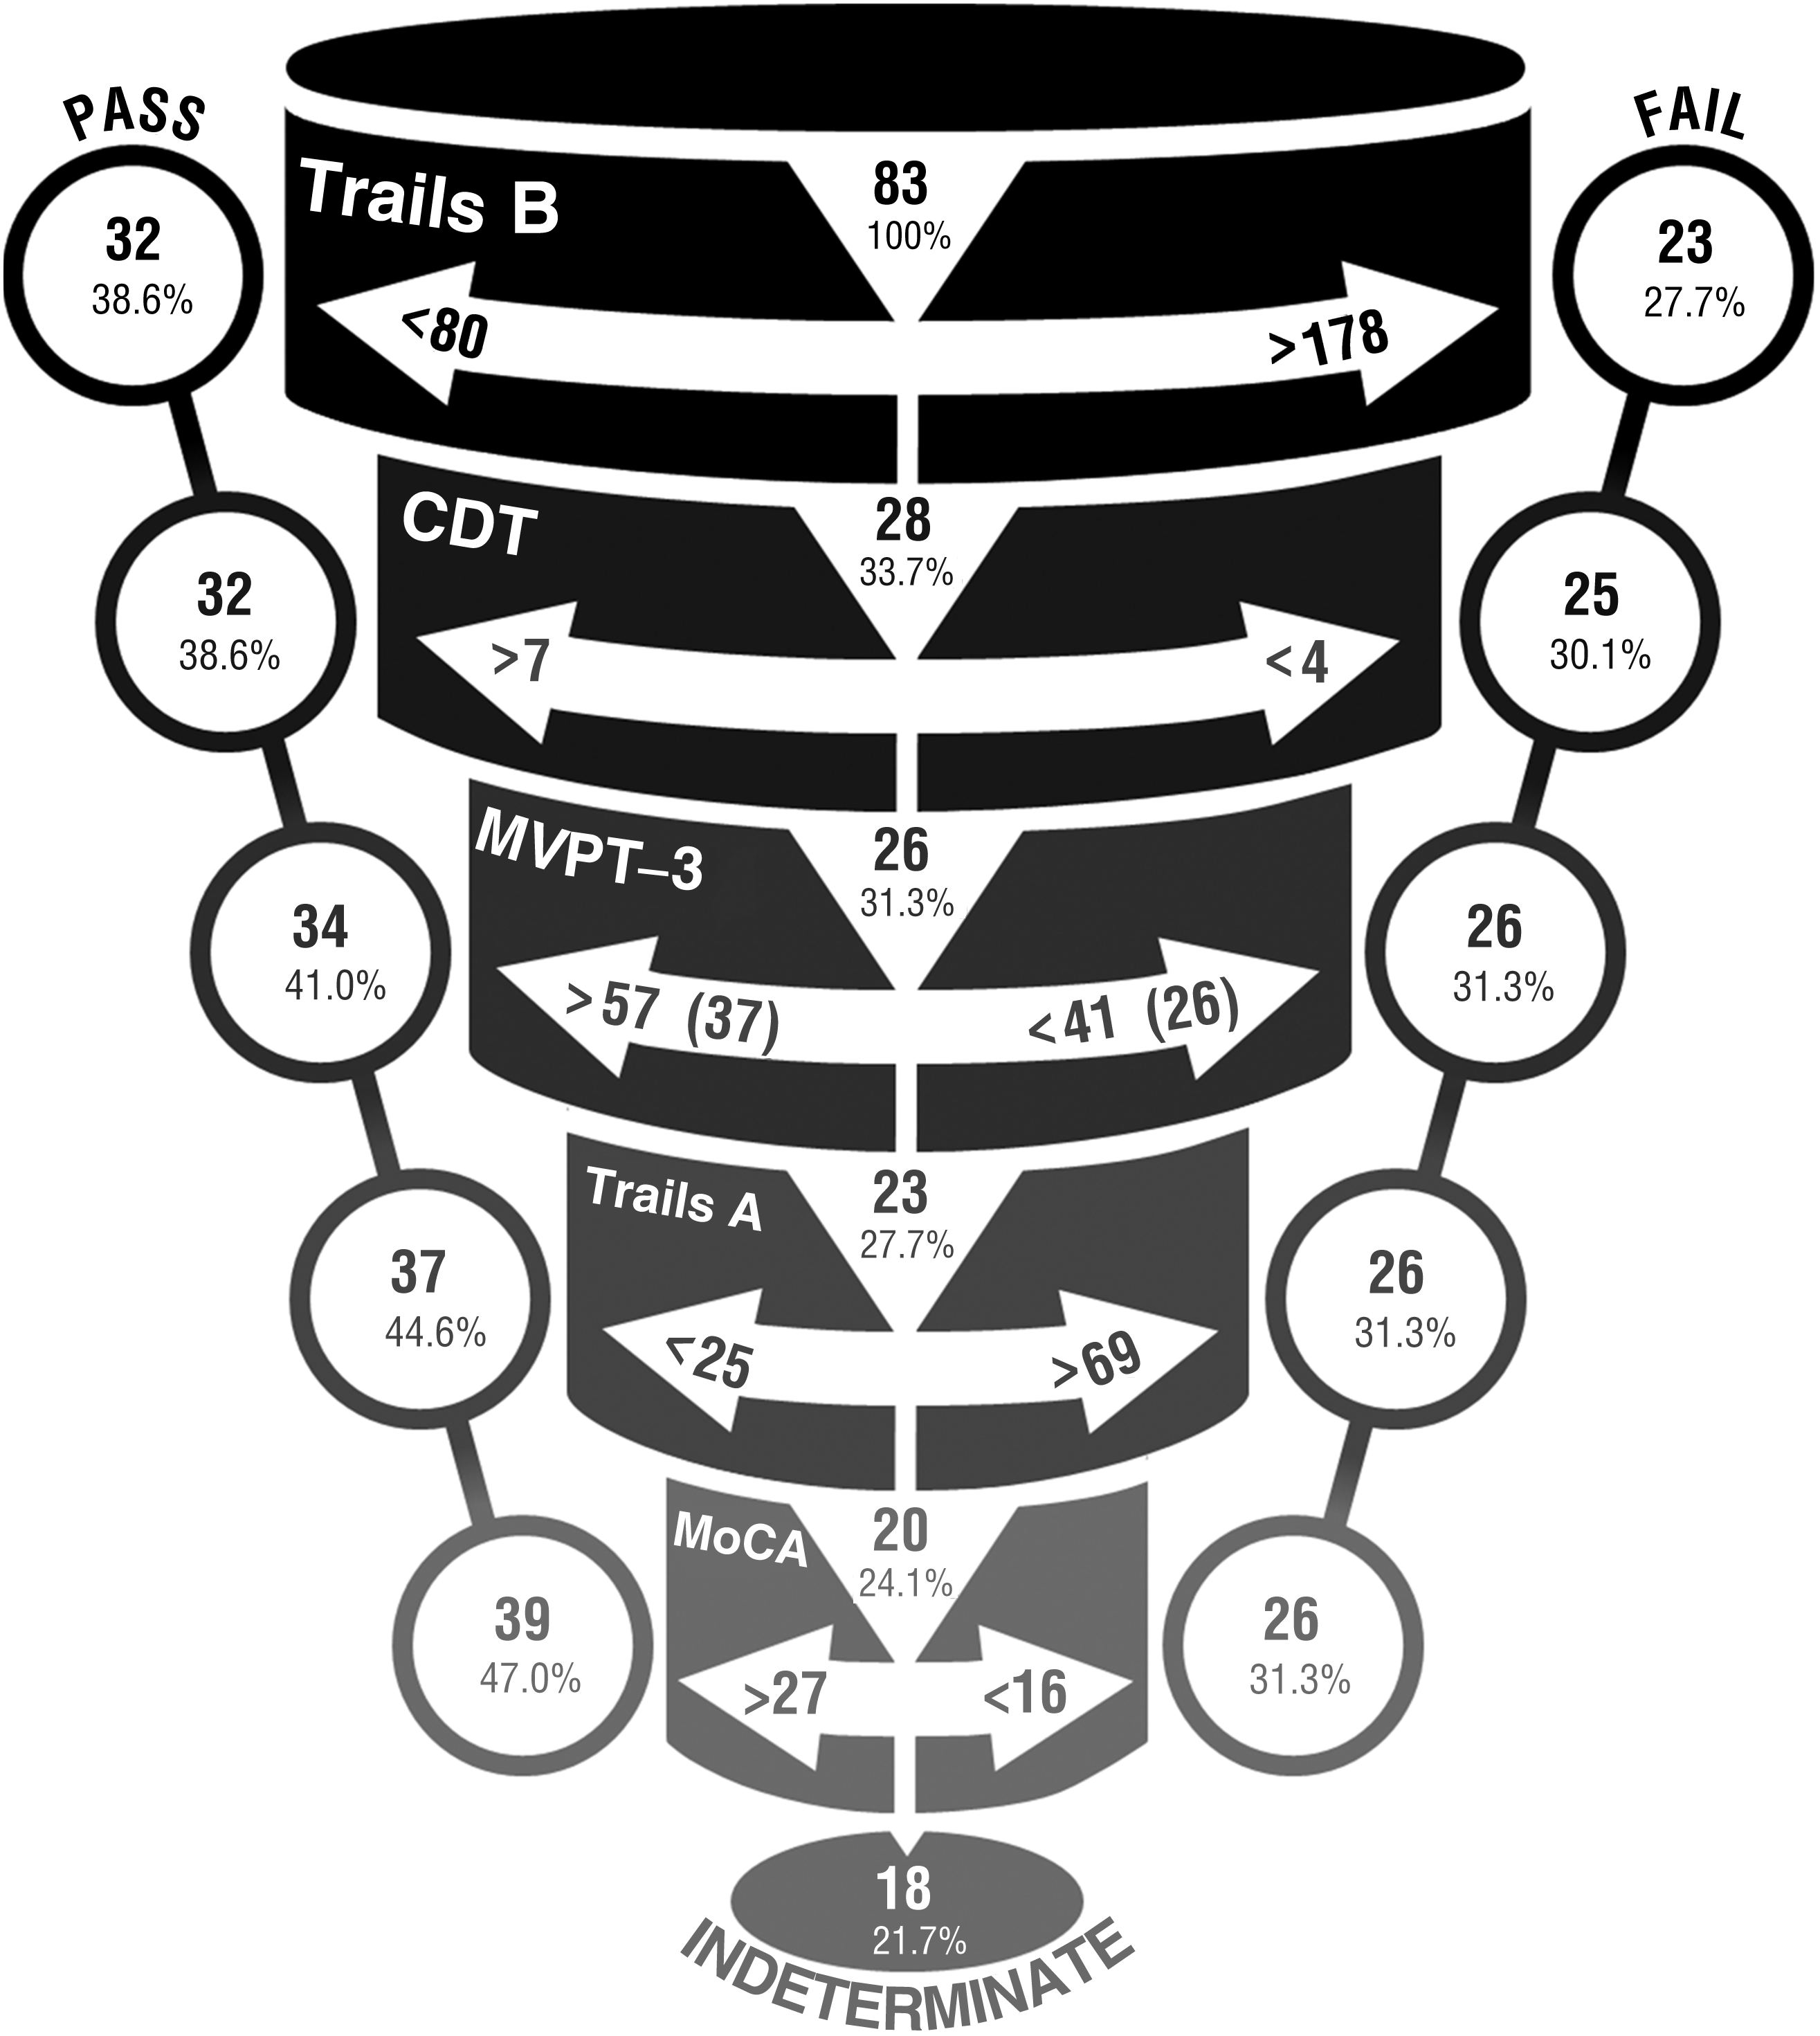
Cutpoints reflecting 100% sensitivity and 100% specificity used to funnel participants’ scores with serial trichotomization. Beginning with Trails B, participants’ scores were used to filter out those who passed or failed. Participants who scored in the indeterminate range were funneled to the next test (i.e., CDT followed by MVPT–3, Trails A, and MoCA). MVPT–3 values in parentheses represent the prorated values assuming a 42-point scale.
We began with the Trails B, using cutpoints of <80 s (100% of participants who met this criterion passed the on-road test) and >178 s (100% of participants who met this criterion failed the on-road test). On the basis of Trails B results, 32 participants were classified as fit to drive, and 23 were classified as unfit to drive. The remaining 28 (33.7%) participants fell between the cutpoints and were classified as Indeterminate. These 28 were then funneled to the CDT. As shown in Figure 1, the number of participants classified as Indeterminate decreased through the process. After funneling participants through all five tests, 39 were classified as fit to drive, 26 as unfit, and 18 as Indeterminate. Thus, at the end of the serial trichotomization process, we were able to predict the outcome of the on-road test for 65 (78.3%) participants.
Discussion
Although researchers strive to find cutpoints for various cognitive tests that strike an appropriate balance between sensitivity and specificity, the risk of misclassifying drivers remains present (Bédard et al., 2008). The ROC curves from our study demonstrated, once again, that it is not possible to predict fitness to drive with 100% accuracy using a single test of cognition. This result confirms common knowledge, and research consensus statements from an expert panel (Bédard & Dickerson, 2014), that using a single tool to determine fitness to drive is misguided. Moreover, although the AUC for each test ranged from .841 to .979 (i.e., scores indicative of excellent ability to discriminate who would fail an on-road test), these values were not as instructive in our analyses as the gray area determined for each test using cutpoints for 100% sensitivity and 100% specificity. The AUC provides “an overall summary of screening test quality” (Weaver, Walter, & Bédard, 2014, p. 257), but using tests individually to determine fitness to drive results in the misclassification of many drivers.
Even with Trails B, the best test among those we considered, and despite the presence of incorporation bias (discussed later), 28 drivers were classified as Indeterminate (interestingly, our upper cutpoint of 178 was similar to the value of 180 identified in a recent systematic review of studies using Trails B to predict fitness to drive; Roy & Molnar, 2013). However, with serial trichotomization, we were able to predict the driving test outcome for 78.3% of participants. These findings indicate that serial trichotomization could be part of a strategy to decrease the number of drivers requiring on-road driving tests.
Limitations and Future Research
Our findings should be viewed as an illustration of serial trichotomization and not be interpreted as definitive. First, our sample was relatively small, and replication of our findings using a prospective design with a larger sample is essential. Second, our sample was representative of drivers requiring a driving evaluation in our region but may be dissimilar to drivers in other driving assessment programs. In addition, all participants may not have had cognitive deficits, thus possibly introducing spectrum bias (i.e., test performance may vary because of the mix of patients in different clinical settings; Ransohoff & Feinstein, 1978).
Third, the occupational therapist administered the tests of cognition and was also involved in determining whether participants passed or failed the driving test. This lack of independence between cognitive test administration and determination of driving test outcome introduced incorporation bias (Worster & Carpenter, 2008). Specifically, the accuracy of the driving test was likely inflated because the occupational therapist may have used the results of the cognition tests in determining fitness to drive. However, note that the occupational therapist did not make the final determination alone. The therapist and the driving evaluator, who did not have access to cognitive test results, used a consensus process to agree on the outcome of the driving test. Regardless, we suggest that in subsequent studies, those who determine fitness to drive should be blind to the cognition test scores to prevent incorporation bias. Fourth, the tests used here represent only a small fraction of all tools available. It would be desirable to simultaneously assess more tools to identify the best combination of tools to achieve accuracy while limiting redundancy.
One study examining multiple tests is the Canadian Driving Research Initiative for Vehicular Safety in the Elderly (Candrive; http://www.candrive.ca). The primary goal of this 6-yr longitudinal study is to develop an in-office risk stratification tool based on pencil-and-paper tests to help clinicians identify drivers who are unfit to drive and those who may need further assessment (Marshall et al., 2013). More than 900 older drivers have completed annual assessments of cognitive (e.g., MoCA, Trails A, Trails B) and physical abilities as well as other factors such as mood, driving history, medical conditions (including prescribed medications), and driving comfort. Assessing drivers with a greater number of in-clinic tests, such as those used in Candrive, could lead to a protocol that would further increase the number of drivers identified as fit or unfit to drive without requiring an on-road driving test.
Implications for Occupational Therapy Practice
The results of this study have the following implications for occupational therapy practice:
Ultimately, there must be a balance between public safety and driving privilege, but screening for fitness to drive must be grounded in valid approaches. The right compendium of tools along with serial trichotomization may facilitate more efficient determination of fitness to drive.
Although our results are far from definitive, they exemplify an approach that enables clinicians to make valid decisions about fitness to drive by reducing the number of false positives and false negatives.
This approach supports the needs of health care professionals when assessing fitness to drive. It offers increased precision and could reduce the number of drivers requiring on-road tests. Moreover, the use of serial trichotomization allows professionals to treat their clients with greater fairness than other approaches because decisions about fitness to drive are based on a validated and reliable standardized protocol.
Conclusion
The determination of fitness to drive must be based on valid assessments. Reliance on a single pencil-and-paper tool is inadequate; however, serial trichotomization has the potential to yield results that reduce uncertainty on the part of health care professionals when they evaluate their clients. This approach presents an opportunity to improve on current protocols and prevent the consequences associated with the misclassification of drivers.
Footnotes
Acknowledgments
This study was supported by Canadian Institutes of Health Research Grant 299669 and by the AUTO21 Networks of Centres of Excellence. We thank two anonymous reviewers for their useful comments on a previous version of this article. Hillary Maxwell designed the figure used in this study, and her work is much appreciated.
1
Note that in McKenna and colleagues (2004), sensitivity and specificity were mistakenly reported as positive and negative predictive values. The sensitivity and specificity values presented are based on Table 5 from McKenna et al. (see Weaver, Walter, & Bédard, 2014).
2
Values here are based on all test items; raw scores can range from 0 to 42 when the first 13 items are used as practice items.