
Abstract
This study investigates the relationship between tourism destination competitiveness and the competitiveness of international hotel firms using an integrated approach based on Porter (1990). A mediation model is employed to link destination competitiveness, efficiency and firm competitiveness. Global technical efficiency, pure technical efficiency and scale efficiency are estimated through data envelopment analysis techniques. The results confirm a positive relationship between destination competitiveness and firm competitiveness, but efficiency does not play a mediating role linking both.
Keywords
Introduction
The theoretical relationship between destination and firm competitiveness was originally proposed by Porter (1990) who clearly established that there are no competitive territories, only competitive companies (or sectors, clusters) located within them. In this sense, and in relation to the endogenous or local development, territories conceived in this way constitute active agents facilitating the development and international success of the firms operating within them.
Efficiency (see Figure 1) plays a key role in this context as it is precisely the greater or lesser degree of efficiency with which the resources of the economy are exploited, that would determine the level of international success of the companies located therein (Porter, 1990).

Relationship among destination competitiveness, firm competitiveness and efficiency. Source: Authors, based on Porter (1990).
Operationalizing competitiveness as an input–output evaluation has recently been analysed by Knezevic-Cvelbar et al. (2016) following Porter’s new contributions in Porter et al. (2008) and Delgado et al. (2012). Within this context, there are a number of studies that link efficiency with competitiveness, also in terms of tourism.
Crouch (2006) applied this same idea to tourist destinations when distinguishing between competitive and comparative advantages in the following terms: competitive advantages are those that have been established as a result of effective use of the resources. In this case, the competitiveness of a tourism destination depends on how well a destination utilizes its available resources, that is, how well it creates added value.
Efficiency measures are used. Admittedly, destination competitiveness is a more complex notion, but we can use efficiency measures of resource-use productivity to relate business competitiveness with destination competitiveness. Also, the Happy Planet Index Report (2013) incorporates a country’s efficiency measures as one of its competitiveness criteria.
Many authors focus exclusively on analysing efficiency on the firm level, mainly the hotel sector (see, e.g. Barros, 2005, Barros and Santos, 2006; Johns et al., 1997; Morey and Dittman, 1995). The classic typology of these studies implies the establishment of the inputs and outputs, calculating the different efficiency measures and establishing a classification of firms in terms of the results obtained.
Other authors contemplating territories and firms and identifying efficiency with competitiveness estimate the efficiency of tourism destinations (see, e.g. Bossetti et al., 2006 or Cracolici et al., 2006) and establish the efficiency/competitiveness rankings of the destinations studied. Only a few authors have taken a step beyond this conventional approach of calculating efficiency measures and have attempted to relate efficiency to the determinants of destination competitiveness (see, e.g. Barros et al., 2011) or to the market orientation of the countries of origin of the tourists (see Zhang et al., 2016). However, these studies are the exception. To date, there are no studies that have tested the complete relationship proposed by Porter between destination competitiveness and firm competitiveness in tourism.
This study analyses, following Porter (1990), the relationship between destination competitiveness and firm competitiveness for several international hotel chains. Specifically, our research questions are as follows: Does a relationship exist between destination competitiveness and the hotel firm competitiveness of that destination? Does efficiency play a mediating role between destination competitiveness and hotel firm competitiveness?
Additionally, this article demonstrates differences in efficiency between these chains that arise from a set of variables: level of internationalization, property structure, geographic growth strategy and specialization within a particular market segment (i.e. luxury, upscale, midscale or budget/economy) in contrast to multi-brand positioning. However, the most innovative feature of this study is that it analyses tourism competitiveness using an integrated perspective, connecting destination and firm competitiveness by efficiency in a unified framework.
The remainder of the article is structured as follows. The next section reviews the relevant literature in the field of tourism competitiveness and justifies the indicators selected for measuring competitiveness both on a macro and micro level. Furthermore, a brief review of some of the most relevant studies analysing efficiency in the hospitality sector is presented. The section “Methodology” explains the methodology used and lists the efficiency indicators considered for the analysis. Section “Efficiency analysis data” describes the data and estimates the levels of efficiency. Section “Empirical analysis: Results” presents the econometric analysis and results. Finally, the most relevant conclusions are discussed, together with the implications and limitations of this study.
Literature review
Definition and measures of tourism competitiveness
According to Porter (1990) principal economic goal of a nation is to produce a high and rising standard of living for its citizens. The ability to do so depends not only on the fuzzy notion of ‘competitiveness’ but also on the productivity with which a nation’s resources (labour and capital) are employed. Productivity is the value of the output produced by a unit of labour or capital. Productivity depends on both the quality and features of products and the efficiency with which they are produced. So to sustain a competitive advantage over time, firms must provide higher-quality products and services or producing more efficiently. This translates directly efficiency into productivity growth.
International competitiveness is a controversial concept which has generated a great deal of debate. Chudnovsky and Porta (1990) distinguished between those approaches focused on the firm which sometimes is extended to the country (Mathis et al., 1988; Michalet, 1981); others focused on the capacity of a national economy in international trade (Chesnai, 1981) and finally more complex approaches are defined not only in terms of international trade but also in terms of economic wellbeing of the citizens of a territory (Scott and Lodge, 1985).
While the concept is fairly easy to apply to the microeconomic or corporate level, the implementation of the concept on a macroeconomic or territorial scale is much more complex. Therefore, for some authors, the competitiveness of a national economy is synonymous with the competitiveness of its firms, for others, this relationship is not so clear and the interactions involved are much more complex (Chudnovsky and Porta, 1990).
Without a doubt, one of the strands in the debate which has been most discussed is based on the ideas of Porter (1990) and in accordance with the paradigms of structural (OCDE, 1992) and systemic (CEPAL, 1999) competitiveness. It considers that national competitiveness depends not so much on the resources of the territory but on the productivity and efficiency with which a nation’s resources are exploited. From this perspective, the structural characteristics of an economy must be considered as determining factors of the competitiveness of the firms operating within it.
In the case of tourism, competitiveness is a relative and multidimensional concept which can be associated to four different perspectives: comparative advantages or competitiveness through pricing, a strategic or direction perspective, a historical or socio-cultural perspective and the development of national competitiveness indicators (Spence and Hazard, 1998). Applied to the firm level, competitiveness can be defined as the ability of a firm to design, produce and/or market products superior to those offered by competitors, considering the price and non-price qualities (D’Cruz and Rugman, 1992). Applied to destinations, competitiveness seems to be linked to the capacity of a destination to provide goods and services that are superior in aspects valued by tourists to those offered by competitor destinations (Dwyer and Kim, 2003).
Based on Porter’s (1990) study, Marco et al. (2014) analyse territory impact on the performance of vacation hotels. However, from a spatial viewpoint, there is no optimal and universal model of competitiveness that can be applied to all destinations. Neither is there a generally accepted measure of competitiveness (Omerzel and Mihalic, 2008). D’Hauteserre (2000) defines the competitiveness of a tourism destination as its capacity to maintain its position (market share) or improve it over time. He establishes that one way to determine the success of a destination is to analyse its direct performance in the markets through a market share analysis. In any case, the use of market share as an indicator of destination competitiveness is not exempt from debate and authors such as Croes (2011) maintains that market share is an incomplete yardstick because it is not appropriate for all destinations (e.g. is not appropriate for most island destinations due to its relatively small share of the global/regional market).
Less controversy surrounds market shares as a measure of competitiveness at firm level. In fact, the most popular indicators of marketing effectiveness and competitive advantage are market share and profitability (Lall, 2001). However, for some authors, the use of this indicator is also based on a simplistic conception of competition, since in reality competition is played out over many time periods within evolving markets, and there is no guarantee that a high market share reflecting good past performance constitutes a reliable indicator of future advantages (Day and Wensley, 1988).
Nowadays, the travel and tourism competitiveness index (TTCI) (World Economic Forum-WEF, 2013) is considered an alternative measure of destination competitiveness to market share and other alternatives such as relative prices or gross domestic product per capita. The TTCI aims to measure the factors and policies that make it attractive to develop the travel and tourism sector in different countries. A main disadvantage of this index is the limited period of time for which data are available. Fortunately, this measure is available for the timeframe of our research.
Measuring efficiency in the hotel sector
The terms ‘technical efficiency’ and ‘productive efficiency’ refer to the most appropriate manner of using inputs (resources) with the existing production technology. The hotel sector’s heterogeneity and the difficulty in determining the essential inputs and outputs of the production and the optimum quantity of resources required per unit of output. The solution lies in calculating the relative efficiency by estimating the behaviour of a sample up to its statistical frontier or the efficiency isoquant. Reviews of the literature on frontier models include Lovell (1993) and Coelli et al. (2005). In this article, global technical efficiency (GTE), pure technical efficiency (PTE) and scale efficiency (SE) computed through data envelopment analysis (DEA) are used to measure the efficiency of the selected hotel chains.
Within the tourism sector, the restaurant industry was the first activity studied (Banker and Morey, 1986; Hruschka, 1986). These initial studies employed various productivity ratios to measure performance (Banker and Riley, 1994; Wijeysinghe, 1993). The use of parametric estimation in this technique creates a distinction between two types of frontier models: Data Envelopment Analysis model (Assaf et al., 2010; Anderson et al., 2000; Barros and Dieke, 2008; Brown and Ragsdale, 2002; Morey and Dittman, 1995) and the Econometric Frontier model (Anderson et al., 1999; Barros, 2004; Chen, 2007; Hu et al., 2010).
The review of the existing literature (see Table 1) shows that at least 31 different inputs and 19 different outputs, consisting of measures of both physical and monetary or financial quantities, are used to represent the production process in the hotel sector (see Table 2). In this study, three inputs (number of employees, salary cost, and number of rooms) and two outputs (total revenue and RevPar) are used to calculate efficiency.
Main contributions from the literature review.

Note: CRS: constant return to scale.
Source: Authors own elaboration.
Inputs and outputs employed in main efficiency studies.

Note: ADR: average daily rate.
Source: Authors own elaboration.
According to the literature: (a) the positive effects of belonging to a hotel chain or large business group (Assaf et al., 2010; Chen, 2007; Hwang and Chang, 2003; Tsaur, 2001); (b) the lack of a conclusive relationship with the size of the business despite being a source of significant economies of scale (Barros, 2005; Chen, 2007; Tsaur, 2001) and (c) the existence of ambiguous relationships with the various indicators of business results (Morey and Dittman, 1995; Neves and Lorenço, 2009; Wöber, 2000). The majority of the previously mentioned research has exclusively studied technical efficiency, considerably limiting the conclusions obtained. The lack of information about the costs of the different factors prevents a clear understanding of whether most of the losses in efficiency are assignative.
In economics, the term ‘technical’ or ‘productive efficiency’ is broadly used and has several different meanings. This study focuses on one of these meanings: technical efficiency as a performance indicator for the hotel business sector. The first formal definition of this process is found in Koopmans (1951). Technical efficiency exists when a unit, whether productive or not, achieves the maximum possible output (here limited by the number of available rooms) given the inputs with which it is endowed or instead uses less inputs than necessary. The work of Forsund and Hjalmarsson (1979) adds SE as a determining element of productive efficiency, incorporating the possibility that a particular increase in inputs leads to an increase in existing production by a greater proportion.
To evaluate the degree of technical efficiency of a specific production unit, it is necessary to use a two-stage process. In the first stage, we must determine a standard reference function that indicates, given a fixed production technology, the maximum output level achievable when starting from the different input combinations. The type of frontier to be considered depends on the type of efficiency under analysis. If the objective is to study technical efficiency, the frontier will then be a function of production. In contrast, if the objective is to analyse economic efficiency, the frontier will then be a function of costs, income or benefits. Two methods have been traditionally proposed to estimate this frontier: methods that employ parametric elements (Charnes et al., 1978) and methods that do not (Afriat, 1972; Aigner et al., 1977).
The non-parametric methodology that is most accepted in the literature is that proposed by Charnes et al. (1978) – the CRS model, which is the same thing as DEA. DEA is a method of measuring efficiency that employs (fractional) linear programming techniques (Table 3).
Advantages and drawbacks of DEA and FSA.
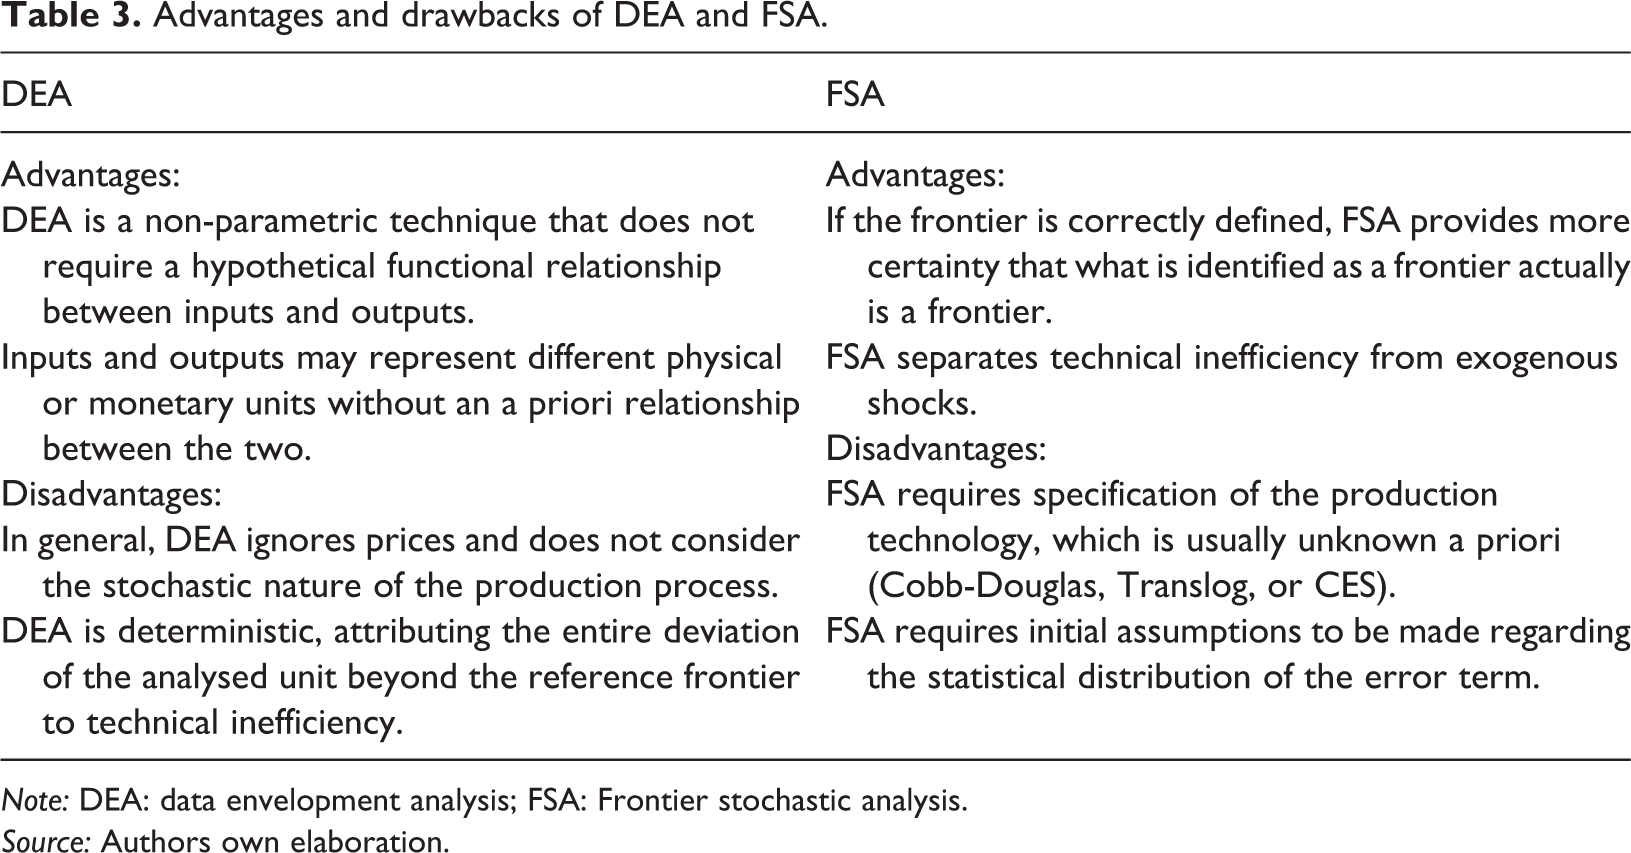
Note: DEA: data envelopment analysis; FSA: Frontier stochastic analysis.
Source: Authors own elaboration.
The purpose is to evaluate the relative efficiency. If the value of the prices or the weighting associated with the inputs and outputs is unknown, under an input orientation and assuming constant returns to scale, it is possible to obtain the level of technical efficiency. Banker et al. (1984) – who created the VRS model – expanded their previous analysis by considering variable returns to scale. This model mathematically differs from the previous model because it includes the variable, for which the sign is not restricted.
Methodology
In order to test the research question a two-stage methodology is used: (a) DEA of the selected hotel chains to determine efficiency and (b) mediation models with Baron and Kenny (1986) procedure and Solbel (1982) test to link destination competitiveness and hotel firms competitiveness through efficiency.
Mediation models were recognized in early psychology (Hyman, 1955; Lazarsfeld, 1955; Woddworth, 1928) and were generalized to social sciences by Baron and Kenny (1986), who clarified the steps to assess mediation (MacKinnon et al., 2012). In a tourism research context, causal models and mediation effects have been recently used for many purposes. Relationship among destination image, tourist satisfaction and destination loyalty (Geng-Quing and Qu, 2008), relations between tourism destination attractiveness and destination support services (Vengesayi, 2010), relationships among value, satisfaction and behavioural intentions (Williams and Soutar, 2009), relationships between perceived quality, visitor satisfaction and behavioural intentions (Žabkar et al., 2010) and repurchase intentions for packaged tour services (He and Song 2009) are examples of mediation applications using survey structural equation modelling (SEM).
The most frequently used method described by Baron and Kenny (1986) suffers from low statistical power in most situations (MacKinnon et al., 2012). Fortunately, recently resampling methods aid to resolve the non-normality issues related with these tests improving the power of significance testing (Preacher and Hayes, 2004).
As explained in the introduction and reflected in Figure 2, this article attempts to establish the relationship existing between the destination competitiveness (X), the efficiency of international hotel chains (M) and the competitiveness of these chains (Y). Thus, after exploring the existing correlations among the variables taken into account, indirect effects (a × b) are estimated using the Baron and Kenny (1986) approach and the Sobel (1982) test. The MBESS package (Kelley and Lai, 2012) for R programming language (R Core Team, 2013) is used for estimations. Due to sample size restrictions, bootstrap procedures are carried out to improve the accuracy of the results.
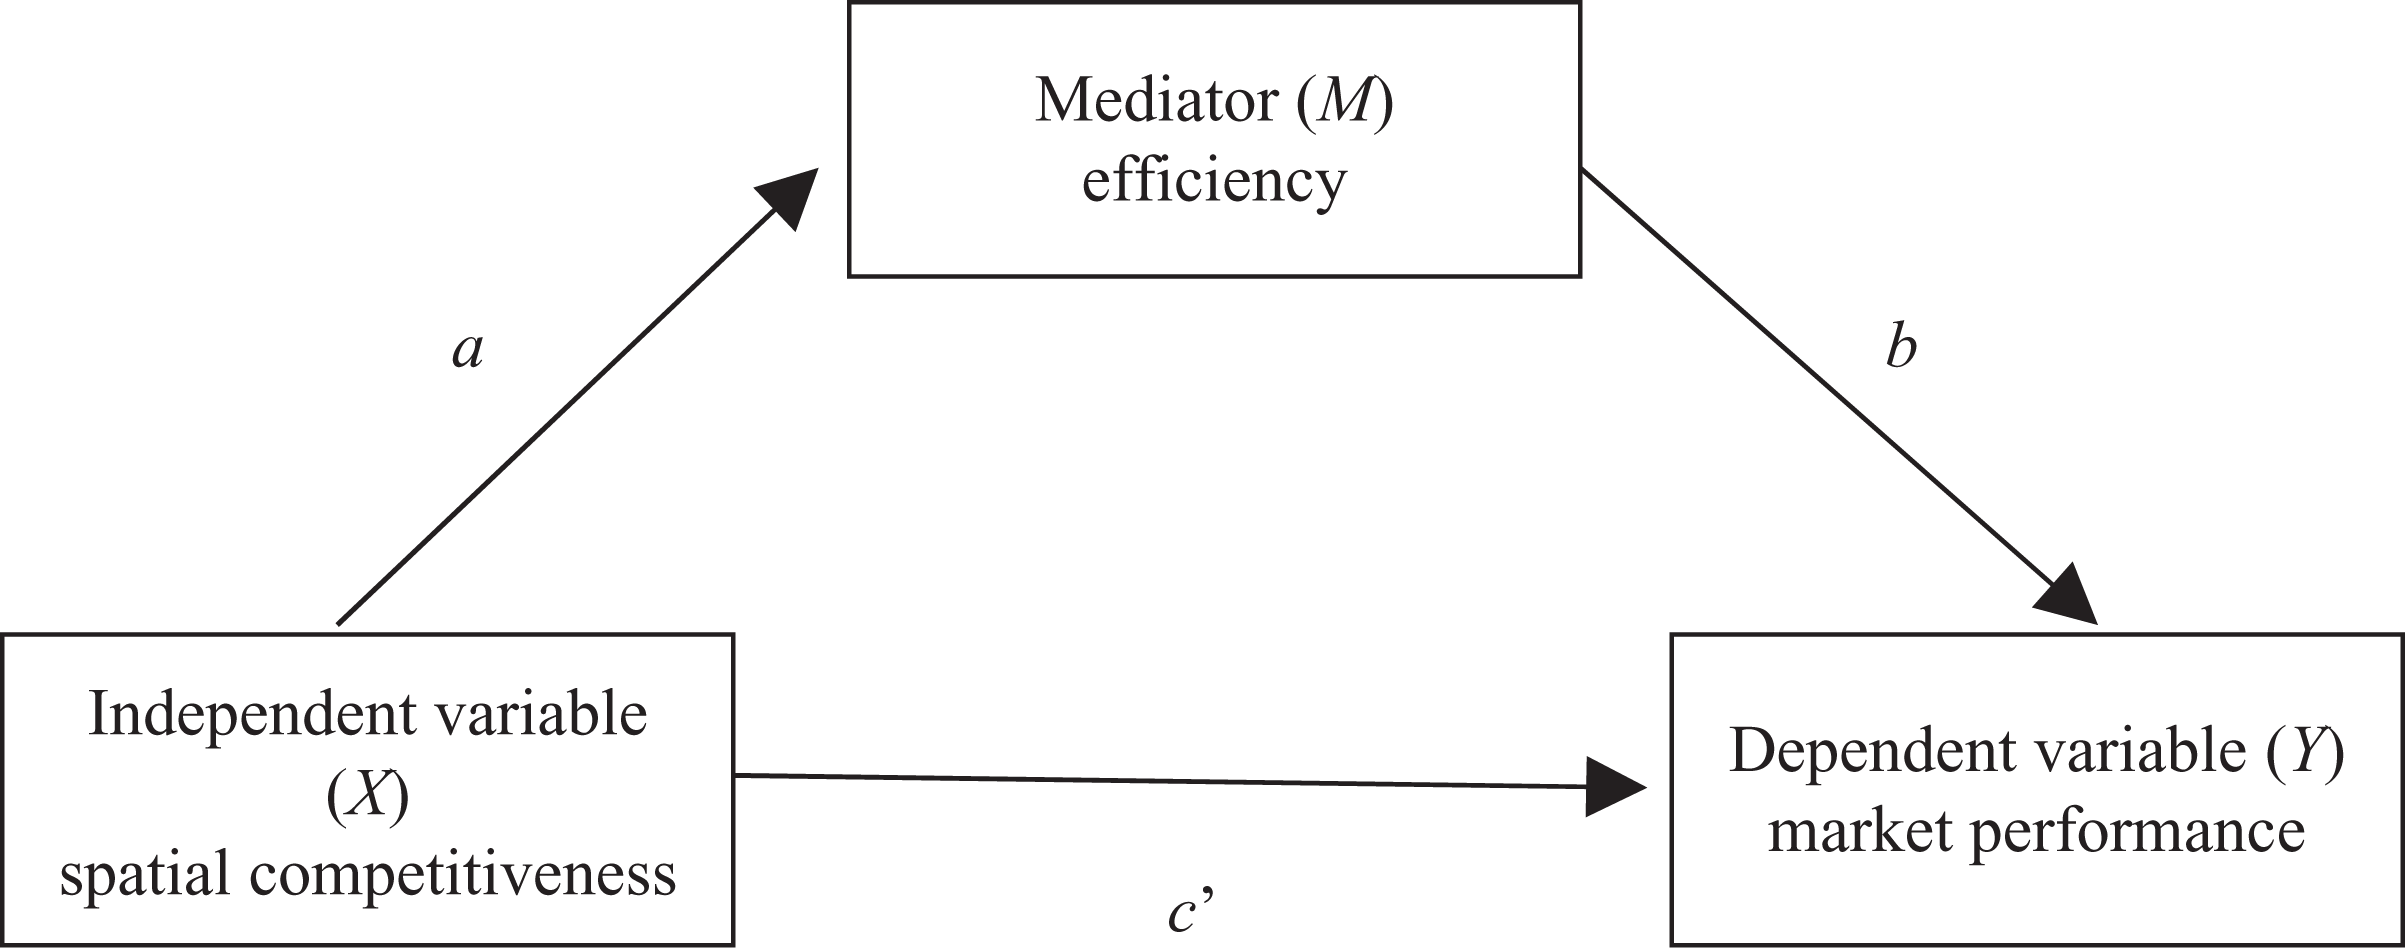
Single mediator model for international hotel chains. Source: Adapted from MacKinnon, Cheong and Pirlott (2012).
Table 4 shows the data and sources used in this article. Data used to determine the efficiency and to represent destination and firm competitiveness it is shown.
Variables used in our analysis relating destination, firm competitiveness and efficiency.

Source: Authors own elaboration.
Aware of the limitations already mentioned and considering the available data, in this article, we measure la international hotel chain competitiveness according to its market performance calculating world market share in terms of revenue. TTCI (World-Economic Forum-WEF, 2013) is considered a measure of destination competitiveness where hotel firms are based.
Our unit analysis consists of 15 hotel chains with a total of 29,453 hotels and 3,784,270 rooms. Seven of the hotel groups originate in Europe, the Middle East, and Africa (Rezidor Hotel Group, Accor Hotel Group, Meliá Hotels International, NH Hotels, IHG, and TUI Hotels & Resorts), seven are from the United States (Wyndham Hotels Worldwide, Hyatt Hotel Corporation, Choice Hotels International, Marriott Hotel International, Starwood Hotels and Resorts, and MGM Resorts) and three are from Asia (Home Inns, 7 Days Inn and Shangri La).
Of the top 20 hotels worldwide, we excluded three chains for one of two reasons: (a) lack of reliable statistical data (Hilton Hotels and Jin Jiang Hotels) or (b) a business model that we could not consider to be a strict hotel chain (Best Western Hotels).
Efficiency analysis data
The statistical data for the micro-level analysis were derived from the annual reports of the studied hotel chains for the year 2010. Figure 3 reflect the size differences between the principal global hotel chains. The relationship between the number of hotels and their average size indicates the existence of a dual structure. With respect to the number of hotels, the Wyndham (6074 hotels) and the Choice (7114 hotels) hotel groups are noteworthy. As a result of the growth formula used, these groups have the least number of rooms per establishment, with 84 and 80 rooms, respectively.
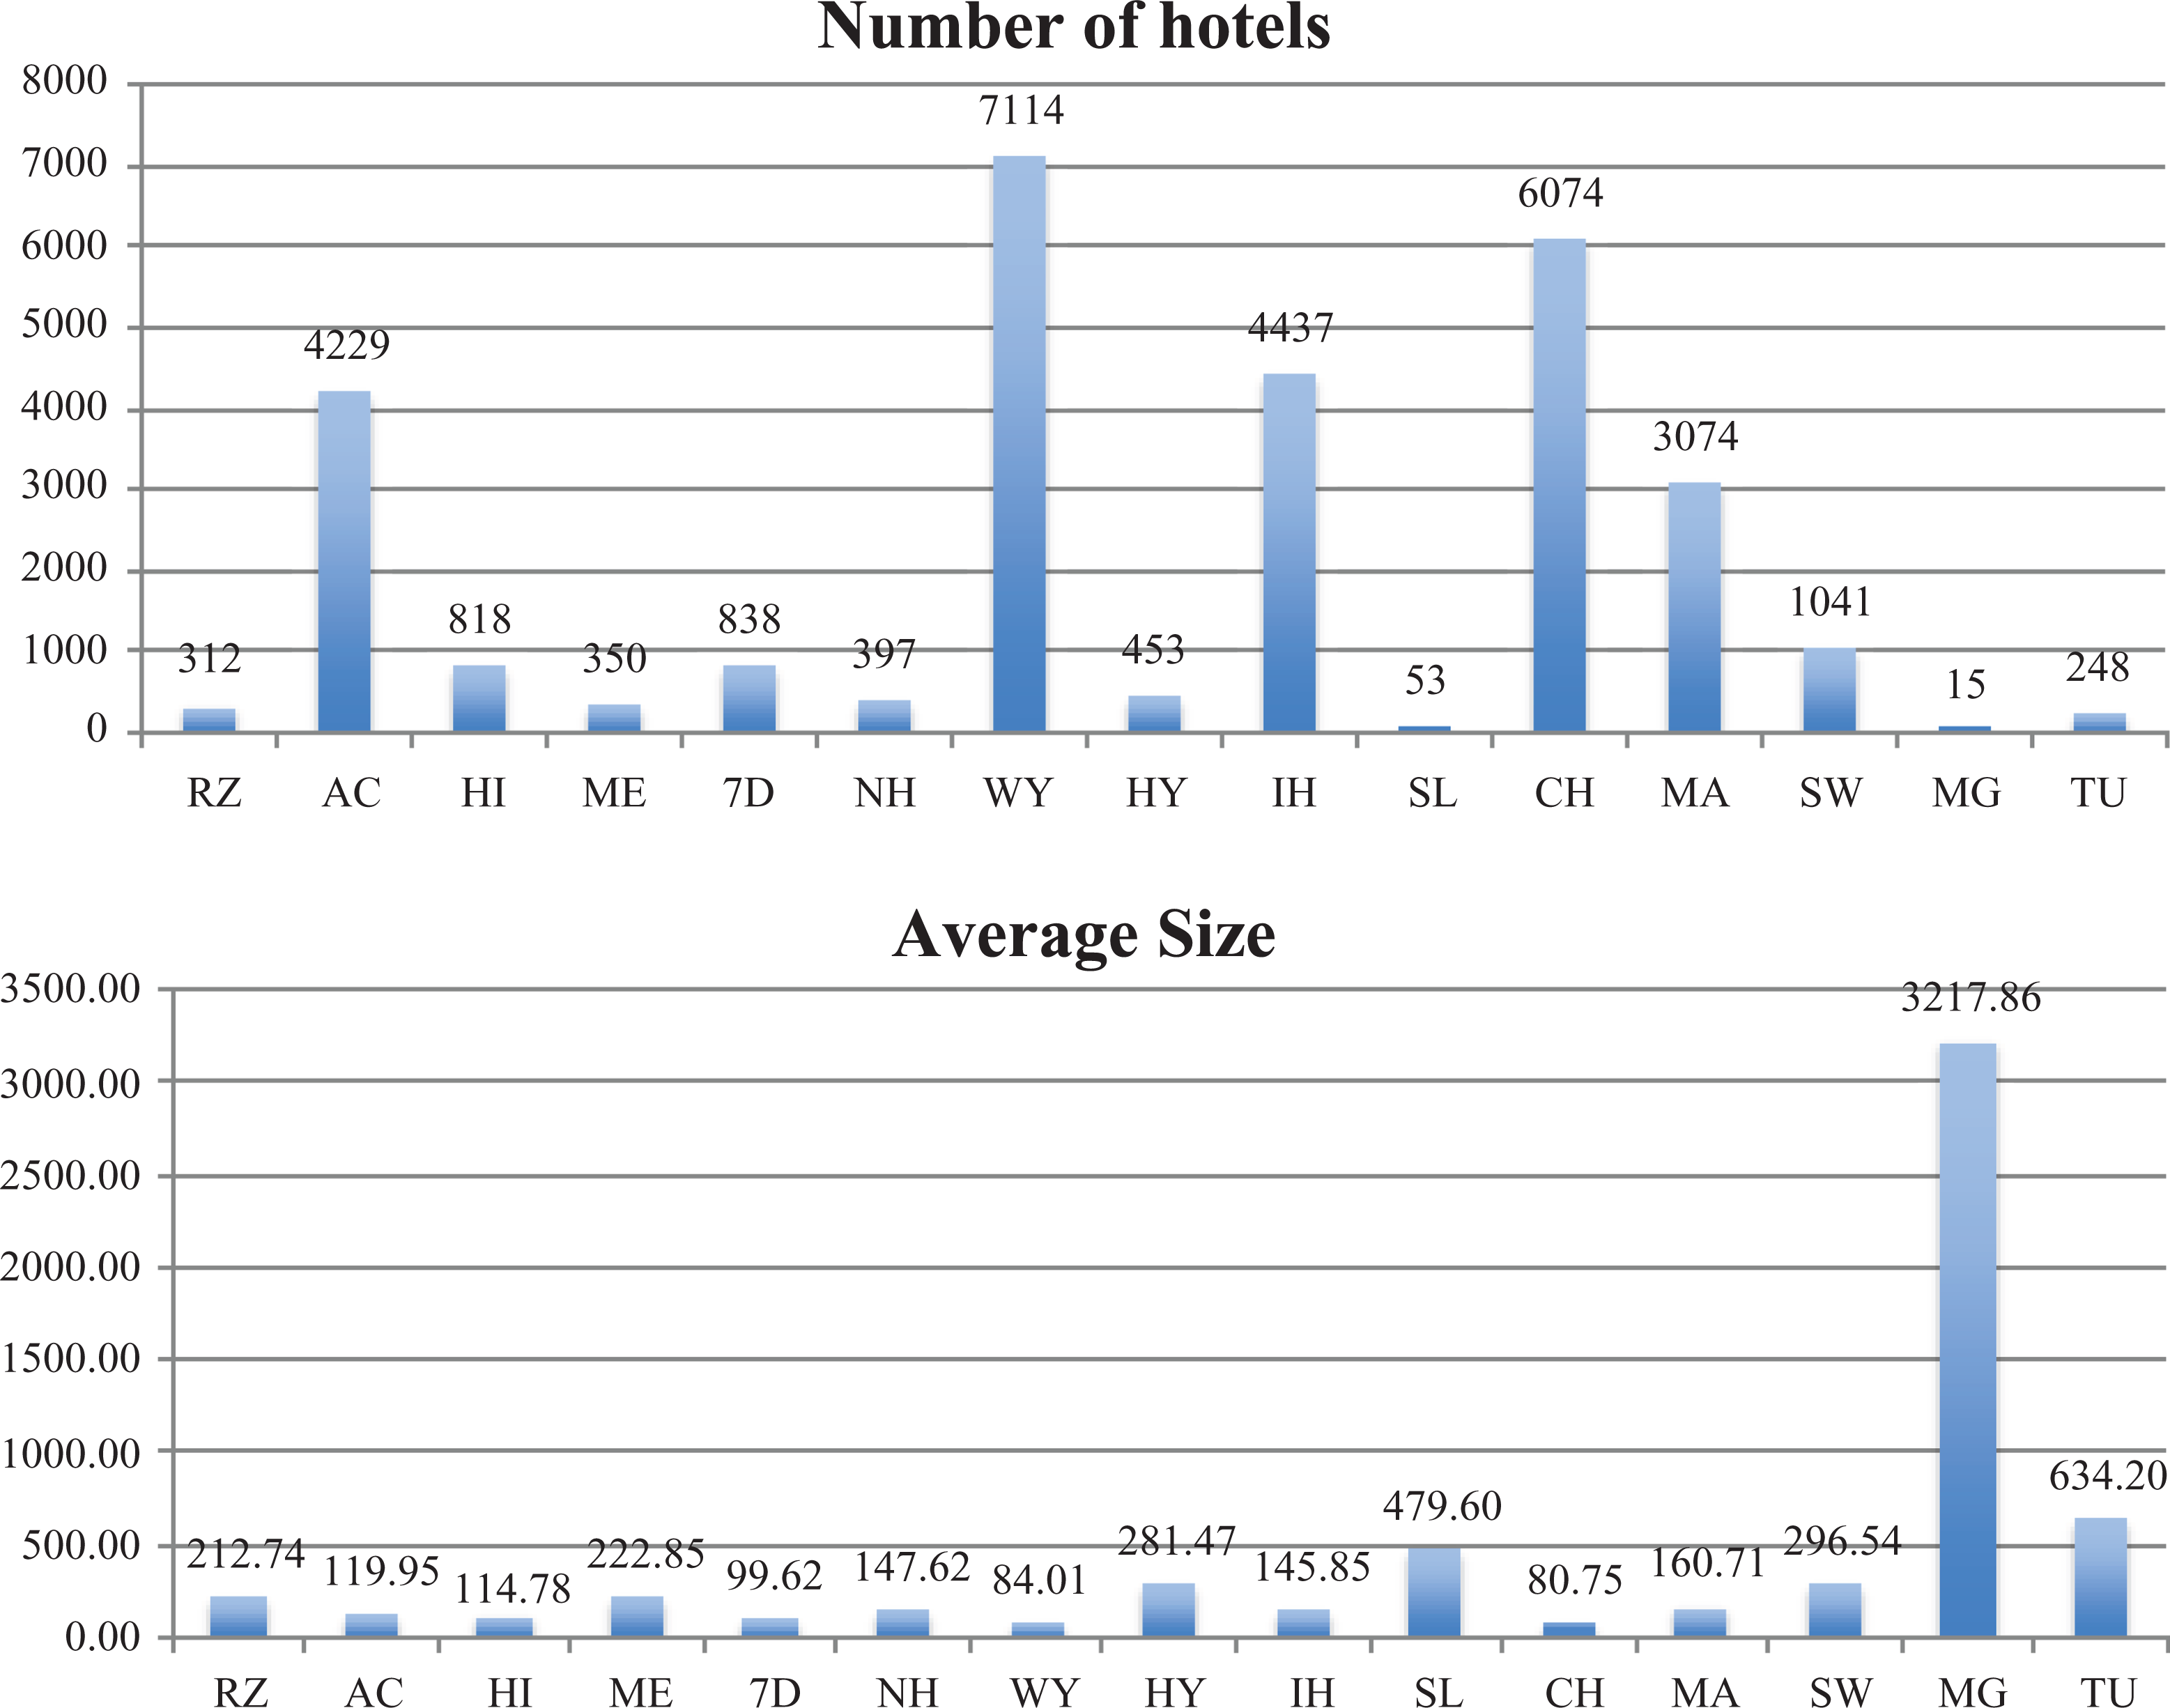
Number of hotels (top) and average sizes in terms of number of rooms (bottom) of the principal international hotel chains. Source: Annual reports, compiled by the authors.
Although these hotels lead the worldwide hotel industry, variability associated with five determining aspects of the future structure of the sector it is found: (a) average size (717 hotels on average per hotel chain, with 156,906 rooms and an average of 218 rooms per hotel); (b) degree of internationalization (with an average presence in 22 countries); (c) market positioning via multi-branding strategies (Figure 4, with an average presence in two different segments of the market); (d) RevPar (€53.63 on average) and the average annual occupancy rate (67.72%) and (e) property structure (41.32% traditional investment vs. 58.68% administration/management contracts or franchising).

Multi-branding strategies for the studied international hotel chains. Source: Annual reports, compiled by the authors.
It is precisely the development of more flexible expansion formulae (Figure 5), together with the differences in efficiency levels, the free entry and exit of companies and technological advances that will determine the future of this sector. The quest for greater levels of efficiency is therefore a determining element of the competitive capacity and thus the growth of the different corporate groups.
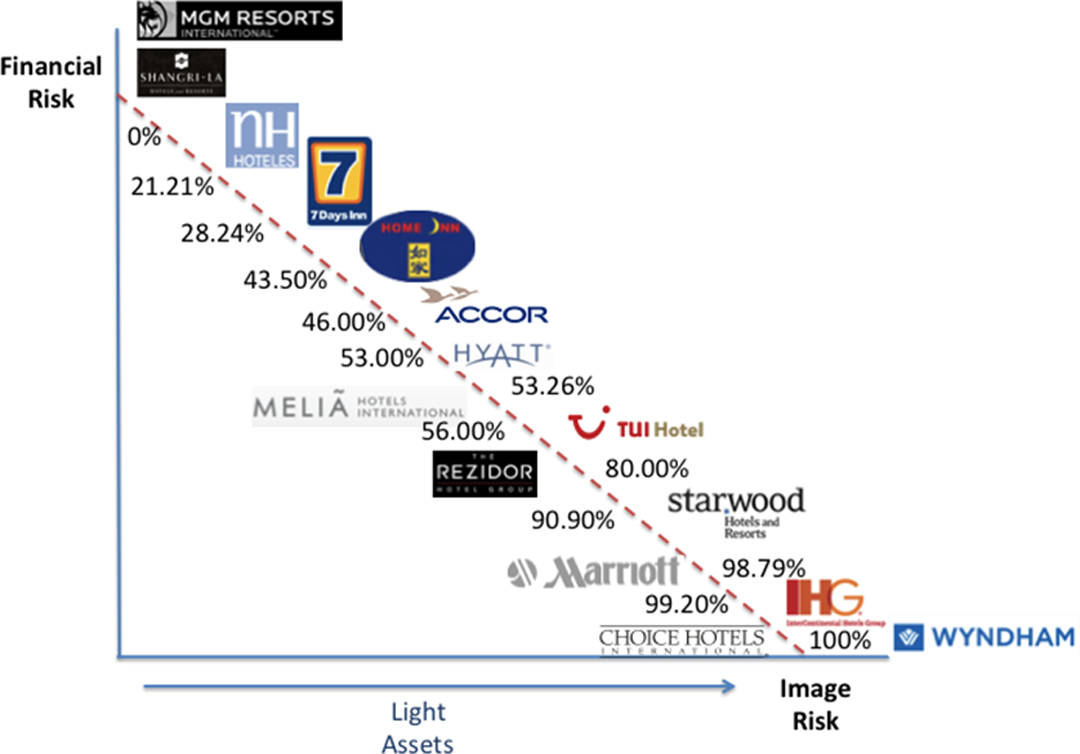
Property structures of the studied international hotel chains. Source: Annual reports, compiled by the authors.
The DEA model requires data from both the inputs and outputs to be used as determining factors in the production process. Table 5 reflects the descriptive statistics of the variables used in our analysis. We define a production model characterized by three inputs (number of employees, salary cost and number of rooms) and two outputs (total revenue and RevPar) to determine the boundaries of the efficiency envelope.
Descriptive statistics for the variables employed in the DEA model (year 2010).

Note: DEA: data envelopment analysis.
Source: Authors own elaboration.
Destination competitiveness data
As Table 4 reflects, to determine destination competitiveness of the international hotel companies’ country of origin, the TTCI derived from the World Economic Forum report is used. These six countries are France (Accor), United States (Wyndham, Hyatt, Choice, Marriott, Starwood and MGM), Spain (Meliá and NH), China (7 days, Home Inns and Sangri- La), Germany (TUI) and United Kingdom (Intercontinental).
As shown in Figure 6, all selected countries (except China) have similar levels of competitiveness and all of them belong to the top world competitiveness ranking. Germany ranks second in a classification of 139 countries. France ranks third, United States sixth, United Kingdom seventh and Spain eighth. Only China is slightly different in 39th position, near of the upper quantile of the ranking. Although this clear association existing between macro competitiveness and micro competitiveness reinforces our hypothesis (destination competitiveness is crucial to business hotel success), the low variability of the sample (with mean 5.21 in a 1–7 scale and standard deviation of 0.37) represents a serious drawback for getting significant effects in econometric estimations.
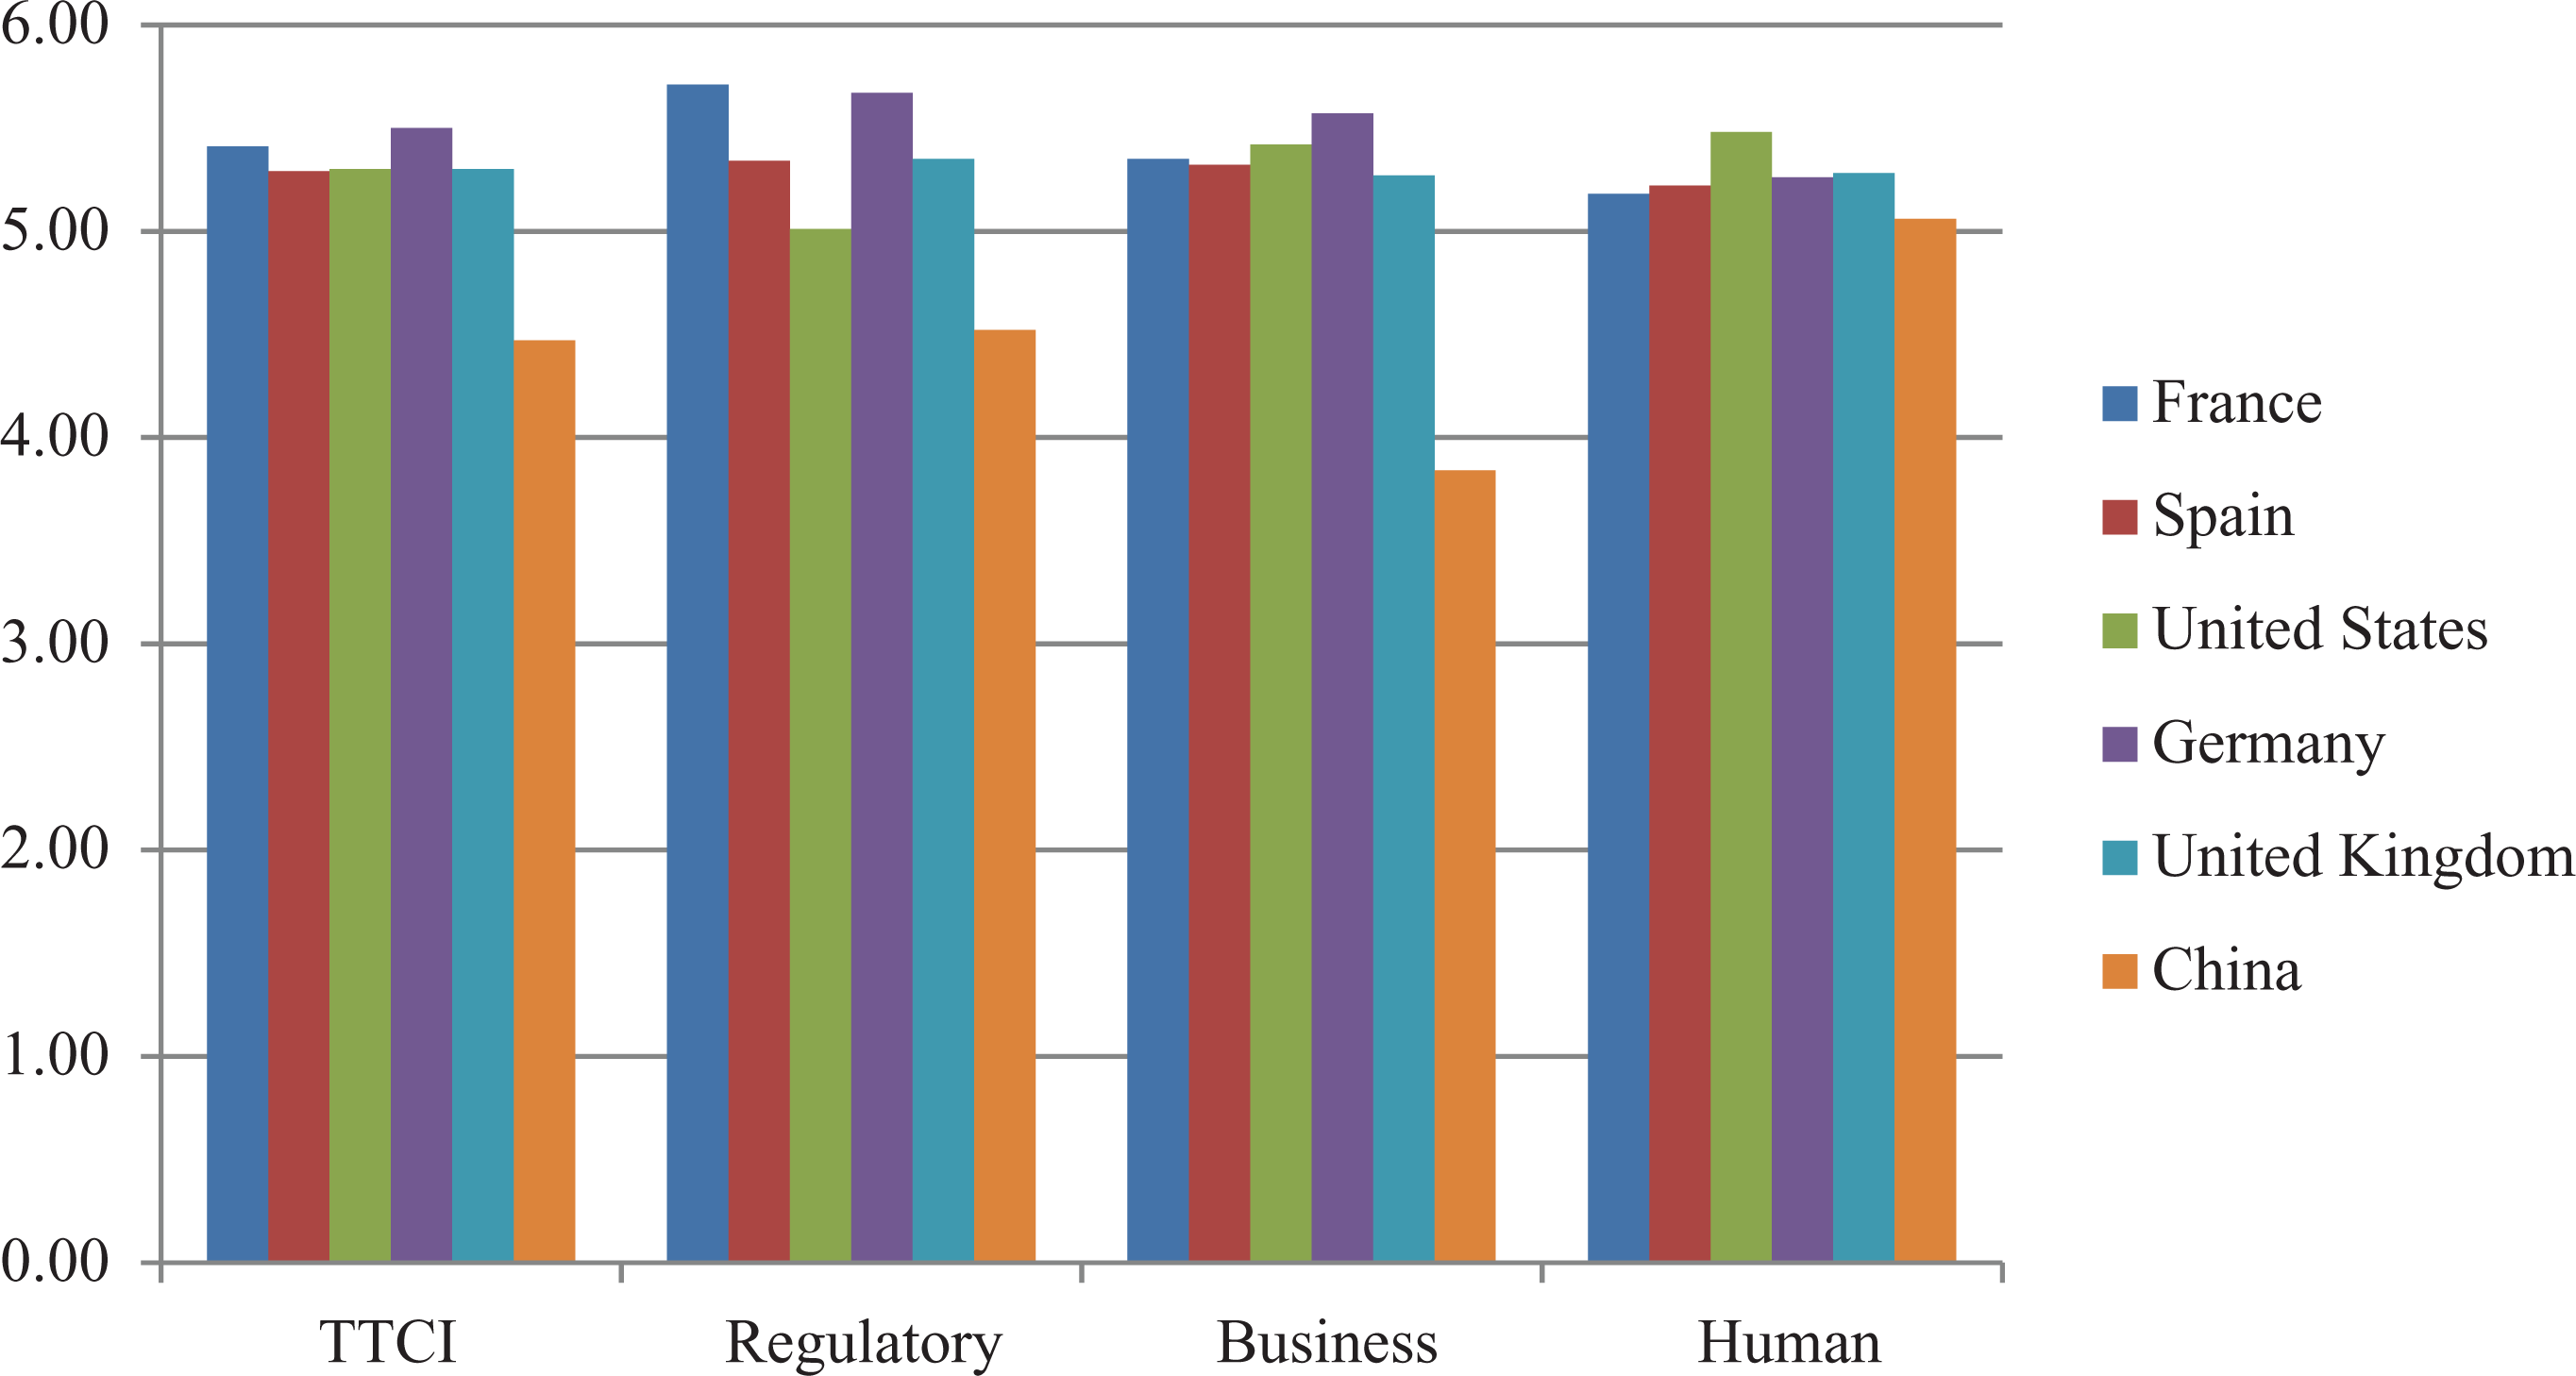
Overall tourism and travel competitiveness index and its sub-indexes. Source: World Economic Forum (2011).
Firm competitiveness data
With regard to firm competitiveness, we use two measures. First, a classic indicator such as the global market share in terms of revenue. Second, trying to reflect a broader sense of firm competitiveness, we build a composite indicator based on occupancy rates, the number of countries in which the chains have a presence, the revenue per room and the global revenue. This composite indicator is constructed as usual (normalizing the variables on a 0–1 scale with the formula (V i − V min/V max − V min) and aggregating them in an unweighted sum on a scale ranging from 0 to 4.
Figure 7 shows the market performance in terms of revenue market share. We can see that Marriot, Accor, MGM and Starwood are the most successful chains, representing 65.40 within sample share. These high revenues are associated with the large size of these chains.
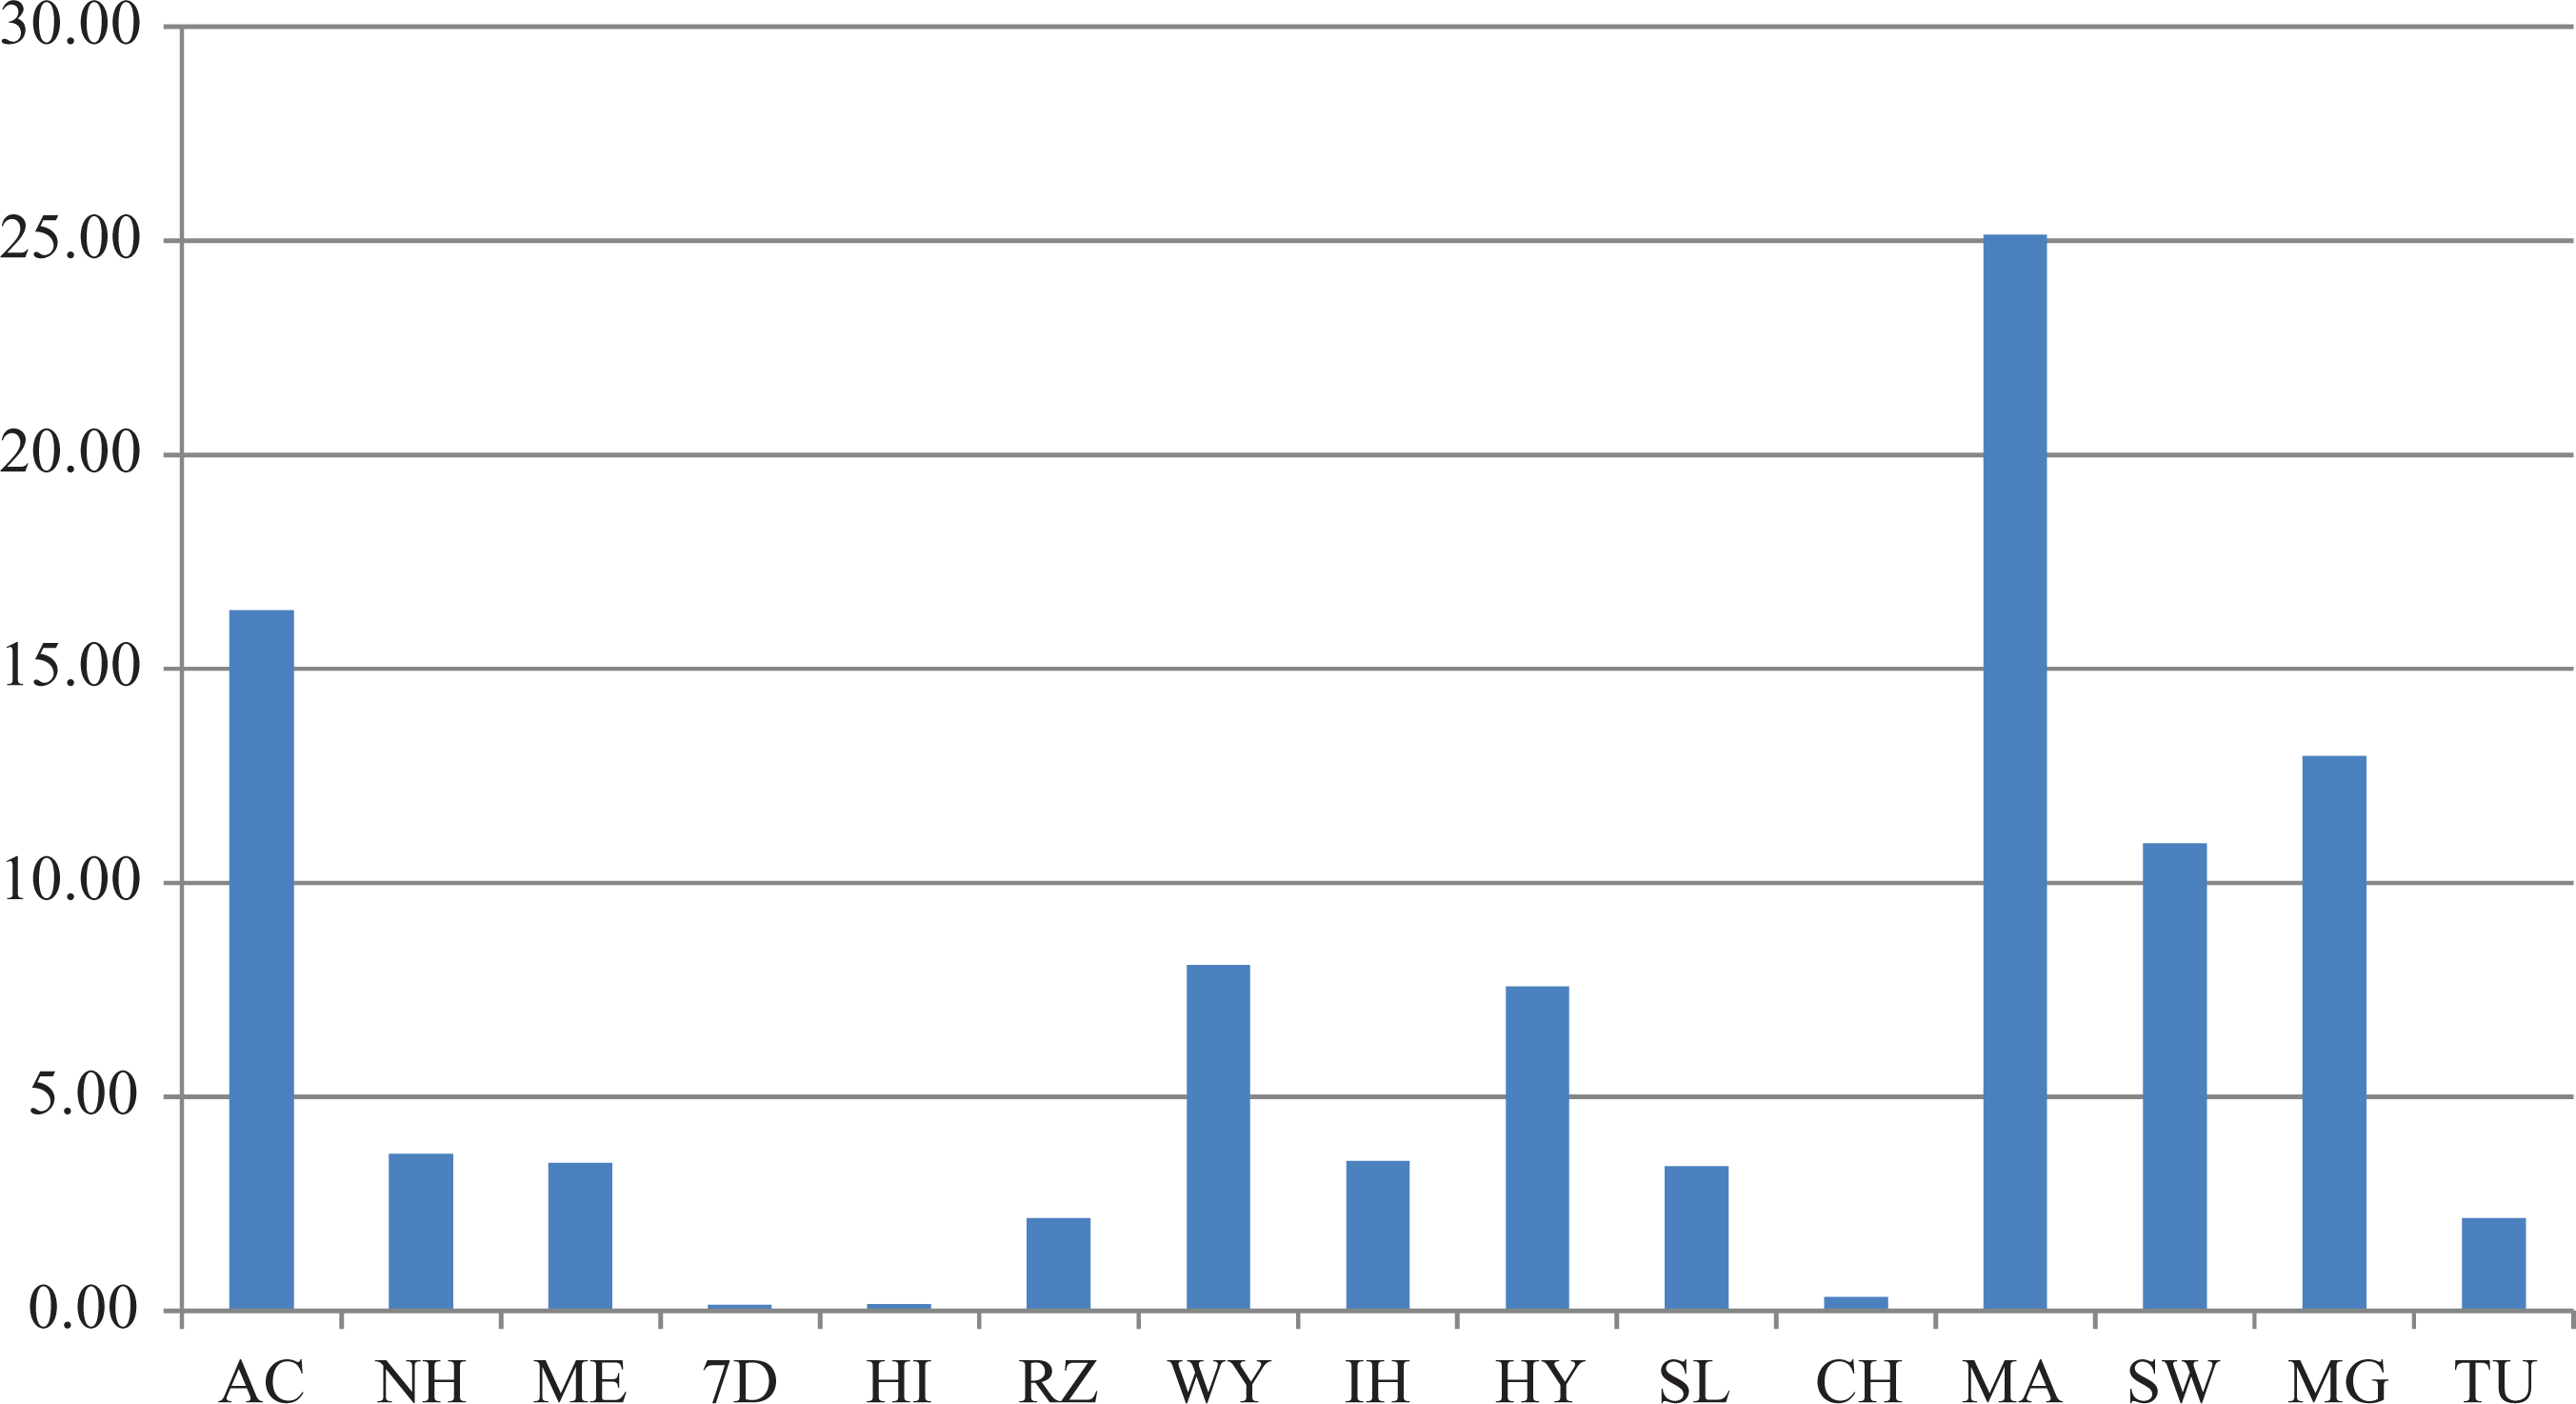
Market performance of selected international hotel chains. Source: Authors own elaboration.
Figure 8 shows the market performance of each chain in terms of the composite indicator. With this broader conception of business success, we can observe that Marriott continues at the top of the ranking, but now Starwood outperforms Accor and MGM. These changes seem to be associated with the customer orientation of the chain.

Firm competitiveness of selected international hotel chains, composite indicator. Source: Authors own elaboration.
To achieve consistency with the efficiency indicators calculated, in the results section, we will rescale the destination competitiveness and firm competitiveness indicators with a 1–100 scale using direct proportionality with the formula Vi × 100/V max.
Empirical analysis: Results
Data envelopment analysis
We used the DEA technique, the CRS model (Charnes et al., 1978) and the VRS model (Banker et al., 1984) to calculate the GTE, PTE and SE levels of the principal international hotels. Table 6 and Figure 9 summarise the indices so obtained.
Estimated efficiency indices, CRS model (DEA).
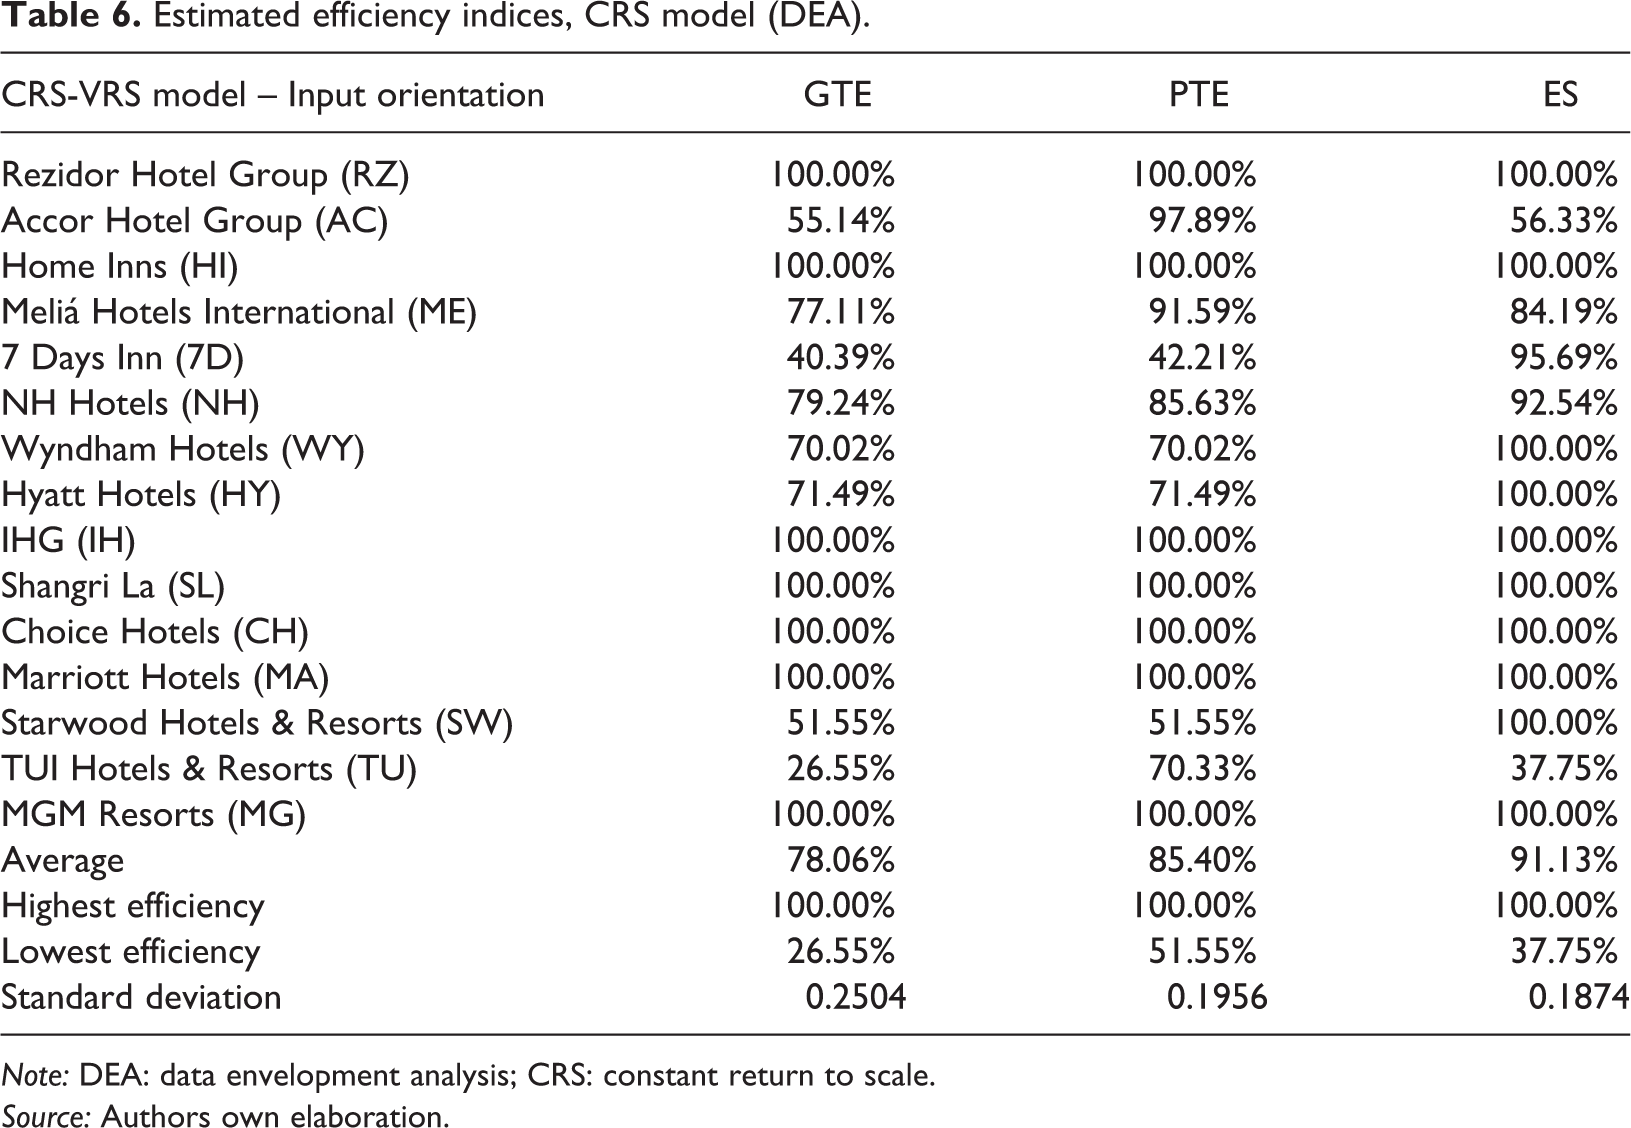
Note: DEA: data envelopment analysis; CRS: constant return to scale.
Source: Authors own elaboration.

The efficiency isoquant of international hotel chains. Source: Annual reports, compiled by the authors.
On average, the GTE is 78.06%. According to the work of Anderson et al. (2000), this level is acceptable and a clear indicator that the hotel sector is a highly competitive industry. Following the work of Farrell (1957) and using an input approach, we can observe from this result that it is possible to obtain an identical output by reducing all of the inputs used by 21.94%. The two chains in which the lowest levels of GTE are observed are TUI Hotels & Resorts (GTE = 26.55%) and 7 Days Inn (GTE = 40.39%). Compared with the results of other studies (Andersson et al. 2000; Assaf et al., 2010; Wang et al., 2006), these results help to better understand the competitive capacity of chains as different as the Rezidor Hotel Group, IHG, Choice Hotels, Marriott Hotels, MGM Resorts, Home Inns and Shangri La.
The scaled efficiency levels achieved, on average (SE = 91.13%) approach the size that Coelli et al. (2005) consider to be an efficient production scale (TOPS). The PTE indices demonstrate the pure technical nature of the levels of efficiency achieved. Here, we include aspects connected to management practices (management and board quality), the best use of the resources employed in the production process, better organisation of human and material resources, better employee qualifications and better adaptation of person-position or the design of adequate commercial policies, among others.
It is interesting to relate these results to a group of variables that can help us to characterize and segment the industry as a whole. First, we confirmed the existence of a high level of variability in average size. Whereas there are 3218 rooms per hotel in the MGM Resorts group, there are 84 rooms in Choice Hotels on average. The highest levels of GTE are found in the average size interval (between 121 and 240 rooms) at a rate of 91.27% (PTE = 95.44%, ES = 95.35%). Meliá Hotels International (223 rooms/hotel), Marriott Hotels (161 rooms/hotel), IHG (146 rooms/hotel), Rezidor Hotel Group (213 rooms/hotel) and NH Hotels (148 rooms/hotel) belong to this group. It would therefore seem that a dual structure in the group of large hotel chains exists rather than an optimum size structure, as indicated before. As Shy (1995) indicates, each market is to some degree structurally unique.
Additionally, except for the Days Inn, Home Inns and MGM Resorts hotels, there is a high level of internationalization in the sample studied. One of the groups stands out from the others in this regard given its presence in more than 60 countries: Starwood Hotels (100 countries), Accor (90 countries), Marriott Hotels (70 countries), Wyndham Hotels (65 countries), IHG (60 countries) and Rezidor Hotel Group (62 countries). The GTE indexes obtained for this group (GTE = 81.16%) are higher than those estimated for the groups with a low international presence (GTE = 74.36%). This international growth, as illustrated in Figure 4, has been supported by much more flexible expansion formulas (involving management and franchise contracts) and on investments that require a greater level of financial risk. Except in the TUI Hotels & Resorts group, we found a greater level of GTE in those chains with strategies emphasizing the exploitation of assets (GTE = 83.77% vs. GTE = 79.12%) and in those that are located in two large geographic areas: America and the Caribbean (GTE = 84.72%) and Asia-Pacific (GTE = 80.13%). The inefficiency in this group is essentially due to greater difficulty implementing integrated management systems throughout the chain as a whole (PTE = 85.58%; ES = 98.02%) as a result of the group’s lesser financial impact.
Finally, there is a positive correlation between the level of specialization of the brand in a specific segment of the market and the GTE levels. Therefore, multi-branding positioning (GTE = 75.54%) may be associated with better results (GTE = 88.10%) in those corporate groups that have had more success in a specific segment of the market (luxury, upscale, midscale or budget/economy). The example used here is that of the Shangri-La chain (100% Luxury), 7 Days Inn (100% Budget/Economy), Starwood Hotels & Resort (100% Upscale and Luxury) or NH Hotels (100% midscale and upscale) compared with groups such as Accor (6.43% luxury, 4.26% upscale, 30.79% midscale and 58.52% budget/economy), TUI Hotels & Resorts (74.05% upscale, 16.41% midscale and 9.54% budget/economy) or Meliá Hotels International (8.53% luxury, 32.42% upscale and 54.61% midscale).
Mediation model
The exploratory analysis shows that the proposed variables do not fit a normal distribution. This is a problem because normality is required for correlation analysis. Normality is strongly violated in the TTCI and in all sub-indices (regulatory, business and human) of these measures, where China appears as an outlier. With respect to efficiency measures, normality is violated in the ES index. GTE and PTE exhibit a more normal distribution but are negatively skewed. Finally, the most normal distribution is observed in market performance measures, especially in the composite indicator (CI), as market shares (MS) is positively skewed. As explained earlier, most of these problems are derived for the small sample size (only 15 observations) and the low variability of some indicators (six observations corresponding to the same country, United States). To reduce the non-normality issues and to obtain robust estimations, bootstrap procedures are carried out.
A sample correlations matrix (not-bootstrapped) shows a significant relationship between variables measuring the same construct (i.e. within group). Thus, all spatial competitiveness measures are self-correlated, and the same occurs between market performance and efficiency measures. Only the PTE-ES pair has a low correlation. However, none of the correlations between groups is significant. Specifically, there is a positive relationship between the spatial competitiveness and the chains’ market performance (0.39 with MS and 0.31 with the CI) and a negative relationship between the spatial competitiveness and the efficiency measures (−0.14 with GTE, 0.10 with PTE and −0.35 with the ES). Meanwhile, a strange association between efficiency and market share exists: GTE and PTE show positive correlations with MS and negative correlations with the CI but ES shows the reverse pattern; a positive relationship with the CI and a negative one with market share. As previously explained, none of the explained correlations are significant (the lowest p value is 0.15 for the pair TTCI-MS), but none of these correlations are reliable given that normality is strongly violated by most variables.
Table 7 shows bootstrap confident intervals for correlations based on 999 replications at a 95% level. We can see that the only significant correlation is the positive one existing between spatial competitiveness and market performance measured as market share (TTCI-MS). All other calculated correlations are not significant, given that zero always belongs to intervals. The bootstrap distributions seem fairly normal for the pairs TTCI-CI and TTCI-MS, but normality is again violated for the pairs TTCI-PTE and TTCI-GTE which seem to exhibit a bimodal distribution.
Bootstrap confidence intervals based on 999 replications.

Source: Authors own elaboration. Original sample N = 15. Level = 95%.
In summary, this preliminary analysis of the available data confirms a positive association between destination competitiveness and hotel competitiveness when market shares are used. Thus, in terms of mediation analysis, a direct effect exists. However, no significant relationship between competitiveness (neither on a territorial or a firm level) and efficiency is appreciated.
According to our methodology, the next step would be to calculate the indirect effects and to test for mediation when efficiency measures are included in the relation between destination competitiveness and hotel market performance. However, we should be sceptical about obtaining a positive result, given the lack of a relationship between competitiveness and efficiency and between efficiency and market performance (the indirect effect). In any case, the existence of a direct relationship between territorial competitiveness and market performance encourages us to explore for mediation.
Table 8 shows Sobel’s tests and the bootstrap indirect effects for different proposed models. As anticipated, with the available data, no mediation relationships are observed among the variables. Sobel’s test statistics (z) is always lower than its critical value of 1.96, and zero always corresponds to bootstrap intervals. Therefore, for this sample, efficiency measures based on DEA are more like covariates than mediators are.
Mediation models and estimated indirect effects.
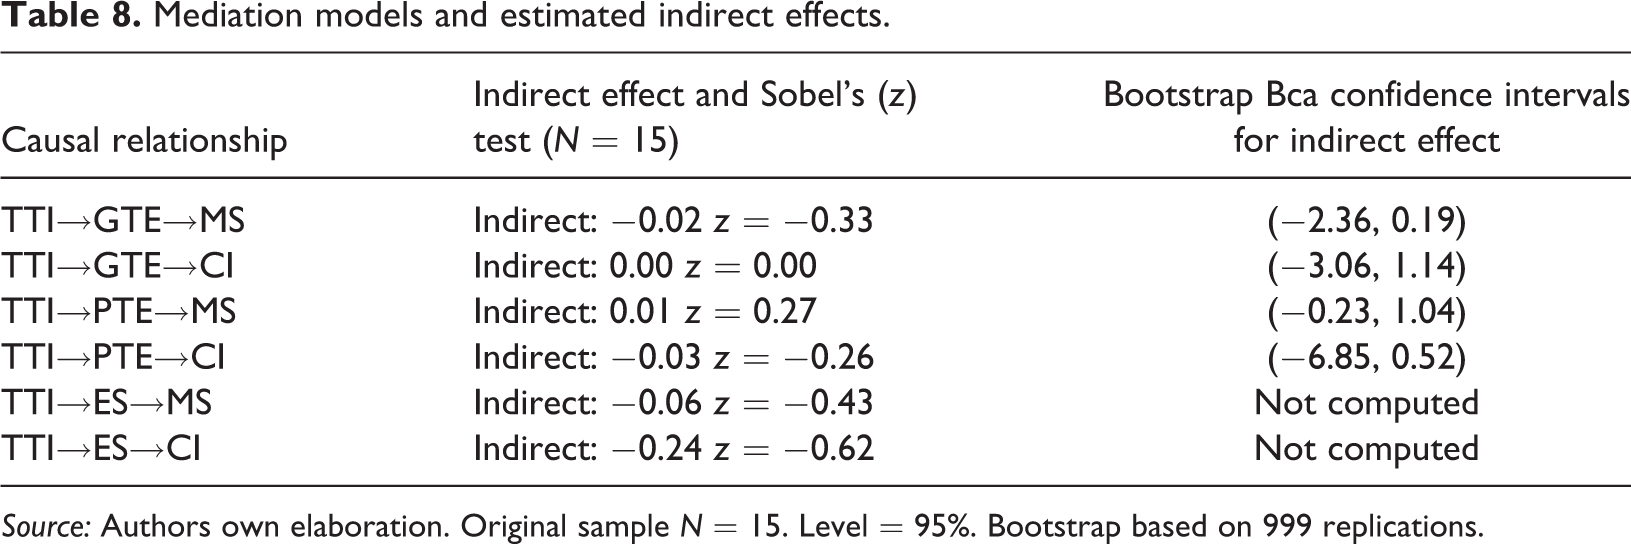
Source: Authors own elaboration. Original sample N = 15. Level = 95%. Bootstrap based on 999 replications.
Conclusion
The competitiveness of the economy plays a key role in the international success of firms located within it. This study seeks to confirm this relationship for a selection of fifteen international hotel firms and their countries of origin. An innovative feature is the incorporation of technical-economic efficiency as a mediator variable in the causal link.
The link between destination competitiveness (measured by the TTCI) and the success of the hotel chains (measured in terms of their market share or a synthetic indicator created for this purpose) is directly confirmed by verifying that the principal international chains are based in countries which are at the top of the tourism competitiveness ranking, in accordance with the theory. However, this fact generates very little variability in the sample, which, together with its small size prevents us from obtaining significant effects in the econometric estimates.
Specifically, the empirical analysis confirms a significant positive correlation between the TTCI and the revenues market share, which constitutes the direct effect of the mediation analysis. This can be principally explained by the presence of China and its hotels in the sample. However, when technical-economic efficiency measures calculated through DEA are incorporated, no mediating effect of this variable can be observed. Therefore, with the available data, we can say that efficiency acts more as a covariate than a mediator.
We evaluated GTE as an efficiency indicator for the principal international hotel chains. The analysis of this indicator demonstrates the difficulty of understanding the structure of this sector in aggregate terms. The heterogeneity of both the sector as a whole and the various businesses within the sector demonstrates the need to consider an industrial economic perspective when studying the hotel sector. Additionally, we identified three factors with positive correlations with GTE levels: (a) a greater degree of internationalization; (b) growth based principally on light assets, centred on two large geographic areas, that is, America (the United States) and Asia Pacific; and (c) a greater level of specialization due to multi-branding strategies.
The result obtained in the empirical section is conditioned by the existing data that represent the main limitation of the analysis carried out. An increase in the size of the sample and its variability could be expected by incorporating hotel chains from other countries, either consolidated or emerging as a result of the strong process of globalization experienced by the hotel industry in recent years. To continue with this line of research, we suggest to study whether the presence of foreign direct investment in the hotel industry gives rise to an increase in the competitiveness of the destination of the investment, due to knowledge transfer. Accordingly, efficiency may explain the reverse direction of causality.
Nevertheless, our analysis enables us to confirm that the mechanism traditionally established by the economic literature whereby territorial competitiveness is transferred to firm competitiveness through efficiency is not so direct, at least in the analysed sample. This could be due to the specific characteristics of the hotel industry where other variables other than efficiency could contribute to explaining this link (fashion, location, cultural values, etc.).
However, the principal innovative feature incorporated into this study is the integrated approach to the phenomenon of competitiveness, analysing competitiveness at micro and macro level. It represents the first approach to a methodology which has yet to be empirically confirmed in the field of economic theory and tourism economy.
Footnotes
Declaration of conflicting interests
The author(s) declared no potential conflicts of interest with respect to the research, authorship, and/or publication of this article.
Funding
The author(s) received no financial support for the research, authorship, and/or publication of this article.