



Abstract
Kinematic accuracy reliability is an important performance index in the evaluation of mechanism quality. By using a 3-DOF 3-
Keywords
1. Introduction
The reliability analysis of the kinematic accuracy of parallel robot manipulators is important in the evaluation of mechanism performance. During motion, the elastic bar deformation, size error, and other factors cause the unfavourable transmission of the mechanism movement condition because of the influence of motion joint clearance. The terminal then deviates from the ideal track trajectory. Thus, guaranteeing a mechanism with good kinematic accuracy reliability has become a widespread concern among local and international scholars [1–2]. At present, reliability studies are confined to the fatigue life of manipulators. Analysis of the kinematic accuracy reliability of uncontrollable factors such as manufacture and installation errors, size errors, clearance errors, active joint errors, and elastic deformation errors are given less consideration. Szep considered machine tool error, assembly error, deformation, measurement and control error, motion error, and clearance error on the basis of the theoretical model. He also established the error model of the RPRPR medical manipulator and analysed the error sensitivity of the mechanism [3]. Ryu presented a volumetric error analysis and structural optimization method, and established three indexes to evaluate the global error performance. He also performed a reliability optimization analysis of the position and orientation error of the HexaSlide parallel manipulator [4]. Shi studied the analysis methods of kinematic accuracy reliability, established a general model to analyse the kinematic accuracy probability model, and proposed the random process and random variable method to analyse kinematic accuracy reliability [5]. Briot considered the effects of errors, conducted a detailed theoretical analysis of the 3T1R parallel manipulator, and established the maximum position and maximum orientation error model [6]. Luo established the dynamic error model of a 6-DOF parallel micromanipulator and studied the dynamic accuracy reliability of the mechanism by the Monte Carlo method [7]. Li studied the kinematic accuracy reliability of a 3-DOF 3-PRR parallel manipulator based on the PZT vibration control system. The results illustrate that the PZT control system can effectively improve reliability [8].
On the basis of the aforementioned works, the present paper focuses on analysis of the kinematic accuracy reliability of a 3-DOF parallel robot manipulator. This paper is organized as follows. Section one shows the architecture and coordinate system description of the parallel robot manipulator with three identical linkages. Section two presents the kinematic and error models. Section three addresses the error and reliability evaluation of the manipulator. Section four shows the error sensitivity performance and the reliability analysis by reference to specific numerical examples. Finally, Section five concludes the paper.
2. Architecture description and coordinate establishment of the 3-P UU parallel robot manipulator
The parallel robot manipulator consisted of a fixed base, a moving platform, and three legs with identical kinematic structures (Figure 1). Each leg connected the fixed base to the moving platform by a prismatic (P) joint, a universal (U) joint, and another U joint in sequence. Each U joint can be considered the combination of two intersecting revolute (R) joints. Furthermore, the P joint on the fixed base along the rail is driven by a lead screw linear actuator. The circumcircle radius of moving platform Δ A1A2A3 with equilateral triangular at U joints A1 A2, and A3 is ra. The fixed base Δ B1B2B3 is an equilateral triangle with a circumcircle radius of rb. The inclined angle is measured between the fixed base and sliding rail BiDi (i = 1, 2, 3). α is defined as the layout angle of the actuators. The sliders of P joints C1 C2, and C3 are restricted to moving along the sliding rails. In each kinematic chain, the sliders and constant length rods are connected with a U joint. Moreover, the first R joint axis is parallel to the last R joint axis and the intermediate joint axes are parallel to each other. The motion distance of the active joint can be expressed as si (i = 1, 2, 3), and the direction vector can be determined as

Schematic of the 3-
For the analysis, a fixed Cartesian coordinate system O - XYZ is assigned to the centre point O of the fixed base platform Δ B1B2B3. The X axis is parallel to O B1 the Z axis is perpendicular to the platform with an upward direction, and the Y axial direction is determined by the right-hand rule (Figure 1). A moving coordinate system p – xyz is established, with the point of origin p located in the geometric centre of the moving platform. The x axis and X axis are initially set parallel to each other, and then the x axis is directed along pA1. The z axis direction is upward, and the y axial direction is determined by the right-hand rule.
3. Error modelling of the 3-P UU parallel robot manipulator
Establishing the position and orientation error model of the moving platform terminal is necessary for analysis of the kinematic accuracy reliability of the parallel robot manipulator. The calculation method can be divided into three types: matrix method, vector method, and independent action principle of the error method. The matrix method is used in this paper. On the basis of inverse kinematics and by considering the product and differential calculation, the position error model was established by using the error transformation relation between the adjacent components. By combining the three branched chain equations, the position and orientation error of the moving platform was derived by using the numerical method. In this paper, error sources such as the joint clearance error, active joint error, elastic deformation error, and the manufacturing error are considered.
The position vectors of universal points Ai with respect to the moving coordinate system p – xyz can be expressed as follows (Figure 1):

namely,

Similarly, the position vectors with respect to the coordinate system O – XYZ can be written as follows:

i.e.,

The position and orientation of the moving platform in terms of the fixed coordinate system can be described by a position vector
To simplify, the leading superscript will be omitted when the coordinate system is the fixed base system, e.g.,
In general, the position vector of the moving platform with respect to the fixed coordinate system can be expressed as
The vector equation for the i limb can be established by using the closed vector method:

Vector Li can be expressed as follows:

where,

By rearranging and combining Equation (3) and Equation (4), we obtain the following:

Upon differentiation of Equation (6), the position and orientation error model of point p with respect to each limb is obtained as follows [11–12]:

where the properties of si · δ
Multiplying both sides of Equation (7) by the unit vector
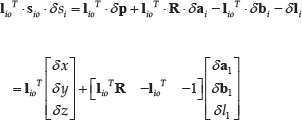
By synthesizing the three active chains, the following equation is obtained:

where,

Simultaneously, the above Equation (9) can be also simplified as follows:


Equation (11) can be simplified as follows:

where,

Equation (12) demonstrates the contribution of the kinematic error source to the position error of the moving platform. δ
4. Establishment of the error and reliability evaluation indexes
Different workspace positions, identical positions under different posture, or identical configurations under different directions of the terminal of the parallel robot manipulator cause significant variations in kinematic accuracy. Therefore, to quantitatively evaluate the level of kinematic accuracy under various configurations, three types of error sensitively indexes that reflect the mapping relationship between the input and output error from three different aspects are introduced [14–15]. If the input error is set as a unit sphere, the volume of the unit sphere is mapped into an ellipsoid via the error transformation matrix. The size and shape of the error ellipsoid reflect the characteristics of the terminal error. Ellipsoid eccentricity, volume, and major axis length can be employed to describe these characteristics. Therefore, the singular values of the error transformation matrix can be constructed into three types of error evaluation index that can measure kinematic accuracy.
4.1 Error tropy sensitivity
The condition number of the error transformation matrix reflects the eccentricity of the error ellipsoid. A bigger condition number leads to a flatter corresponding ellipsoid. Given that the condition number can be expressed as the ratio of the maximum to minimum singular values of the error transformation matrix, the error tropy sensitivity (E.T.S.) can be defined as follows [16]:

E.T.S. is used to describe the isotropic of the error transformation and the uniformity of the error amplification in a workspace. To ensure the isotropic of the error transformation the E.T.S. should be as small as possible with “1” as the best value.
4.2 Comprehensive error sensitivity
On the basis of the previous tasks, the comprehensive error sensitivity (C.E.S.) can be defined as follows [17]:

where e is the error transformation matrix. C.E.S. demonstrates the volume ratio of the output error to the input error. If the input is a unit sphere, the C.E.S. represents the size of the error ellipsoid. To ensure the minimum terminal error, the C.E.S. should be kept at the minimum value.
4.3 Absolute error sensitivity
The longest axis of the error ellipsoid represents the maximum output error. The largest singular value of the error ellipsoid can be applied to describe the maximum magnification of error transformation. Thus, the absolute error sensitivity (A.E.S.) can be defined as follows [18]:

To ensure accuracy, the A.E.S. should be as small as possible.
In general, a smaller error sensitivity value corresponds to the smaller the position error of the parallel robot manipulator. Therefore, the error sensitivity indexes can be used as an accuracy criterion for optimum design problems.
4.4 Reliability analysis of kinematic accuracy
The analysis of the kinematic accuracy reliability of the parallel robot manipulator indicates whether the position, velocity, acceleration, angular displacement, angular velocity, and angular acceleration of the reference point of the moving platform terminal can reach the specified value or fall into a specified range under the influence of various random factors. These factors can be measured to demonstrate the good or poor performance of the mechanism [19]. The analysis of the kinematic accuracy reliability of the 3-
The dimension errors, the clearance errors of rotation in the U joint, active joint errors, and elastic deformation errors are assumed to be mutually independent of one another and to obey the same normal distribution. According to Equation (12), the position errors of the robot in the given reference point also obey the normal distribution in every direction: x, y, z, and the final error direction. The mean and variance can be approximately obtained by the moment method and can be expressed as follows:


where
The final position errors of the position error can be expressed as follows:

According to the definition of kinematic accuracy reliability, the dynamic kinematic reliability of the parallel robot manipulator can be defined as follows [20]:

where Φ(·) is the standard normal distribution function, ζ1 is the lower limit of allowance limit error, and ζ2 is the upper limit of allowance limit error.
The cumulative failure probability of the corresponding can be expressed as follows:

5. Error and reliability analysis of the 3-PUU parallel robot manipulator
5.1 Influence analysis of position parameters on error sensitivity
The aforementioned error performance indexes should be comprehensively considered to evaluate the position error of the parallel robot manipulator. In this paper, the 3-PUU parallel robot manipulator is used to examine the three error sensitivity indexes [21]. The architectural parameters of the 3-PUU parallel robot manipulator are designed as ra = 250mm, rb = 750mm, l = 750mm,

E.T.S.

C.E.S.

A.E.S.

Changing curves of error sensitivities influenced by z values
The three types of error sensitivity changes following the moving platform position, and the tendency in the workspace are consistent (Figures 2 to 4). The three types of error sensitivity indexes have minimum values near the centre of the workspace. A large error will occur when the moving platform is close to the workspace boundary. To ensure the minimum error value of the terminal, the device should work in the lower part of the workspace. Figure 5 illustrates the fact that the error values increase and precision decreases with the increasing height of the moving platform terminal.
Among the three types of error sensitivity index, the A.E.S. index is the most important. The A.E.S. index indicates the maximum error of the moving platform terminal caused by the input errors. Controlling the maximum error sensitivity values in the permission range is necessary to ensure the kinematic accuracy of the moving platform.
5.2 Influence analysis of architectural parameters on the error sensitivity
Research on the architectural parameters of the 3-
When the position parameters of the moving platform are x = 100mm, y = 150mm, and z = 800mm, the solid surface of the architectural parameters affect three types of error sensitivity (Figures 6 to 8). The changes of the three types of error sensitivity of the mechanism have the same general tendency, and the changes are relatively stable without mutation. Furthermore, the radius of the moving platform is small, the radius of the fixed platform is big, the error sensitivity of the mechanism is small, the transmission performance of the mechanism is better, and the accuracy is high. The range of the E.T.S. is 1.5 to 4.5, the scope of the C.E.S. is 8 to 28, and the range of the A.E.S. is 2.5 to 5.5.

E.T.S.

C.E.S.

A.E.S.
5.3 Reliability analysis of static position error
After determining the distribution data of real discrete or distribution laws, the Monte Carlo method can be applied to construct random variables from all error sources. Thereafter, a sample value of the terminal Δp can be obtained by the matrix in Equation (12). The frequency distribution histogram can be obtained on the basis of the multiple sampling values. Thereafter, the parameter Δp estimation and hypothesis test of the distribution types can be produced. Finally, the kinematic reliability of the parallel robot manipulator can be calculated by the distribution function.
To investigate the effect of the uncertainties on kinematic reliability, the errors, including the original manufacturing errors of the mechanism, the clearance errors of the U joints, the active joint errors, and the elastic deformation errors of the constant length rods in the workspace, should be mutually independent of each other and the error data should obey normal distribution Δ ˜ N(0.001, 0.0022). Given the displacement parameters of the mechanism, the displacements in the x, y, and z directions are 100, 1000, and 800 mm. A simulation is conducted 50000 times to consider all normally distributed errors. The frequency distribution histogram in each direction and resultant position direction is then obtained. The available distribution curve is obtained by data fitting and the distribution function, which can be used to calculate reliability in the permissible accuracy range. The required output precision range in three positions is (−0.01mm, 0.01mm). The reliability can then be computed in the three directions and resultant position direction of the parallel robot mechanism.

Error frequency distribution histogram in x direction

Error frequency distribution histogram in y direction

Error frequency distribution histogram in the z direction

Error frequency distribution histogram in the resultant direction
When all errors obey a normal distribution, the position error of the moving platform terminal will obey the normal distribution after the transformation of the error transmission matrix. The frequency distribution histogram of the reference point and the normal distribution curve matches (Figures 9 to 11). However, the frequency distribution histogram in Figure 12 does not completely conform with the normal distribution curve. A large number of data samples are obtained by using the Monte Carlo statistical simulation. The mean and variance of the normal distribution can be obtained by the statistics, thus creating the foundation for kinematic reliability solution analysis.

Kinematic reliability in the x direction
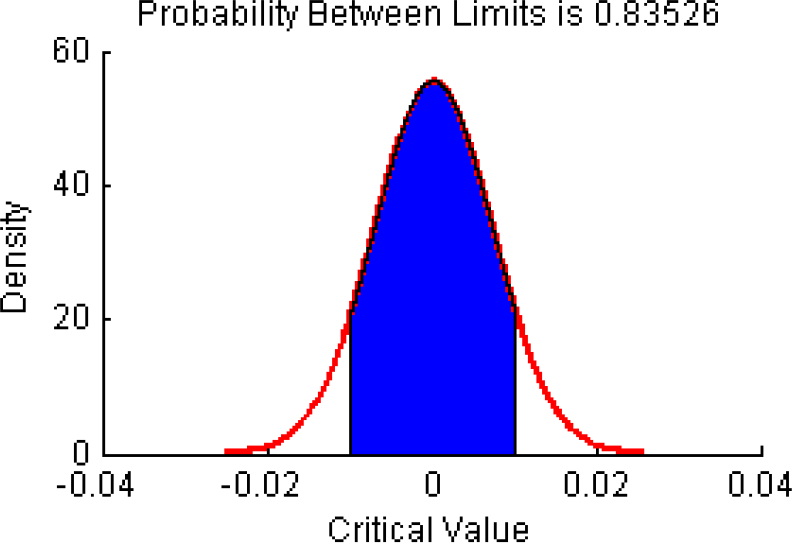
Kinematic reliability in the y direction
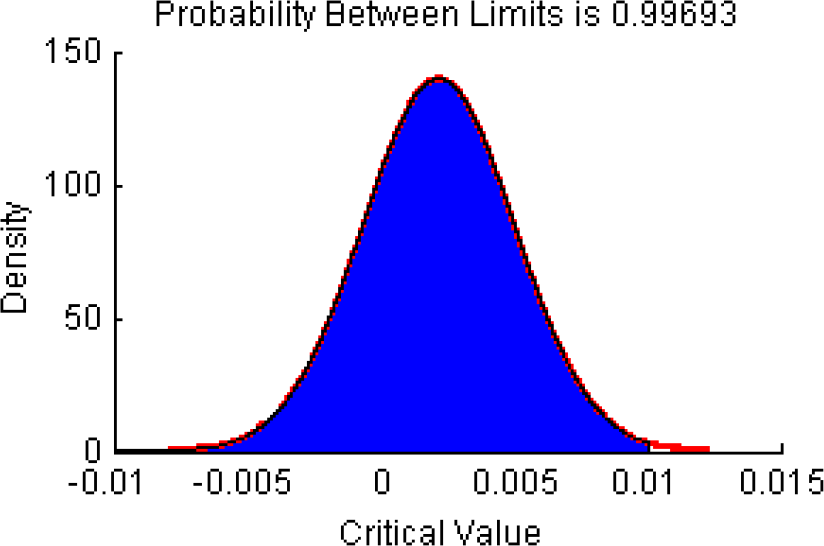
Kinematic reliability in the z direction
The mechanism kinematic reliability has a significant relation with the allowable accuracy. A large allowable accuracy range leads to high reliability, and vice versa. Assuming that the range of allowable accuracy is (−0.01mm, 0.01mm), the probability of the range in a direction can be employed as the mechanism kinematic reliability. The reliability distribution curve can be obtained as follows:
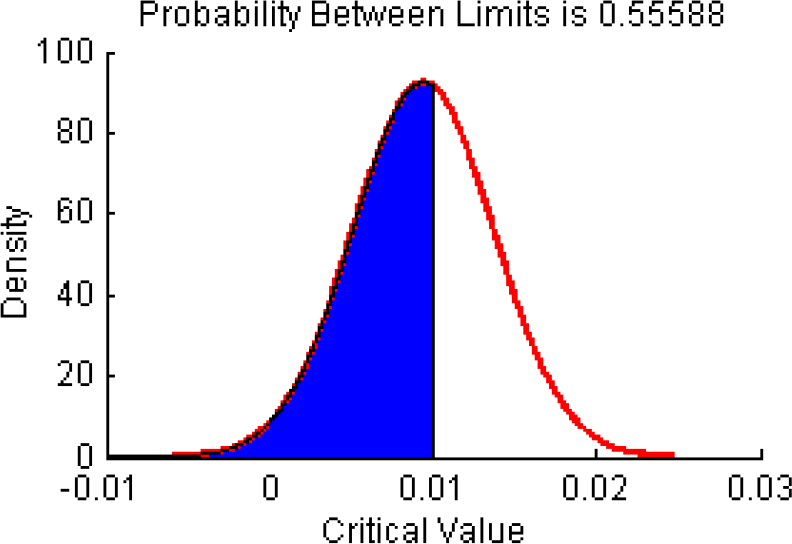
Kinematic reliability in the resultant direction
The kinematic reliability in the x direction is 0.87649, the reliability in the y direction is 0.83526, the reliability in the z direction is 0.99693, and the reliability in the resultant direction is 0.55588 (Figures. 13 to 15). The reliability in the z direction is higher than that in the x and y directions. However, the reliability in the resultant direction is low, thus providing the perfect direction of the position error compensation.
5.4 Dynamic accuracy reliability analysis
In the movement process of the moving platform, the trajectory of the terminal reference point is set to

Displacement–time curve of the active joint

Position direction reliability considering active joint errors

Position direction reliability considering all errors

Comparison of reliability in resultant direction
The reliability results are greater than 0.99 in each direction and the resultant direction only considers the active joint error. The kinematic reliability of the parallel robot manipulator in the z direction is larger than that in the x and y directions for a given tack trajectory (Figures. 18 and 19). Figure 20 illustrates that the active joint is the key to determining the level of kinematic reliability. To ensure that the kinematic accuracy of the mechanism falls into the required range, the corresponding active joint error must be strictly controlled to an allowable range. Given all the error factors mentioned in this paper, the reliability range of the mechanism in the x and y directions is 0.8 to 0.95 and the kinematic reliability range in the resultant direction is 0.55 to 0.68. Compensating the error and reliability optimization of the mechanism is necessary in order to make the mechanism achieve high reliability. This finding can provide direction for future works [23].
6. Conclusion
By using a 3-
The position error model is established on the basis of the inverse kinematics model. Three error performance evaluation indexes, namely, the E.T.S., C.E.S., and A.E.S were introduced.
The mathematical model based on the reliability of the kinematic accuracy of random probability is derived by considering the dimension errors, clearance errors, active joint errors, and elastic deformation errors.
By using specific numerical examples, the influence laws of error sensitivity on the position parameters and architectural parameters are analysed. The kinematic reliability of some positions and the dynamic accuracy reliability of the prospective track trajectory are calculated. Reliability analysis not only provides the optimum design of the mechanism and error compensation but also introduces a new research approach of dimensional synthesis for the optimal design of general parallel mechanisms.
Footnotes
7. Acknowledgements
This research was supported by the National Natural Science Foundation of China (grant no. 51175143).