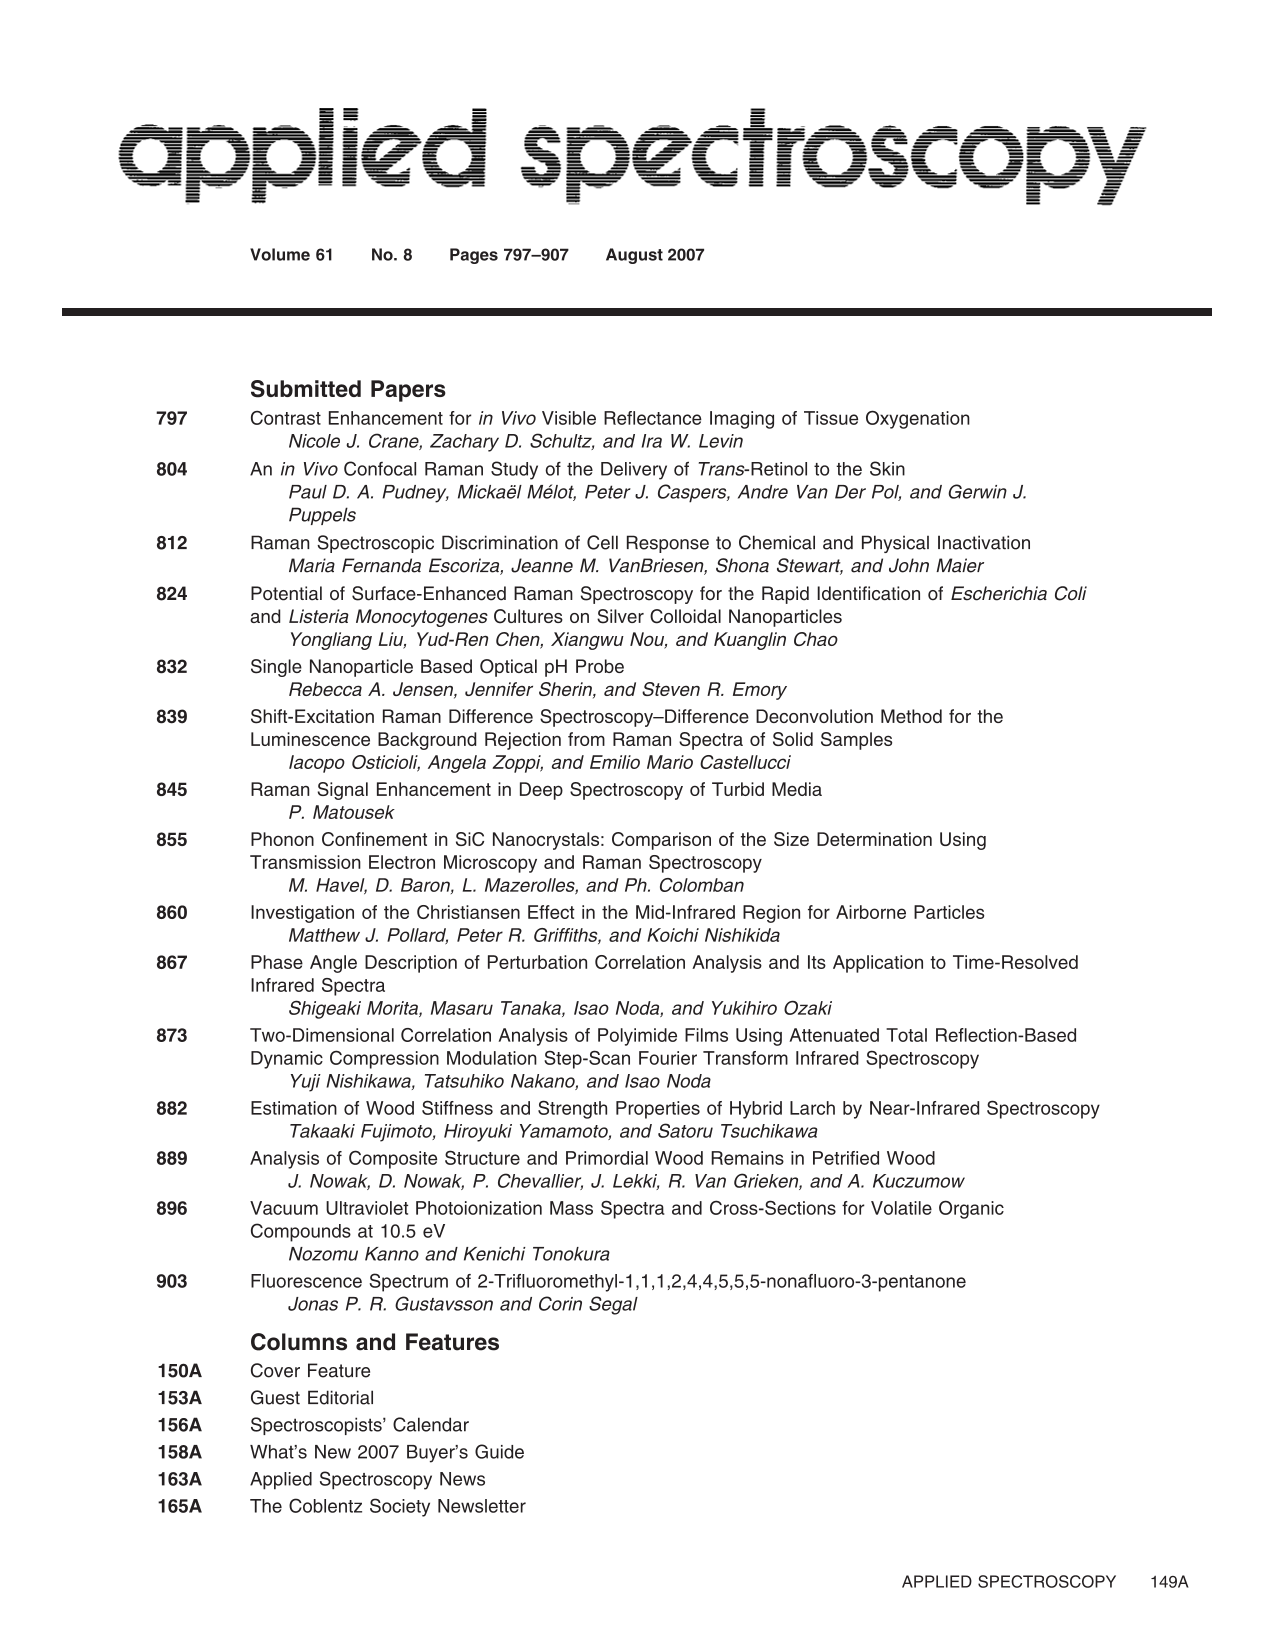
Other
 Restricted accessOtherFirst published August, 2007pp. 149A-150A

Select search scope: search across all journals or within the current journal


 Restricted accessOtherFirst published August, 2007pp. 149A-150ARestricted accessEditorialFirst published August, 2007pp. 153A-154A
 Restricted accessCalendarFirst published August, 2007pp. 156A-157A
Spectroscopists' Calendar is a regular feature in
Restricted accessOtherFirst published August, 2007pp. 158A-161AWHAT'S NEW is provided as a service for our readers. It contains the latest news on the products, catalogs, tips, and supplies that manufacturers elect to highlight. Publication in WHAT'S NEW does not imply recommendation or endorsement by the Society for Applied Spectroscopy or the column editor. Contributions to WHAT'S NEW should be sent to
Restricted accessNewsFirst published August, 2007pp. 163A-164AApplied Spectroscopy News is a monthly feature in the journal. It includes information from the Society for Applied Spectroscopy, news from other societies and institutions, announcements of meetings, schools, or other activities, and reports of symposia from recent conferences. If you have news items, a meeting announcement, or a report from a symposium that would be of interest to readers of
Restricted accessNewsFirst published August, 2007pp. 165A-170A Restricted accessResearch articleFirst published August, 2007pp. 797-803
Results are presented illustrating a straightforward algorithm to be used for real-time monitoring of oxygenation levels in blood cells and tissue based on the visible spectrum of hemoglobin. Absorbance images obtained from the visible reflection of white light through separate red and blue bandpass filters recorded by monochrome charge-coupled devices (CCDs) are combined to create enhanced images that suggest a quantitative correlation between the degree of oxygenated and deoxygenated hemoglobin in red blood cells. The filter bandpass regions are chosen specifically to mimic the color response of commercial 3-CCD cameras, representative of detectors with which the operating room laparoscopic tower systems are equipped. Adaptation of this filter approach is demonstrated for laparoscopic donor nephrectomies in which images are analyzed in terms of real-time
Restricted accessResearch articleFirst published August, 2007pp. 804-811The purpose of this study is to monitor
Restricted accessResearch articleFirst published August, 2007pp. 812-823Raman spectroscopy was applied to study
Restricted accessResearch articleFirst published August, 2007pp. 824-831Surface-enhanced Raman (SERS) spectra of various batches of bacteria adsorbed on silver colloidal nanoparticles were collected to explore the potential of the SERS technique for rapid and routine identification of
Restricted accessResearch articleFirst published August, 2007pp. 832-838This paper describes the development of a nanoscale optical pH probe based upon the surface-enhanced Raman scattering (SERS) properties of silica–gold core-shell nanoparticles. In this approach, a thin layer of gold is deposited onto a core of silica to form a metallic nanoshell with surface plasmon modes in the red-to-near-infrared spectral region. The surface of the nanoshell is functionalized with a pH-sensitive SERS reporter molecule, 4-mercaptopyridine (4-MPy). The SERS spectra of 4-MPy is shown to be sensitive to the pH of the surrounding media within the range of 3 to 7. In addition, it is shown that individual silica–gold core-shell nanoparticles yield more reliable SERS spectra than aggregates of core-shell nanoparticles.
Restricted accessResearch articleFirst published August, 2007pp. 839-844The feasibility of the shift-excitation Raman difference spectroscopy–difference deconvolution (SERDS-DDM) method for fluorescence suppression from Raman spectra of solid samples is discussed. For SERDS measurements a tunable diode laser source with an emission band centered at 684 nm is coupled to a conventional micro-Raman apparatus and a monochromator device is used for checking the excitation frequency stability. The shifted Raman spectra are then mathematically treated and a deconvolution procedure is used to reconstruct the Raman spectrum devoid of fluorescence. Two different cases are presented. In the first one, fluorescence is intrinsic to the sample and the Raman spectrum of cinnabar pigment is finally reconstructed. In the second, the presence of an external luminescence background in the spectrum of a pure sulfur crystal is considered. The SERDS-DDM reconstructed spectra are compared with spectra obtained via multi-point baseline subtraction and a significant improvement in the detection of weak bands is demonstrated. Practical insights for the application of this method are presented as well.
Restricted accessResearch articleFirst published August, 2007pp. 845-854A new, passive method for enhancing spontaneous Raman signals for the spectroscopic investigation of turbid media is presented. The main areas to benefit are transmission Raman and spatially offset Raman spectroscopy approaches for deep probing of turbid media. The enhancement, which is typically several fold, is achieved using a multilayer dielectric optical element, such as a bandpass filter, placed within the laser beam over the sample. This element prevents loss of the photons that re-emerge from the medium at the critical point where the laser beam enters the sample, the point where major photon loss occurs. This leads to a substantial increase of the coupling of laser radiation into the sample and consequently an enhanced laser photon–medium interaction process. The method utilizes the angular dependence of dielectric optical elements on impacting photon direction with its transmission spectral profile shifting to the blue with increase in the deviation of photons away from normal incidence. This feature enables it to act as a unidirectional mirror passing a semi-collimated laser beam through unhindered from one side, and at the other side, reflecting photons emerging from the sample at random directions back into it with no restrictions to the detected Raman signal. With substantial restrictions to the spectral range, the concept can also be applied to conventional backscattering Raman spectroscopy. The use of additional reflective elements around the sample to enhance the Raman signal further is also discussed. The increased signal strength yields higher signal quality, a feature important in many applications. Potential uses include sensitive noninvasive disease diagnosis
Restricted accessResearch articleFirst published August, 2007pp. 855-859Silicon carbide fibers of different generation/processing routes (NLM-Nicalon and Tyranno SA3) were thermally treated to trigger the growth of nanocrystals, which were analyzed using Raman spectroscopy and transmission electron microscopy (TEM). The nanocrystals were also aged in molten sodium nitrate to investigate their reactivity. The spatial correlation model has been used to model the Raman spectra and extract accurate and statistical information on the nanocrystallites' structure and dimension. For the NLM fibers, an average size of 2.5 to 7.0 nm was calculated, which was in good agreement with TEM observations. For the Tyranno SA3 fiber, despite the heavily faulted stacking sequence, the Raman peaks remained sharp, indicating that the crystallite dimension calculated from the Raman spectra is only dependent on the actual size of the nanocrystals and is not affected by the sequence of the stacking faults.
Restricted accessResearch articleFirst published August, 2007pp. 860-866During measurements of open-path Fourier transform infrared spectra, airborne dust may be present in the infrared beam. We have investigated the feasibility of identifying and quantifying the airborne particulate matter from spectra measured in this way. Although the results showed that analysis of the particulate matter was not able to be performed from these spectra, insight into the size and wavelength dependence of the Christiansen effect at wavelengths where the particles absorb strongly was obtained. Airborne particles larger than or equal to the wavelength of the incident radiation give rise to asymmetrical features in the spectrum caused by the Christiansen effect. However, the transmittance at wavelengths where the refractive index of the particles equals that of the atmosphere never reaches 1.0 because of absorption by the particles. As the particle size becomes much smaller than the wavelength of the incident radiation, the Christiansen effect becomes less pronounced and eventually is not exhibited.
Restricted accessResearch articleFirst published August, 2007pp. 867-872A method of spectral analysis, phase angle description of perturbation correlation analysis, is proposed. This method is based on global phase angle description of generalized two-dimensional (2D) correlation spectroscopy, proposed by Shin-ichi Morita et al., and perturbation-correlation moving-window 2D (PCMW2D) correlation spectroscopy, proposed by Shigeaki Morita et al. For a spectral data set collected under an external perturbation, such as time-resolved infrared spectra, this method provides only one phase angle spectrum. A phase angle of the Fourier frequency domain correlation between a spectral intensity (e.g., absorbance) variation and a perturbation variation (e.g., scores of the first principle component) as a function of spectral variable (e.g., wavenumber) is plotted. Therefore, a degree of time lag of each band variation with respect to the perturbation variation is directly visualized in the phase angle spectrum. This method is applied to time-resolved infrared spectra in the O–H stretching region of the water sorption process into a poly(2-methoxyethyl acrylate) (PMEA) film. The time-resolved infrared (IR) spectra show three broad and overlapping bands in the region. Each band increases toward saturated water sorption with different relaxation times. In comparison to conventional methods of generalized 2D correlation spectroscopy and global phase angle mapping, the method proposed in the present study enables the easier visualization of the sequence as a degree of phase angle in the spectrum.
Restricted accessResearch articleFirst published August, 2007pp. 873-881Attenuated total reflection (ATR)-based dynamic compression modulation two-dimensional (2D) correlation study of poly(p-phenylene biphenyltetracarboximide) film is carried out in combination with spectral simulation analysis by density functional theory (DFT). The dynamic 2D infrared (IR) correlation spectra in the region of imide I (C=O stretching mode) show three distinct correlation peaks located around 1777, 1725, and 1708 cm−1. The band at 1708 cm−1 is the lower wavenumber shift component of 1777 or 1735 cm−1 peaks and is attributed to the results from intermolecular interactions, according to the DFT analysis. The 1708 cm−1 band also shows the largest dynamic response, suggesting that these intermolecular interactions may enhance the dynamic response. The dynamic 2D IR correlation spectra in the region of imide II (C–N–C axial stretching mode) vibrations also show three correlation peaks located around 1335, 1355, and 1370 cm−1, although the imide II band is shown to consist substantially of one component by the DFT analysis. These multiple peaks may be attributed to the compression-induced wavenumber shift of the band in the backbone structures. The sequential analysis of 2D correlation data show that, upon applying the dynamic compression, the response of the backbone regions (imide II) occurs first, followed by that of the side-chain regions (imide I, C=O).
Restricted accessResearch articleFirst published August, 2007pp. 882-888This work was undertaken to investigate the feasibility of near-infrared (NIR) spectroscopy for estimating wood mechanical properties, i.e., modulus of elasticity (MOE) and modulus of rupture (MOR) in bending tests. Two sample sets having large and limited density variation were prepared to examine the effects of wood density on estimation of MOE and MOR by the NIR technique. Partial least squares (PLS) analysis was employed and it was found that the relationships between laboratory-measured and NIR-predicted values were good in the case of sample sets having large density variation. MOE could be estimated even when density variation in the sample set was limited. It was concluded that absorption bands due to the OH group in the semi-crystalline or crystalline regions of cellulose strongly influenced the calibrations for bending stiffness of hybrid larch. This was also suggested from the result that both α-cellulose content and cellulose crystallinity showed moderate positive correlation to wood stiffness.
Restricted accessResearch articleFirst published August, 2007pp. 889-895Among all the fossils, petrified wood belongs to the most impressive and most common of materials. Still, its study has not exceeded the purely phenomenological level. The recognition of the conserved structure of petrified wood seems to be of meaning for understanding the geological past, the complete carbon cycle inside the Earth, and the structure of potential new materials. The first ever published spatial distributions of the remains of the primordial organic material (lignin, cellulose, pectins) in the cells of permineralized wood, from Dunarobba (Central Italy), are presented here. They were collected using μ-Raman spectrometry. The composite nature of the petrified material (calcite located in the lumena of cells and goethite located in the cell walls) was confirmed by electron, proton, and X-ray microprobes. The structure of the cell walls was well preserved. The mineralization process was induced by the tracheidal water flow and was stopped after formation of pipe-like goethite shielding of the cell walls on the cellulose scaffolds. The chemical (Eh and pH ranges) and probable microbial conditions for such a pattern of mineralization were determined. We estimate that substantial amounts of the primordial organic matter were preserved in bodies of petrified wood on a global scale. The wood petrifaction process, if well understood, can be a basis for the production of “everlasting” organic–inorganic composite compounds.
Restricted accessResearch articleFirst published August, 2007pp. 896-902Vacuum ultraviolet single-photon ionization time-of-flight mass spectrometry (VUV-SPI-TOFMS) has been applied to the detection of volatile organic compounds (VOCs), including aromatic, chlorinated, and oxygenated compounds. Photoionization mass spectra of 23 VOCs were measured using SPI-TOFMS at 10.5 eV (118 nm). The limits of detection of VOCs using SPI-TOFMS at 10.5 eV were estimated to be a few ppbv. The mass spectra of 20 VOCs exhibit only the parent ion and its isotopes' signals. The ionization processes of the VOCs were discussed on the basis of the reaction enthalpies predicted by the quantum chemical calculations. Absolute photoionization cross-sections for 23 VOCs, including 12 newly measured VOCs, at 10.5 eV were determined in comparison to the reported absolute photoionization cross-section of NO.
Restricted accessResearch articleFirst published August, 2007pp. 903-907A perfluorinated ketone, 2-trifluoromethyl-1,1,1,2,4,4,5,5,5-nonafluoro-3-pentanone, has been investigated to determine several physical and spectroscopic properties. It was found to exhibit fluorescence similar to that of acetone, emitting over the 360–550 nm range with a peak near 420 nm when excited at 355 nm. This compound's emission is nearly unaffected over a wide range of temperature and pressure in an argon bath gas. Its fluorescence efficiency was found to be three times higher than that of acetone. Combined with low reactivity and thermal stability up to 500 8C, this makes the material an excellent tracer for spectroscopic measurement techniques.