Research article
 Restricted accessResearch articleFirst published June, 2023pp. 551-556

Select search scope: search across all journals or within the current journal


 Restricted accessResearch articleFirst published June, 2023pp. 551-556Restricted accessResearch articleFirst published June, 2023pp. 557-568
 , [...]
A spectral analysis tool has been developed to interactively identify and quantify individual gas-phase species from complex infrared absorbance spectra obtained from laboratory or field data. The SpecQuant program has an intuitive graphical interface that accommodates both reference and experimental data with varying resolution and instrumental lineshape, as well as algorithms to readily align the wavenumber axis of a sample spectrum with the raster of a reference spectrum. Using a classical least squares model in conjunction with reference spectra such as those from the Pacific Northwest National Laboratory (PNNL) gas-phase infrared database or simulated spectra derived from the HITRAN line-by-line database, the mixing ratio of each identified species is determined along with its associated estimation error. After correcting the wavelength and intensity of the field data, SpecQuant displays the calculated mixing ratio versus the experimental data for each analyte along with the residual spectrum with any or all analyte fits subtracted for visual inspection of the fit and residuals. The software performance for multianalyte quantification was demonstrated using moderate resolution (0.5 cm–1) infrared spectra that were collected during the time-resolved infrared photolysis of methyl iodide.
This is a visual representation of the abstract.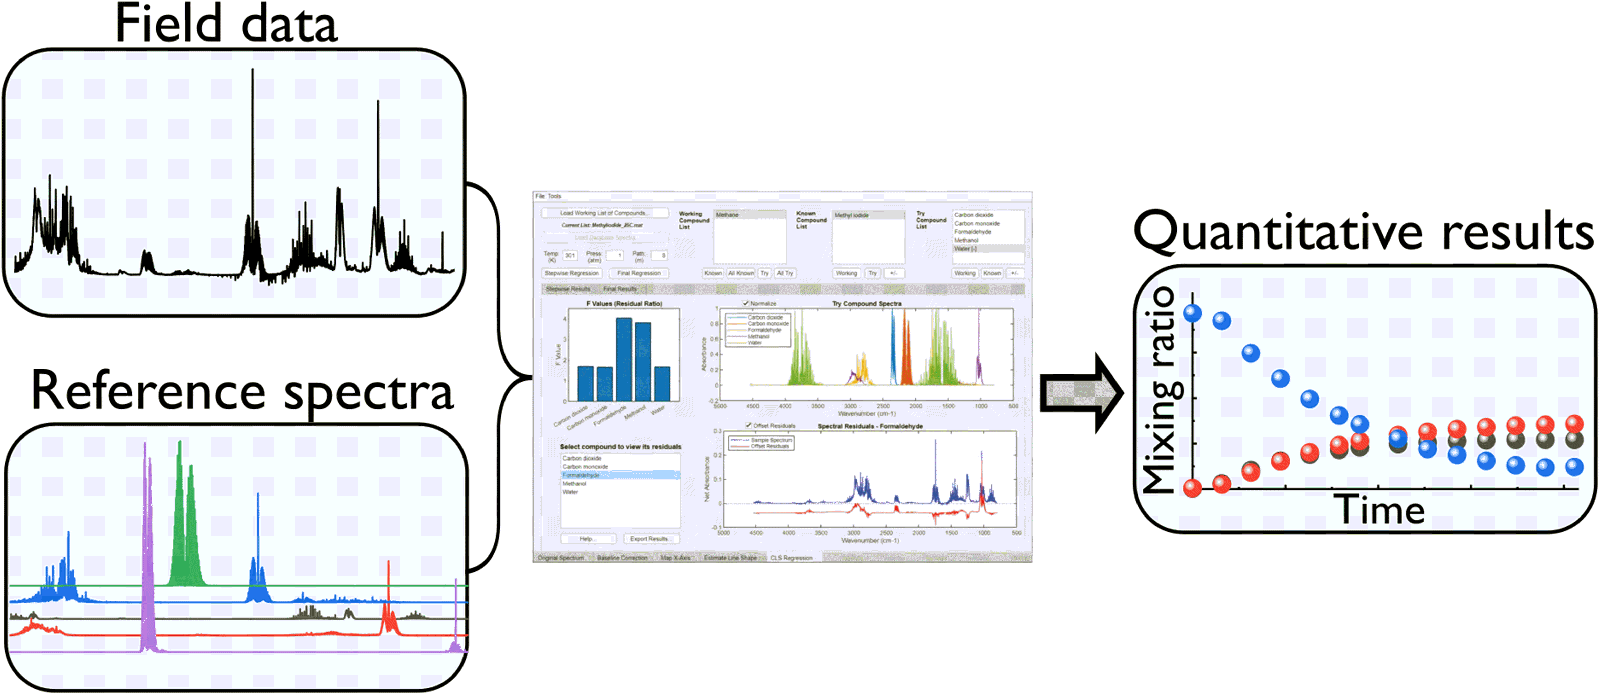
 Open accessResearch articleFirst published June, 2023pp. 569-582
In this work we demonstrate an advanced concept of a charge-shifting charge-coupled device (CCD) read-out combined with shifted excitation Raman difference spectroscopy (SERDS) capable of operating at up to 10 kHz acquisition rates for the effective mitigation of fast-evolving interfering backgrounds in Raman spectroscopy. This rate is 10-fold faster than that achievable with an instrument we described previously and is overall 1000-fold faster than possible with conventional spectroscopic CCDs capable of operating at up to ∼10 Hz rates. The speed enhancement was realized by incorporating a periodic mask at the internal slit of an imaging spectrometer permitting a smaller shift of the charge on the CCD (8 pixels) to be required during the cyclic shifting process compared with the earlier design which employed an 80-pixel shift. The higher acquisition speed enables the more accurate sampling of the two SERDS spectral channels, enabling it to effectively tackle highly challenging situations with rapidly evolving interfering fluorescence backgrounds. The performance of the instrument is evaluated for heterogeneous fluorescent samples which are moved rapidly in front of the detection system aiming at the differentiation of chemical species and their quantification. The performance of the system is compared with that of the earlier 1 kHz design and a conventional CCD operated at its maximum rate of 5.4 Hz as previously. In all situations tested, the newly developed 10 kHz system outperformed the earlier variants. The 10 kHz instrument can benefit a number of prospective applications including: disease diagnosis where high sensitivity mapping of complex biological matrices in the presence of natural fluorescence bleaching restricts achievable limits of detection; accurate data acquisition from moving heterogeneous samples (or moving a handheld instrument in front of the sample during data acquisition) or data acquisition under varying ambient light conditions (e.g., due to casting shadows, sample or instrument movement). Other beneficial scenarios include monitoring rapidly evolving Raman signals in the presence of largely static background signals such as in situations where a heterogeneous sample is moving rapidly in front of a detection system (e.g., a conveyor belt) in the presence of static ambient light.
This is a visual representation of the abstract.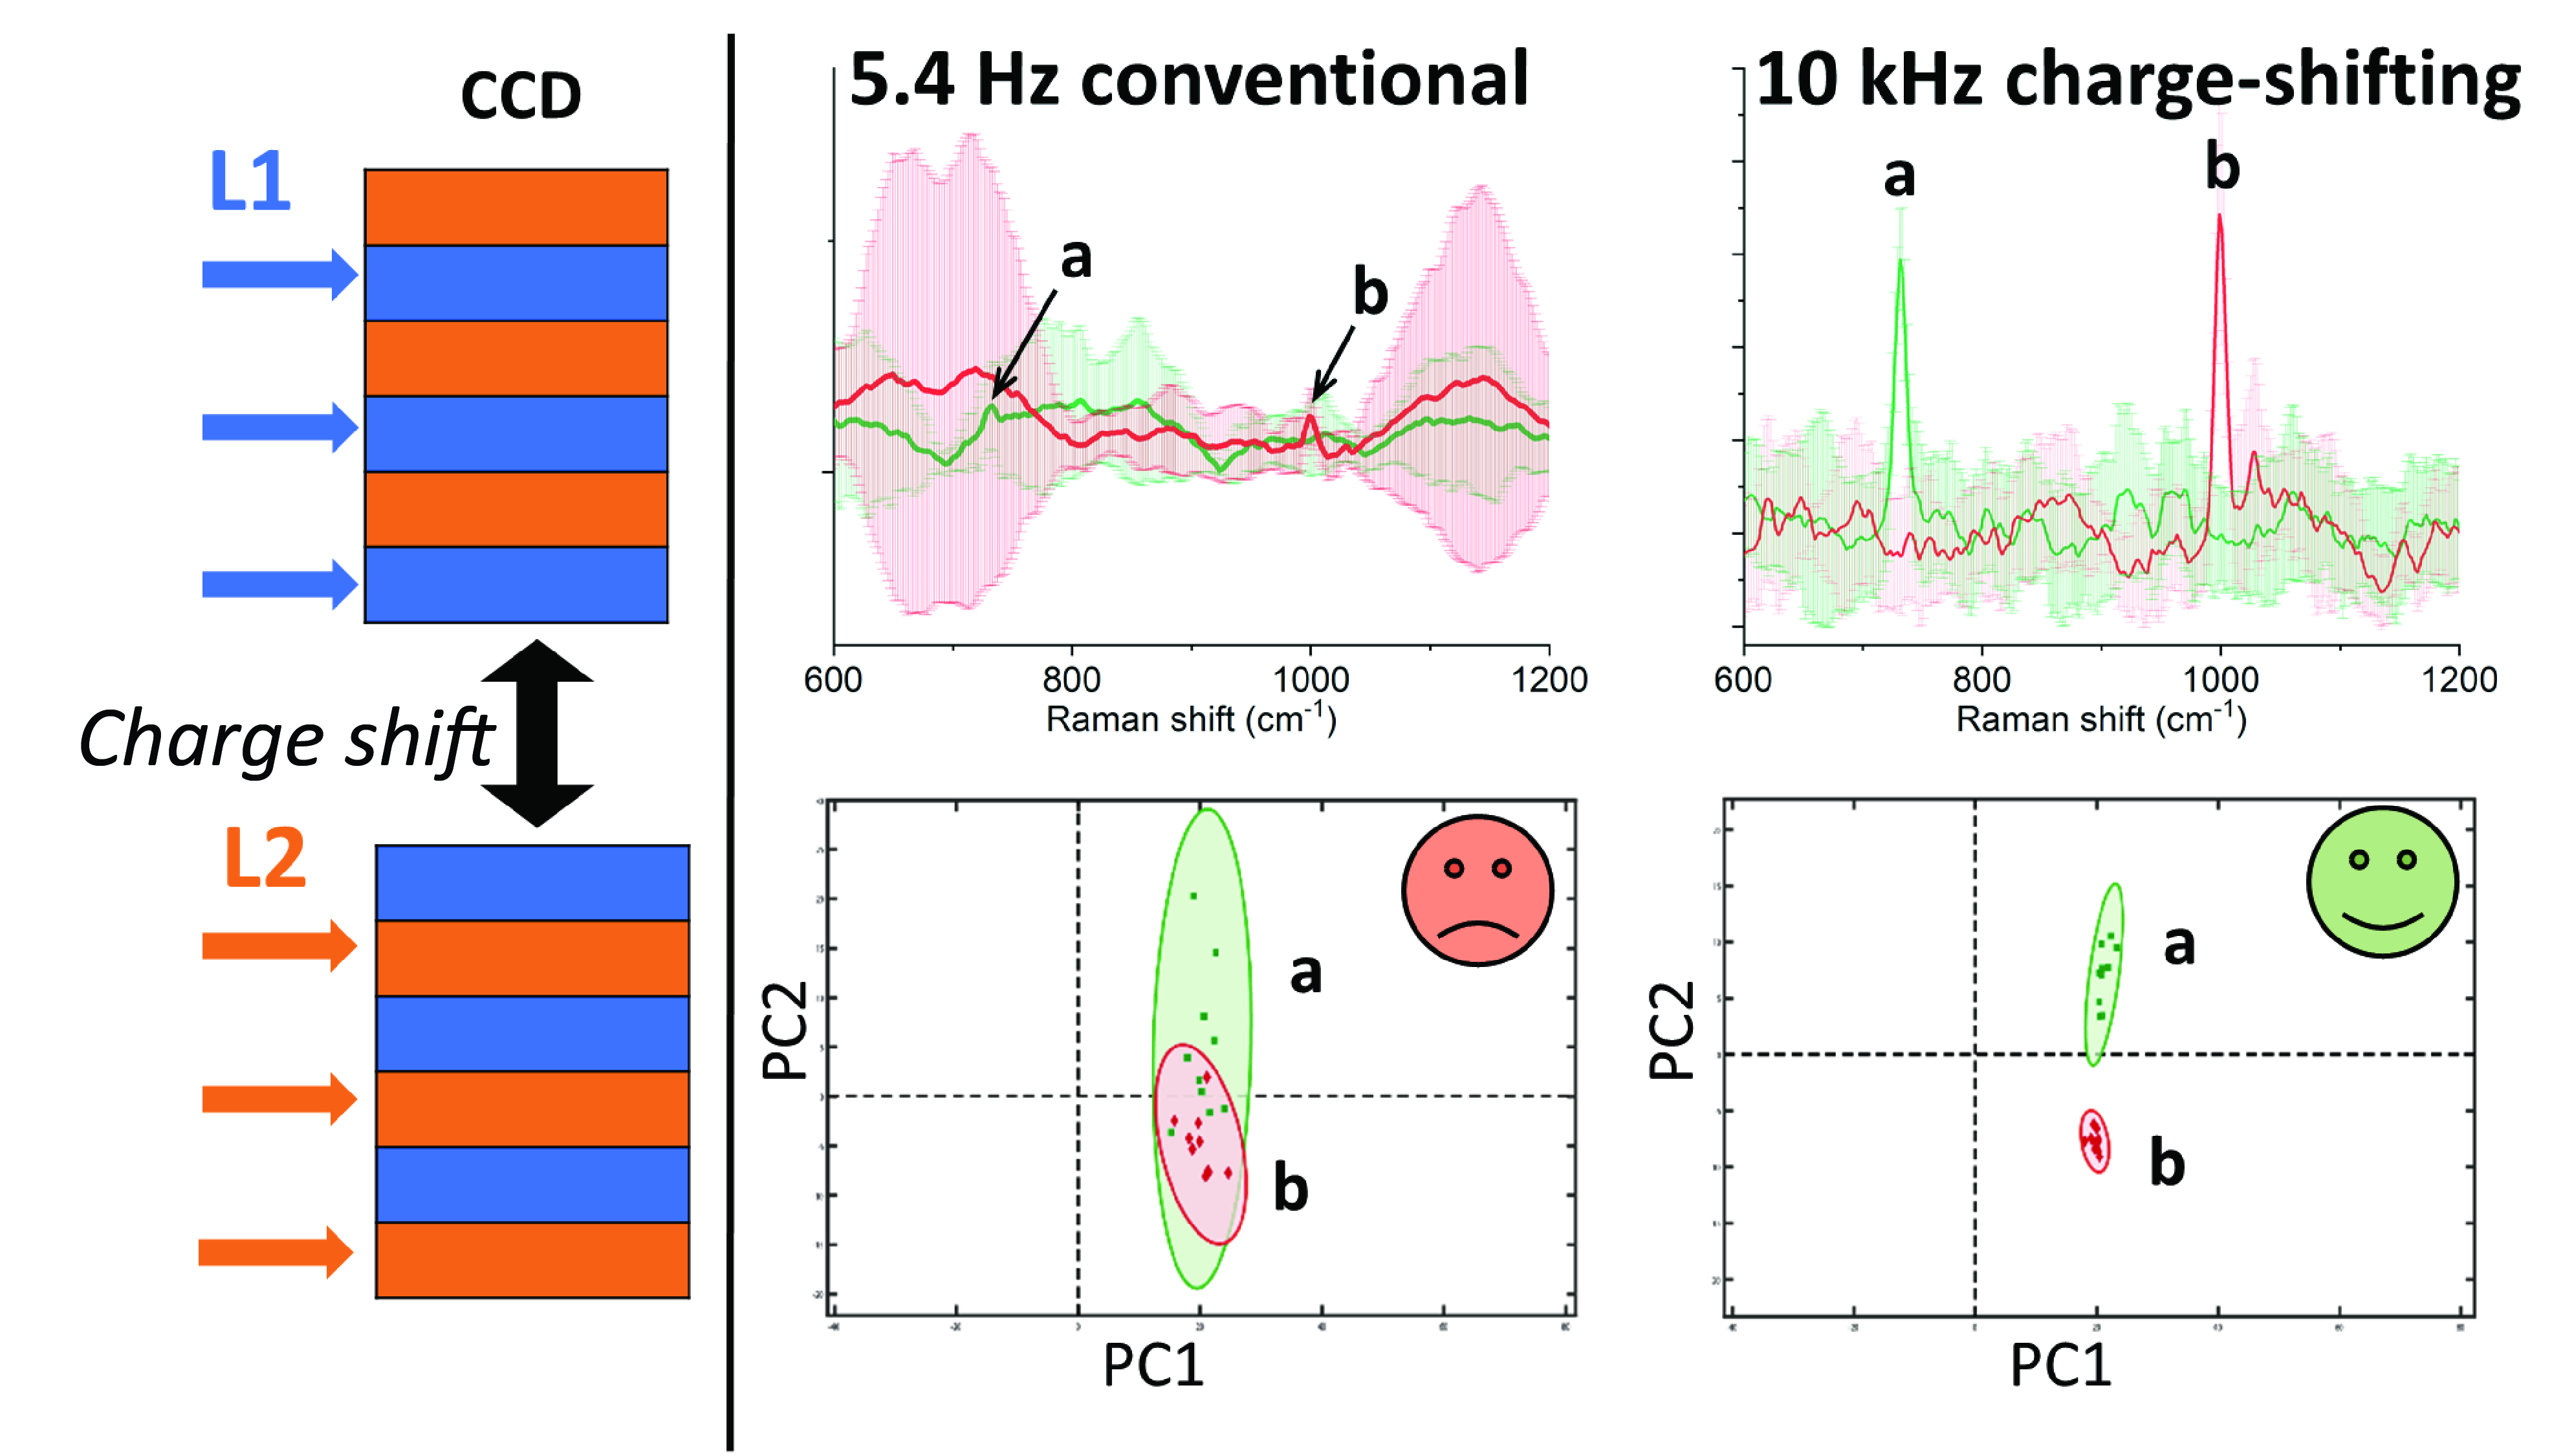
Restricted accessResearch articleFirst published June, 2023pp. 583-592, Marie Richard-Lacroix, Susanne Pahlow , [...]Based on hybrid 2D correlation analysis, we recently derived and introduced a “smart error sum,” a sophisticated loss function that can be used for solving nonlinear inverse problems like the determination of optical constants and oscillator parameters from a series of optical spectra in the infrared spectral region. The advantage of the smart error sum compared to the conventional sum of squared errors lies in its ability to marginalize multiplicative systematic errors such as, for example, reflectance values above unity in transflection spectra. This is enabled by a transformation, which allows fits to not exclusively focus on forcing fit spectra to agree with experimental spectra at every wavenumber point by all means, but also to take correlations such as spectral similarities and their changes with certain perturbations into account. In this work, we extend our approach to accommodate the treatment of individual spectra, instead of only series, based on hybrid two-trace two-dimensional (2T2D) correlation analysis. We evaluate and prove the value of our approach by individually analyzing experimental transflection spectra of polymethyl methacrylate (PMMA) layers on gold substrates. The comparison of the results with those obtained by the original smart error sum based on the whole set of spectra as well as those resulting from conventional fitting of series and individual spectra (using the conventional sum of squared errors) confirms the validity and soundness of the 2T2D smart error sum.
This is a visual representation of the abstract.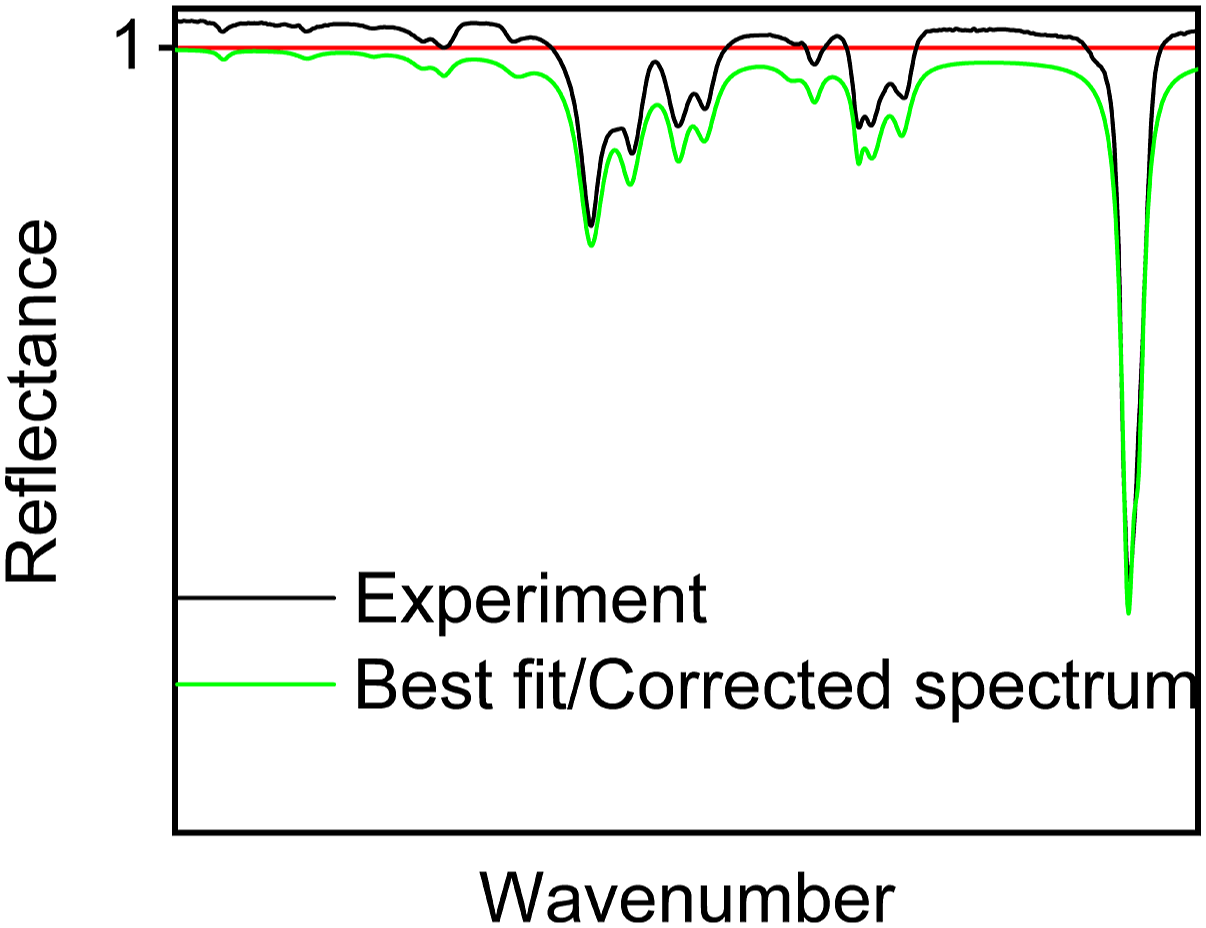
Open accessResearch articleFirst published June, 2023pp. 593-602We describe an entomological dual-band 808 and 980 nm lidar system which has been implemented in a tropical cloud forest (Ecuador). The system was successfully tested at a sample rate of 5 kHz in a cloud forest during challenging foggy conditions (extinction coefficients up to 20 km–1). At times, the backscattered signal could be retrieved from a distance of 2.929 km. We present insect and bat observations up to 200 m during a single night with an emphasis on fog aspects, potentials, and benefits of such dual-band systems. We demonstrate that the modulation contrast between insects and fog is high in the frequency domain compared to intensity in the time domain, thus allowing for better identification and quantification in misty forests. Oscillatory lidar extinction effects are shown in this work for the first time, caused by the combination of dense fog and large moths partially obstructing the beam. We demonstrate here an interesting case of a moth where left- and right-wing movements induced oscillations in both intensity and pixel spread. In addition, we were able to identify the dorsal and ventral sides of the wings by estimating the corresponding melanization with the dual-band lidar. We demonstrate that the wing beat trajectories in the dual-band parameter space are complementary rather than covarying or redundant, thus a dual-band entomological lidar approach to biodiversity studies is feasible in situ and endows species specificity differentiation. Future improvements are discussed. The introduction of these methodologies opens the door to a wealth of possible experiments to monitor, understand, and safeguard the biological resources of one of the most biodiverse countries on Earth.
This is a visual representation of the abstract.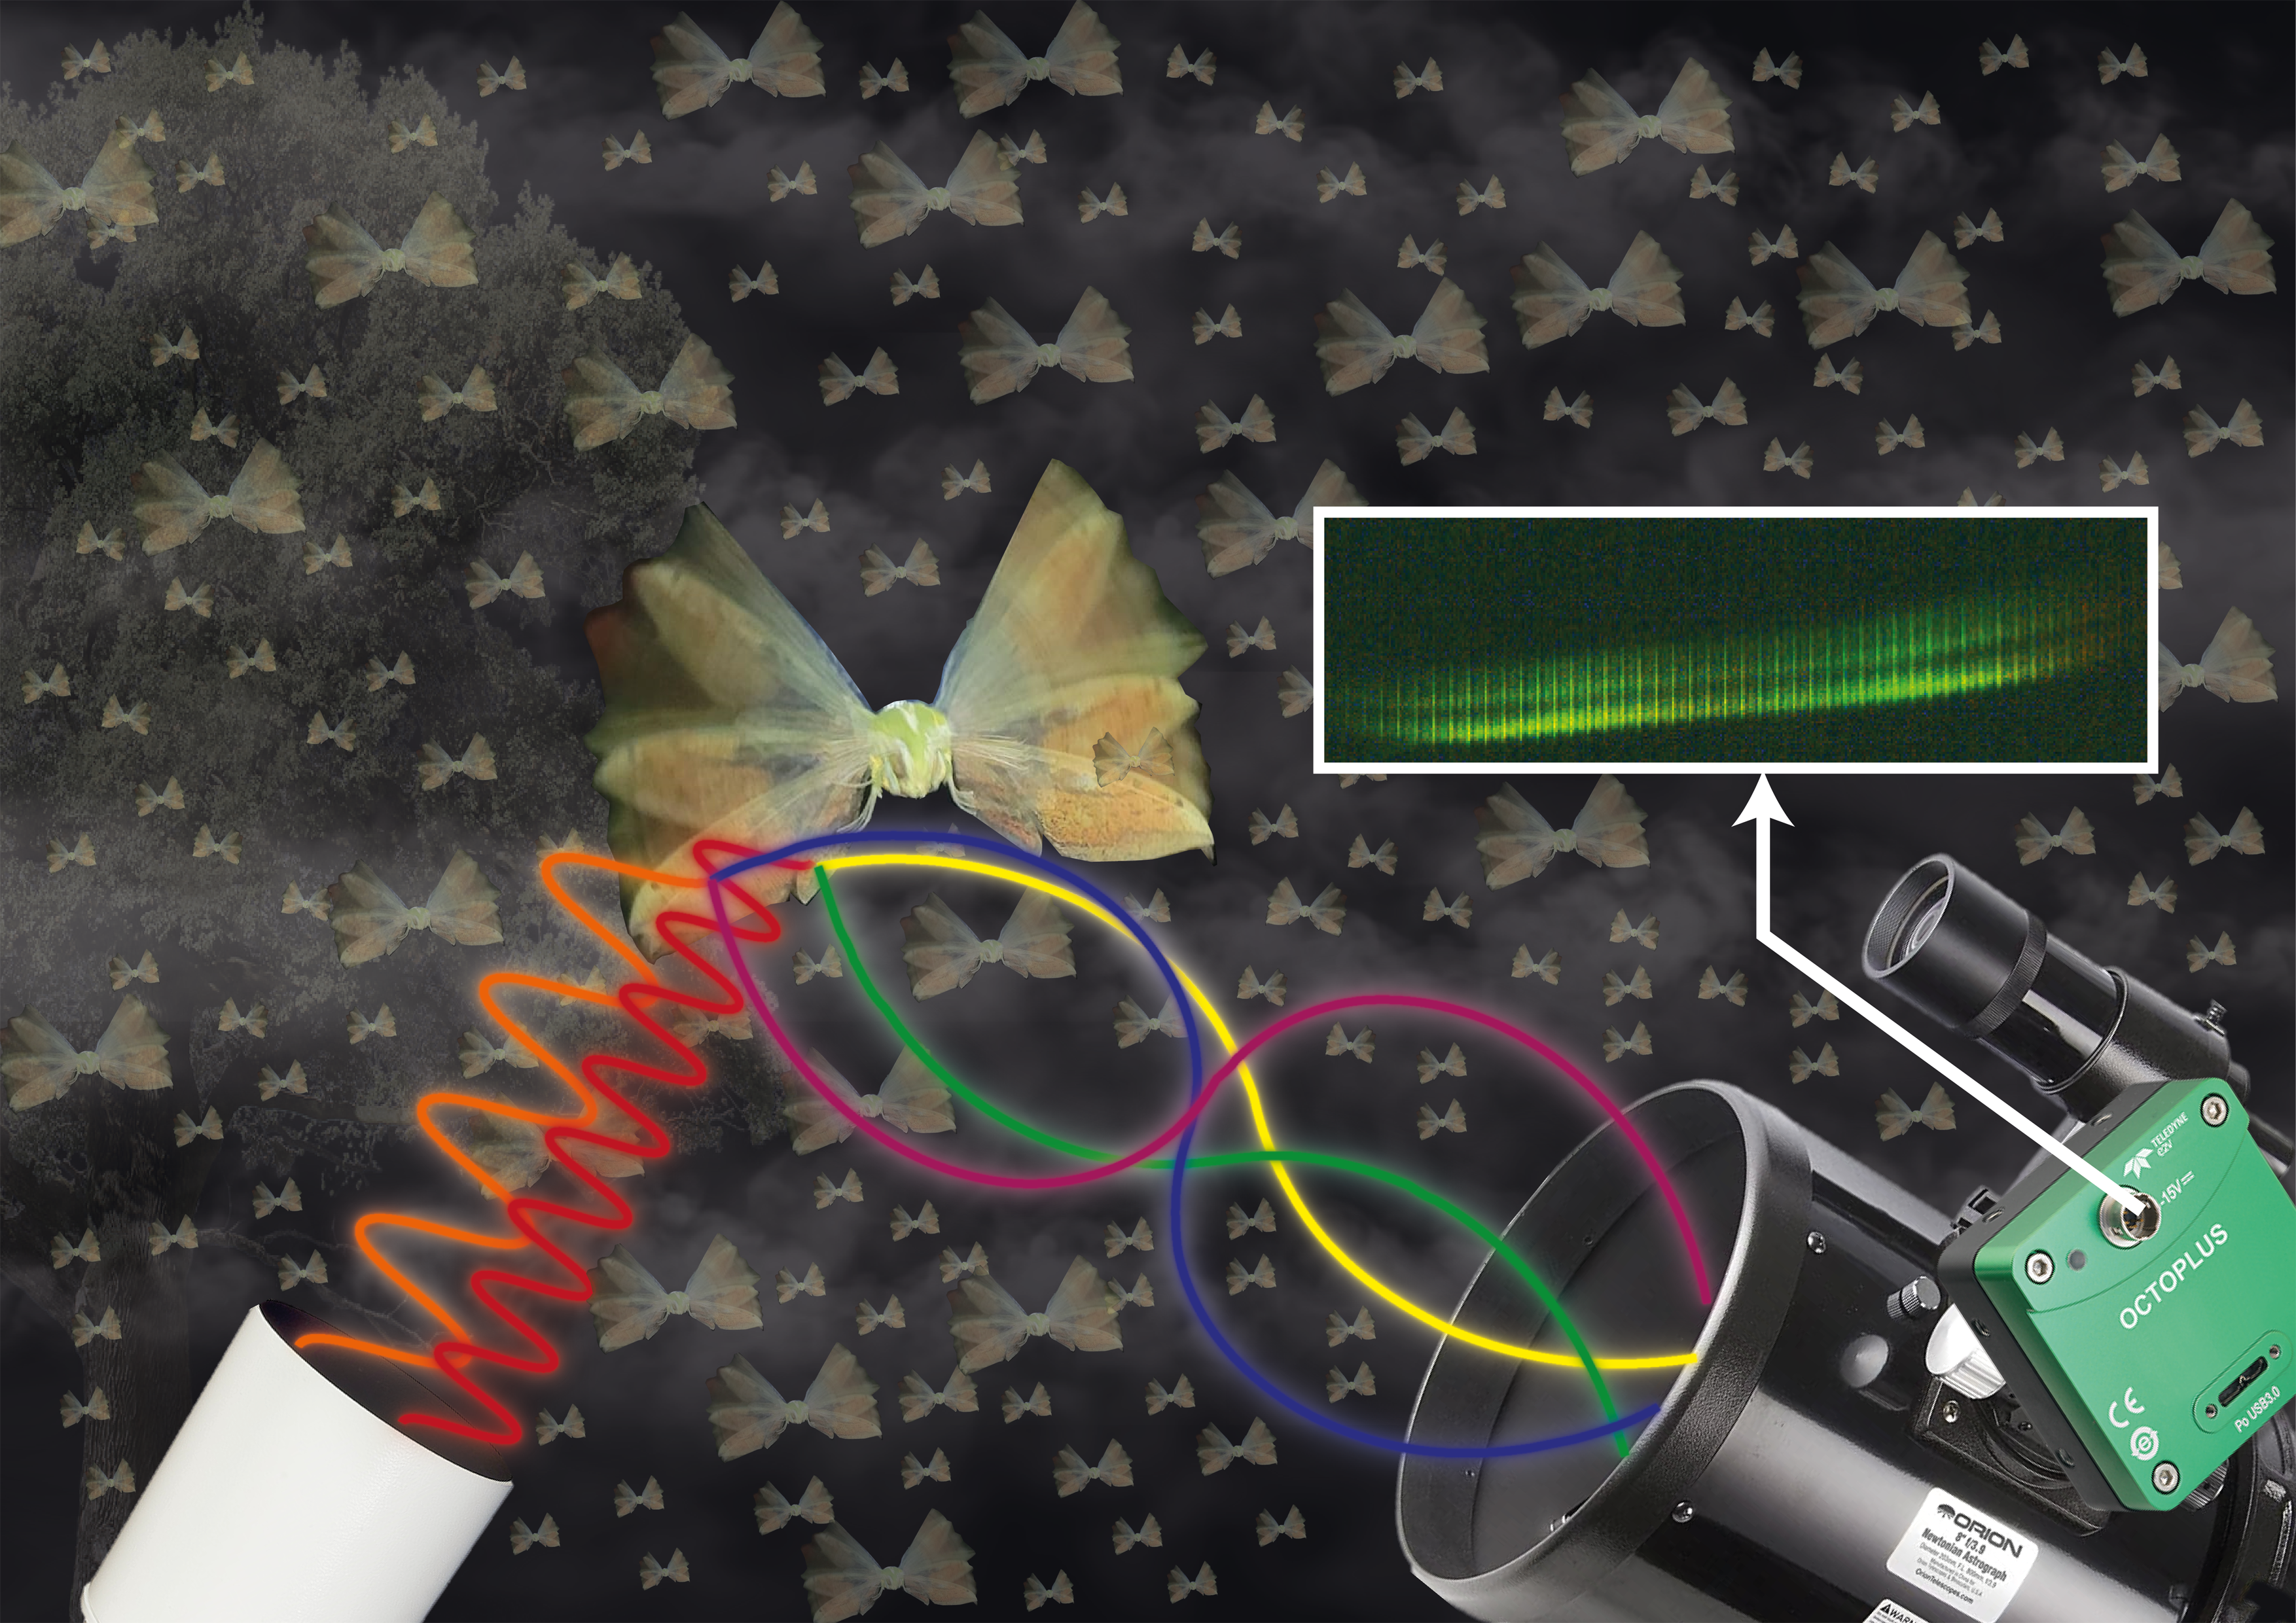
Restricted accessResearch articleFirst published June, 2023pp. 603-615In this study, we propose a transfer learning-based classification model for identifying scrap metal using an augmented training dataset consisting of laser-induced breakdown spectroscopy (LIBS) measurement of standard reference material (SRMs) samples, considering varying experimental setups and environmental conditions. LIBS provides unique spectra for identifying unknown samples without complicated sample preparation. Thus, LIBS systems combined with machine learning methods have been actively studied for industrial applications such as scrap metal recycling. However, in machine learning models, a training set of the used samples may not cover the diversity of the scrap metal encountered in field measurements. Moreover, differences in experimental configuration, where laboratory standards and real samples are analyzed in situ, may lead to a wider gap in the distribution of training and test sets, dramatically reducing the performance of the LIBS-based fast classification system for real samples. To address these challenges, we propose a two-step Aug2Tran model. First, we augment the SRM dataset by synthesizing spectra of unobserved types through attenuation of dominant peaks corresponding to sample composition and generating spectra depending on the target sample using a generative adversarial network. Second, we used the augmented SRM dataset to build a robust real-time classification model with a convolutional neural network, which is further customized for the target scrap metal with limited measurements through transfer learning. For evaluation, SRMs of five representative metal types, including aluminum, copper, iron, stainless steel, and brass, are measured with a typical setup to form the SRM dataset. For testing, scrap metal from actual industrial fields is experimented with three different configurations, resulting in eight different test datasets. The experimental results show that the proposed scheme produces an average classification accuracy of 98.25% for the three experimental conditions, as high as the results of the conventional scheme with three separately trained and executed models. Additionally, the proposed model improves the classification accuracy of arbitrarily shaped static or moving samples with various surface contaminations and compositions, and even for differing ranges of charted intensities and wavelengths. Therefore, the proposed Aug2Tran model can be used as a systematic model for scrap metal classification with generalizability and ease of implementation.
This is a visual representation of the abstract.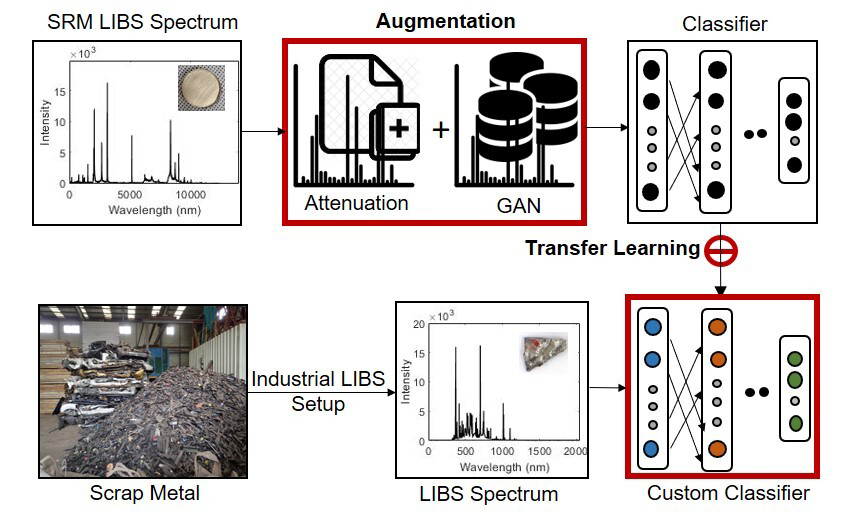
Restricted accessResearch articleFirst published June, 2023pp. 616-622, Samira Safaripour, Craig SnoeyinkA novel method of measuring the influence of high electric fields on the Raman scattering of fluids is introduced, which can help understand various interactions of a fluid with the high electric field. The microfluidic chip can impose highly controlled, uniform electric fields across the measurement volume with blocked electrodes, eliminating spurious reactions at the electrode surface. The developed methodology and the experimental setup are utilized to examine the effect of the electric field on three of the stretching vibrations of ethanol in water–ethanol mixtures with varying concentrations of ethanol and effective electric fields up to 1.0MV/m. The increase in the electric field is seen to broadly decrease the intensity of Raman scattering due to a decrease in the polarizability of the ethanol molecules. Although this effect is uniform for all water-ethanol mixtures, it reduces in mixtures with high weight-fractions of water because of the already reduced polarizability of an ethanol molecule due to hydrogen bonding. The combined effect of hydrogen bonding and increase in temperature due to the alternating high electric field even results in an increase in the magnitude of peak intensity for relatively low-weight fractions of ethanol.
This is a visual representation of the abstract.
Restricted accessResearch articleFirst published June, 2023pp. 623-635, Congyan Li, Fanglin Li , [...]To facilitate the design of an optical detection system for assessing rabbit meat quality, nine rabbits of different ages, weights, and varieties were used to collect optical coefficients, compositions, and microstructures from external oblique muscle (EOM) and internal oblique muscle (IOM) samples to research the relationship between them. The results show that rabbit age had a significant influence (
This is a visual representation of the abstract.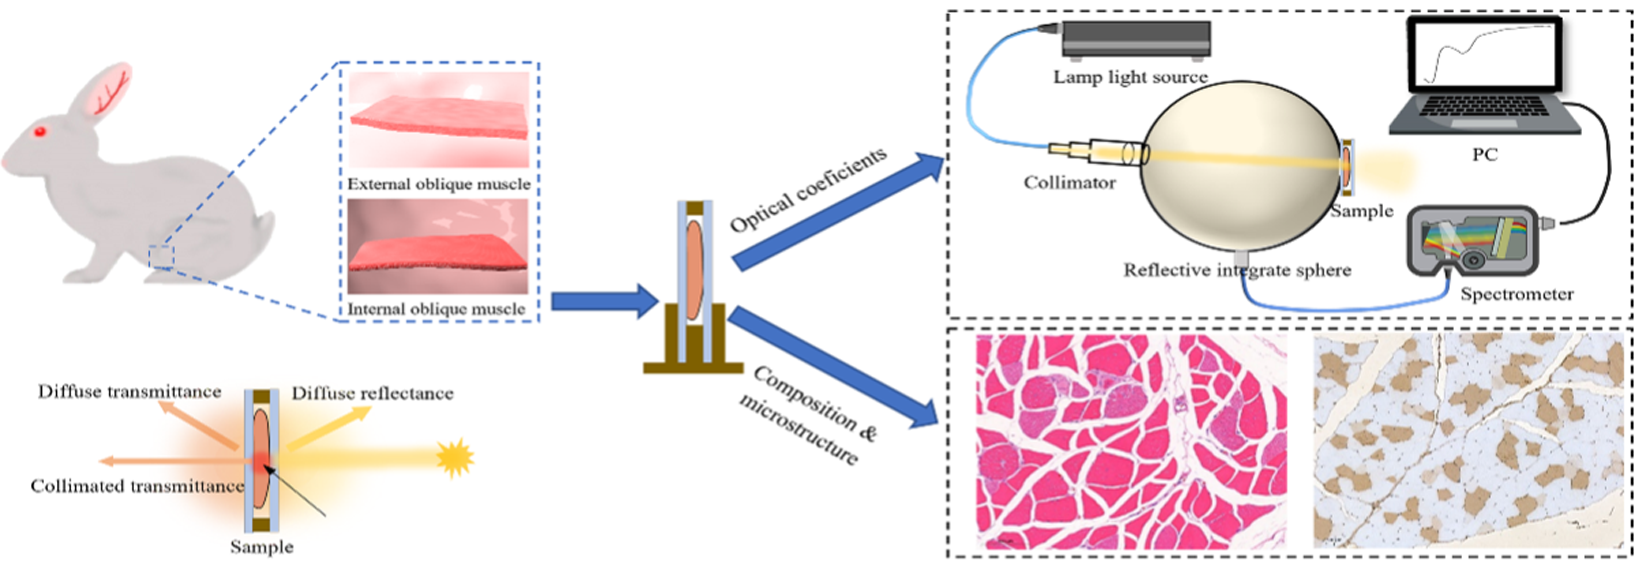
Restricted accessResearch articleFirst published June, 2023pp. 636-651Probes such as carbon dots (C-dots) have extensive and important applications in the quantitative analysis of complex biological and environmental systems. However, the development of probes is often hindered by incomplete selectivity, i.e., a probe that responds to one substance is also prone to respond to coexisting structurally similar substances. Therefore, the above dilemma often leads to be developed as semi-selective probes, so that the development of probes is abandoned halfway. This work shows how a semi-selective probe can enhance selectivity by combining a proper multivariate calibration model. Primarily, we developed a semi-selective fluorescent probe that responded to tetracyclines (TCs) with discarded tobacco leaves. Then, we introduced the multivariate quantitative fluorescence model (QFM) to enhance its selectivity and solve the problem of fluorescence spectral shift. For the determination of chlortetracycline (CTC) with this semi-selective C-dots probe in mineral and lake water samples and compared to the traditional quantitative model, the introduced QFM resulted in an average relative predictive error (ARPE) in mineral water spiked samples decreased from 57.1 to 5.6%, which reduced the ARPE in the lake water spiked samples from 18.1 to 4.7%. The above results show that the QFM-assisted semi-selective probe C-dots strategy (QFMC−dots) can enhance selectivity, and QFMC−dots achieved high-selective and accurate determination of CTC in interfering mineral and lake water samples, with the limit of detection and limit of quantitation of 0.55 and 1.66 μM, respectively. The proposed strategy of enhancing selectivity by introducing a proper multivariate calibration model can reduce the difficulty and increase success rate of developing probes, which can be expected to provide an interesting alternative for the development of probes, especially when encountering semi-selective problems.
This is a visual representation of the abstract.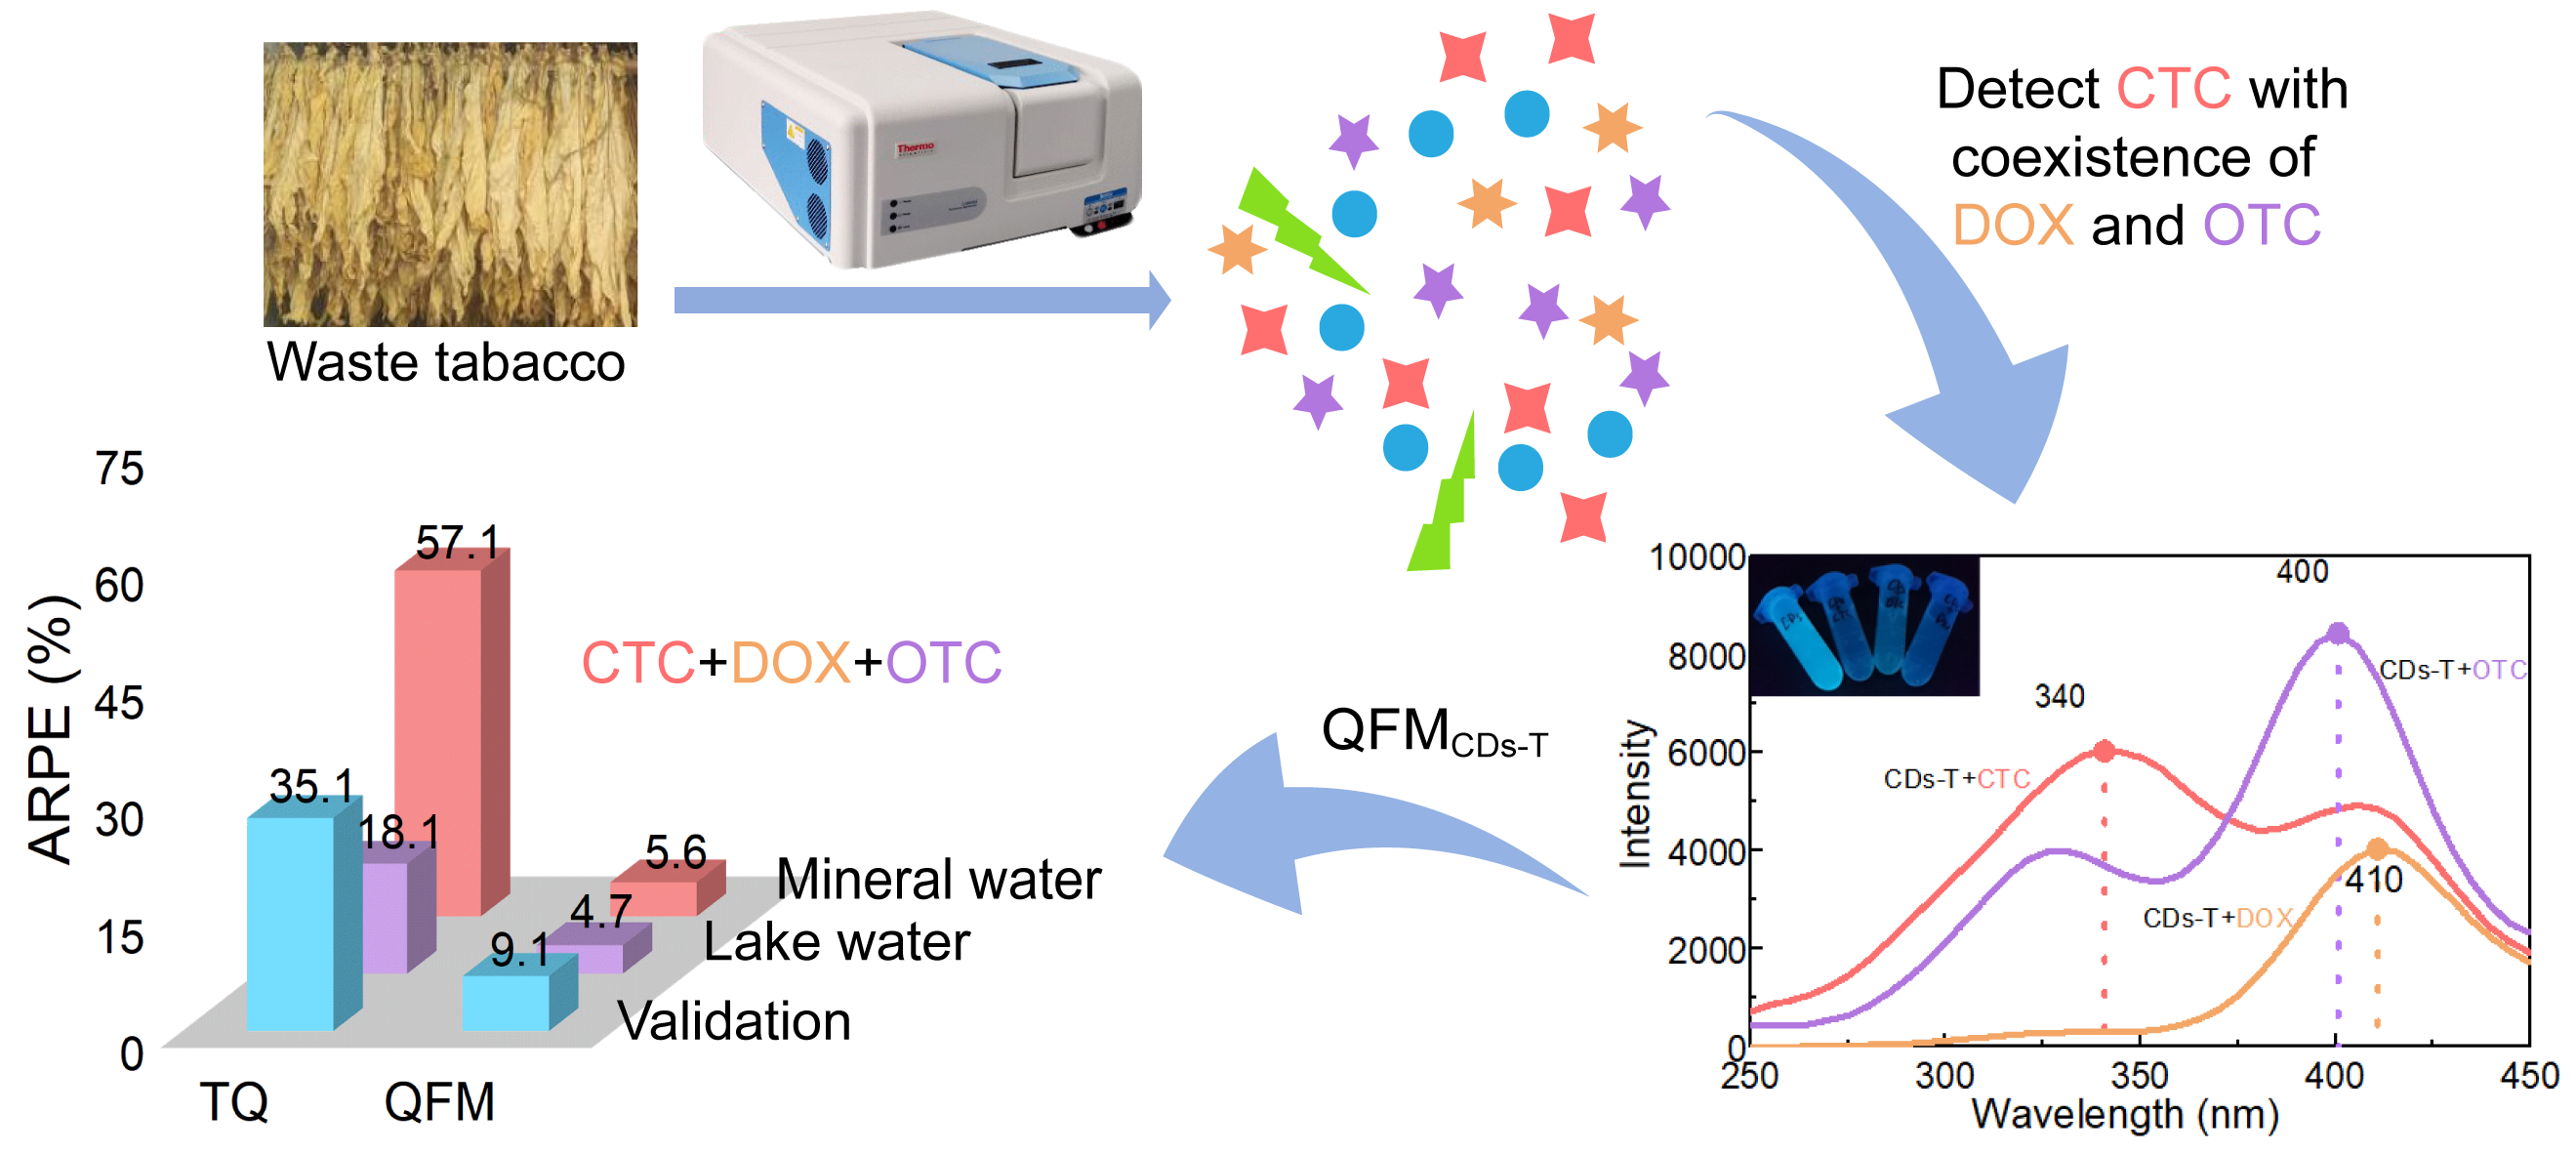
Restricted accessResearch articleFirst published June, 2023pp. 652-665Amorphous simvastatin (amorphous SIM) and Form I of SIM were prepared separately from SIM acetone (AC)/ethyl acetate (ETAC)/ethanol (ET) solutions by simply controlling the solvent evaporation rate, and the kinetic formation of amorphous SIM from SIM AC/ETAC/ET solutions was explained using mid-frequency Raman difference spectra analysis. The mid-frequency Raman difference spectra analysis results indicate that the amorphous phase has close connections with solutions and might be the bridge, playing an important role in the intermediate phase, between solutions and their outcome polymorphs.
This is a visual representation of the abstract.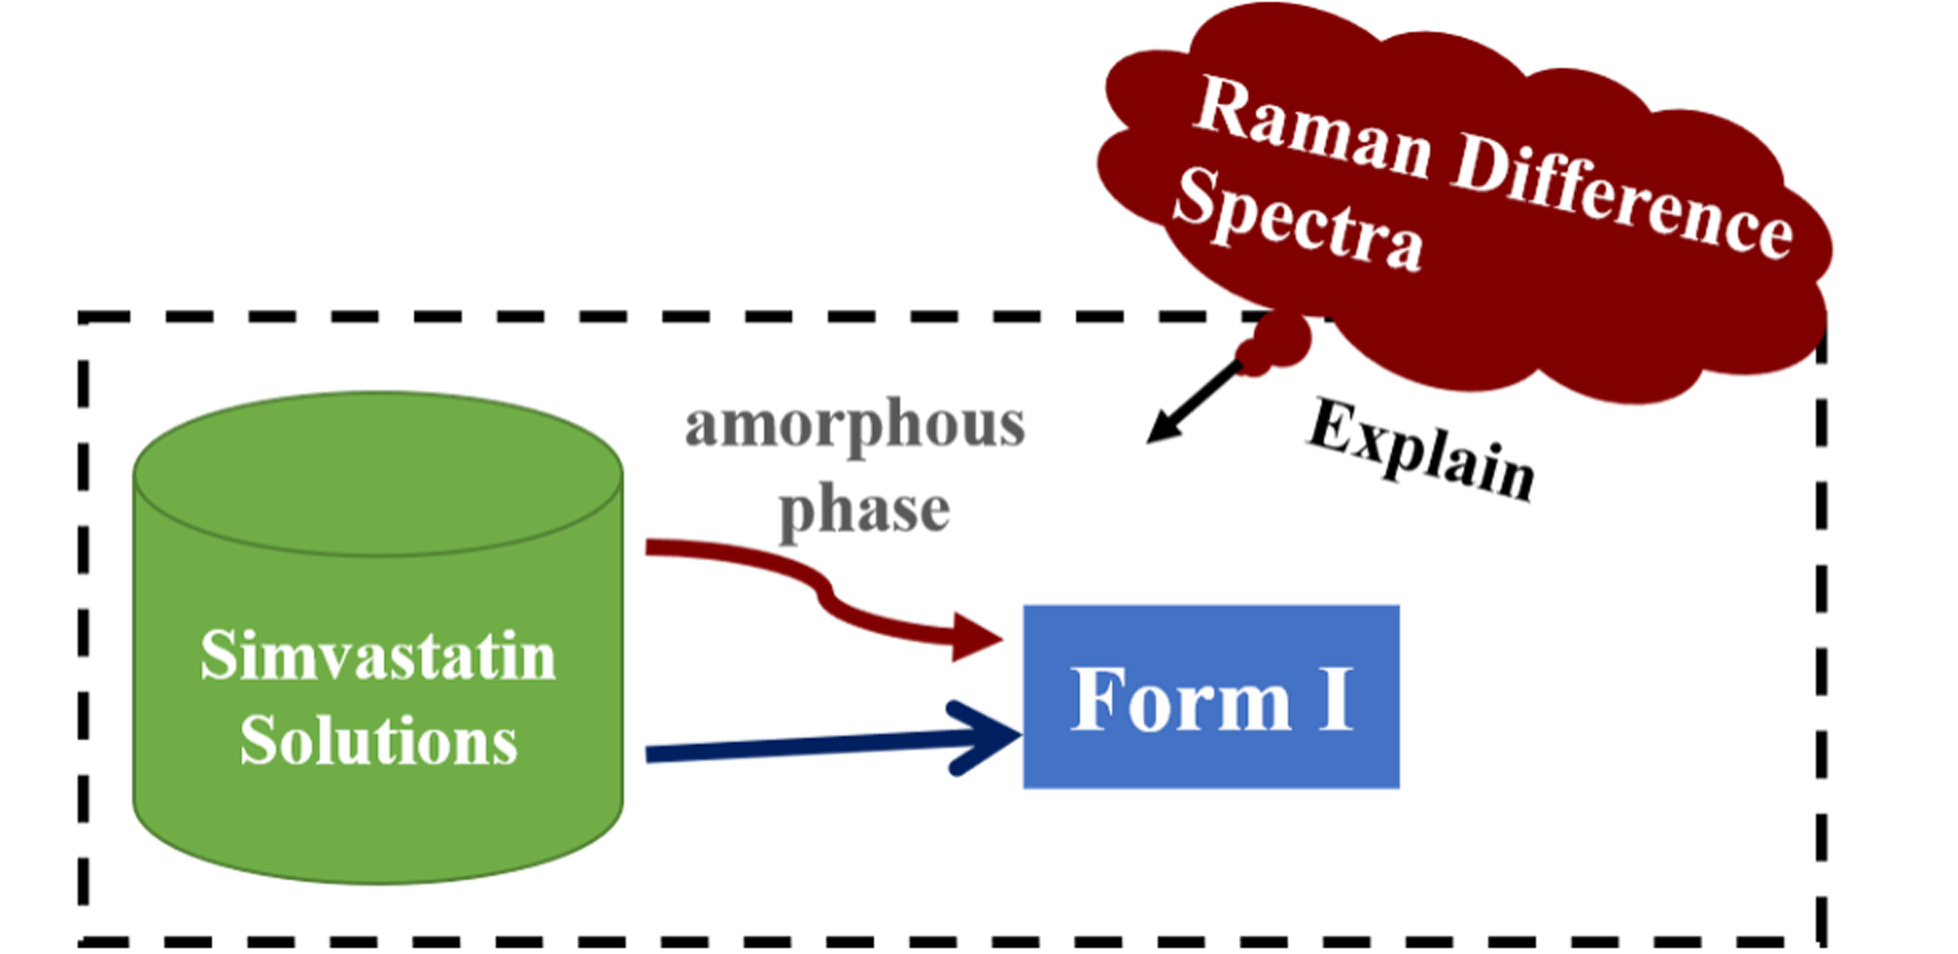
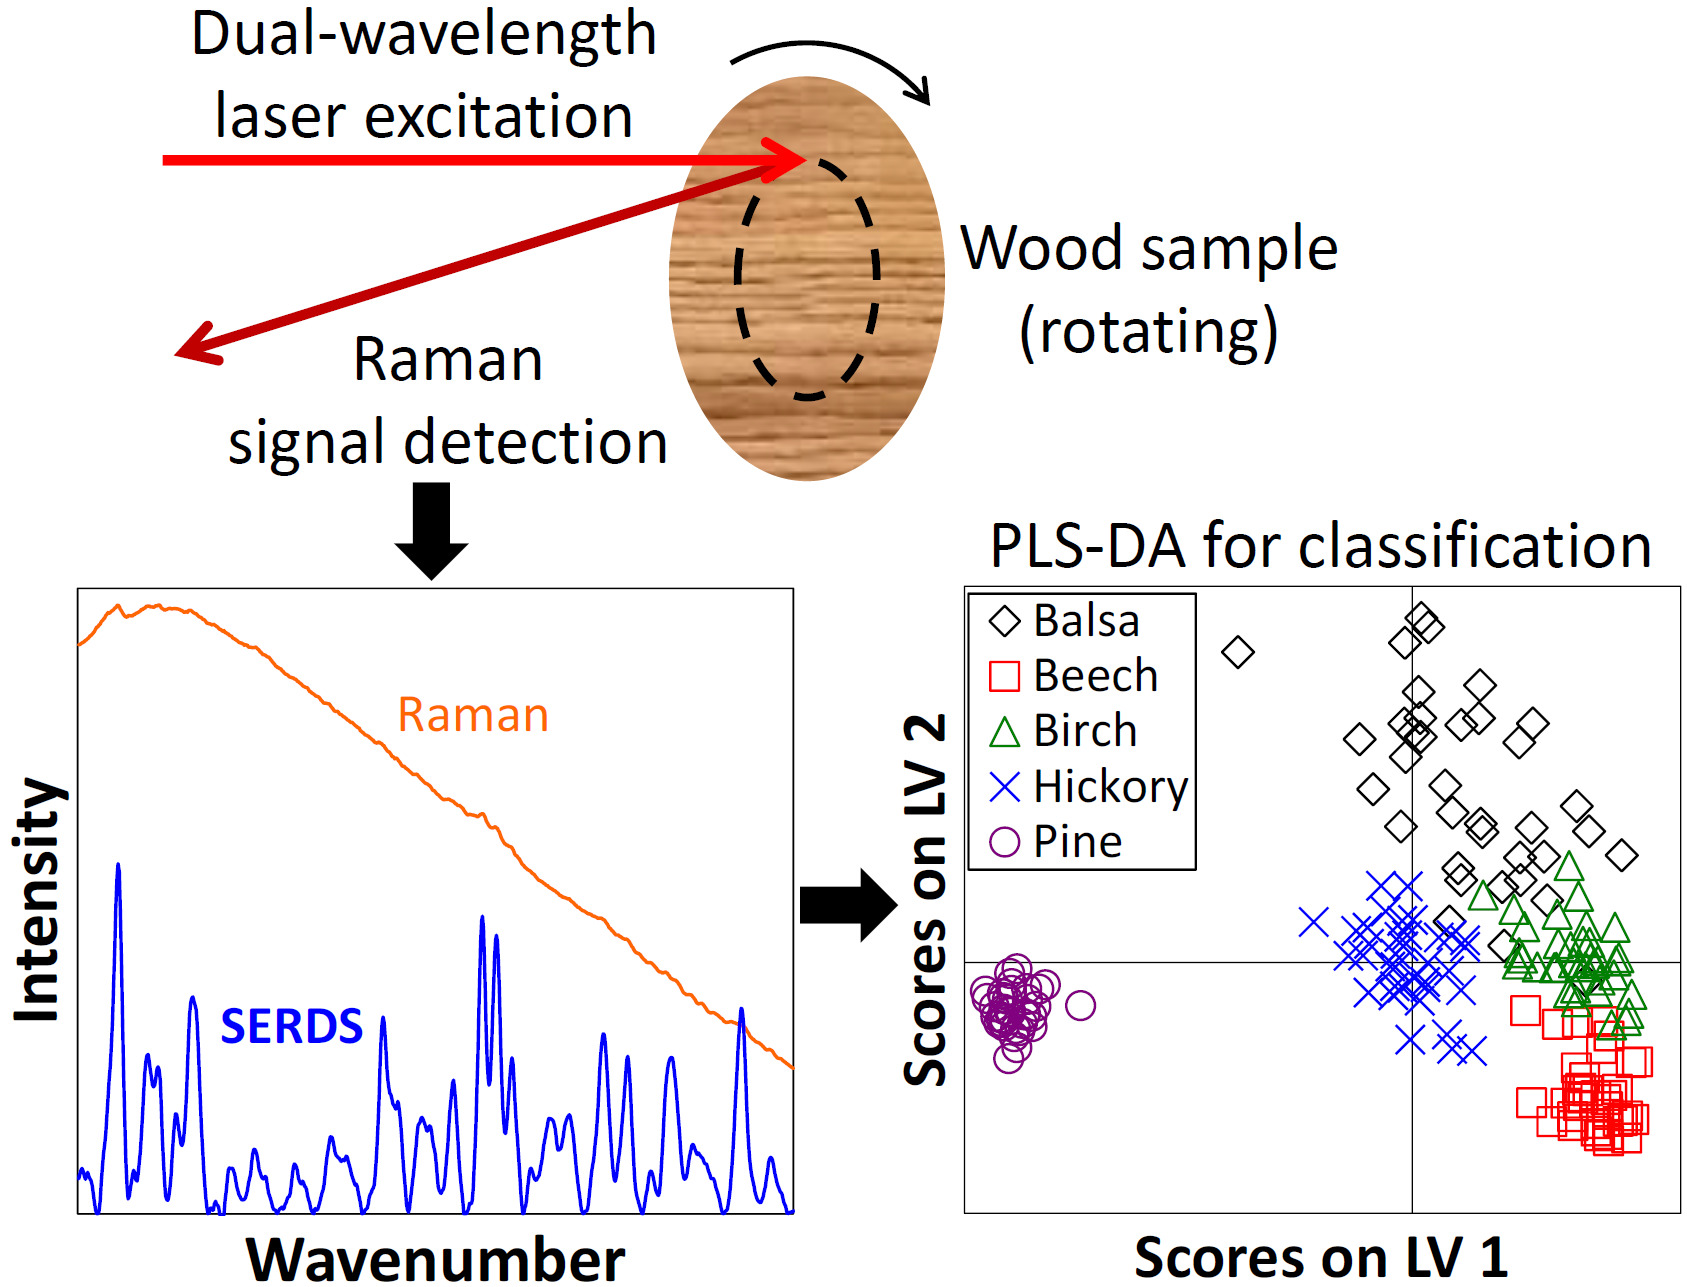
Restricted accessResearch articleFirst published June, 2023pp. 666-681Raman spectroscopy has found its way into a wide range of applications and is successfully applied for qualitative and quantitative studies. Despite significant technical progress over the last few decades, there are still some challenges that limit its more widespread usage. This paper presents a holistic approach to addressing simultaneously the problems of fluorescence interference, sample heterogeneity, and laser-induced sample heating. Long wavelength shifted excitation Raman difference spectroscopy (SERDS) at 830 nm excitation combined with wide-area illumination and sample rotation is presented as a suitable approach for the investigation of selected wood species. Wood as a natural specimen represents a well-suited model system for our study as it is fluorescent, heterogeneous, and susceptible to laser-induced modifications. Two different subacquisition times (50 and 100 ms) and two sample rotation speeds (12 and 60 r/min) were exemplarily assessed. Results demonstrate that SERDS can effectively separate the Raman spectroscopic fingerprints of the wood species balsa, beech, birch, hickory, and pine from intense fluorescence interference. Sample rotation in conjunction with 1 mm-diameter wide-area illumination was suitable to obtain representative SERDS spectra of the wood species within 4.6 s. Using partial least squares discriminant analysis, a classification accuracy of 99.4% for the five investigated wood species was realized. This study highlights the large potential of SERDS combined with wide-area illumination and sample rotation for the effective analysis of fluorescent, heterogeneous, and thermally sensitive specimens in a wide range of application areas.
This is a visual representation of the abstract.