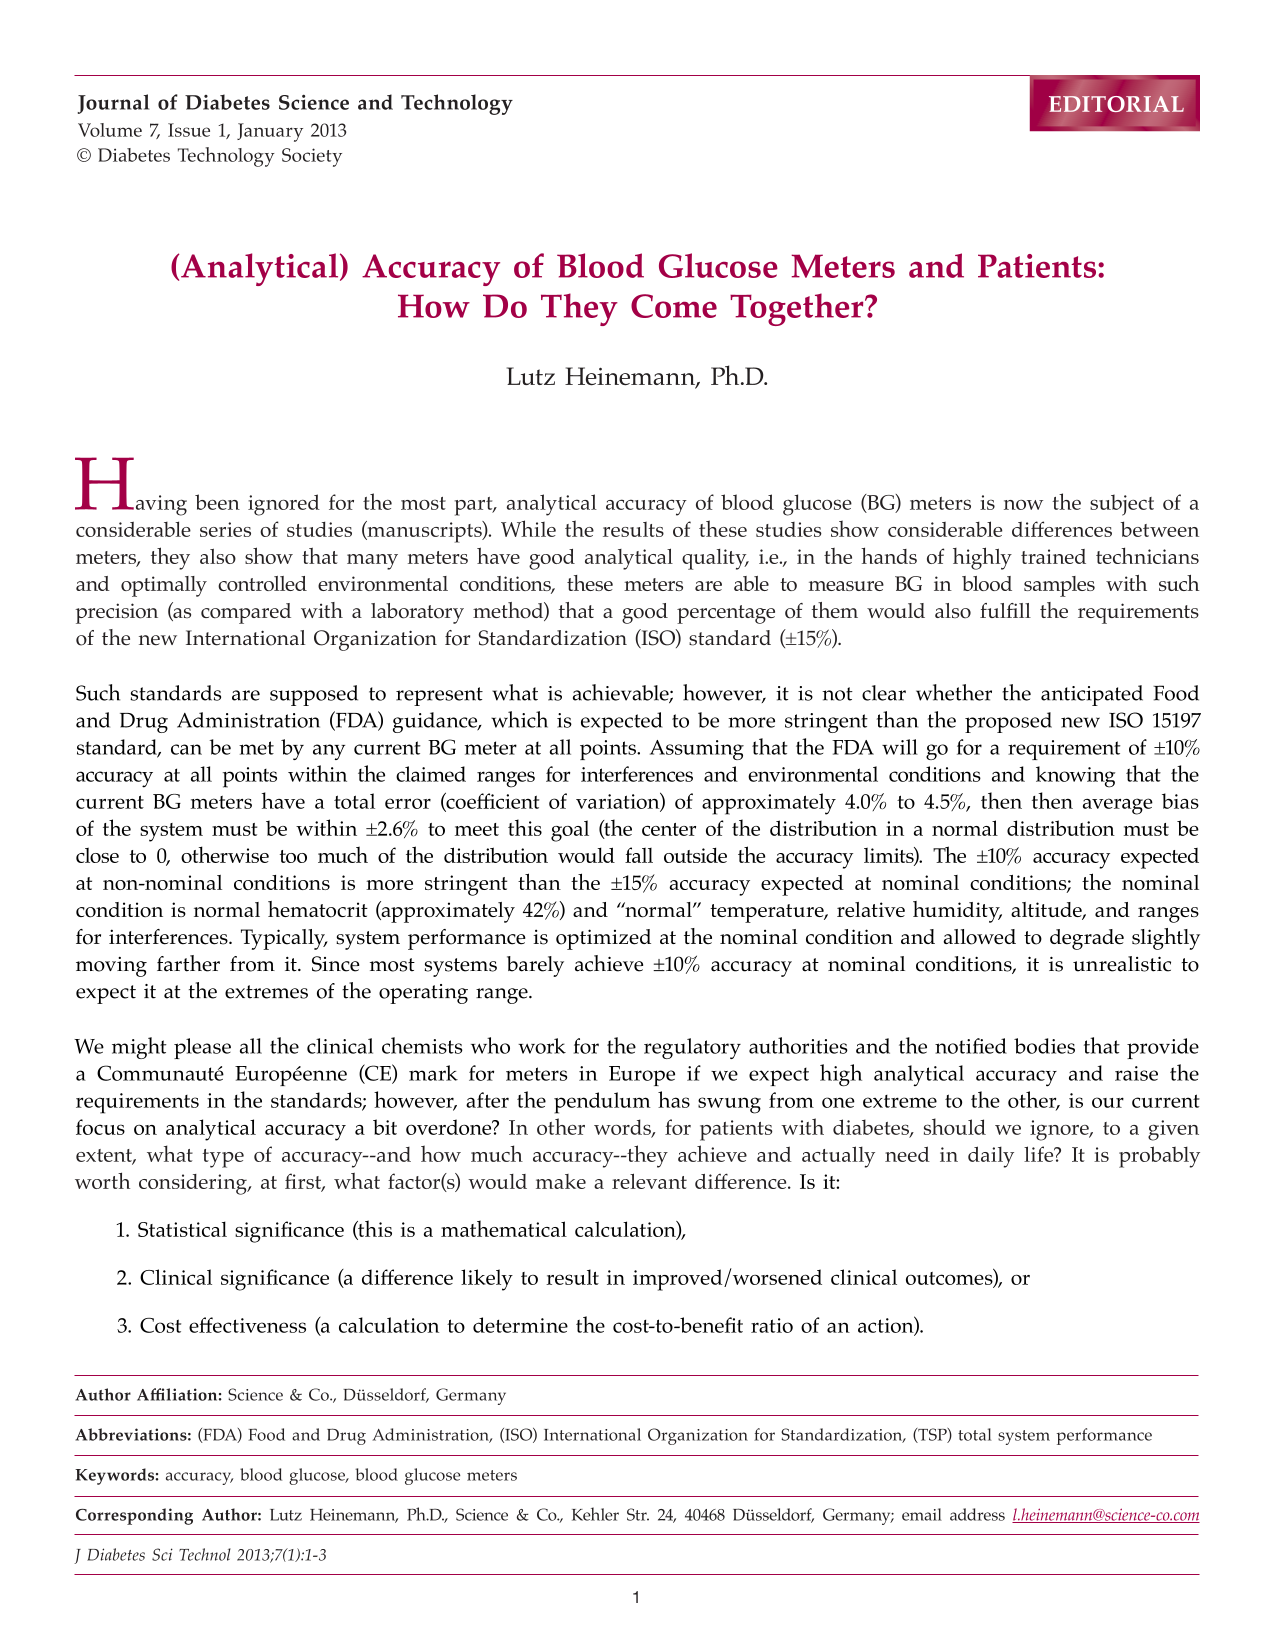
Editorial
 Free accessEditorialFirst published January, 2013pp. 1-3

Select search scope: search across all journals or within the current journal


 Free accessEditorialFirst published January, 2013pp. 1-3Free accessMeeting reportFirst published January, 2013pp. 4-12
Our motivation for this study was to develop a noninvasive glucose sensor for low birth weight neonates. We hypothesized that the underdeveloped skin of neonates will allow for the diffusion of glucose to the surface where it can be sampled noninvasively. On further study, we found that measurable amounts of glucose can also be collected on the skin of adults.
Cellulose acetate dialysis membrane was used as surrogate for preterm neonatal skin. Glucose on the surface was collected by saline-moistened swabs and analyzed with glucose-binding protein (GBP). The saline-moistened swab was also tested in the neonatal intensive care unit. Saline was directly applied on adult skin and collected for analysis with two methods: GBP and high-performance anion-exchange chromatography (HPAEC).
The amount of glucose on the membrane surface was found (1) to accumulate with time but gradually level off, (2) to be proportional to the swab dwell time, and (3) the concentration of the glucose solution on the opposite side of the membrane. The swab, however, failed to absorb glucose on neonatal skin. On direct application of saline onto adult skin, we were able to measure by HPAEC and GBP the amount of glucose collected on the surface. Blood glucose appears to track transdermal glucose levels.
We were able to measure trace amounts of glucose on the skin surface that appear to follow blood glucose levels. The present results show modest correlation with blood glucose. Nonetheless, this method may present a noninvasive alternative to tracking glucose trends.
Free accessMeeting reportFirst published January, 2013pp. 13-23This article describes a new fiber-coupled, percutaneous fluorescent continuous glucose monitoring (CGM) system that has shown 14 days of functionality in a human clinical trial.
The new optical CGM system (FiberSense) consists of a transdermal polymer optical fiber containing a biochemical glucose sensor and a small fluorescence photometer optically coupled to the fiber. The glucose-sensitive optical fiber was implanted in abdominal and upper-arm subcutaneous tissue of six diabetes patients and remained there for up to 14 days. The performance of the system was monitored during six visits to the study center during the trial. Blood glucose changes were induced by oral carbohydrate intake and insulin injections, and capillary blood glucose samples were obtained from the finger tip. The data were analyzed using linear regression and the consensus error grid analysis.
The FiberSense worn at the upper arm exhibited excellent results during 14 wearing days, with an overall mean absolute relative difference (MARD) of 8.3% and 94.6% of the data in zone A of the consensus error grid. At the abdominal application site, FiberSense resulted in a MARD of 11.4 %, with 93.8% of the data in zone A.
The FiberSense CGM system provided consistent, reliable measurements of subcutaneous glucose levels in human clinical trial patients with diabetes for up to 14 days.
Free accessMeeting reportFirst published January, 2013pp. 24-34To evaluate the feasibility of an implantable subconjunctival glucose monitoring system (SGMS) for long-term glucose monitoring, we investigated the
The SGMS consists of an implantable ocular mini implant (OMI) and a handheld fluorescence photometer. A clinical study was performed on 47 diabetes patients split into two cohorts. Two different types of OMI were used, with and without a biocompatible surface coating. Duration of the study was 1 year. Correlation between capillary blood glucose and SGMS-derived interstitial fluid glucose was investigated during the first 6 months of the study.
Both OMI types were tolerated well in the eyes of the patients. At the beginning of the study, the SGMS of both cohorts revealed a high accuracy with mean absolute relative difference (MARD) values of 7–12%. The performance of the uncoated OMIs deteriorated within 3 months of wearing time, exhibiting a MARD value of 20%. The performance of the surface-coated OMIs was preserved longer. Glucose correlation measurement with reasonable results (MARD of 14%) could be performed for up to 6 months of wear.
The biocompatible surface coating on the OMIs enabled a longer duration of action of up to 6 months compared with 3 months for uncoated implants in a clinical trial.
Free accessMeeting reportFirst published January, 2013pp. 35-44We assessed and compared the performance levels of a fiber-coupled fluorescence affinity sensor (FAS) for glucose detection in the intradermal tissue and intravascular bed during glucose clamping and insulin administration in a large animal model.
The FAS (BioTex Inc., Houston, TX) was implanted in interstitial tissue and in the intravenous space in nondiabetic, anesthetized pigs over 6–7 h. For intradermal assessment, a needle-type FAS was implanted in the upper back using a hypodermic needle. For intravenous assessment, the FAS was inserted through a catheter into the femoral artery and vein. Blood glucose changes were induced by infusion of dextrose and insulin through a catheterized ear or jugular vein.
Based on retrospective analysis, the mean absolute relative error (MARE) of the sensor in blood and interstitial tissue was 11.9% [standard deviation (SD) = ±9.6%] and 23.8% (SD = ±19.4%), respectively. When excluding data sets from sensors that were affected by exogenous insulin, the MARE for those sensors tested in interstitial tissue was reduced to 16.3% (SD = ±12.5%).
The study demonstrated that the performance level of the FAS device implanted in interstitial tissue and blood can be very high. However, under certain circumstances, exogenous insulin caused the glucose concentration in interstitial tissue to be lower than in blood, which resulted in an overall lower level of accuracy of the FAS device. How significant this physiological effect is in insulin-treated persons with diabetes remains to be seen. In contrast, the level of accuracy of the FAS device in blood was very high because of high mass transfer conditions in blood. While the use of the FAS in both body sites will need further validation, its application in critically ill patients looks particularly promising.
Free accessMeeting reportFirst published January, 2013pp. 45-52Fluorescence technique is one of the major solutions for achieving the continuous and noninvasive glucose sensor for diabetes. In this article, a highly sensitive nanostructured sensor is developed to detect extremely small amounts of aqueous glucose by applying fluorescence energy transfer (FRET). A one-pot method is applied to produce the dextran-fluorescein isothiocyanate (FITC)-conjugating mesoporous silica nanoparticles (MSNs), which afterward interact with the tetramethylrhodamine isothiocyanate (TRITC)-labeled concanavalin A (Con A) to form the FRET nanoparticles (FITC-dextran-Con A-TRITC@MSNs). The nanostructured glucose sensor is then formed via the self-assembly of the FRET nanoparticles on a transparent, flexible, and biocompatible substrate, e.g., poly(dimethylsiloxane). Our results indicate the diameter of the MSNs is 60 ± 5 nm. The difference in the images before and after adding 20 μl of glucose (0.10 mmol/liter) on the FRET sensor can be detected in less than 2 min by the laser confocal laser scanning microscope. The correlation between the ratio of fluorescence intensity, I(donor)/I(acceptor), of the FRET sensor and the concentration of aqueous glucose in the range of 0.04–4 mmol/liter has been investigated; a linear relationship is found. Furthermore, the durability of the nanostructured FRET sensor is evaluated for 5 days. In addition, the recorded images can be converted to digital images by obtaining the pixels from the resulting matrix using Matlab image processing functions. We have also studied the
Free accessMeeting reportFirst published January, 2013pp. 53-61Fluorescent glucose-sensitive nanosensors have previously been used
Glucose-sensitive nanosensors were encapsulated in two different commercially available gelling agents: gel 1 and gel 2. Multiple formulations of each gel were assessed
Five gel formulations had encapsulation efficiencies of the nanosensors greater than 90%. Additionally, they retained up to 20% and 40% of the nanosensors over 24 h for gel 1 and gel 2, respectively.
Encapsulating glucose nanosensors in two injectable gels prolonged nanosensor lifetime
Free accessMeeting reportFirst published January, 2013pp. 62-71We review progress in our laboratories toward developing
Free accessMeeting reportFirst published January, 2013pp. 72-87This article reviews research efforts on developing single-walled carbon nanotube (SWNT)-based near-infrared (NIR) optical glucose sensors toward long-term
Free accessResearch articleFirst published January, 2013pp. 88-92Estimation of glycemic variability requires frequent measures of glucose and is greatly aided by continuous glucose monitoring (CGM); however, under real-world conditions, missing data or “gaps” of ≥ 10 minutes can occur in CGM data, affecting the reliability of certain estimates. Thus, we determined the magnitude of the gap problem as observed in a cohort of patients with type 2 diabetes and demonstrated an approach to fill the gaps. The approach takes the difference between readings before and after a gap and distributes the difference equally across the number of missing readings, as determined by the sensor's setting for reading frequency. The approach is easy to implement, conservative, and improves estimation of variability measures that reference time, namely, mean of daily differences and continuous overlapping net glycemic action.
Free accessResearch articleFirst published January, 2013pp. 93-99Tight glycemic control in type 1 diabetes mellitus (T1DM) may be accomplished only if severe hypoglycemia can be prevented. Biosensor alarms based on the body's reactions to hypoglycemia have been suggested. In the present study, we analyzed three lead electrocardiogram (ECG) and single-channel electroencephalogram (EEG) in T1DM patients during hypoglycemia.
Electrocardiogram and EEG recordings during insulin-induced hypoglycemia in nine patients were used to assess the presence of ECG changes by heart rate, and estimates of QT interval (QTc) and time from top of T wave to end of T wave corrected for heartbeat interval and EEG changes by extraction of the power of the signal in the delta, theta, and alpha bands. These six features were assessed continuously to determine the time between changes and severe hypoglycemia.
QT interval changes and EEG theta power changes were detected in six and eight out of nine subjects, respectively. Rate of false positive calculations was one out of nine subjects for QTc and none for EEG theta power. Detection time medians (i.e., time from significant changes to termination of experiments) was 13 and 8 min for the EEG theta power and QTc feature, respectively, with no significant difference (p = .25).
Severe hypoglycemia is preceded by changes in both ECG and EEG features in most cases. Electroencephalogram theta power may be superior with respect to timing, sensitivity, and specificity of severe hypoglycemia detection. A multiparameter algorithm that combines data from different biosensors might be considered.
Free accessResearch articleFirst published January, 2013pp. 100-110Insulin resistance (IR) can precede the dysglycemic states of prediabetes and type 2 diabetes mellitus (T2DM) by a number of years and is an early marker of risk for metabolic and cardiovascular disease. There is an unmet need for a simple method to measure IR that can be used for routine screening, prospective study, risk assessment, and therapeutic monitoring. We have reported several metabolites whose fasting plasma levels correlated with insulin sensitivity. These metabolites were used in the development of a novel test for IR and prediabetes.
Data from the Relationship between Insulin Sensitivity and Cardiovascular Disease Study were used in an iterative process of algorithm development to define the best combination of metabolites for predicting the M value derived from the hyperinsulinemic euglycemic clamp, the gold standard measure of IR. Subjects were divided into a training set and a test set for algorithm development and validation. The resulting calculated M score, MQ, was utilized to predict IR and the risk of progressing from normal glucose tolerance to impaired glucose tolerance (IGT) over a 3 year period.
MQ correlated with actual M values, with an
The result, Quantose™, is a simple test for IR based on a single fasting blood sample and may have value as an early indicator of risk for the development of prediabetes and T2DM.
Free accessResearch articleFirst published January, 2013pp. 111-118The benefit of mobile health (mHealth) on diabetes management among low-income, inner-city patients is largely unknown, particularly for Latino patients. TExT-MED (Trial to Examine Text Message for Emergency Department Patients with Diabetes) is a text message-based program designed to improve disease knowledge, self-efficacy, and glycemic control among low-income, inner-city Latinos. In phase I, 23 patients participated in an acceptability and feasibility study. Contrary to our model, there was no increase in knowledge despite increases in self-efficacy and healthy behaviors. In phase II, we performed a mixed-methods analysis to understand how TExT-MED achieved these seemingly contradictory findings.
We performed a qualitative analysis of focus groups with patients from phase I. We explored patients' receipt of health information from TExT-MED and other information sources. We used these qualitative findings to perform a mixed-methods analysis of the outcomes from phase I, reanalyzing the quantitative measures of self-efficacy, diabetes knowledge, and healthy behaviors.
We conducted two focus groups, one in English and one in Spanish. Through qualitative analysis, we found gender differences in information sources, dietary self-efficacy, and desired educational content. Applying this knowledge, we re-stratified phase I outcomes by gender and found differential changes in diabetes knowledge, self-efficacy, and behaviors. Men had increased self-efficacy while women showed increased knowledge.
The efficacy of mHealth on diabetes management was affected by gender. Specifically, men and women differ in their dietary self-efficacy, information sources, and desired topics in future mHealth interventions. To achieve maximal impact, future mHealth interventions should be mindful of this gender difference.
Free accessResearch articleFirst published January, 2013pp. 119-122The implementation of electronic health records (EHRs) may support evaluations of health care delivery, such as the prescription of newly approved medications, to adults with diabetes. We aimed to evaluate prescribing patterns of thiazolidinediones and novel glucose-lowering drug classes using electronic prescribing data contained in an outpatient EHR from 2002–2010.
We identified adults with type 2 diabetes seen from 2002–2010 who were newly prescribed rosiglitazone (ROSI), pioglitazone (PIO), or a novel glucose-lowering drug class (other). The annual number of new prescriptions and their relative percentages (per 1000 patients) were calculated.
From 2002–2010, 6209 patients with type 2 diabetes were newly prescribed 8858 eligible medications. In 2006, ROSI and PIO accounted for 44% and 37% of new prescriptions, respectively. After 2007, the relative percentage of new ROSI prescriptions declined more rapidly than PIO prescriptions, falling to 7% and 47% of peak levels, respectively, by 2010. By 2010, the relative percentages of new ROSI, PIO, and other prescriptions were 2%, 18%, and 80%, respectively.
Evaluations of EHR data represent a cost-effective method for evaluating diabetes medications with new Food and Drug Administration warnings or indications. Validation of demographic and clinical data will expand the scope of EHR-based evaluations of health care delivery and outcomes for adults with diabetes.
Free accessResearch articleFirst published January, 2013pp. 123-134Telehealth-supported clinical interventions may improve diabetes self-management. We explored the feasibility of stepwise self-titration of oral glucose-lowering medication guided by a mobile telephone-based telehealth platform for improving glycemic control in type 2 diabetes.
We recruited 14 type 2 diabetes patients to a one-year feasibility study with 1:1 randomization. Intervention group patients followed a stepwise treatment plan for titration of oral glucose-lowering medication with self-monitoring of glycemia using real-time graphical feedback on a mobile telephone and remote nurse monitoring using a Web-based tool. We carried out an interim analysis at 6 months.
We screened 3476 type 2 diabetes patients; 94% of the ineligible did not meet the eligibility criteria for hemoglobin A1c (HbA1c) or current treatment. Mean (standard deviation) patient age at baseline was 58 (11) years, HbA1c was 65 (12) mmol/mol (8.1% [1.1%]), body mass index was 32.9 (6.4) kg/m2, median [interquartile range (IQR)] diabetes duration was 2.6 (0.6 to 4.7) years, and 10 (71%) were men. The median (IQR) change in HbA1c from baseline to six months was −10 (−21 to 3) mmol/mol (−0.9% [-1.9% to 0%]) in the intervention group and −5 (−13 to 6) mmol/mol (−0.5% [-1.2% to 0.6%]) in the control group. Six out of seven intervention group patients and four out of seven control group patients changed their oral glucose-lowering medication (
Self-titration of oral glucose-lowering medication in type 2 diabetes with self-monitoring and remote monitoring of glycemia is feasible, and further studies using adapted recruitment strategies are required to evaluate whether it improves clinical outcomes.
Free accessResearch articleFirst published January, 2013pp. 135-143An important task in diabetes management is detection of hypoglycemia. Professional continuous glucose monitoring (CGM), which produces a glucose reading every 5 min, is a powerful tool for retrospective identification of unrecognized hypoglycemia. Unfortunately, CGM devices tend to be inaccurate, especially in the hypoglycemic range, which limits their applicability for hypoglycemia detection. The objective of this study was to develop an automated pattern recognition algorithm to detect hypoglycemic events in retrospective, professional CGM.
Continuous glucose monitoring and plasma glucose (PG) readings were obtained from 17 data sets of 10 type 1 diabetes patients undergoing insulin-induced hypoglycemia. The CGM readings were automatically classified into a hypoglycemic group and a nonhypoglycemic group on the basis of different features from CGM readings and insulin injection. The classification was evaluated by comparing the automated classification with PG using sample-based and event-based sensitivity and specificity measures.
With an event-based sensitivity of 100%, the algorithm produced only one false hypoglycemia detection. The sample-based sensitivity and specificity levels were 78% and 96%, respectively.
The automated pattern recognition algorithm provides a new approach for detecting unrecognized hypoglycemic events in professional CGM data. The tool may assist physicians and diabetologists in conducting a more thorough evaluation of the diabetes patient's glycemic control and in initiating necessary measures for improving glycemic control.
Free accessResearch articleFirst published January, 2013pp. 144-152Blood glucose data are frequently used in clinical decision making, thus it is critical that self-monitoring of blood glucose (SMBG) systems consistently provide accurate results. Concerns about SMBG accuracy have prompted the development of newly proposed International Organization for Standardization (ISO) standards: ≥95% of individual glucose results shall fall within ±15 mg/dl of the results of the manufacturer's reference procedure at glucose concentrations <100 mg/dl and within ±15% for values >100 mg/dl. We evaluated seven marketed systems against the current and proposed ISO criteria (criterion A).
Capillary blood samples were collected from 100 subjects and tested on seven systems: Accu-Chek Aviva Plus, Advocate Redi-Code, Element, Embrace, Prodigy Voice, TRUEbalance, and WaveSense Presto. Results were compared with manufacturer's documented reference system, YSI or perchloric acid hexokinase; three different strip lots from each system were tested on each subject, in duplicate.
Compared against current ISO criteria (≥95% within ±15 mg/dl for values <75 mg/dl and ±20% for values ≥75 mg/dl) the Accu-Chek Aviva Plus, Element, and WaveSense Presto systems met accuracy criteria. However, only the Accu-Chek Aviva Plus met the proposed ISO criteria (criterion A) in all three lots. The other six systems failed to meet the criteria in at least two of the three lots, showing lot-to-lot variability, high/low bias, and variations due to hematocrit.
Inaccurate SMBG readings can potentially adversely impact clinical decision making and outcomes. Clinicians can reduce controllable variables by prescribing accurate SMBG systems. Adherence to the proposed ISO criteria should enhance patient safety by improving the accuracy of SMBG systems.
Free accessResearch articleFirst published January, 2013pp. 153-155The article by Brzag and coauthors in this issue of
Free accessResearch articleFirst published January, 2013pp. 156-162There is a need for patients to be able to adjust their insulin doses accurately and independently during continuous subcutaneous insulin infusion (CSII) therapy in order to avoid glycemic excursions and improve glycemic control. Use of new technology has the potential to aid patients in visualizing their circadian patterns and improving their understanding of data provided by self-monitored blood glucose (SMBG) measurements.
A 24-week crossover study was performed in 25 patients with type 1 diabetes mellitus using CSII and SMBG. Patients were randomized either to entering blood glucose data into handwritten logbooks or to using the Accu-Chek SmartPix information management system (IMS) coupled with instructions from a training manual to aid interpretation of the IMS readings. Patients analyzed these chart readings every 2 weeks, and outpatient visits were scheduled for both arms every 6 weeks.
There was a significantly lower mean overall blood glucose level with the IMS compared with use of a logbook (139 ± 16.2 versus 150 ± 19.8 mg/dl; Δ = 10.8 mg/dl;
The use of an IMS, coupled with an easily understood training manual, enables patients to improve glycemic control by performing accurate and timely self-adjustments to their insulin regimens.
Free accessResearch articleFirst published January, 2013pp. 163-166Health care professionals (HCPs) routinely review handwritten blood glucose (BG) logbooks during office visits of patients with diabetes.
In this study, 64 HCPs were asked to assess glycemic patterns and estimate BG averages in six simulated handwritten logbooks. The HCPs then reviewed the pattern logs and averages in six OneTouch® Verio™IQ meters containing corresponding data sets.
The average time needed for pattern review was 7.3 min for handwritten logbooks versus 0.9 min using the meter. The total error rate for logbook pattern identification was 43.0% compared with the meter. The mean percentage deviation between HCP estimates of 30-day BG averages and actual values was 14.5%.
The meter is associated with faster and more accurate pattern analysis compared with handwritten logbooks.
Free accessResearch articleFirst published January, 2013pp. 167-169The OneTouch® Verio™ IQ Meter with PatternAlert™ Technology has been approved by the U.S. Food and Drug Administration as the first self-glucose monitor that can automatically determine glycemic patterns [high and low pre-meal blood glucose (BG)] for health care providers (HCPs) and patients. In this issue of
Free accessResearch articleFirst published January, 2013pp. 170-178We performed a blood glucose meter hematocrit (HCT) interference test with lower sample manipulation requirements by using blood samples from patients with different blood glucose (BG) levels.
Blood from five patients with different BG levels (2.8, 5.6, 8.3, 13.9, 19.4 mmol/liter) was manipulated to contain five different HCT concentrations (35/40/45/50/55%). Each sample was measured three times in parallel with 14 BG testing devices (reference method: YSI 2300 STAT Plus™ Glucose Analyzer). The largest mean deviations in both directions from the reference method (normalized to 100% at 45% HCT) were added as a measure for hematocrit interference factor (HIF). A HIF >10% was considered to represent clinically relevant HCT interference.
Few devices showed no clinically relevant HCT interference at high/low BG levels: BGStar® (7.2%, 7.3%), iBGStar® (9.0%, 8.6%), Contour® (10.0%, 4.6%), OneTouch® Verio™ 2 (10.0%, 5.2%), and GlucoMen® LX (7.2%, 5.1%). Other devices showed interference at one or both glucose ranges: ACCU-CHEK® Aviva (12.6%, 10.7%), Aviva Nano (7.2%, 10.5%), Breeze2 (3.6%, 30.2%), GlucoCard G+ (12.6%, 7.0%), OneTouch® Ultra®2 (12.6%, 25.6%), FreeStyle Freedom Lite® (9.0%, 11.0%), Precision Xceed (16.2%, 15.3%), and MediTouch® (19.8%, 28.0%). The deviations in all devices were less pronounced in the HCT range of 35–50%.
The results of this trial with less sample manipulation (HCT only) confirmed previous examinations with HCT and glucose manipulation. The same devices showed HCT stability as previously observed. Artificial sample manipulation may be less crucial than expected when evaluating HCT interference.
Free accessResearch articleFirst published January, 2013pp. 179-189Abnormal hematocrit levels may interfere with glucose readings of patient self-assessment blood glucose (BG) meters. The aim of this laboratory investigation was to assess the potential influence of hematocrit variations on a variety of BG meters applying different measurement technologies.
Venous heparinized blood was manipulated to contain three different BG concentrations (50–90, 120–180, and 280–350 mg/dl) and five different hematocrit levels (25%, 35%, 45%, 55%, and 65%). After careful oxygenation to normal blood oxygen pressure (65–100 mmHg), each sample was measured (eight times) with the following devices: Accu-Chek® Aviva, Nano, and Active, Breeze®2 and Contour®, FreeStyle Freedom Lite®, GlucoDr. auto™, Glucofix® mio Plus, GlucoLab™, GlucoMen® LX Plus, Nova Max® Link, Nova Max® Plus, OneTouch® Ultra®2 and Verio®, On Call® Plus and Platinum, Optium Xceed®, Precision Xceed®, and TaiDoc Fora TD-4227. A YSI 2300 STAT Plus™ glucose analyzer served as reference method. Stability to hematocrit influence was assumed, with <10% mean glucose result bias between the highest and lowest hematocrit levels.
Six of the investigated meters showed a stable performance in this investigation: Accu-Chek Active (7%), Glucofix mio Plus (5%), GlucoMen LX Plus (4%), NovaMax Plus (4%), Nova Max Link (7%), and OneTouch Verio (3%). All other meters failed this hematocrit interference test, with FreeStyle Freedom Lite (11%), and On Call Platinum 12%) being the better devices and On Call Plus (68%), GlucoLab (51%), TaiDoc Fora TD-4227 (39%), and Breeze 2 (38%) showing the worst performance.
Hematocrit may affect BG meter performance in daily routine. In case of interference, low hematocrit values (<35%) result in too high readings. Our results encourage use of meters that are not affected by hematocrit interference.
Free accessResearch articleFirst published January, 2013pp. 190-192Many self-monitoring of blood glucose (SMBG) systems have generated artefactually increased glucose results in low-hematocrit patients (e.g., intensive care unit and renal failure patients); conversely, these devices could produce artefactually decreased glucose results in high-hematocrit patients (e.g., neonates). The introduction of hematocrit-independent SMBG systems permits more accurate testing in anemic or polycythemic individuals. In this issue of
Free accessResearch articleFirst published January, 2013pp. 193-201Glucose homeostasis is the result of complex interactions across different biological levels. This multilevel characteristic should be considered when analyzing and designing closed-loop glucose control algorithms. Classic control schemes use only a pharmacokinetic-pharmacodynamic (PKPD) perspective to describe the glucoregulatory system.
A multilevel model combining a PKPD model with an insulin signaling model is proposed for patients with type 1 diabetes mellitus T1DM (T1DM). The PKPD Dalla Man model for T1DM is expanded to include an intracellular level involving insulin signaling to control glucose uptake through glucose transporter type 4 (GLUT4) translocation. A model-based controller is then designed and used as an example to illustrate the feasibility of the proposal.
Two significant results were obtained for the controller explicitly utilizing multilevel information. No hypoglycemic events were registered and an excellent performance for interpatient variability was achieved. Controller performance was evaluated using two indexes. The glucose was kept inside the range (70–180) mg/dl more than 99% of the time, and the intrapatient variability measured using control variability grid analysis was solid with 90% of the population inside the target zone.
Multilevel models open new possibilities for designing glucose control algorithms. They allow controllers to take into account variables that have a strong influence on glucose homeostasis. A model-based controller was used for demonstrating how improved knowledge of the multilevel nature of diabetes increases the robustness and performance of glucose control algorithms. Using the proposed multilevel approach, a reduction of the hypoglycemic risk and robust behaviour for intrapatient variability was demonstrated.
Free accessResearch articleFirst published January, 2013pp. 206-214Hypoglycemia caused by intensive insulin therapy is a major challenge for artificial pancreas systems. Early detection and prevention of potential hypoglycemia are essential for the acceptance of fully automated artificial pancreas systems. Many of the proposed alarm systems are based on interpretation of recent values or trends in glucose values. In the present study, subject-specific linear models are introduced to capture glucose variations and predict future blood glucose concentrations. These models can be used in early alarm systems of potential hypoglycemia.
A recursive autoregressive partial least squares (RARPLS) algorithm is used to model the continuous glucose monitoring sensor data and predict future glucose concentrations for use in hypoglycemia alarm systems. The partial least squares models constructed are updated recursively at each sampling step with a moving window. An early hypoglycemia alarm algorithm using these models is proposed and evaluated.
Glucose prediction models based on real-time filtered data has a root mean squared error of 7.79 and a sum of squares of glucose prediction error of 7.35% for six-step-ahead (30 min) glucose predictions. The early alarm systems based on RARPLS shows good performance. A sensitivity of 86% and a false alarm rate of 0.42 false positive/day are obtained for the early alarm system based on six-step-ahead predicted glucose values with an average early detection time of 25.25 min.
The RARPLS models developed provide satisfactory glucose prediction with relatively smaller error than other proposed algorithms and are good candidates to forecast and warn about potential hypoglycemia unless preventive action is taken far in advance.
Free accessResearch articleFirst published January, 2013pp. 215-226Because of the slow pharmacokinetics of subcutaneous (SC) insulin, avoiding postprandial hyperglycemia has been a major challenge for an artificial pancreas (AP) using SC insulin without a meal announcement.
A semiautomated AP with Technosphere® Insulin (TI; MannKind Corporation, Valencia, CA) was designed to combine pulmonary and SC insulin. Manual inhalation of 10 U ultrafast-absorbing TI at mealtime delivers the first, or cephalic, phase of insulin, and an SC insulin pump controlled by zone model predictive controller delivers second-phase and basal insulin. This AP design was evaluated on 100 in silico subjects from the University of Virginia/Padova metabolic simulator using a protocol of two 50 g carbohydrate (CHO) meals and two 15 g CHO snacks.
Simulation analysis shows that the semiautomated AP with TI provides 32% and 16% more time in the controller target zone (80–140 mg/dl) during the 4 h postprandial period, with 39 and 20 mg/dl lower postprandial blood glucose peak on average than the pure feedback AP and the AP with manual feed-forward SC bolus, respectively. No severe hypoglycemia (<50 mg/dl) was observed in any cases.
The semiautomated AP with TI provides maximum time in the clinically accepted region when compared with pure feedback AP and AP with manual feed-forward SC bolus. Furthermore, the semiautomated AP with TI provides a flexible operation (optional TI inhalation) with minimal user interaction, where the controller design can be tailored to specific user needs and abilities to interact with the device.
Free accessResearch articleFirst published January, 2013pp. 227-237The size and geometry of an insulin depot that is formed during subcutaneous administration by an insulin pump is evaluated. A novel method is used to visualize accurately the depot formation for small volumes of insulin (of the order of 10–100 μl) at a given point in time. Conventional visualization methods such as magnetic resonance imaging are unable to provide such accurate measurements because of their coarse imaging resolution and long measurement time.
The described method consists of subcutaneously infusing dyed insulin into porcine tissue and subsequently shock freezing it with liquid nitrogen. The frozen sample is then sliced into thin layers using a cryomicrotome. A digital image of each layer is taken and then processed with proprietary software, which identifies the dyed areas on each layer and reconstructs a three-dimensional model of the insulin depot with a planar resolution of 30 × 30 μm2 and a depth resolution of 100 μm. Since this process is not viable for living organisms, porcine tissue was used immediately following slaughter of the animal.
To date, it is most often assumed that the insulin depot takes the shape of a sphere around the tip of the cannula (e.g., 50 μl insulin equates to a spherical radius of 2.3 mm). However, in practice, such a depot form is never observed. Instead, the insulin depot initially spreads laterally (i.e., parallel) to the skin surface and in the collagen matrix that binds the adipose cells together. The depot outreach increases with larger infused volumes, e.g., maximum outreach measured at 5.0/5.7/7.1 mm (quartiles,
It is concluded that formation of the insulin depot depends on the opening of channels at the boundaries between adipose cells. Hence the insulin follows a path of least resistance and depot formation is determined by the local structure of the subcutaneous tissue.
Free accessReview articleFirst published January, 2013pp. 238-246According to large randomized trials, results suggest that maintaining normoglycemia postoperatively through tight glycemic control (TGC) and intensive insulin therapy (IIT) can improve surgical outcomes as well as reduce mortality and morbidity in critically ill patients. However, trials examining the effects of TGC have had conflicting results. Systematic reviews and meta-analyses have also led to differing conclusions. The main reason these clinical trials and meta-analyses show negative results for TGC is the high incidence of hypoglycemia induced by IIT. This could not be prevented because there is no reliable technique that can avoid this condition during IIT. The development of accurate, continuous blood glucose monitoring devices and closed-loop systems for computer-assisted blood glucose control in the intensive care unit (ICU) will probably help avoid hypoglycemia in these situations.
The STG closed-loop glycemic control system was introduced to our department to be used and evaluated for strict serum glucose control with no hypoglycemic episodes during IIT in the surgical ICU, to reduce the workload of ICU nurses, and to decrease incidents related to the management of blood glucose levels according to manual conventional venous infusion insulin therapy. The goal of our team was to use the STG closed-loop glycemic control system for perioperative TGC in surgical patients to solve the complications of IIT and reduce risk of hypoglycemia. The challenge at our hospital demonstrated that the STG closed-loop glycemic control system can be expected to achieve TGC with no occurrence of hypoglycemia induced by IIT after surgery.
Free accessReview articleFirst published January, 2013pp. 247-262Advancements in smartphone technology coupled with the proliferation of data connectivity has resulted in increased interest and unprecedented growth in mobile applications for diabetes self-management. The objective of this article is to determine, in a systematic review, whether diabetes applications have been helping patients with type 1 or type 2 diabetes self-manage their condition and to identify issues necessary for large-scale adoption of such interventions.
The review covers commercial applications available on the Apple App Store (as a representative of commercially available applications) and articles published in relevant databases covering a period from January 1995 to August 2012. The review included all applications supporting any diabetes self-management task where the patient is the primary actor.
Available applications support self-management tasks such as physical exercise, insulin dosage or medication, blood glucose testing, and diet. Other support tasks considered include decision support, notification/alert, tagging of input data, and integration with social media. The review points to the potential for mobile applications to have a positive impact on diabetes self-management. Analysis indicates that application usage is associated with improved attitudes favorable to diabetes self-management. Limitations of the applications include lack of personalized feedback; usability issues, particularly the ease of data entry; and integration with patients and electronic health records.
Research into the adoption and use of user-centered and sociotechnical design principles is needed to improve usability, perceived usefulness, and, ultimately, adoption of the technology. Proliferation and efficacy of interventions involving mobile applications will benefit from a holistic approach that takes into account patients' expectations and providers' needs.
Free accessResearch articleFirst published January, 2013pp. 263-270The epidemic of overweight/obesity affects youth with type 1 diabetes mellitus (T1DM) and their families. In youth with T1DM and their parents, we examined weight status with reported and expected energy intake and with youth hemoglobin A1c (HbA1c).
In 243 youth (48% female, 13 ± 3 years) and their parents (84% female, 45 ± 6 years), we assessed body mass index (BMI), prevalence of overweight/obesity, reported energy intake (REI), and youth glycemic control (HbA1c). The REI was compared with predicted daily energy requirements (DER; based on age, weight, sex, and physical activity).
Youth had diabetes duration of 6.3 ± 3.4 years and HbA1c of 8.5% ± 1.3%; 69% used insulin pump therapy. Overweight and obesity affected 23% and 11% of youth and 30% and 24% of parents, respectively. Youth and parent BMI (
Similar to the general population, overweight and obesity are prevalent among families of youth with T1DM. Weight status appears to influence self-REI in parents and glycemic control in youth with T1DM, suggesting the need for family-based dietary interventions.
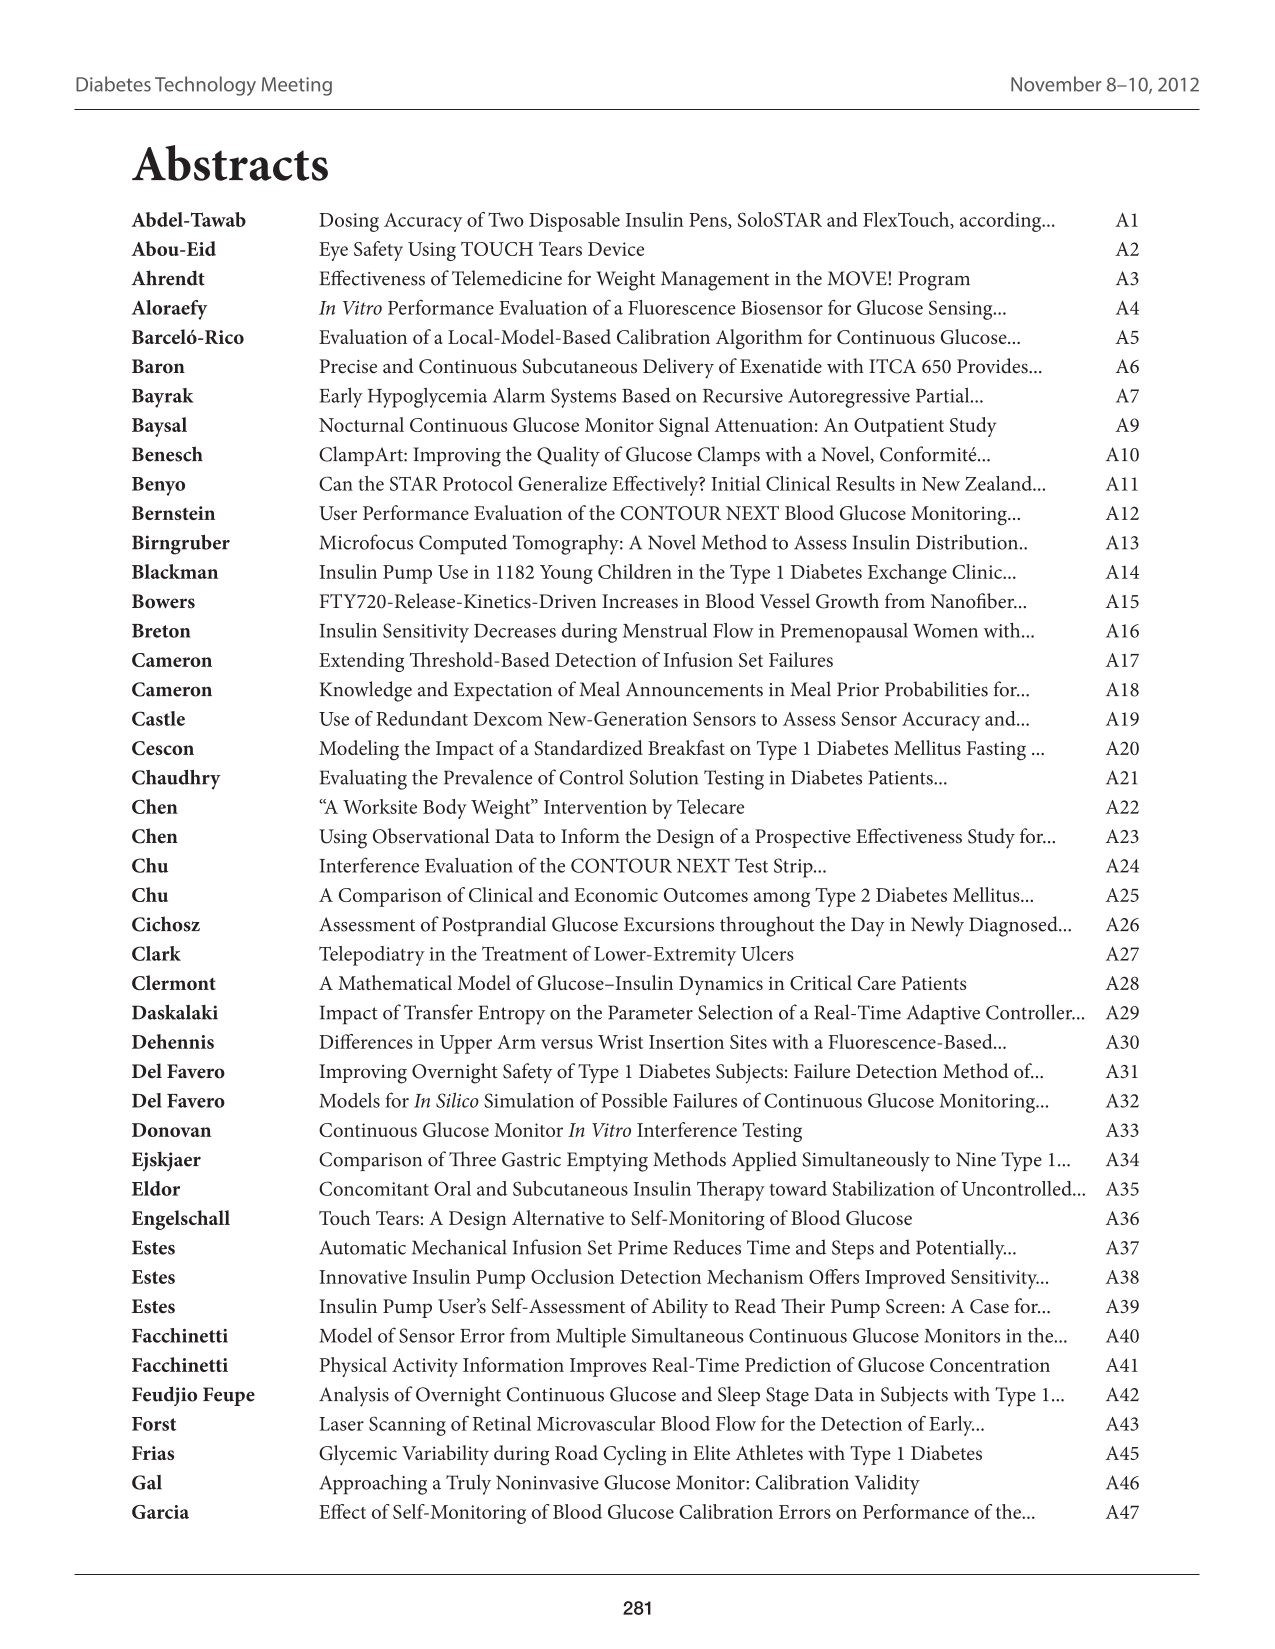
Free accessMeeting reportFirst published January, 2013pp. 271-275 Free accessAbstractFirst published January, 2013pp. 281-A161
 Free accessLetterFirst published January, 2013pp. 285-286
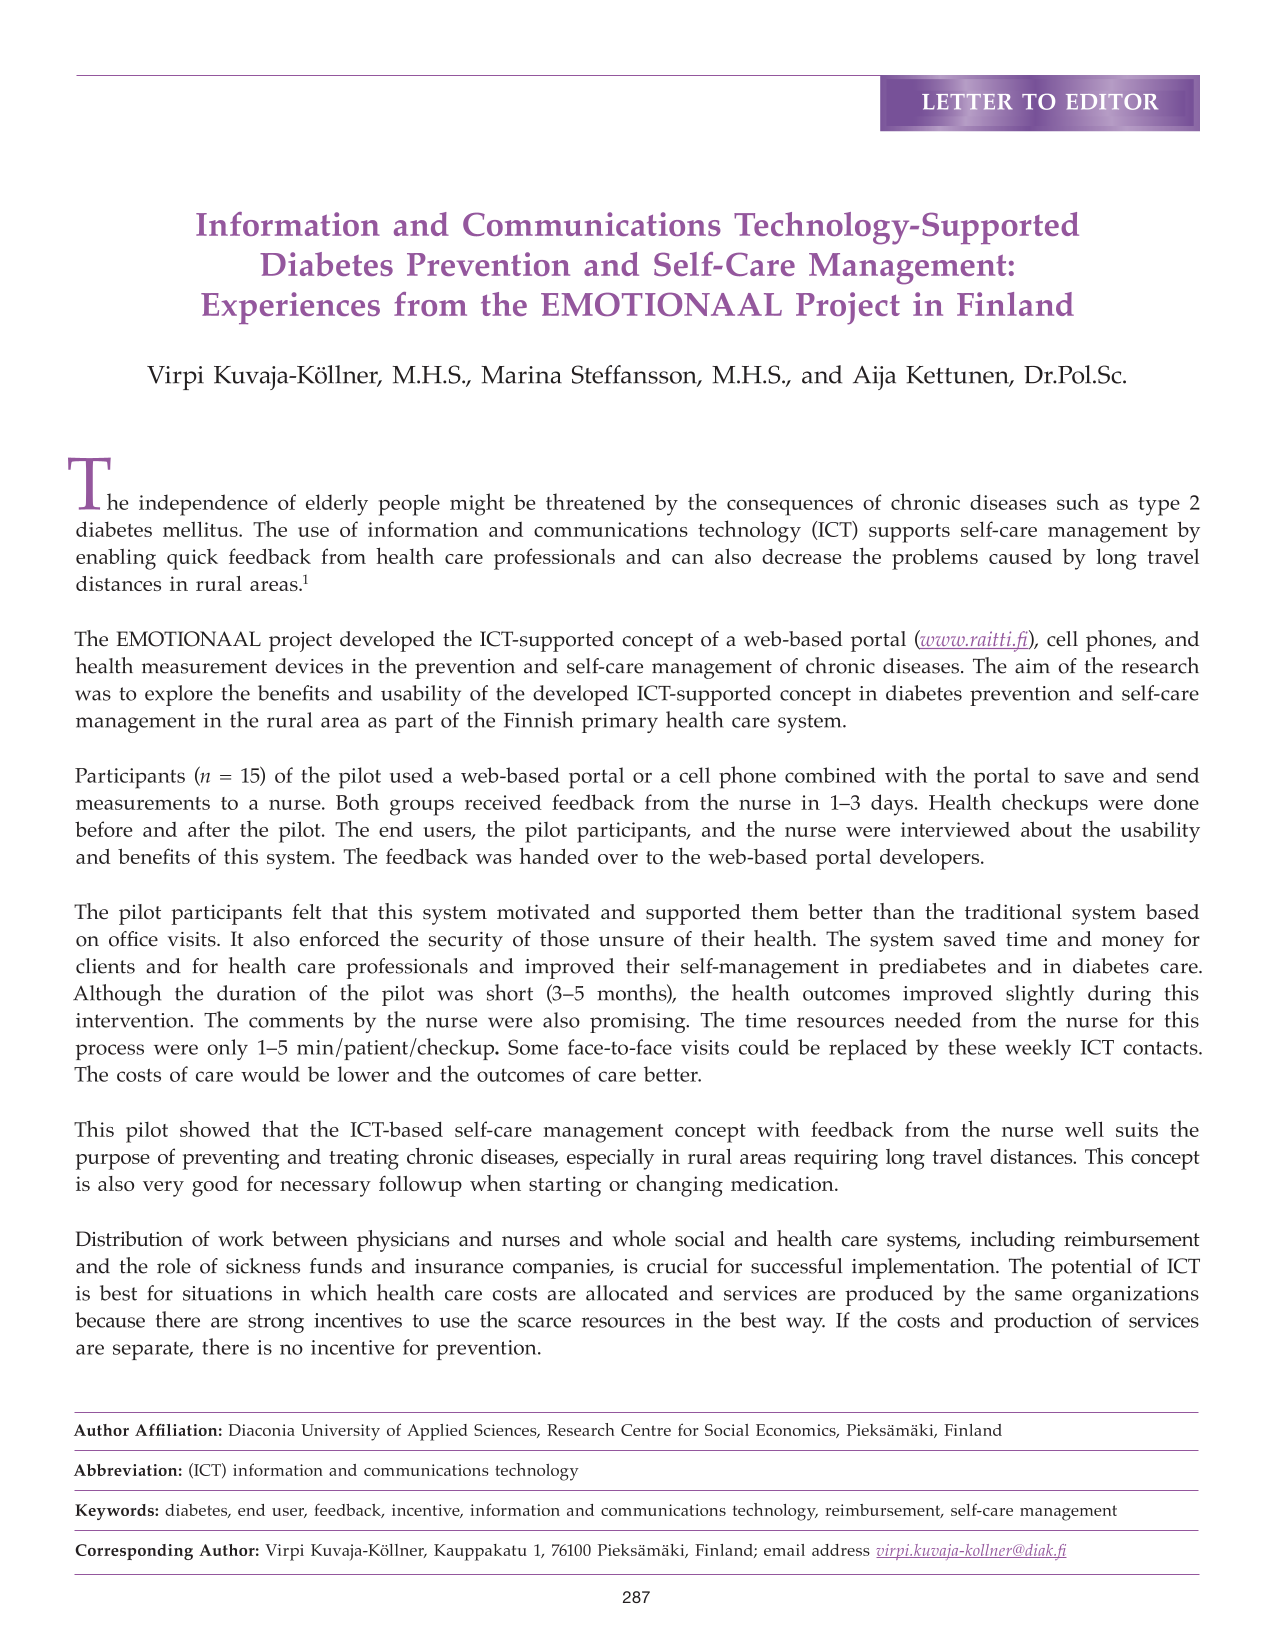
 Free accessLetterFirst published January, 2013pp. 287-288
 Free accessLetterFirst published January, 2013pp. 289-290