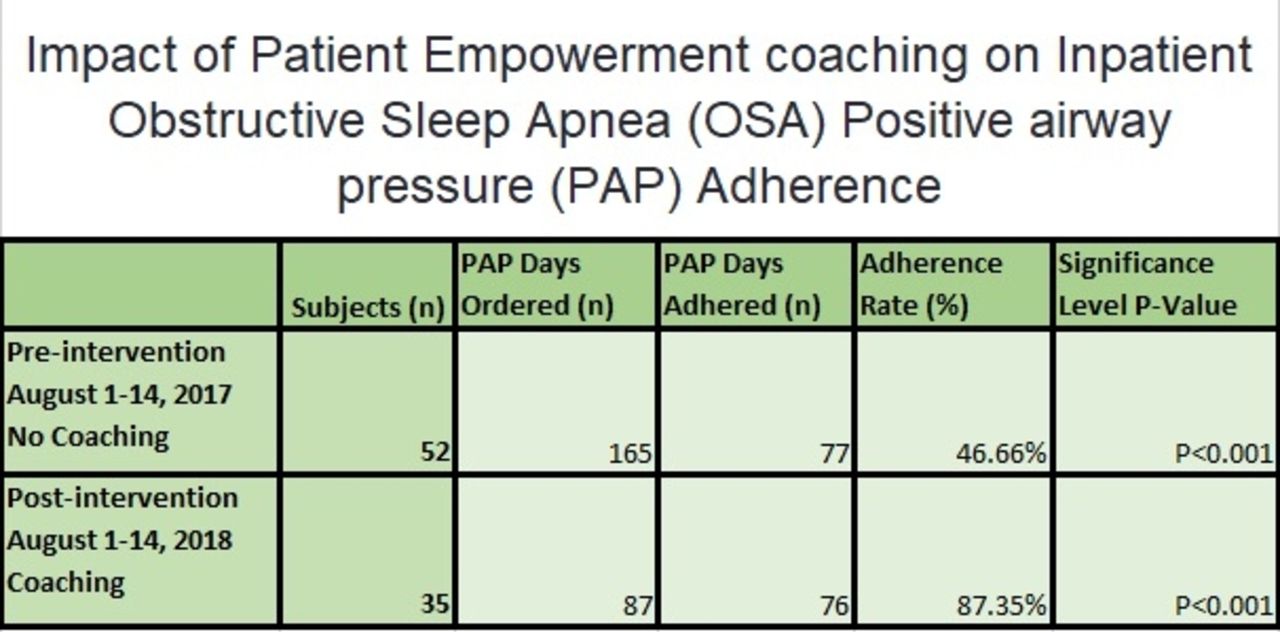
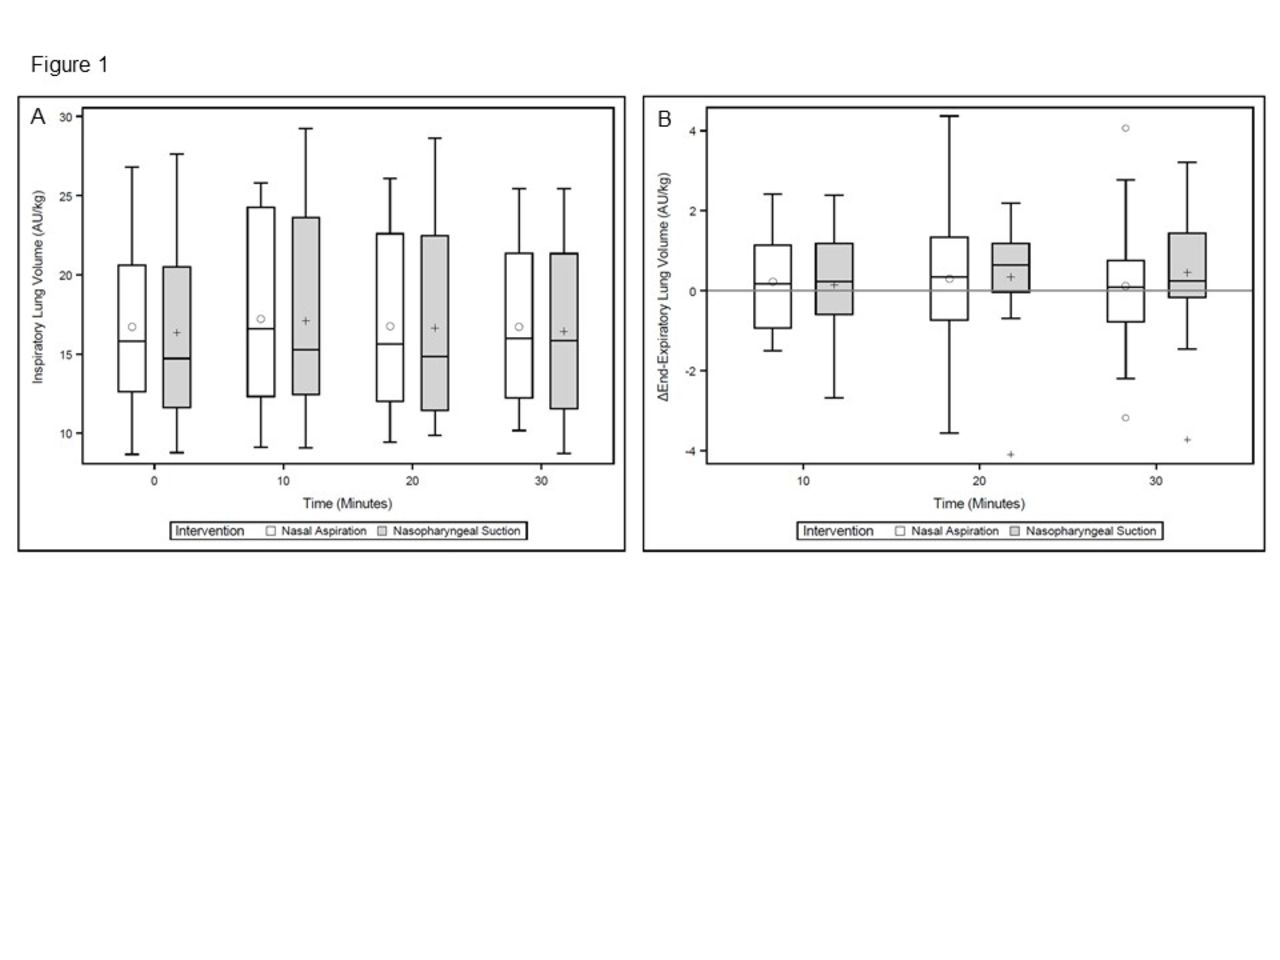
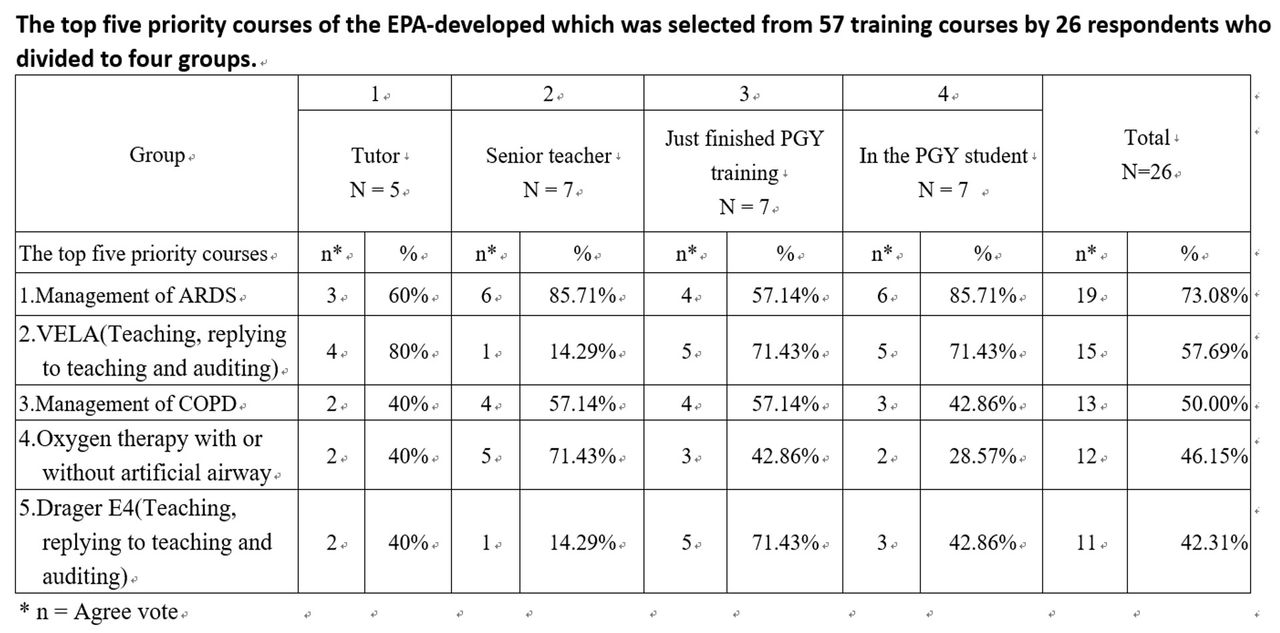
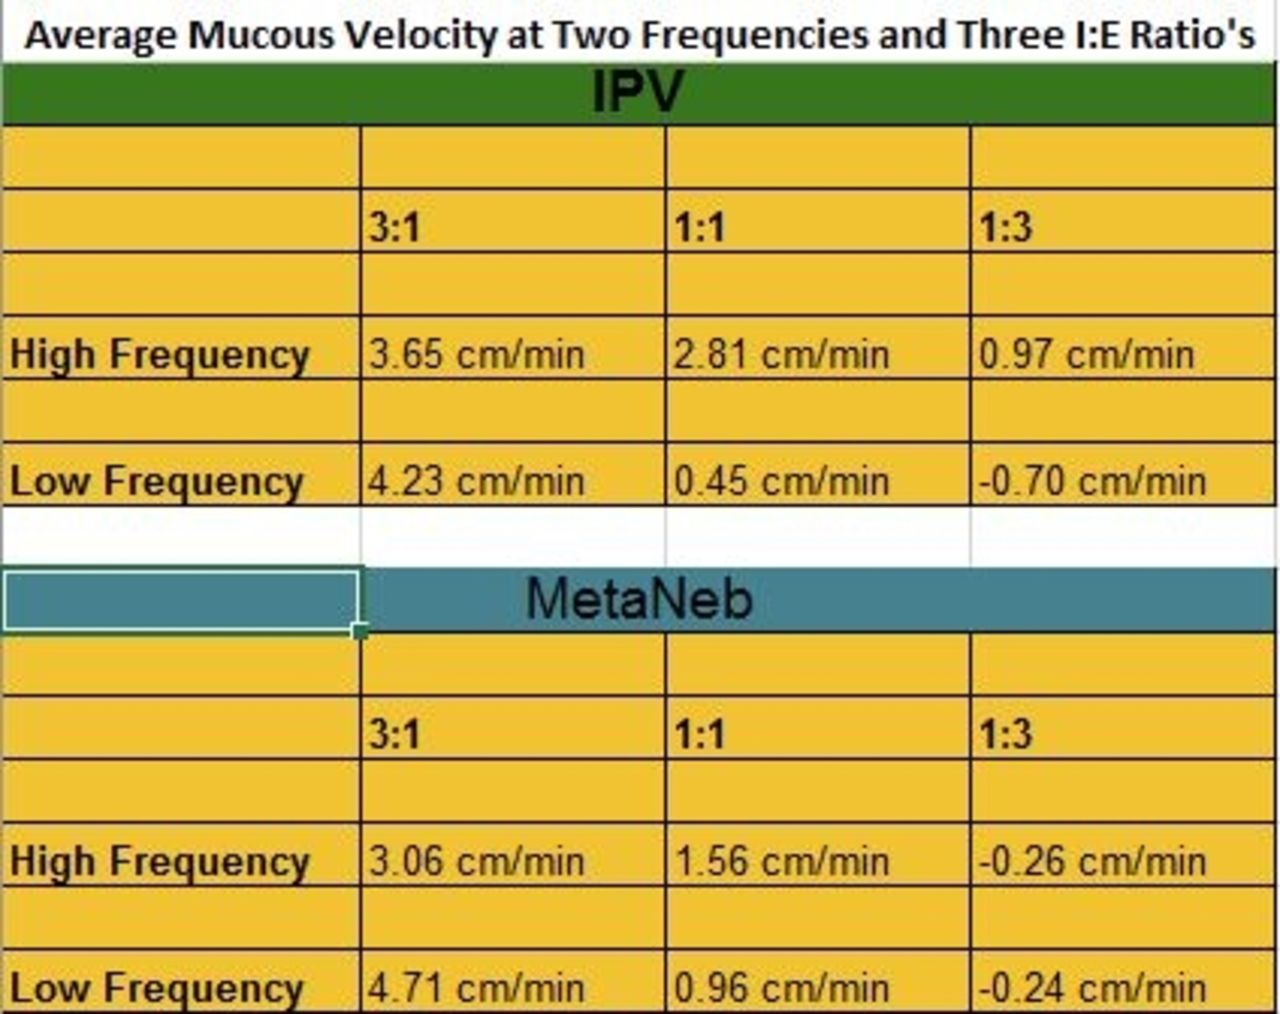
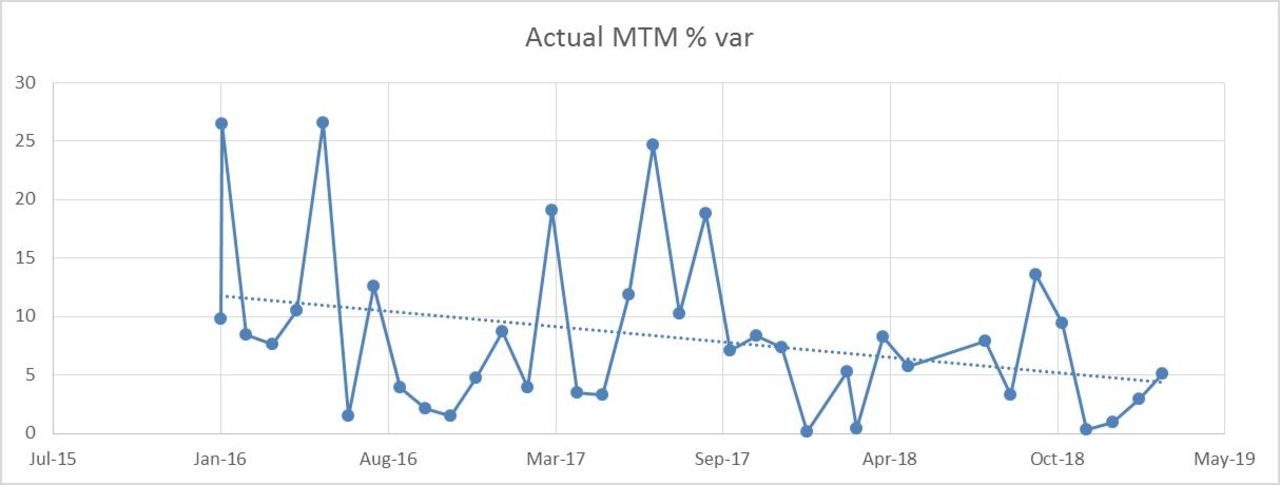
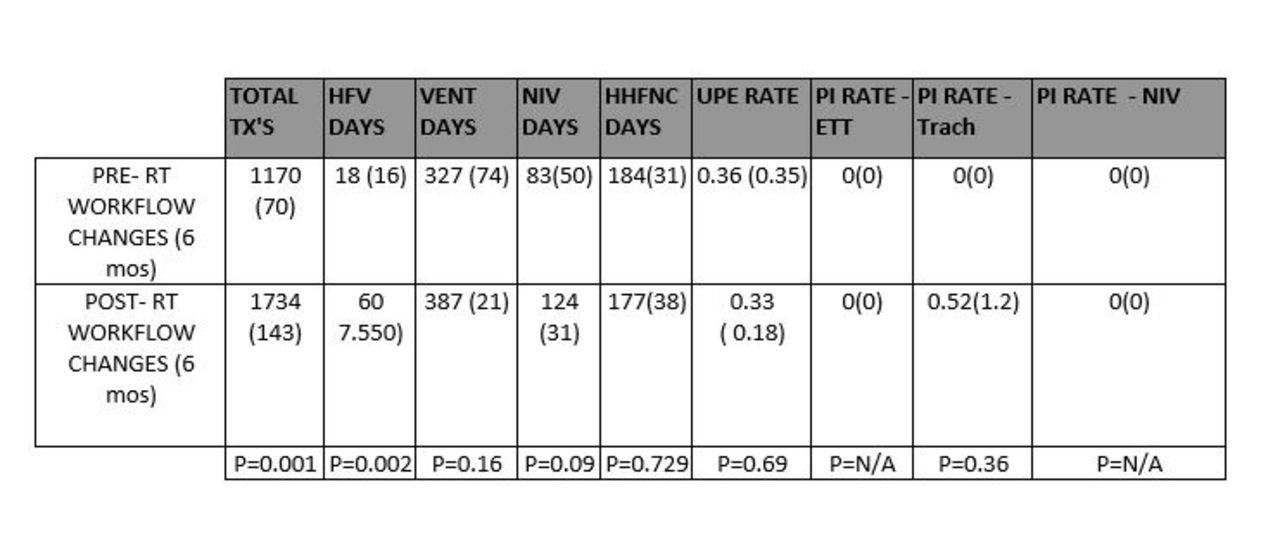
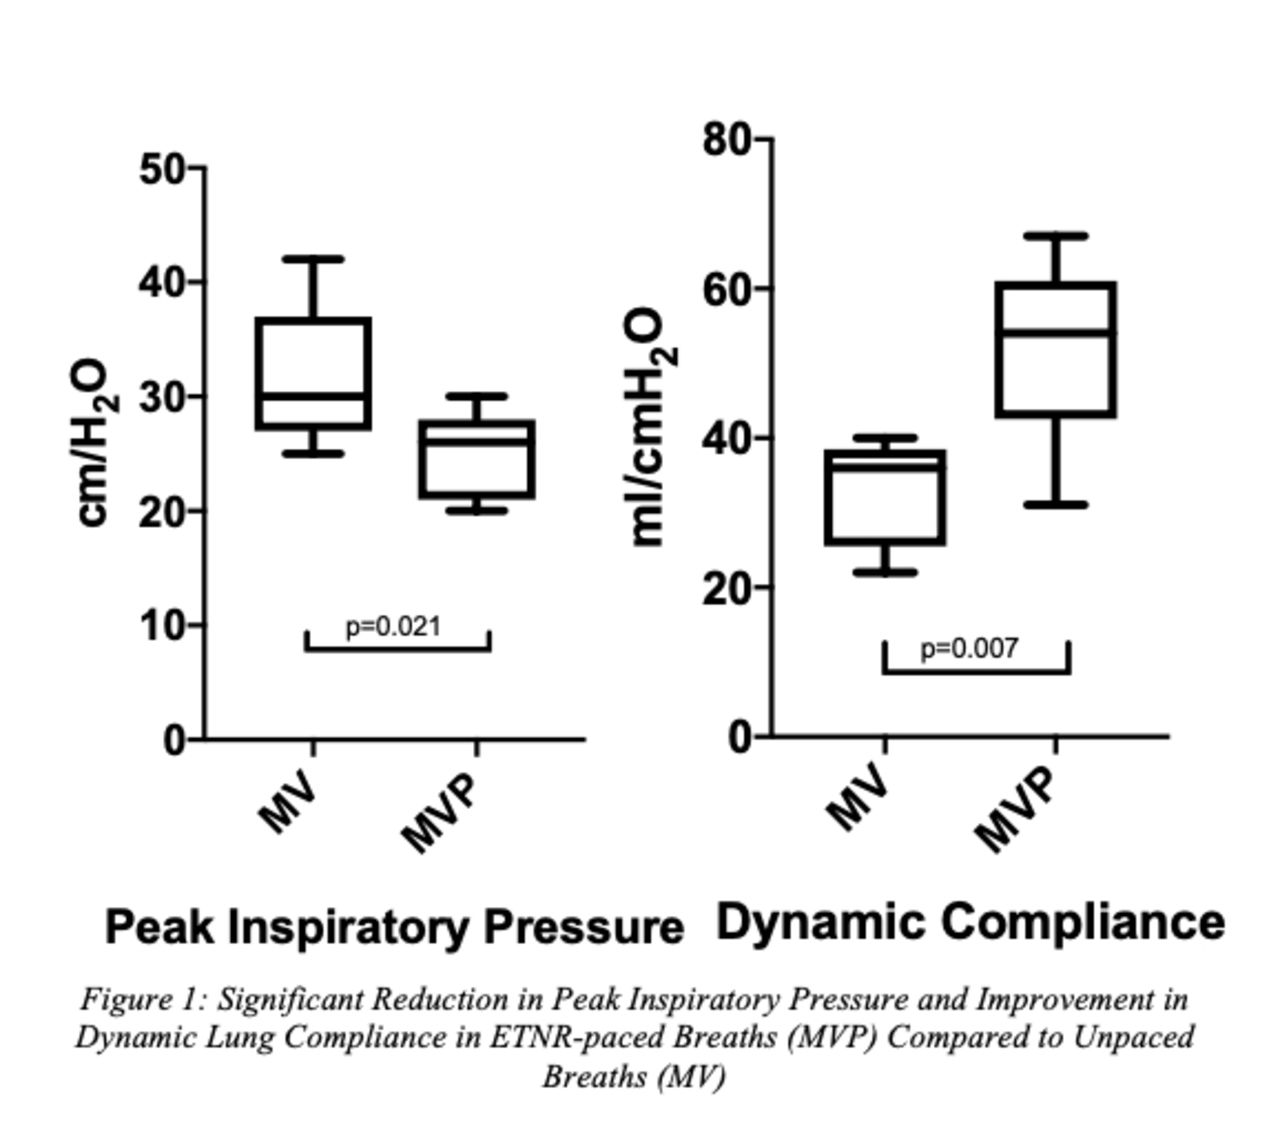
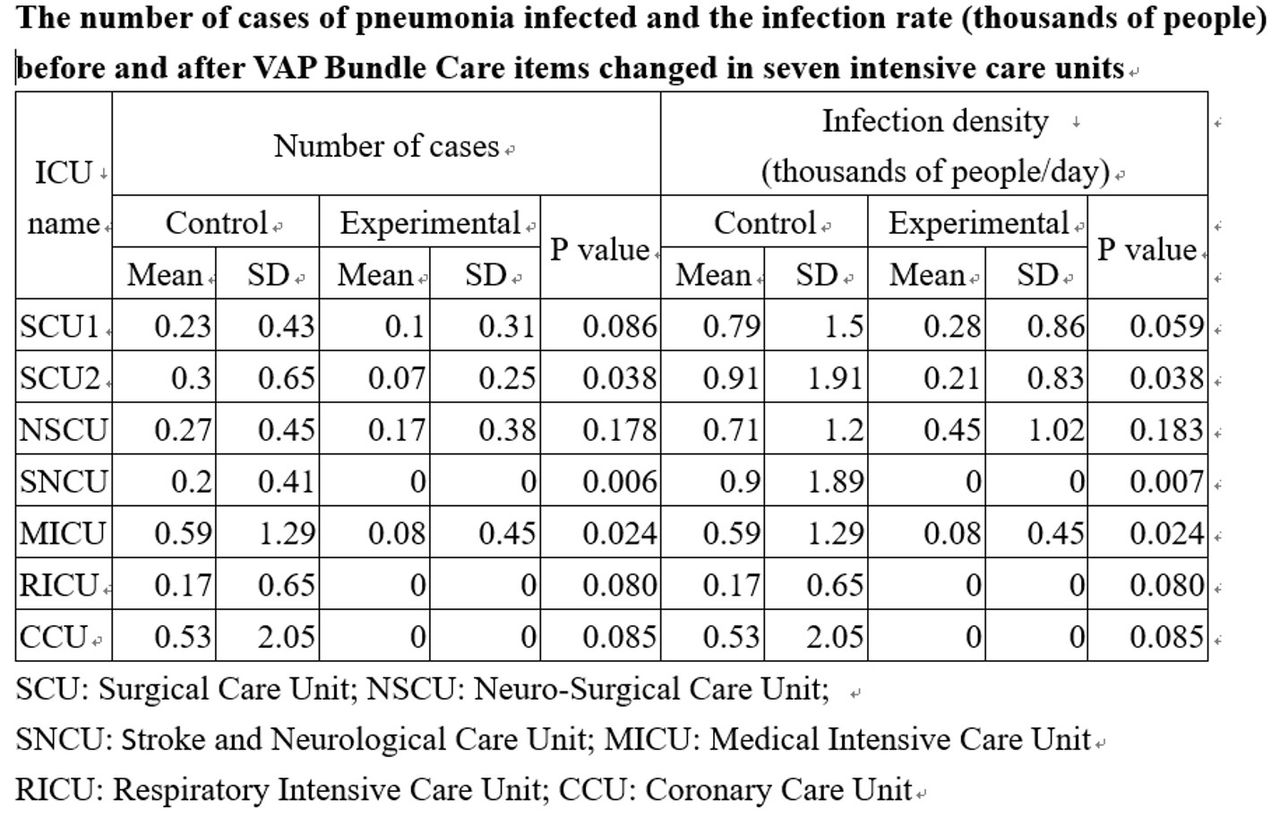
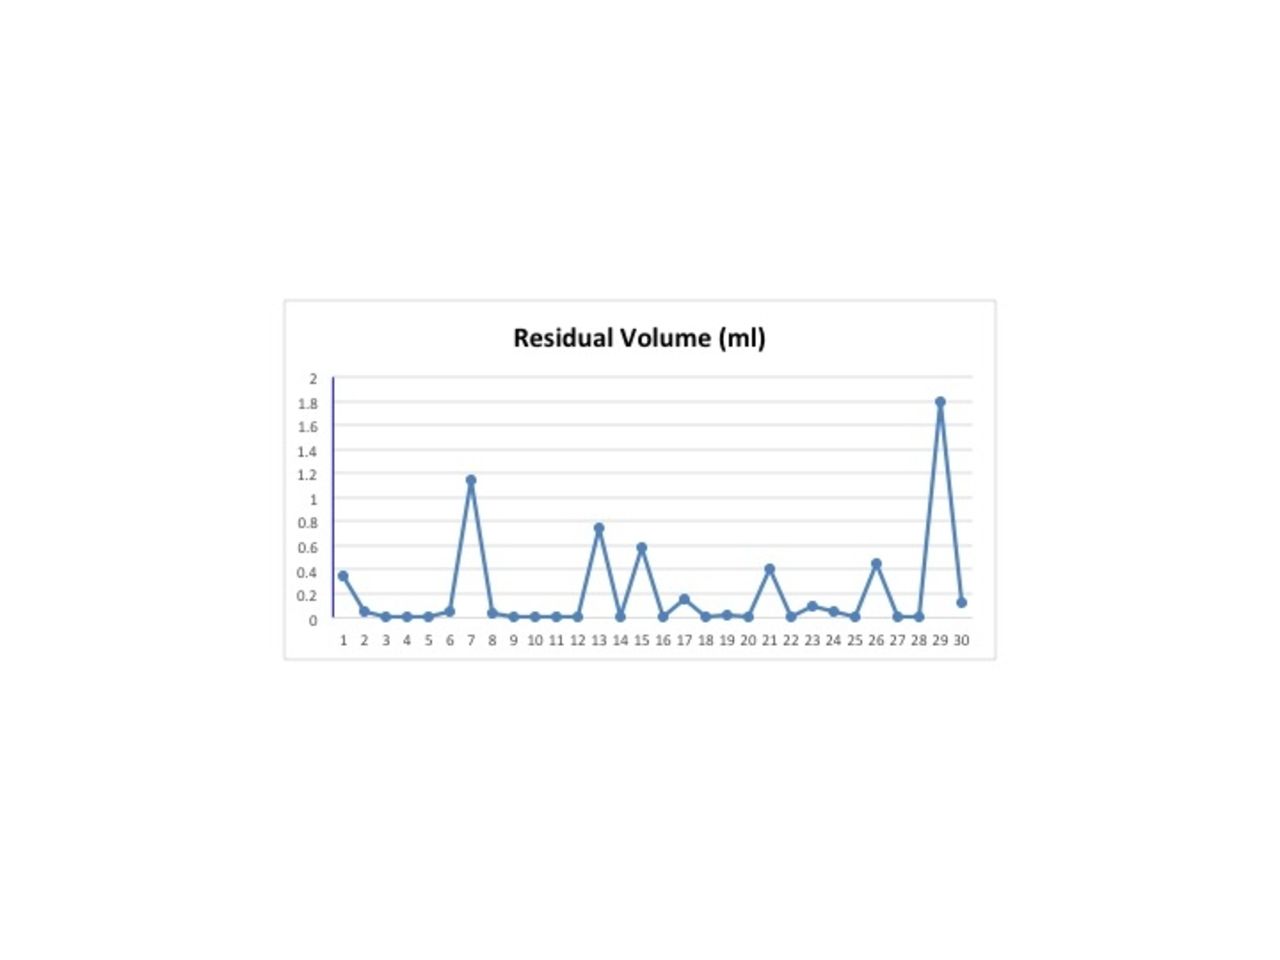
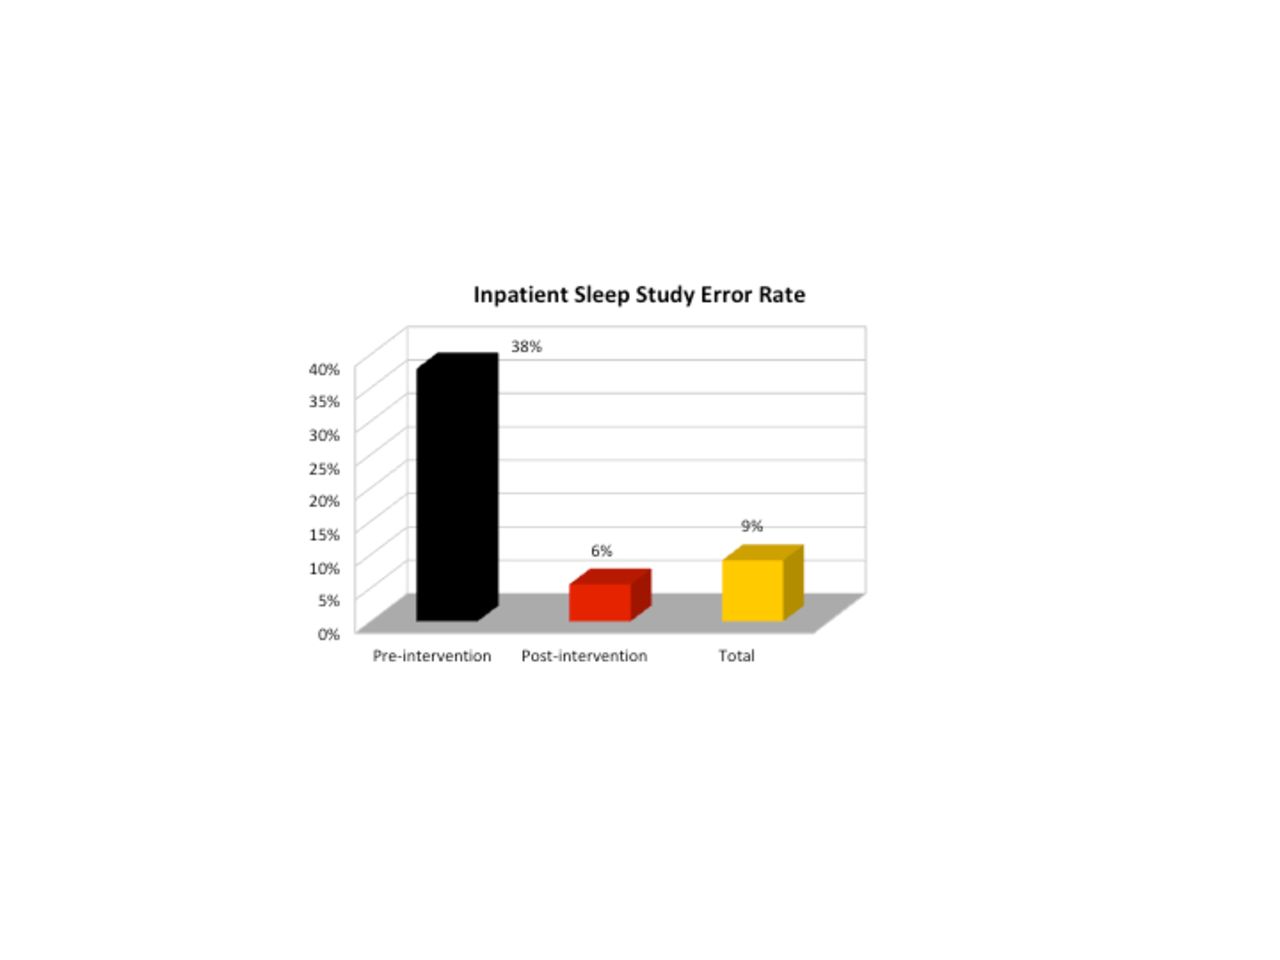
There have been ongoing challenges with ensuring the appropriate utilization of supplemental oxygen in the acute care setting. Pre-intervention data showed that patients were not being weaned appropriately and oxygen orders were remaining active in patient’s charts for longer than clinically indicated. A recent meta-analysis study showed an increased risk of mortality in acutely ill adults treated with liberal versus conservative oxygen therapy [1]. The study concluded that there was a 21% increase in in-hospital mortality in patients who received liberal oxygen therapy.
Methods:
A de-escalation pathway for nursing was created from the current oxygen therapy protocol with nursing, respiratory and physician input. Since implementation in August, we have seen improvement in all three metrics: weaning compliance, appropriate vital sign documentation, and order discontinuation. Initial scope included patients receiving oxygen via nasal cannula on the medicine service line floor units as well as the MIMU at Memorial Hermann Texas Medical Center. Project scope excluded patients receiving supplemental oxygen for pain related to sickle cell crisis, those on home oxygen, comfort measures patients, tracheostomy patients and those receiving oxygen to treat a pneumothorax.
Results:
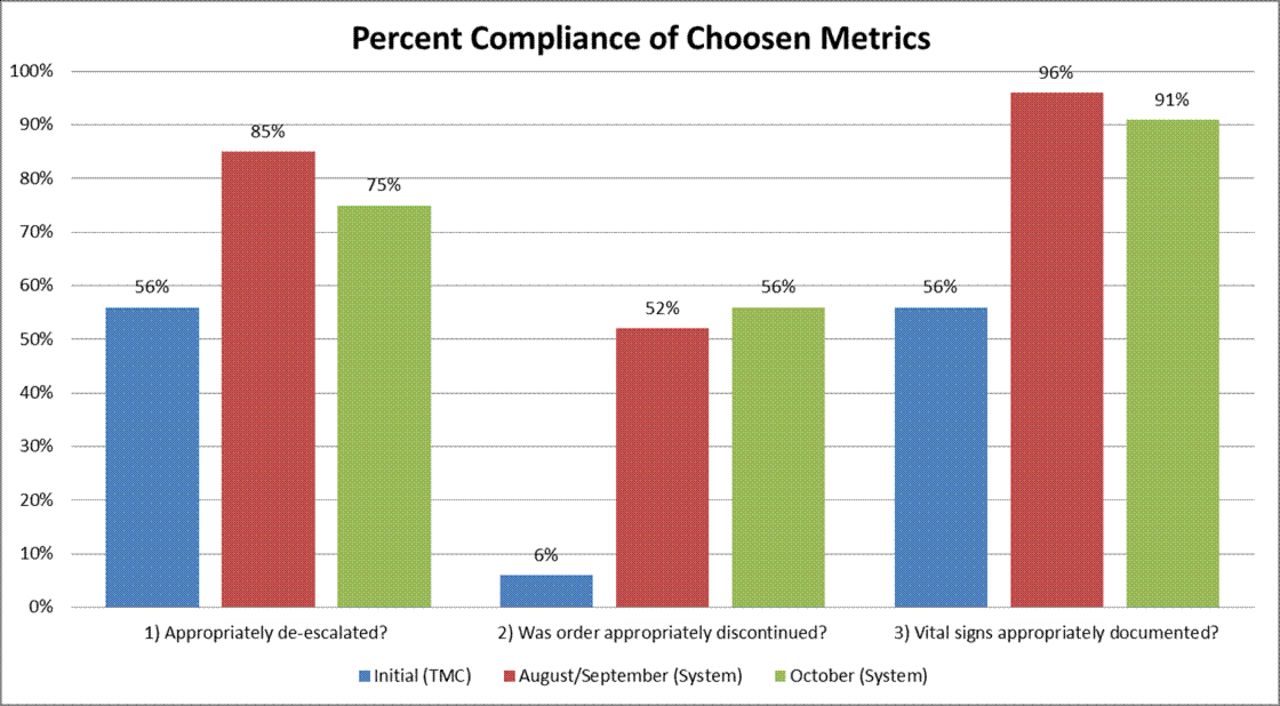
Increased compliance was noted across all measured metrics following initial education. Oxygen de-escalation/weaning compliance improved from 56% to 63%. Order discontinuation for patients who were weaned improved from 6% to 18%. Vital sign charting with regards to oxygen therapy mode improved from 56% to 86%.
Conclusions:
1) A PIL (PowerPoint and quiz) is being created to address the appropriate use of oxygen therapy which will be used for both nursing and respiratory therapy 2) Data collection is ongoing at the system level 3) Plan to continue data collection and re-evaluate/revise as necessary following PIL module implementation.
Compliance of de-escalation of chosen metrics
Nursing de-escalation pathway created to supplement respiratory oxygen de-escalation pathway
Meeting report
Restricted accessMeeting reportFirst published October, 2019pp. 3202782-3202782
Acronyms in healthcare are used often but can present potential patient safety issues when staff are not familiar with the terminology. Previous studies regarding acronym use have demonstrated knowledge gaps for healthcare professionals. There are specific acronyms related to hospital-acquired conditions (HAC). The HAC workgroup at our institution collaborates with the national organization, Solutions for Patient Safety (SPS), to reduce and prevent these conditions. It was felt that many staff do not recognize some of the frequently used HAC acronyms. A staff survey to identify HAC acronyms was done to determine educational needs.
Methods:
The aim of this quality improvement study was to assess staff knowledge of commonly used HAC related acronyms in a pediatric healthcare setting. The local institutional review board determined the project was not human subject research. Respiratory therapists (RTs), nurses, and physicians were provided with a list of 13 HAC acronyms to identify without assistance. It was not specified that the acronyms were HAC related. The acronyms were HAC, SPS, catheter associated urinary tract infection (CAUTI), unplanned extubation (UPE), pressure injury (PI), central line associated blood stream infection (CLABSI), ventilator associated event (VAE), venous thromboembolism (VTE), viral respiratory illness (VRI), ventilator associated pneumonia (VAP), surgical site infection (SSI), peripheral intravenous infiltration and extravasation (PIVIE) and adverse drug event (ADE). HAC workgroup members not involved in developing the survey also completed the survey for comparison. Results were analyzed using descriptive statistics.
Results:
There were 65 participants including 35 nurses, 25 RTs and 5 physicians. No one was able to correctly identify all 13 acronyms. Overall, VAP (74%), VRI (69%) and CAUTI (62%) had the largest percentage of correct responses while SSI (8%), ADE (5%) and SPS (2%) had the least. Physicians had the most correct responses (46%) followed by nurses (41%) and RTs (17%). SSI was commonly identified as social security income by all disciplines. No RT identified VTE as the HAC related acronym. From the HAC workgroup, 6 nurses completed the survey with 99% of correct responses.
Conclusions:
Based on the survey results, education regarding HAC acronyms is warranted for all disciplines. VTE and SSI have additional definitions not related to HAC which could be easily confused. Disclosures: None
Meeting report
Restricted accessMeeting reportFirst published October, 2019pp. 3205958-3205958
Mechanical ventilation with positive pressure ventilation, causes damage to surfactant deficient lungs. Administration of surfactant via aryngeal mask airway (LMA) offers a less invasive method of delivery without the need for intubation and mechanical ventilation. Early studies have shown that placement of the LMA is less difficult and less traumatic for the patient. The goal of surfactant administration via LMA is to remain off of mechanical ventilation and avoid the harmful effects of positive pressure ventilation, which can lead to long-term morbidity. Literature review supports the existing knowledge that the use of less invasive methods for the delivery of surfactant in the neonate is comparable to endotracheal administration, with a decrease in FIO2, mechanical ventilator days, and overall length of stay. This study was designed to implement the existing evidence into our clinical practice to help improve the overall outcome of our patients.
Methods:
To compare retrospective rates from 2015-2016 of surfactant therapy failure following in and out surfactant via intubation with a prospective Quality Study using alternative surfactant administration. The objective of this Quality Study is to avoid mechanical ventilation in neonates’ ≥ 25 weeks/≤1500 grams with mild to moderate RDS.(Institutional review board (IRB) approval was obtained for this project.) Inclusion Criteria: Gestational age (GA) 25 weeks and greater and ≤ 1500 grams Age < 48 hours RDS as defined by an FIO2 requirement of 0.40 and greater on CPAP.
Results:
Retrospective Results: 2015- Average ventilator days (AVD)-14; 2016-AVD-15.5. Length of stay (LOS) 2015-65.2; 2016-59.3. CLD 2015-24%; 2016-14.3%. Prospective Results: AVD-2017-12.2; 2018-11.8. LOS-2017-55.8; 2018-54.0. CLD 2017-10.6%; 2018-9.8%.
Conclusions:
Our results support the use of a less invasive method to deliver surfactant efficiently to decrease intubation and mechanical ventilation days. Data showed a decrease in the use of oxygen, LOS, AVD, and CLD rates. This is a 5-year study, initial results support the use of less invasive surfactant delivery and data will continue to be collected and reviewed.
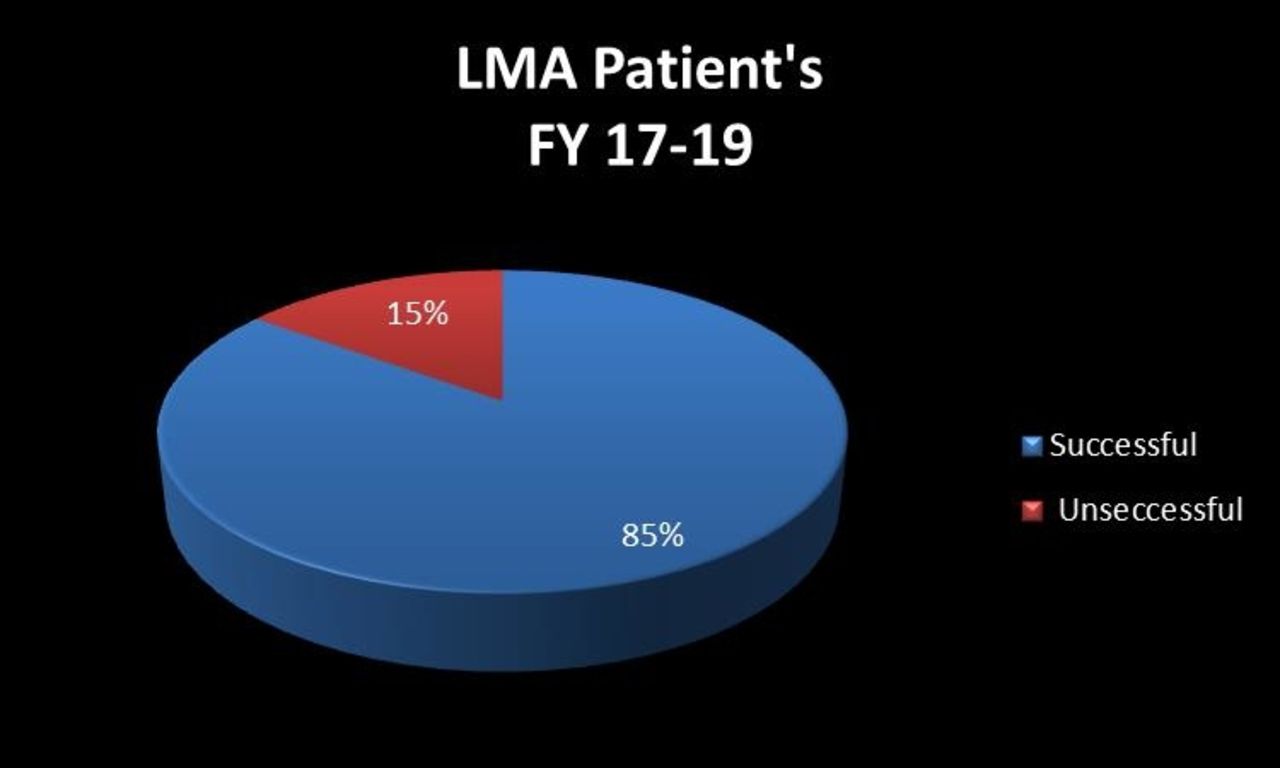
Carilion Children's LMA Procedures FY 17 -FY 19
Meeting report
Restricted accessMeeting reportFirst published October, 2019pp. 3206951-3206951
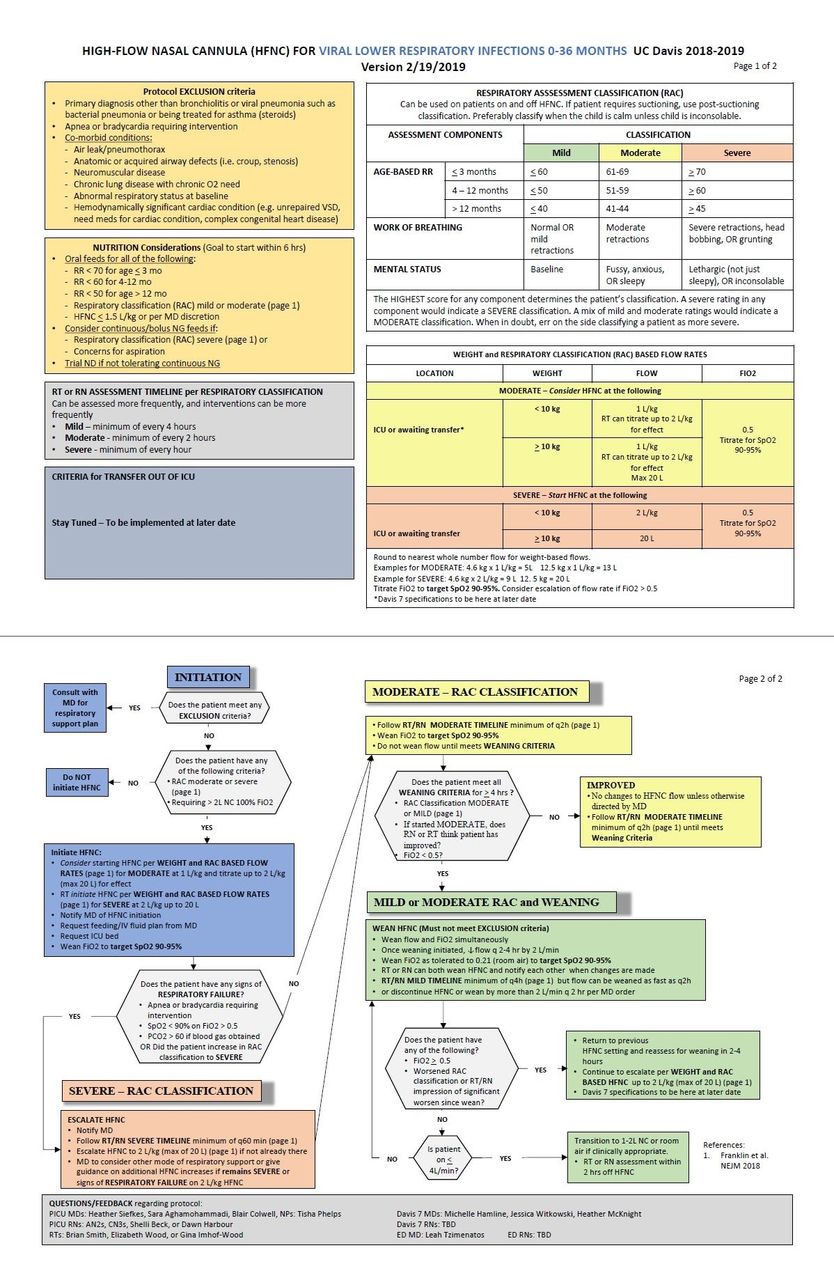
Treatment of bronchiolitis with high-flow nasal cannula (HFNC) may alleviate respiratory distress and reduce ICU utilization. However, HFNC use may prolong length of stay (LOS) if weaned more slowly than medically indicated. Using quality improvement methodology, we aimed to reduce HFNC length of treatment (LOT) and inpatient LOS each by 12 hours in 0-18 month old patients with bronchiolitis requiring HFNC on the pediatric hospital medicine service by April 1, 2019.
Methods:
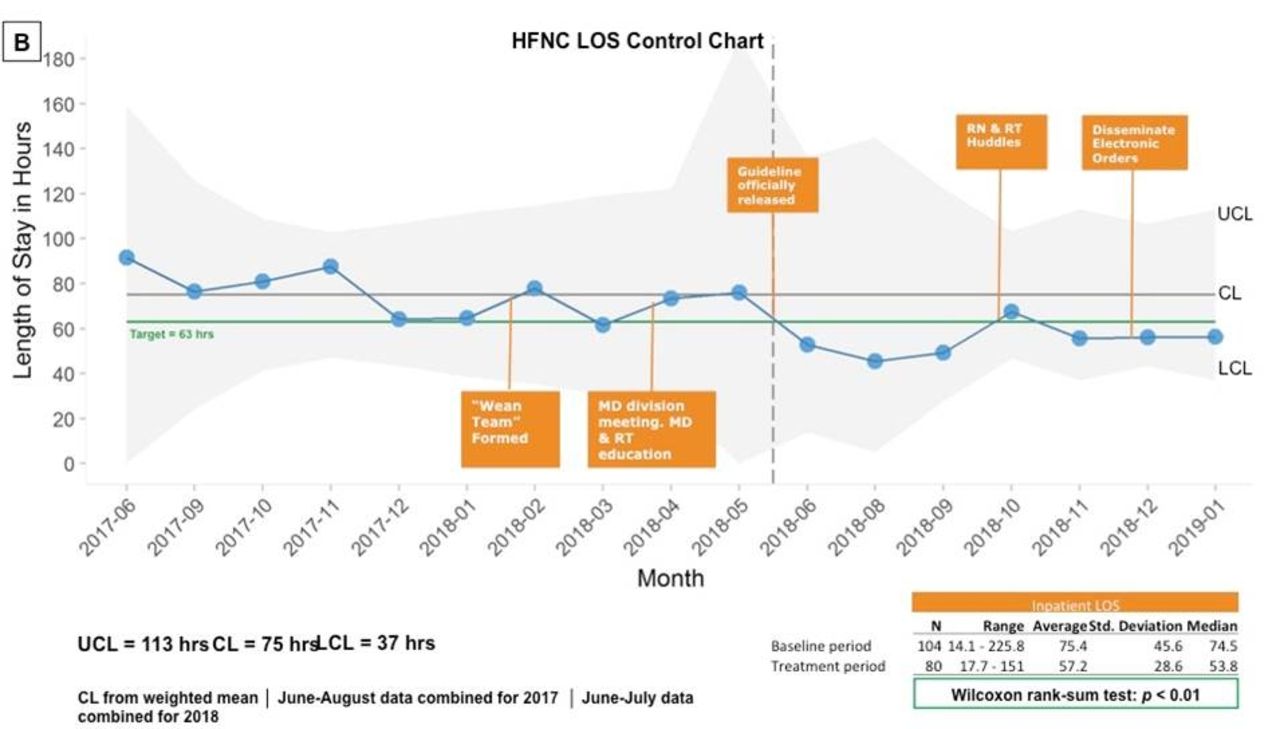
We recruited multidisciplinary representatives from key stakeholder groups to form a Wean Team. Key drivers of prolonged HFNC duration were communication difficulties between respiratory therapists (RTs) and physicians (MDs), overextended RTs and no prescribed weaning plan. Swim lane workflow analysis highlighted variations in weaning practices, which were used to inform PDSA cycles. We introduced an RT-driven weaning protocol, created standardized MD weaning orders, employed nursing and RT huddles, held education sessions, and posted reminders. The impact of interventions on HFNC duration and LOS were plotted over time in a statistical process control chart and compared to baseline rates using the Wilcoxon rank-sum test.
Results:
Mean HFNC duration decreased from a baseline of 41.9 hours to 28.9 hours during the intervention period (P < .001); mean LOS decreased from 75.4 hours to 57.2 hours (P < .01). The HFNC duration and LOS control charts (fig. 1) both demonstrate special cause variation with 7 consecutive points below the center line beginning in June 2018. Median-adjusted Levene test demonstrates a trend towards less variation in HFNC LOT (P = .06) and LOS (P = .053) during the intervention period. Balancing measure analyses revealed no post-wean PICU transfers and no change in 72-hour readmission rate.
Conclusions:
This ongoing quality improvement project significantly decreased duration of both HFNC use and LOS for patients with bronchiolitis. Additionally, there was a concomitant reduction in variance, suggesting reduced practice variation. RT-driven HFNC weaning protocols with MD participation can reduce HFNC duration and LOS in bronchiolitis. Future work will focus on sustaining improvements and assessing the cost savings of this approach. “
Meeting report
Restricted accessMeeting reportFirst published October, 2019pp. 3208329-3208329
Richard Rice, Umur Hatipoglu, Xiaofeng Wang , [...]
View All
Abstract
Background:
In fiscal year 2015, CMS began reducing payments for patients readmitted within 30 days of hospital discharge with a diagnosis of acute exacerbation of COPD. GOLD guidelines suggest that while COPD should be considered in symptomatic patients, spirometry (PFT) is required to make the diagnosis. As part of a COPD hospital discharge review, we noticed there were instances where the patient’s diagnosis may not have been supported by available PFT data and thus may have had an impact on hospital readmissions.
Methods:
Institutional IRB approval was obtained. Patients coded with a COPD hospital discharge in 2018 at Cleveland Clinic Main Campus were reviewed. PFT data (if available) was recorded to include kg/m2 and FVC. The kg/m2 /FVC ratio was calculated and compared with the predicted Lower Limits of Normal (LLN) values. Hospital discharge diagnosis and 30-day hospital readmission data was also available. One-tailed two-proportions z-test with continuity correction was used in R version 3.3.2 and all analysis were performed at a significance level of 0.05.
Results:
In 2018, there were 523 hospital admissions with a COPD diagnosis at Cleveland Clinic Main Campus. 109 of these patients (20.8%) had a 30-day hospital readmission. 99 of these patients had PFT data available at the time of this analysis. Of the 99 patients with data, 34 (34.3%) had a kg/m2 /FVC ratio that was greater than their predicted LLN on PFT. Of the 414 patients that were not readmitted within 30 days, 318 had PFT data available and 85 (26.7%) had a ratio greater than LLN. If the 34 readmitted patients had not been coded with COPD, the 30-day readmission rate would have decreased significantly from 20.8 to 15.3% (109/523 vs. 75/489, P = .014). Even if all of the 119 patients that had PFT data greater than LLN had not been counted, the readmission rate would still have decreased from 20.8 to 18.6% but not significantly (109/523 to 75/404, P = .22). Those that were coded with a principal diagnosis of COPD exacerbation and had PFT data were significantly less in the group that did not support the diagnosis than in those that did (36/119 vs. 172/298, P < .001).
Conclusions:
When available, providers should take into account PFT results to possibly prevent a COPD misdiagnosis. An accurate diagnosis may decrease the amount of COPD hospitalizations and readmissions. Limitations of this study include incomplete PFT data. Further studies are encouraged to examine this impact.
Meeting report
Restricted accessMeeting reportFirst published October, 2019pp. 3208829-3208829
Derrick L Orr, Sunil Sharma, Stuart F Quan , [...]
View All
Abstract
Background:
COPD is the second most common cause of hospital admission in the United States. Sleep Disordered Breathing is a highly prevalent and under-diagnosed condition which may impact the outcome of COPD. We hypothesized that the presence of unrecognized and untreated SDB will increase hospital readmissions in patients admitted for COPD exacerbation.
Methods:
We reviewed consecutive patients admitted for COPD exacerbation from Nov 2016 - October 2017 who were also screened for SDB with sleep questionnaire, and who subsequently underwent a high-resolution pulse-oximetry (HRPO) or portable sleep monitoring (PM). We compared the rates of 30, 60 and 90-day readmission or death across SDB categories and compared overall survival in patients with and without SDB.
Results:
Of the total of 380 patients admitted for COPD exacerbation, 256 were screened for SDB with a sleep questionnaire (STOP). Of these, 238 underwent an overnight HRPO/PM. Out of the total of 238 patients, 111 (46.6%) were found to have SDB; 28.6% had mild, 9.7% moderate and 8.4% severe SDB. Baseline characteristics and demographics were compared for COPD- SDB and COPD- no SDB and were similar, except patients with SDB who had an increased mean BMI (33.9 vs 30.3) and increased co-morbidity of heart failure (19.8% vs 7.1%). Among patients with COPD-SDB the odds of 30-day readmission were 3.5 times as high as for COPD- no SDB patients (45% vs 19%, P < .001). Additionally, the odds of readmission were 3.3 as high for moderate SDB patients than mild SDB patients (61% vs 32%) and 1.5 times as high for severe SDB patients than moderate SDB patients (70% vs. 61%). The overall survival time was lower for patients with SDB than patients with no SDB (P = .001). The time to hospital readmission or death increased with increasing SDB severity (P < .001).
Conclusions:
Patients admitted to the hospital for COPD exacerbations have significant burden of undiagnosed SDB, which may a significantly impact 30-day readmission rate. Longer term follow-up shows worse outcome with the composite endpoint of readmissions and death.
Meeting report
Restricted accessMeeting reportFirst published October, 2019pp. 3214506-3214506
Shanequia L Burress, Tadashia Jabril Cooper Diamond, Jonathan B Waugh
Abstract
Background:
There is limited research on the effects of vaping with electronic nicotine delivery systems (ENDS). Inflammation markers and morphological lung changes have been shown within 24 hours of vaping in cell studies (doi:10.1016/j.tox.2016.07.020). There are several factors that could possibly contribute to decreased lung function and increased inflammation regarding vaping including the flavoring compounds. The aim of this pilot study was to determine if clinical measures could detect changes in lung function soon after vaping.
Methods:
This IRB-approved study recruited healthy volunteers (no fever and self-reported health status, ages 21-28, 71% female). Baseline testing (prior to vaping) involved participants abstaining form vaping for 12 hours prior to measurement of forced expiratory volume in first second (kg/m2), forced vital capacity (FVC), peak expiratory flow rate (PEFR) and fractional exhaled nitric oxide (FENO). Participants then vaped for 10 minutes, waited 30 minutes, and then repeated testing. The participants were recruited based upon age and vaping at least 3 times per week. Manufacturer guidelines for FENO testing and American Thoracic Society guidelines for spirometry were followed.
Results:
Basic spirometry showed no significant change after vaping occurred. The peak flow had a modest decrease and FENO values increased but still remained within normal range for the seven subjects. The pre- and post FENO changes for three participants who vaped >5 times per week exhibited a 22.7% percent change increase.
Conclusions:
There were no significant short-term effects, but these findings cannot be extrapolated to long-term effects of ENDS use. Study limitations include small sample size, a narrow age range and excluding those with lung conditions. It is unknown if 30 minutes post-vaping is adequate to observe the maximum effect on FENO. Also, each participant used their personal e-juice and ENDS device (the same flavor/brand/ingredients were not required). Some participants used e-juice with nicotine while others did not. It would be interesting to see if a nicotine component used by the entire sample group has an independent effect. Asthmatics and those with compromised airways may be more susceptible to lung function decline with e-cigarette use. Next steps for future investigation could explore the effect of ENDS on specific chronic lung disease groups. Disclosures: Loan of NIOX device and disposable patient filters provided by Circassia Inc.
Study Variable Outcomes
STUDY VARIABLE
PRE-VAPE
30 MIN POST-VAPE
% CHANGE
P VALUE
PEF (L/sec)
413
389
-6.0
0.176
FEV1 (L)
3.15
3.33
5.8
0.176
FVC (L)
4.13
4.06
-1.6
0.917
FeNO (ppm)
16
19
13.9
0.089
Meeting report
Restricted accessMeeting reportFirst published October, 2019pp. 3215083-3215083
Acute COPD patients utilize the hospital for inpatient admissions and ER visits. Pulmonary rehabilitation (PR) can reduce use of health care resources. The null hypothesis was that neither patient age nor PR have a significant effect on hospital utilization.
Methods:
With IRB approval, discharge summaries from electronic medical records (EMR) were queried at a community hospital between January 1, 2016 and January 1, 2017. Inclusion criteria: inpatient status >1 day, >40 y of age, and primary admission ICD-10 code of COPD. Data collected: age (5 categories), combined encounters (ER visits without admission and inpatient re-admissions), PR referral/recommendation. Data analysis: P < .05 for descriptive statistics, t-test, two-way ANOVA, Pearson’s correlation for interval data.
Results:
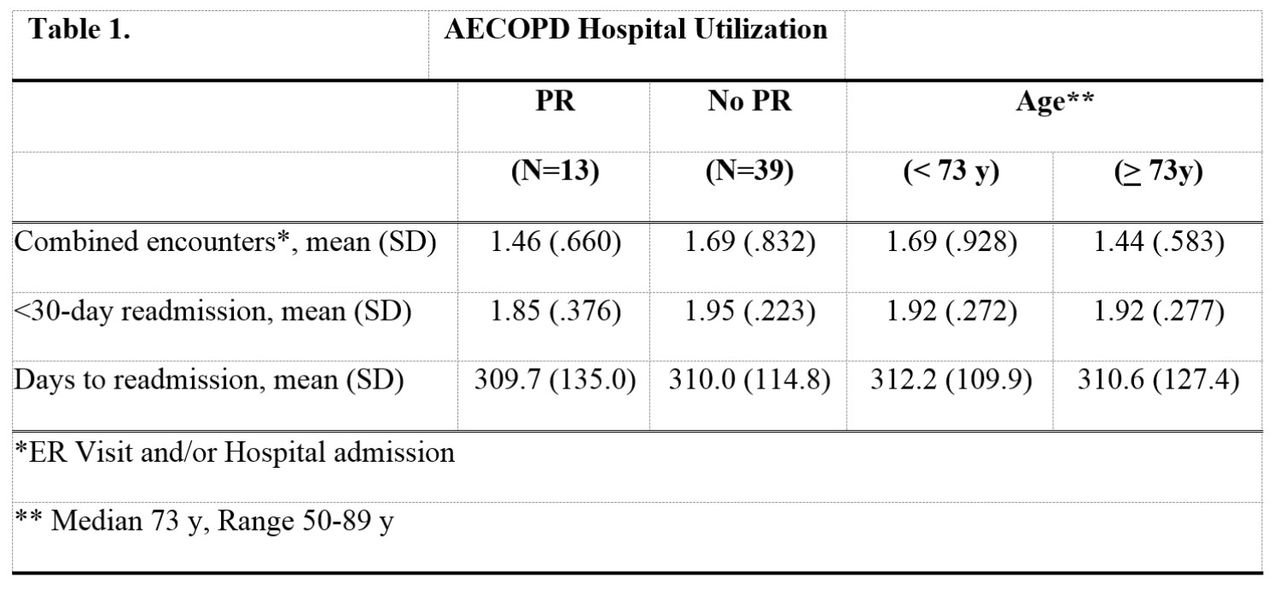
See Table 1. For a P < .05 Pearson’s correlation found no significant association between age and combined encounters. A t-test found no significant difference in combined encounters based on PR status, PR (n = 13), No PR (n = 39) (P = .67). Two-way ANOVA found no significant differences in combined encounters between the 5 age categories and PR.
Conclusions:
Patient age and participation in PR do not have a significant effect on hospital utilization for COPD patients. Results may be due to the variability in discharge planning given for COPD patients. More standardized discharge planning for COPD patients may decrease hospital utilization. Further study to determine specific factors affecting ER visits and re-admissions is needed. Sponsored Research: None.
Meeting report
Restricted accessMeeting reportFirst published October, 2019pp. 3216240-3216240
Kirsten M Holbrook, Muhammad A. Rishi, Christopher D. Williams , [...]
View All
Abstract
Background:
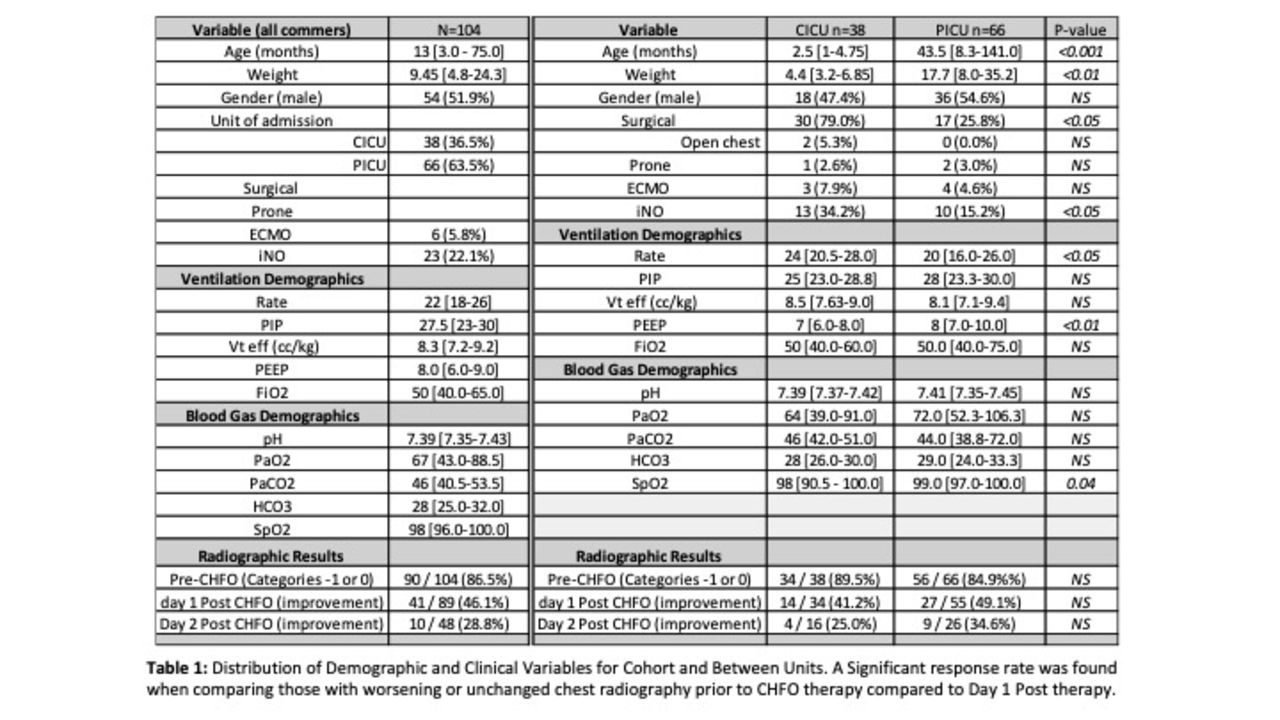
Hyperinflation is routinely used to recruit lungs and prevent atelectasis in postoperative patients. This study evaluated the effectiveness of Continuous High-Frequency Oscillation Therapy (CHFO) on Cardiac Surgery (CV) patients before liberation from ventilator. We hypothesized that use of a CHFO device postoperatively (postop) would improve CV outcomes, including fewer pulmonary complications requiring antibiotics, reduced oxygen usage, and shorter ICU and hospital length-of-stay (LOS). There have been no previous studies conducted on adult CV subjects using CHFO prior to liberation from a vent.
Methods:
Study sample consisted of CV patients with ASA scores of 3 or greater between Jan 2018 and Jan 2019 at Mayo Clinic-Eau Claire, WI. Prior to intervention, standard of care was to perform 4 hyperinflation treatments/day after patient was extubated. We developed a protocol incorporating CHFO. After ICU admission, and while patient was still intubated, one 10 minute CHFO treatment was performed inline with the vent. Once extubated, patients received CHFO treatments QID for 48 h. After 48 h, patients continued treatment or CHFO was discontinued. Outcomes included postop. hospital and ICU LOS, duration on vent, oxygen usage, and infections needing antibiotics. Postop. outcomes prior to intervention were compared to outcomes post intervention using linear regression for continuous outcomes, and logistic regression for dichotomous outcomes. This study was approved by Mayo Clinic’s IRB.
Results:
104 adult CV patients were studied with an ASA score ≥ 3 between Jan 2018 and Jan 2019, with 54 receiving standard of care and 50 receiving the CHFO Therapy. Standard of care patients tended to be older men (median age 70 yrs vs. 67; P = .009, 74% vs. 62%; P = .19). Compared to standard of care, CHFO Therapy patients had shorter vent days (0.6 days vs 1.1; P = .06), hospital LOS (6.2 days vs. 7.4; P = .04), ICU LOS (2.7 days vs. 3.4; P = .06), and oxygen usage (3.6 days vs. 4.2; P = .34). After multivariable adjustment, ICU LOS remained significant (0.85 fewer days; 95% CI = 0.06 to 1.65; P = .04). The CHFO Therapy group had fewer postop complications (10% vs. 20%; OR = 0.51; P = .26).
Conclusions:
Use of CHFO Therapy for CV patients prior to liberation from MV significantly reduced ICU LOS. Other outcomes of vent days, hospital LOS, and complications were superior although ultimately not different in the protocol group. Larger studies are needed to confirm findings.
Meeting report
Restricted accessMeeting reportFirst published October, 2019pp. 3217971-3217971
Jet nebulizers (JN) are commonly used in emergency departments to deliver bronchodilators in patients with acute asthma exacerbations. Vibrating mesh nebulizers (VMN) have been shown to be more efficient and deliver higher concentrations of medication compared to JN, but there have been no RCTs of VMN versus JN. The purpose of this study was to compare clinical outcomes related to using a VMN versus JN in the treatment of pediatric patients with acute moderate to severe asthma exacerbations.
Methods:
We conducted a single-blinded randomized controlled trial of 217 children (2-18 years old) who had a known history of asthma and presented to the emergency department with an acute moderate to severe exacerbation. Assessment of severity was defined by our acute asthma score (AS), adapted from Pediatric Asthma Score (PAS), which rates severity based on respiratory rate, oxygen requirement, retractions and findings on auscultation (Mild; 1-4, Moderate; 5-8, Severe; 9-12). Patients were randomized to receive treatment via VMN and valved mask or mouthpiece or standard JN with aerosol mask or mouthpiece, and were treated until they received a mild AS and discharged or until decision to admit. Patients were treated per our Acute Asthma Clinical Pathway Algorithm for ED with modifications to allow for blinding and assessment of treatment/dose response.
Results:
108 patients were randomized to receive bronchodilator treatment via VMN and 109 via JN. There was significant difference in initial AS (P < .05) between the two study groups [VMN 9.0 (8.0 - 10.0) vs JN 8.0 (7.0 - 10.0)], but no other significant differences in demographics existed between groups. To adjust for the effect of initial AS, multiple logistic regression model was used to model admission. After adjustment of log-transformed AS and patient weight, patients treated with VMN had a higher probability to be discharged overall compared to patients treated with JN (P = 0.06), and in patients with mask interface, VMN significantly reduced the probability of admission (P = 0.03). The VMN group required significantly fewer treatments [2.0 (1.0 - 3.0) vs 3.0 (2.0 - 5.0), P < .001] and time to reach mild AS [58 mins (33 - 103) vs 81 mins (56 - 133), P = 0.004] compared to JN.
Conclusions:
Patients treated with VMN required significantly fewer treatments and time to achieve mild AS, and in patients with mask interface, VMN significantly reduced the probability of admission compared to JN.
Meeting report
Restricted accessMeeting reportFirst published October, 2019pp. 3218321-3218321
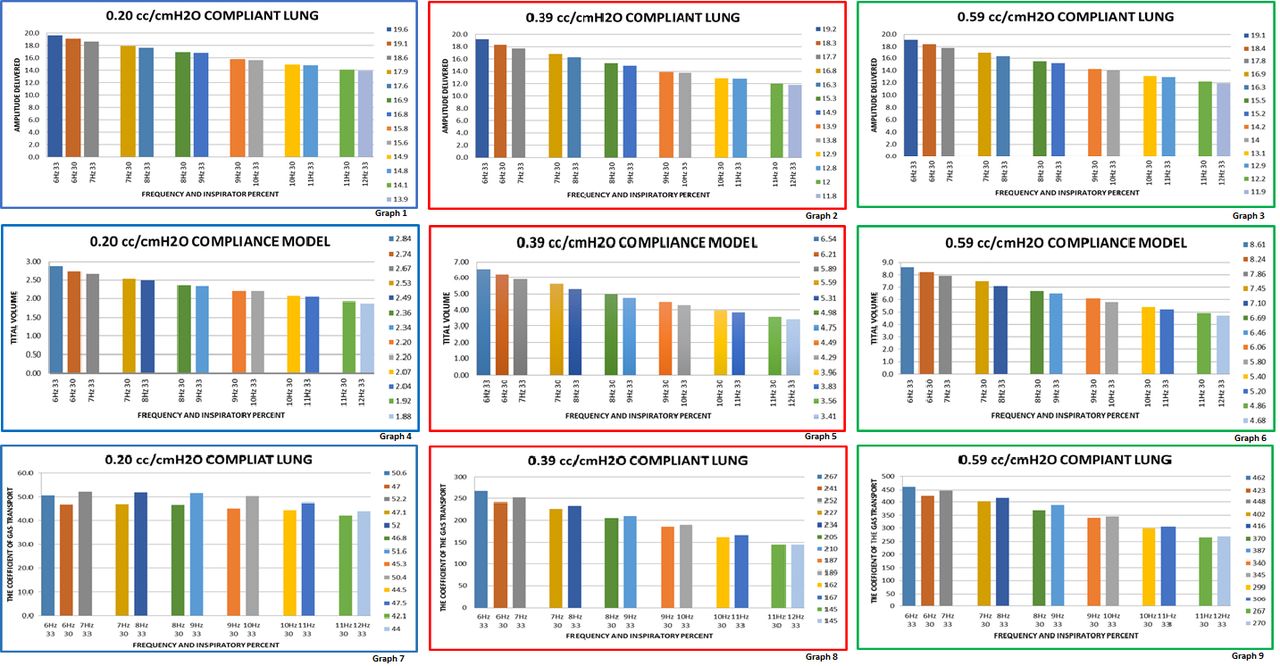
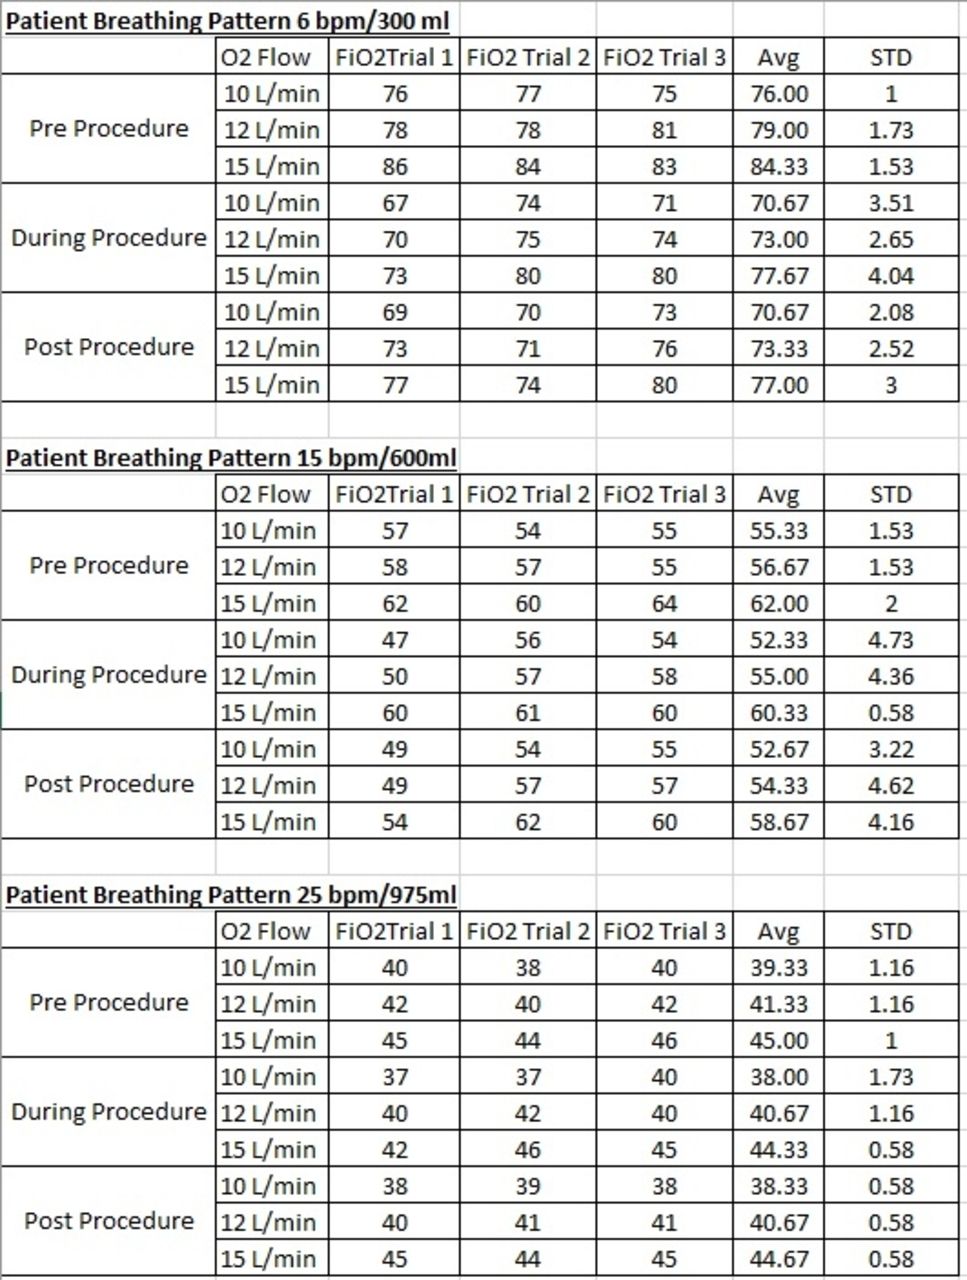
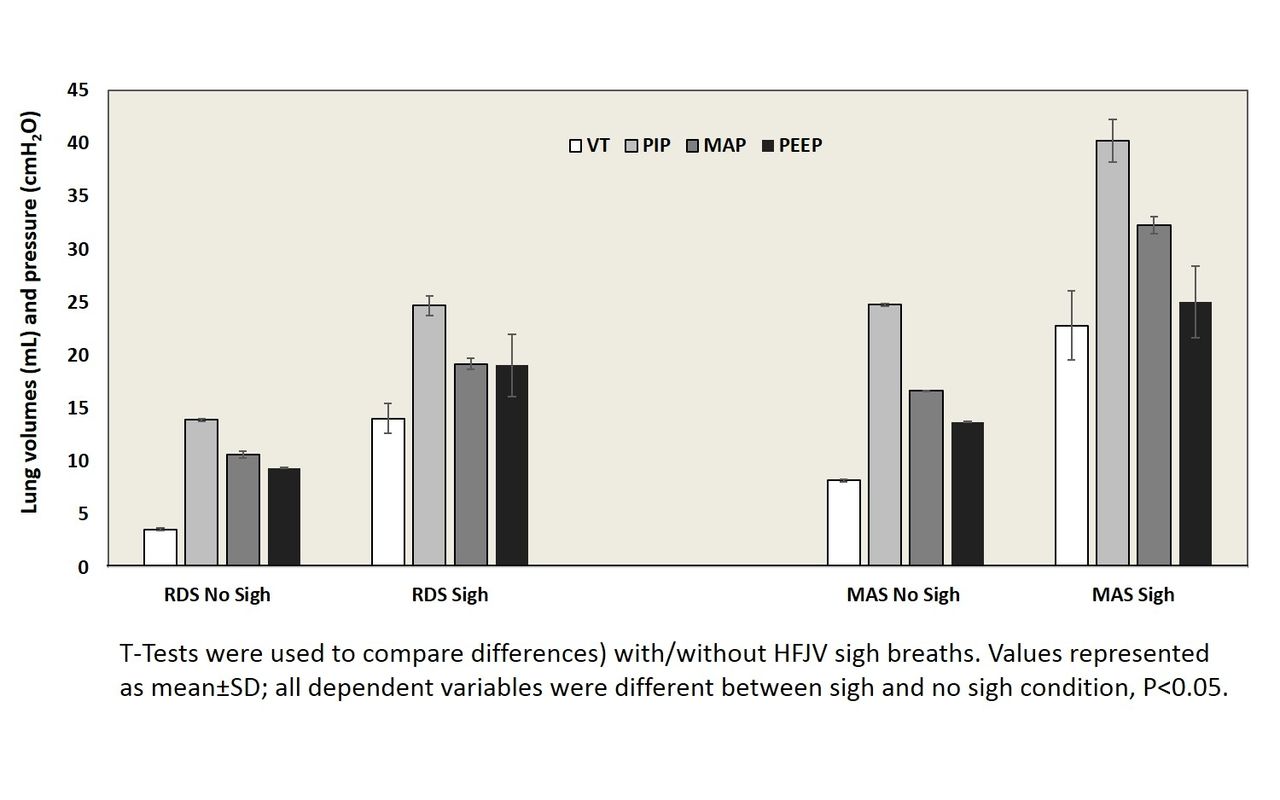
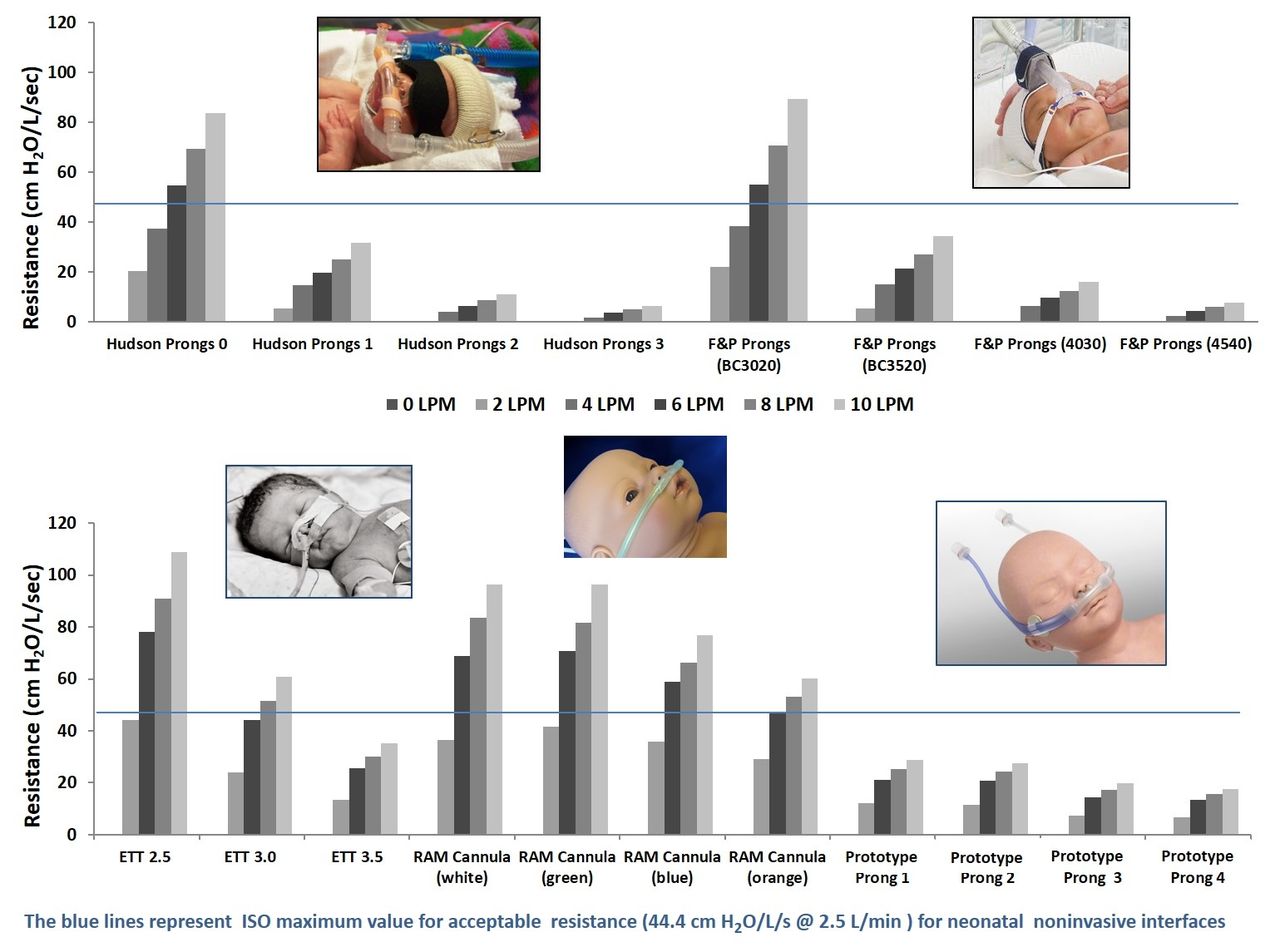
This study looks at the delivered amplitude (amp) and tidal volume (VT) using an inspiratory percent (I%) of 30 at one hertz (Hz) vs the next greater Hz with an I% of 33 using a 3100A high frequency oscillatory ventilator (HFOV). Increasing HFOV Hz is a method of weaning the HFOV ventilated patient. Increasing the Hz decreases the inspiratory and the expiratory time. Despite the fact I:E remains the same, the changes increase the possibility of inadequate time for exhalation. The resulting consequence can be air trapping. The trapping can result in hyper-expansion of the lungs, which can impair gas exchange, increase shunting, and in some cases impair cardiac function if severe enough. This study looks at the delivered amps and VTs to understand if decreasing the I% is a choice in weaning the HFOV.
Methods:
A calibrated HFOV was connected to one of the three test lungs using a full-length endotracheal tube. The lung compliances in cm H2O and ETTs used were; 0.20cc with a 2.5 ETT, 0.39cc with a 3.0 ETT, and 0.59cc with a 3.5 ETT. The HFOV bias flow was maintained at 15 L/min. The MAP at 14 cm H2O (+ - 0.1). The amps were measured in the test lungs using a TSI Certifier. The VT monitor was a Dragger VN 500 BabyLog ventilator.
Results:
The HFOV frequencies tested; 6Hz thru 12Hz. The I% used; 30 and 33 for each frequency, except 12 Hz at 33 I%, only. The amps tested; 16, 18, 20, 22, 24, 26, 28, and 30. The data was collected and placed into a category consisting of the averaged measured values from all 8 amps and VTs from a single Hz at a given I%. The categories were then paired, so a Hz at 30 I% was matched with the category of the next higher Hz at 33 I%(see graphs 1 thru 6). The VT categories were then stratified further using the DLCO2 equation [(f * VT2)/kg] (see graphs 7, 8, and 9). With using in vitro testing the weight aspect of the DLCO2 equation was not completed.
Conclusions:
By decreasing the I% to 30 there is a demonstrated reduction in the delivered amps and VTs. The paired categories results are similar. The 30 I% values are slightly larger than the 33% measurements, except for a few examples. Where 30 I% values are larger you may expect that the change would be a lesser wean. However, when the VT categories are stratified using the DLCO2 equation the data would suggest the Hz at 30 I% would be a marginally greater wean than increasing the Hz at 33 I%. Only clinical application/trial will determine if these assumptions are correct.
Graphs 1, 2, & 3 are the delivered amplitude to the lung model. Graphs 4, 5, & 6 are the delivered tidal volumes. Graphs 7, 8, & 9 are the calculted DLCO2s
Meeting report
Restricted accessMeeting reportFirst published October, 2019pp. 3218413-3218413
Andrew G Miller, Rachel M Gates, Kaitlyn E Haynes , [...]
View All
Abstract
Background:
Scoring systems are frequently used to assess the severity of pediatric asthma exacerbations. The modified pulmonary index score (MPIS) is used in our institution as part of our pediatric asthma pathway. Total MPIS has been found to be highly correlated with pediatric intensive care unit (PICU) length of stay (LOS); however, this was a single center study with a relatively small sample size. We sought to evaluate the use of the MPIS to predict hospital LOS for patients admitted to our PICU.
Methods:
Following IRB approval, the medical records of all pediatric asthma subjects aged 2 to 17 years of age admitted to our PICU between June 2014 and November 2017 were retrospectively reviewed. Subjects were identified via ICD9 and ICD10 codes. We a priori divided subjects into three groups based upon each subject’s first MPIS documented in PICU, low (MPIS 0-5) medium (MPIS 6-9) and high (MPIS ≥10). Hospital LOS, PICU LOS, time on continuous albuterol, and need for increased respiratory support were compared between groups. Data were analyzed with SPSS v24 with nonparametric, chi-squared, and one-way ANOVA performed. Poisson regression analysis was performed to identify PICU admission factors associated with hospital length of stay.
Results:
A total of 143 subjects were included. There were no differences for age, gender, weight, home medications, medical history, cause of exacerbations, noninvasive ventilation use, or need for intubation between groups. There were significant differences between groups for mean heart rate (P < .001), respiratory rate (P < .001), SpO2 (P = .01) and FIO2 (P < .004). There were significant differences between groups for median hospital length of stay (1.2 vs. 2.3 vs. 3.4 days, P < .001), PICU length of stay (0.39 vs. 1.3 vs. 2 days, P < .001), and time on continuous albuterol (7.4 vs. 20.6 vs. 34.7 h, P < .001). There were significant differences between groups for route of admission (P = .03), high-flow nasal cannula use (P < .001), and heliox use (P < .001). After adjusting for demographics and medical history, the incidence risk ratio for hospital LOS was 2.47 for PICU admission MPIS of 7-10 and 3.25 for an MPIS >10 when compared to an MPIS ≤6.
Conclusions:
The MPIS thresholds used in our pathway appear to differentiate exacerbation severity. A higher MPIS is associated with increased hospital LOS, PICU LOS, time on continuous albuterol, need for high-flow nasal cannula and need for heliox.
Meeting report
Restricted accessMeeting reportFirst published October, 2019pp. 3218692-3218692
William F Bucher, Megan Lennon, Jason Head , [...]
View All
Abstract
Background:
Retinopathy of prematurity (ROP) and bronchopulmonary dysplasia (BPD) are significant morbidities of the very low birth weight (VLBW) infant. Hyperoxia, hypoxia, and oxygen fluctuations have been implicated in these disease processes. The ideal target SpO2 range has been the subject of discretion in literature; however, any target range within a larger recommended range is prudent for best practice. An individual unit must determine alarm limits and metrics for tracking compliance with oxygen supplementation.
Methods:
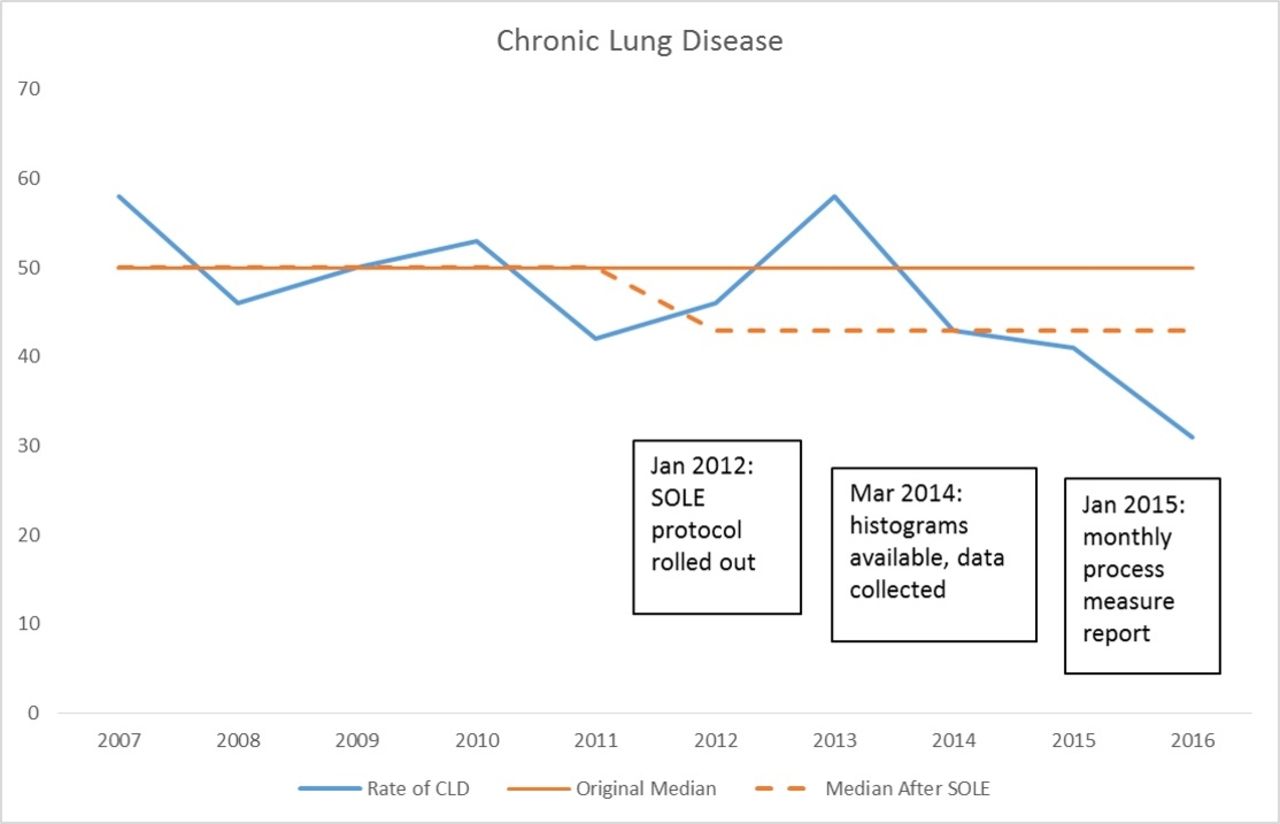
“Save Our Lungs and Eyes” (SOLE) is an oxygen saturation protocol that was implemented to improve SpO2 targeting in VLBW infants. Our unit targets 89 – 94%, and tracks compliance. Histograms for all VLBW patients receiving FIO2 of 30% or more are reviewed every 12 hours and categorized into predetermined oxygen ranges. Using the Model for Improvement, we aim to improve our within range time from an average of 40% of the time to an average of 50% of the time over the next year.
Results:
Since 2014, our within range time was tracked. We averaged 40% of time within range for 2014 and 2015. We increased our time within range in 2016 slightly, but have decreased in 2017.
Conclusions:
Applying improvement science has led to standardization of practice, but high reliability has been difficult to achieve. Our small tests of change, which have included bedside triggers, monitor programming, and education bundles, have led to modest but questionably sustainable improvement. Future directions include peer conversation with other units, further monitor interrogation, and perhaps revisiting our alarms and targets for sustainability of improvement.
Meeting report
Restricted accessMeeting reportFirst published October, 2019pp. 3220862-3220862
Denise Lynn Lauderbaugh, Cheryl Pfrommer Puleo, Daniel Lesser , [...]
View All
Abstract
Background:
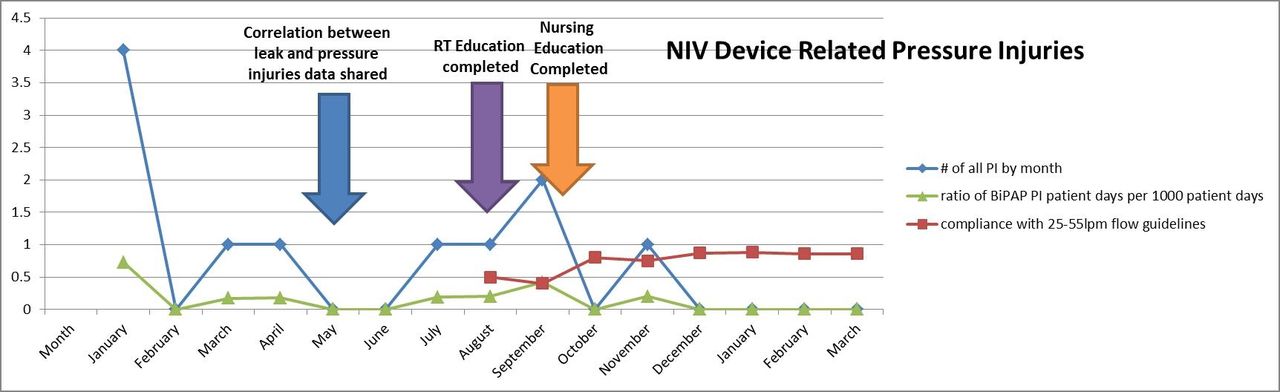
Device related pressure injuries cause pain, disfigurement, morbidity and mortality. Reducing respiratory device related pressure injuries is one of our hospitals operating plan goals. The rate of pressure injuries in January 2018 was 12.46 per 1,000 noninvasive days or 0.70 per 1,000 patient days. A recent study done at our facility revealed a correlation between NIV patient mask leak and pressure injury. Specifically our research identified that there was a correlation with higher patient leaks and pressure injuries. After placing the minimum and maximum patient leaks on the same graph it was noted that there was less pressure injuries in the group with patient leaks >25 L/min and max leaks <55 L/min.
Methods:
An IRB approved prospective interventional design study was conducted on all noninvasively ventilated patients with mask from 02/01/18-2/1/19. We presented the results of our previous correlation study in May 2019. In August and September all respiratory and nursing staff in PICU, ACU, Medical, Hematology/Oncology, and Pulmonary were instructed on the use of leak guidelines for preventing mask device related pressure injuries. Following education, signs were placed on each machine reminding staff of guidelines and weekly audits were implemented to assess compliance. Compliance with flow guidelines reached more than 80% in December 2018.
Results:
Of the 1,932 noninvasive days since education was completed, only one pressure injury has occurred (0.52/1,000 vent days; a 96.79% reduction) or 0.05/1,000 patient days; a 92.86% reduction). Since we reached 80% compliance with maintaining leak guidelines in December 2018, 1,221 noninvasive days has resulted in 0 noninvasive mask related pressure injuries.
Conclusions:
Utilizing flow guidelines to guide mask strap tension on noninvasively ventilated patients with a mask has led to 0 pressure injuries related to this respiratory device. This allowed us to successfully achieve our hospitals operating plan goal within this group.
Meeting report
Restricted accessMeeting reportFirst published October, 2019pp. 3220983-3220983
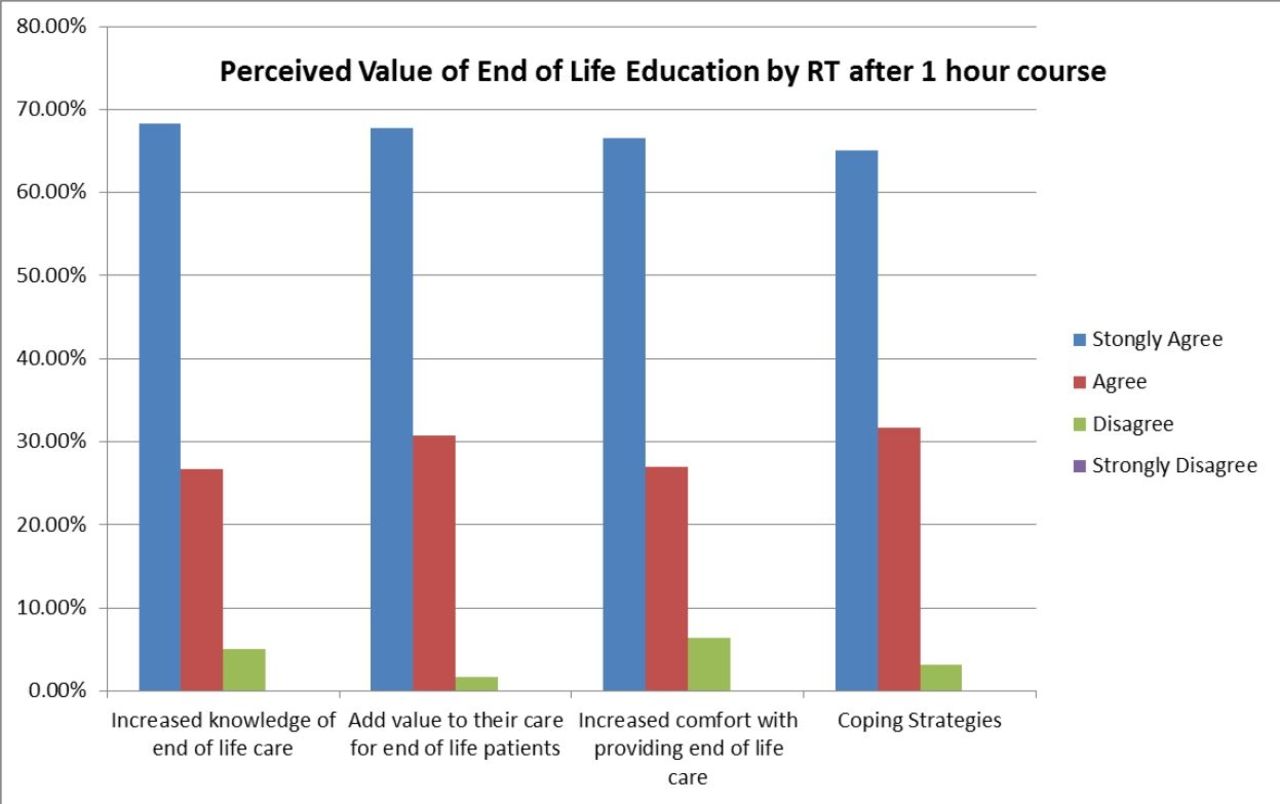
Current Respiratory Therapy programs incorporate minimal palliative and hospice care education in their curriculum; palliative and hospice care is not included in the respiratory care department orientation process; participation in the Main Line Health (MLH) Palliative Care Fellowship highlighted the need to determine baseline RT knowledge and attitudes towards Palliative and Hospice Care and evaluate potential education and engagement opportunities. Literature Review: Much of the literature obtained focused on terminal extubation and end of life care in the critical care setting; Michaud-Young (2009) noted that patients with chronic lung disease require care by clinicians who will be in a position to support them as they approach end of life; an editorial in the September 2017 Lancet journal remarked that palliative care in chronic lung disease is an important and often neglected part of clinical practice.
Methods:
Respiratory therapists at MLH were invited via email and department posted flyers to participate in a palliative and hospice care pre/post education survey; all RTs who completed the pre survey were sent a link to view a short palliative and hospice care video in-service; as well as, complete a post survey.
Results:
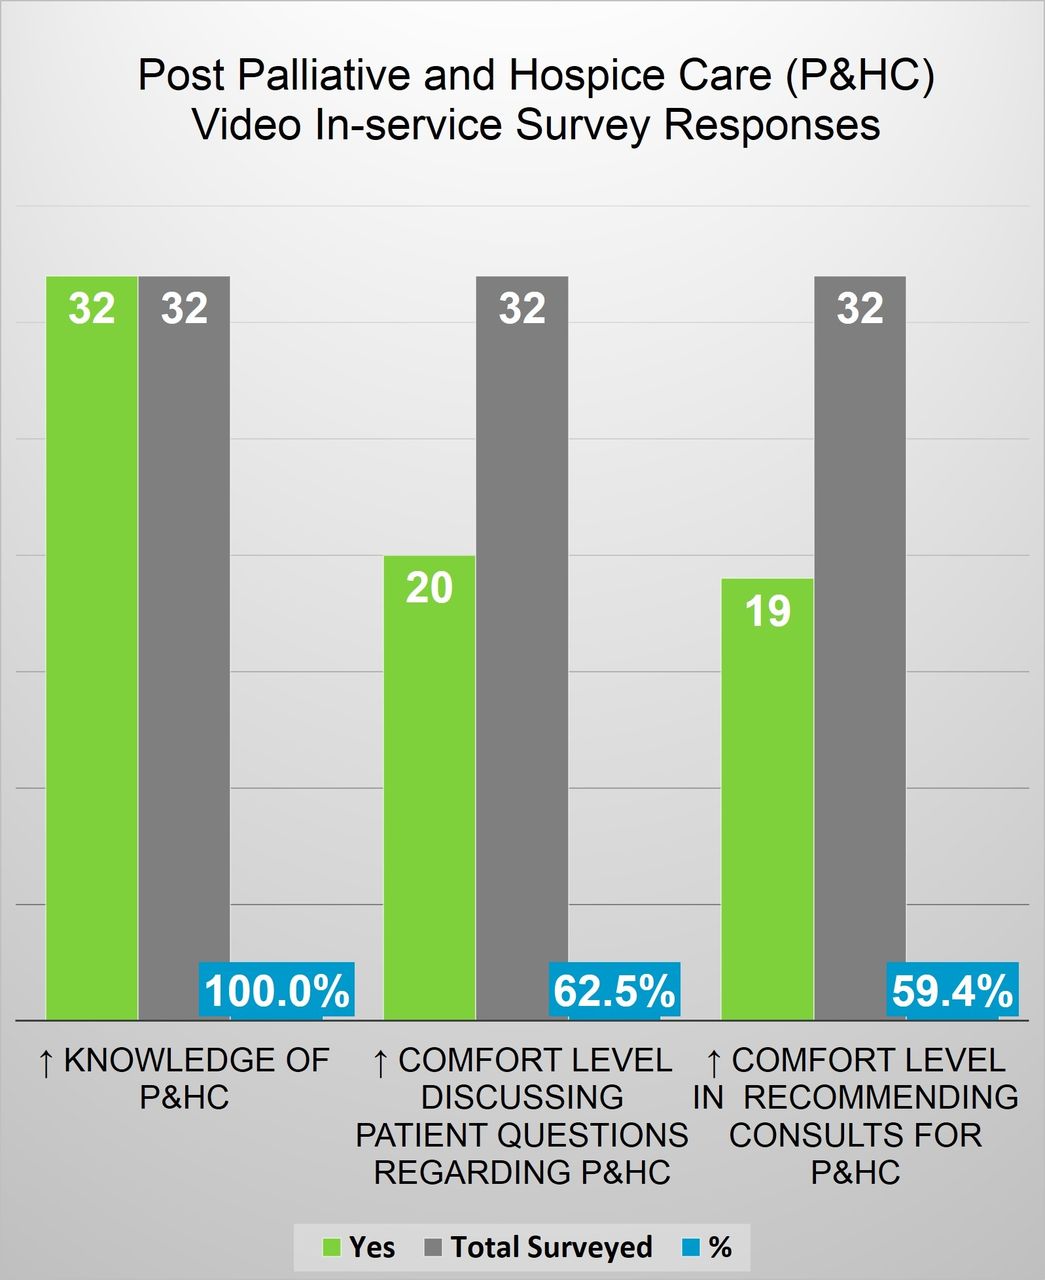
44 of 126 RTs (35%) invited to participate completed the pre-survey, while 32 of 44 RTs (73%) who completed the pre-survey viewed the video in-service and completed the post survey; 91% (40/44) of RTs believe there was not adequate Palliative and Hospice Care education provided during their student training; 98% (43/44) of RTs believe palliative and hospice care should be part of the department orientation process. Post survey/in-service data displayed in chart below.
Conclusions:
Simple education initiatives related to palliative and hospice care may address RT knowledge gaps; as well as, positively impact attitudes related to this topic; incorporating palliative and hospice care into our department orientation process is warranted; with an aging chronic lung disease population there is opportunity for Respiratory Therapists to increase engagement in MLH Palliative and Hospice Care initiatives. Disclosures: None
Meeting report
Restricted accessMeeting reportFirst published October, 2019pp. 3221191-3221191
Texas Children’s Hospital (TCH) is located in Houston, Texas. The TCH Newborn Center has 173 beds separated into three units. The Newborn Center is staffed with 480 registered nurses (RNs), 130 physicians and neonatal nurse practitioners (NNPs), and 50 respiratory therapists (RTs). The task of translating quality improvement (QI) projects related to reducing lung injury from teams to the providers at the bedside is a daunting prospect and one that we struggled with based on having three separate units and such a large staff.
Methods:
The Respiratory Care Department made a commitment to pilot providing Team Leads (TLs) Monday through Friday on the day shift, and Monday through Thursday on the night shift. The TLs were then integrated into the Avoiding Lung Injury (ALI) QI Team which had a focus on minimizing time on the ventilator, a CPAP first strategy, placement of CPAP on in the delivery room, oxygen titration and performing room air trials on qualified infants. The TLs are also engaged with simulation related to decreasing unplanned extubations, performing skin rounds and providing respiratory education to the nursing staff, physicians and NNPs. The TLs attend the morning huddles and report out to the medical teams on infants that are on extubateable settings, infants that are on inhaled nitric oxide and infants that have not had their supplemental oxygen weaned in a week. Monthly educational topics are developed and the TLs will take the education to the bedside for nursing and medical staff.
Results:
Placement of CPAP in the delivery room is at 100%, there have been no serious hospital acquired skin injuries, and the unplanned extubation rate is at a new low of 0.4 events per 100 ventilator days. The culture is shifting in that there are now extubations occurring around the clock and not primarily on the day shift Monday through Friday as was the old routine. The TLs have been able to provide ventilator education to incoming classes of Graduate Nurses and to incoming Fellows and Residents.
Conclusions:
The TLs have had a positive impact on the Newborn Center and are actively engaged in seeking out additional opportunities in which they can get involved. The next step will be to place a cost value to the role so that hospital administration can see the value in having a non-productive, meaning not generating revenue via therapy, positions in the Respiratory Care Department.
Meeting report
Restricted accessMeeting reportFirst published October, 2019pp. 3221203-3221203
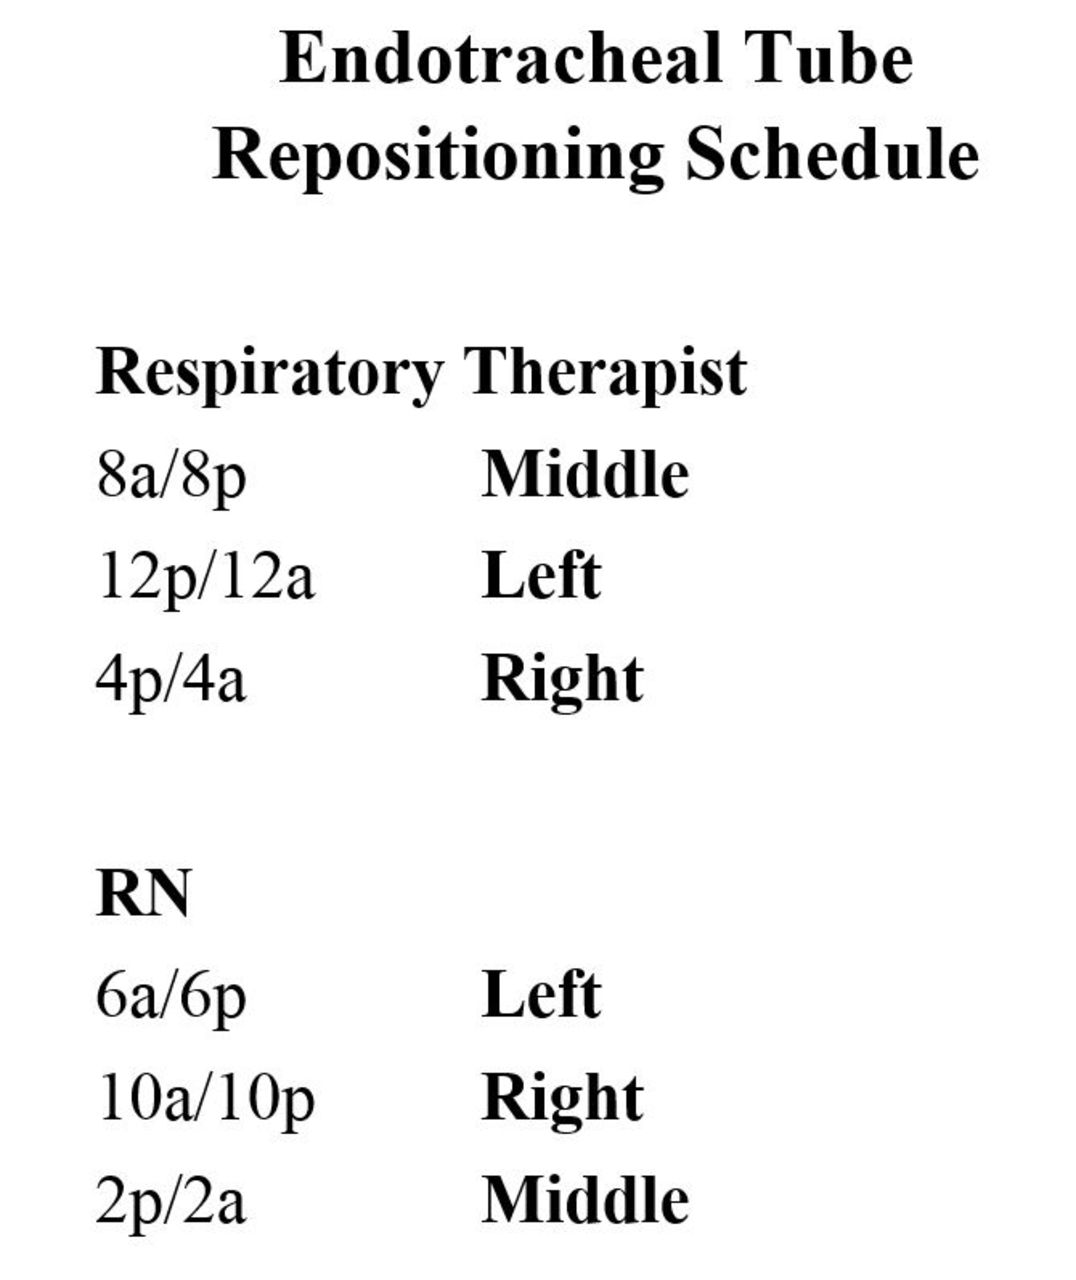
Texas Children’s Hospital (TCH) is located in Houston, Texas. The TCH Newborn Center has 173 beds in three units. TCH Newborn Center manages approximately 25 intubated infants per day with 480 Registered Nurses (RNs), 130 physicians/Neonatal Nurse Practitioners (NNPs), and 50 Respiratory Therapists (RTs). Ues are the fourth most common cause of harm in Neonatal Intensive Care Units in the United States, with approximately 20% resulting in cardiovascular collapse requiring CPR or epinephrine.
Methods:
The Unplanned Extubation (UE) team is comprised of RNs, RTs, physicians, and NNPs that meet weekly to review any Ues from the preceding week and determine trends and potential interventions to help decrease the incidence. Each UE event has a debrief form completed, an in house safety event generated and is documented in the electronic medical record. In the weekly meetings all of the documentation is reviewed and events surrounding the UE are examined to determine a category in which to place the event. The primary categories are depth of the endotracheal tube (ETT), securement device failure, high risk activity (repositioning, weighing, bathing), agitation and unable to theme. The interventions developed and deployed to the units were, the WHERE Campaign, Weight Helps Ensure Right ETT depth, the NRP recommendation for ETT depth was used, weight in kg + 6 = approximate depth of the ETT at the lip. Utilization of an Airway Guardian to maintain the ETT during positioning, movement and invasive procedures. ETT securement was standardized to either tape or a commercial securement device. Rolling simulations were performed throughout the units on both shifts to facilitate comfort with standing transfers for Kangaroo Care. The last intervention looked at the standard ETT securement with tape and was more prescriptive over the amount of cheek coverage that should be attained, with a goal of at least 50% coverage of the area from the corner of the mouth to the ear.
Results:
The UE rate in the Newborn Center from October 2015 to September 2016 was at a high of 2.93 Ues per 100 ventilator days, this was reduced by 41% to a rate of 1.74 over the following year. The rate has continued to decline and in May 2019 has reached our lowest level with 0.4 Ues per 100 ventilator days.
Conclusions:
Despite the challenges of separate units and a large number of people to educate, a concerted and dedicated team can affect sustainable improvement and effect a culture change.
Meeting report
Restricted accessMeeting reportFirst published October, 2019pp. 3221207-3221207
Caregiver education and training for children with tracheostomies is multi-faceted and complex. The process can be lengthy as there are many aspects of care that must be learned, practiced and demonstrated proficiently before discharge home can occur. The process is generally longer for children requiring a home ventilator due to additional training needs. There are on average 20-25 new tracheostomies performed per year at our pediatric institution. The caregiver tracheostomy education process is managed by dedicated respiratory therapists. Changes in documentation and communication were made to the education process in efforts to improve efficiency and reduce the time to complete training as part of an institutional quality improvement program.
Methods:
A tracheostomy list was created within the electronic medical record (EMR) system to identify all inpatients with a tracheostomy. Communication of training status was documented in the treatment team section of the EMR. Education record documentation was revised for tracheostomy teaching specific points. The length of time between the tracheostomy class and completed training was compared before and after the process changes. Inclusion criteria were children who had a tracheostomy placed during July 2017 – January 2019 and whose caregivers received training. Children who had not yet discharged were excluded.
Results:
There were 38 children for whom caregiver tracheostomy education was completed during the defined timeframe. Three were excluded due to ongoing hospitalization. Of the remaining 35 children, 21 (13 ventilated, 8 non-ventilated) received education before changes were implemented and 14 (9 ventilated, 5 non-ventilated) afterwards. The length of time to complete education was reduced for both ventilated and non-ventilated children. See table. Time from completed training to discharge was relatively unchanged.
Conclusions:
Improvements in treatment team communication and EMR documentation were effective in reducing the time to complete caregiver tracheostomy education. Time to discharge can be influenced by many factors not related to the training process. However, completing the training sooner may allow the opportunity for more time to practice skills before discharge.
Days to completed training
Group
Number of subjects
Mean
Median
Standard deviation
Pre Vent
13
40.7
37
19.7
Post Vent
9
27.9
25
14.9
Pre Non-vent
8
16.5
14
12.3
Post Non-vent
5
5
5
3.7
Meeting report
Restricted accessMeeting reportFirst published October, 2019pp. 3221211-3221211
A score-based asthma pathway is utilized at Arkansas Children’s Hospital to manage and treat asthma exacerbation in children. The pathway is initiated by the physician and completed by the respiratory therapist (RT) who assesses and provides treatment based on the score. Frequency of treatments and reassessment is dependent upon the score. When admission from the Emergency Department (ED) for asthma exacerbation occurs, an inpatient RT coordinator evaluates the patient upon arrival to the medical-surgical ward. Delays in treatment and escalations of care have occurred due to waiting on bed placement. During this time, inpatient orders are held until arrival to the ward and the coordinator is unable to assess. We hypothesized that if the RT coordinator evaluated the patient before transferring to the inpatient ward, delays in care would be decreased.
Methods:
The study was approved by the local Institutional Review Board. Several process changes were made including improved communication between the ED admitting nurse and the RT coordinator, patient assessment by the coordinator in the ED, and monitoring of the ED tracker board. A retrospective and prospective chart review was utilized to compare the length of time between rescoring in the ED and on the inpatient ward before and after process changes were made. Children with asthma admitted to the pediatric intensive care unit (PICU) were excluded as assessment is done by the RT assigned to the unit rather than the coordinator.
Results:
There were 261 children with asthma admitted from the ED between June 2018 and January 2019. Of those, 95 were treated before changes were made while 114 where managed with new process. Fifty-two were excluded due to transfer to the PICU. The baseline for time between rescoring in the ED and on the inpatient ward was 132 minutes. Under the new process, the time was reduced to 81.48 minutes which resulted in a 38% decrease in waiting time.
Conclusions:
Implementing process changes for children with asthma admitted from the ED resulted in a significant reduction in the wait time for care.
Meeting report
Restricted accessMeeting reportFirst published October, 2019pp. 3221964-3221964
Delivery efficiency of nebulizers has been described with noninvasive ventilation. However, albuterol delivery to patients with different airway resistance (Raw) and lung compliance (CL) has not been quantified. The purpose of this study is to compare albuterol delivery during noninvasive ventilation of a simulated pediatric with different levels of Raw and CL.
Methods:
A collecting filter at the bronchi of a teaching manikin was attached to a passive test lung (QuickLung, Ingmar Medical) to simulate a spontaneously breathing pediatric. A ventilator (Trilogy 202, Philips) with a single limb circuit (S/T mode, inspiratory pressure: 6 cm H2O, expiratory pressure 8 cm H2O, respiratory rate: 30 breaths/min and I:E ratio 1:2) was connected to a pediatric upper airway manikin via the standard oronasal mask (AF541, Respironics). Albuterol sulfate (2.5 mg/3 mL) was delivered with jet (MistyMax10) and mesh (NIVO) nebulizers at Raw of 5 and 20 cm H2O/L/s and CL of 10 and 20 L/cm H2O during noninvasive ventilation (n = 5). Descriptive statistics and Mann Whitney U test were used for data analysis (P < .05).
Results:
The table below shows inhaled dose% delivered (mean ± SD) distal to the trachea. The mesh nebulizer delivered up to 3-fold more drug than the jet nebulizer in all conditions tested in this study. Regardless of the type of nebulizer used, no significant difference was found between Raw 5 and Raw 20 at CL of 10 L/cm H2O while reducing Raw from 20 cm H2O/L/s to 5 cm H2O/L/s significantly improved aerosol delivery using jet (P = .030) and mesh (P = .040) nebulizers at CL of 20 L/cm H2O. Although aerosol deposition obtained with the mesh nebulizer was not statistically different with CL 10 and 20 L/cm H2O at Raw 20 (P = .55), its delivery efficiency increased with an improvement in lung compliance at Raw 5 (P = .041). Aerosol delivery with the jet nebulizer significantly increased with CL 20 L/cm H2O compared to CL 10 L/cm H2O at Raw 5 (P = .003) and Raw 20 (P = .031).
Conclusions:
At low CL such as 10 L/cm H2O, a significant increase in Raw does not impact aerosol delivery regardless of the type of nebulizer used during NIV while there is an inverse relationship between aerosol deposition and Raw at CL of 20 L/cm H2O. Aerosol delivery with jet and mesh nebulizers improved with an increase in CL during pediatric noninvasive ventilation.
NEBULIZERS
Raw
CL 10 L/cmH2O
CL 20 L/cmH2O
p value
Mesh Nebulizer
5 cmH2O/L/s
14.4 ± 0.7%
17.6 ± 1.8%
0.041
20 cmH2O/L/s
14.0 ± 1.1%
14.5 ± 0.6%
0.55
p value
0.632
0.040
Jet Nebulizer
5 cmH2O/L/s
4.65 ± 0.2%
6.3 ± 0.3%
0.003
20 cmH2O/L/s
4.39 ± 0.5%
5.56 ± 0.3%
0.031
p value
0.487
0.037
Meeting report
Restricted accessMeeting reportFirst published October, 2019pp. 3222518-3222518
Brian Ring, Allison Burbank, Katherine Mills , [...]
View All
Abstract
Background:
Objective measurements of asthma impairment could aid teens in recognition of changes in asthma status over time. Ready access to a conventional spirometer is not realistic outside of the clinical setting. In this proof-of-concept study, we compared the performance of the VitalFlo mobile spirometer to the nSpire KoKo sx1000 spirometer for accuracy in measuring Forced Expiratory Volume in one second (kg/m2) and Forced Vital Capacity (FVC) in adolescents with asthma.
Methods:
Two hundred forty pulmonary function measurements were collected from 48 adolescents with persistent asthma from the University of North Carolina’s pediatric allergy and pulmonology subspecialty clinics. Participants performed spirometry with the nSpireKoKo sx1000 spirometer and the VitalFlo spirometer during their clinic visits. 119 simulated FVC maneuvers were conducted on both devices to standardize measurements. Pearson correlations, Bland-Altman analysis, and two-sample comparison tests were performed to assess the relationship between the two spirometers.
Results:
VitalFlo measurements were significantly highly correlated with nSpireKoKo spirometer values for kg/m2, (r2 = 0.721, [95% CI, 0.749 ± 0.120], P < .001) and FVC (r2 = 0.617, [95% CI, 0.640 ± 0.130], P < .001) measurements. There were no statistically significant differences of the mean kg/m2 (M = 0.00764, SD = 0.364, t(59) = 0.16, P = .87) and FVC measurements (M = 0.00261, SD = 0.565, t(59) = 0.036, P = .97) between the VitalFlo and nSpireKoKo systems. Both devices demonstrated significantly high correlation when comparing the automated FVC (r2 = 0.997, [ 95% CI, 1.00 ± 0.00974] P < .001) measurements. Bland-Altman plots did not demonstrate significant bias between devices for both kg/m2 and FVC measurements.
Conclusions:
Lung function measurements from the VitalFlo mobile spirometer were comparable to a commercially-available spirometer commonly used in clinical settings. This validated app-based spirometer for home use has the potential to improve asthma self-management.
Meeting report
Restricted accessMeeting reportFirst published October, 2019pp. 3222942-3222942
Noninvasive ventilation (NIV) provides ventilatory support for spontaneously breathing patients without requiring an artificial airway. Questions remain regarding carbon dioxide (CO2) clearance while using a conventional ventilator and dual limb circuit with various patient interfaces. The purpose of this study is to determine the PEEP level required to effectively washout CO2 for full-face and oronasal masks, and assess their comfort.
Methods:
This randomized crossover trial was conducted at an academic medical center in the Midwest. After obtaining informed consent, 8 healthy volunteers were placed on a 980 Puritan Bennett (Medtronic, Minneapolis, MN) ventilator operating in the NIV mode. All subjects performed 20 minutes of breathing on 4 levels of PEEP (0, 2, 4, and 5 cm H2O) and pressure support of 5 cm H2O. NIV settings were applied to 4 masks (2 oronasal and 2 full-face masks) that were randomly selected with a 5-minute wash out period between each mask. Fraction of inspired carbon dioxide (FICO2) was sampled/monitored with a nasal cannula using a CapnostreamTM 20p monitor (Medtronic, Minneapolis, MN) and reported as percentages. Additionally, subjective mask comfort was assessed via visual analog scale (VAS). A Kruskal-Wallis test was used to reveal significance difference across PEEP levels. Pairwise comparisons of the groups were made using Mann-Whitney tests with a Bonferroni correction.
Results:
FICO2 was significantly lower at PEEP of 5 (0.0%, IQR: 0, 0.92) compared to PEEP of 0 (1.83%, IQR 0.66, 4.0, P < .001) or PEEP of 2 (1.0%, IQR 0.33, 2.66, P = .002). FICO2 was significantly lower at PEEP of 4 (0.5%, IQR: 0, 1.92) compared to PEEP of 0 (P = .001). Comparison of masks’ level of comfort showed no significance differences.
Conclusions:
A PEEP level of at least 5 cm H2O was required to minimize the likelihood of CO2 rebreathing while using a critical care ventilator with a double limb circuit and full-face or oronasal masks. Although masks comfort level was not significantly different, it should be assessed in a larger sample size.
Median Fraction of Inspired CO2 at Various PEEP Levels During NIV Using a Critical Care Ventilator with Full-Face and Oronasal Masks
Meeting report
Restricted accessMeeting reportFirst published October, 2019pp. 3223019-3223019
While numerous factors influence employee engagement, communication is considered the cornerstone of an engaged workforce. When department operations run 24/7 and staff work 3 days a week, face to face communication can be limited compared to traditional workplace settings. The primary purpose of this study was to evaluate the effect new communication tools would have on the perception of communication in employee engagement scores, particularly communication drivers.
Methods:
We conducted pre/post surveys of staff perceptions of communication and trend analysis of 2018/2019 employee engagement results. New communication tools included a smart phone app, department newsletter, communication board, start of shift check-ins. We hypothesized an improvement in post-implementation survey results and post-implementation employee engagement survey drivers in communication category, demonstrating improvement in both perception of communication and employee engagement.
Results:
The pre/post implementation surveys showed 68% of staff were satisfied with overall communication pre-implementation compared to 65% post-implementation. While there was a slight decrease in overall satisfaction with communication, the respondents were given an option to provide comments which revealed overall positive opinions about the new communication tools. For the employee engagement survey, two questions in the Communication and Input category were evaluated for positive agreement by answering either Strongly Agree or Agree. 51.3% agreed in 2019 “I am kept informed of the organization’s future plans and direction” compared to 50.6% in 2018, a 0.7% improvement. 72.7% agreed in 2019 “My manager communicates messages that my coworkers need to hear, even when the information is unpleasant” compared to 62.7% in 2018, a 10.1% improvement.
Conclusions:
We did not demonstrate improvement in perception of communication by implementation of these communication tools. We did see improvement in employee engagement responses, however, we cannot conclude that the new communication tools specifically contributed. We identified factors which may have influenced results during this timeframe, including leadership changes, management of confidential HR matters, and general adjustment to change. Ongoing assessment and evaluation of communication methods are needed to determine best approaches as staff demographics change, department needs shift, and technology evolves. Disclosures: None
Meeting report
Restricted accessMeeting reportFirst published October, 2019pp. 3223054-3223054
Delivery of albuterol in-line with heated high flow nasal cannula (HHFNC) using a vibrating mesh nebulizer is frequently used in the hospital setting. HHFNC systems are now available for home use, however efficacy of aerosol delivery with these devices is unknown.
Methods:
An anatomically correct pediatric model of a spontaneously breathing 5-year old child was connected in series to a filter (lung dose), and to a breathing simulator (tidal volume 200 mL, breathing frequency 20, inspiratory time 0.9 s). An AIRVO 2 HHFNC system (Fisher & Paykel) was connected to an Optiflow Junior 2 XL cannula, and operated at 5 and 15 L/min. A Solo vibrating mesh nebulizer (Aerogen) was placed between the circuit and the cannula using a proprietary adapter or regular t-piece adapter. The heating chamber was modified to allow placement of the nebulizer in the dry or in the wet side of the humidifier. Four units of the nebulizers loaded with 10 mg/2 mL of albuterol were tested. Albuterol mass was measured via spectrophotometer, and reported as percentage of loading dose.
Results:
See table.
Conclusions:
Aerosol delivery in-line with a heated high flow nasal cannula system designed for home use was inefficient except when a t-piece adapter was used between the circuit and the cannula. Lower flow improved aerosol delivery for the same system.
Results (X ± SD)
Flow
Proprietary adapter
T-piece adapter
Dry side of humidifier
Wet side of humidifier
5 L/min
1.07 ± 0.08
5.14 ± 0.46*#
0.16 ± 0.04
0.21 ± 0.04
15 L/min
0.81 ± 0.36
2.66 ± 0.75#
0.29 ± 0.12
0.39 ± 0.18
*P = 0.002 compared to 15 L/min. #P < 0.0003 compared to other adapters for same flow.
Meeting report
Restricted accessMeeting reportFirst published October, 2019pp. 3223218-3223218
Endotracheal tube (ETT) cuff leak in intubated patients is one of the leading causes of aspiration pneumonia and ventilator-associated pneumonia. The primary functions of the ETT cuff are to prevent air leak and minimize aspiration. The recommended cuff pressure ranges from 20 to 30 cm H2O. The purpose of this study was to evaluate the ETT cuff compliance change over time while maintaining the cuff pressure at 30 cm H2O.
Methods:
IRB approval was not required for this laboratory study. Under controlled conditions, the Laerdal Airway Management Trainer (Wappingers Falls, NY) was intubated with three different sizes of ETT (8.0,7.5, and 7.0) (Covidien/Medtronic, Minneapolis, MN). The depth of ETT was 22 cm at the incisors and the ETT was secured with regular ETT tape. A three-way stopcock was used with ports connected to the ETT pilot balloon, Posey Cufflator (Arcadia, CA), and 10 mL syringe. The cuff was inflated with the syringe until Cufflator reads 30 cm H2O of pressure. Volume of air needed to reach 30 cm H2O was recorded. The stopcock was removed and the Cufflator was subsequently used to check and maintain cuff pressure at 30 cm H2O every 6 to 8 hours. Same steps were repeated for 14 days for each ETT tube. Confidence intervals (CI) for the mean were calculated with a significant level of <0.58 for all 3 sets of sample data.
Results:
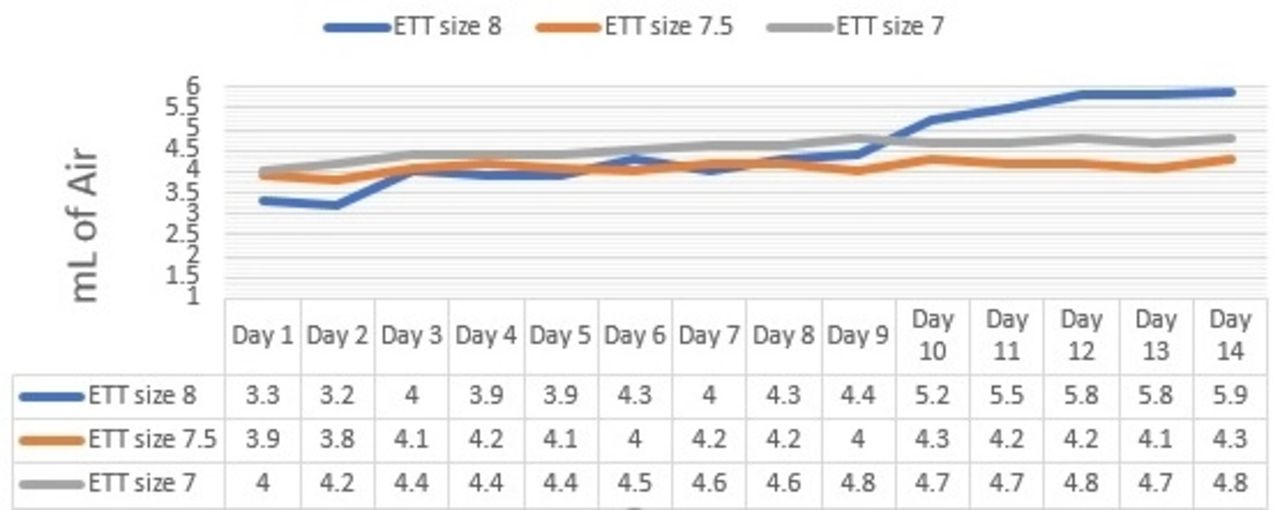
After 14 days of maintaining the cuff pressure at 30 cm H2O, all three ETT require more volume to maintain cuff pressure at 30 cm H2O (Figure 1). The size 8.0 ETT shows an increase of volume from 3.3 mL (day 1) to 5.9 mL (day 14). The size 7.5 ETT shows an increase of volume from 3.9 mL (day 1) to 4.3 mL (day 14). The size 7.0 ETT shows an increase of volume from 4.0 mL (day 1) to 4.8 mL (day 14). The calculated CI for ETT sizes 8.0, 7.5, and 7.0 are 0.54, 0.08, and 0.13 respectively. All three data sets show a significant volume change from day 1 to day 14.
Conclusions:
More cuff volume is needed to maintain the cuff pressure following sustained cuff inflation. Since compliance is determined by the volume and pressure, the volume increase at day 14 infers that the cuff compliance has increased over the course of 14 days. Routine use of the recommended cuff pressure should be done along with careful airway assessment in order to prevent inadvertent overinflation of the ETT cuff. A limitation of this study is that human subjects were not available due to IRB restrictions.
Figure 1 Volume of air needed to maintain cuff pressure at 30 cm H2O from day 1 to day 14
Meeting report
Restricted accessMeeting reportFirst published October, 2019pp. 3223338-3223338
Hassan Ali Al Gazwi, Elalfy E Ibrahim, Zaki Al Al Hammad , [...]
View All
Abstract
Background:
Middle East Respiratory Syndrome Coronavirus (MERS-CoV) is a novel betacoronavirus that was first reported in Saudi Arabia 2012. The majority of infected cases were reported in Saudi Arabia too. Extracorporeal membrane oxygenation (ECMO) is an option as a rescue therapy for patients with refractory hypoxemia and has been successfully used in young patients with severe ARDS secondary H1N1 influenza with refractory hypoxemia. Aim: We conducted a retrospective study to determine the mortality rate of severe ARDS secondary to MERS-CoV infection in response to ECMO therapy in our adult ICU.
Methods:
A retrospective analysis of data from all patients admitted to our adult 23-bed mixed ICU with MERS-CoV infection who developed severe ARDS and been mechanically ventilated between March 1, 2013 and August 30, 2016.
Results:
During the period from March 1, 2013 and August 30, 2016, 32 patients were admitted with severe ARDS secondary to MERS-CoV infection (mean age 54 ± 21 years, 25 [78.1%] males). Bilateral pulmonary infiltrates were reported in all patients. Invasive mechanical ventilation and ECMO therapy was applied in all patients and vasopressor therapy in 26 (81.2%) patients during the ICU stay. Twenty-four (75%) patients died in the ICU. Non-survivors were older and/or had high APACHE II scores on admission.
Conclusions:
Severe ARDS secondary to MERS-CoV infection is associated with high mortality. ECMO therapy was associated with better survival rates and outcomes in younger patients and the patients who had lower APACHE II scores.
Meeting report
Restricted accessMeeting reportFirst published October, 2019pp. 3223485-3223485
Rural hospitals have a difficult time recruiting pulmonologists and intensivists; not every provider in the Sarah Bush Lincoln Health System (SBLHS) has ventilator privileges. Historically, challenges have been receiving timely orders, evaluating vent settings, and aggressive weaning. Current research suggests RT driven protocols are safe and efficient ways to manage ventilated patients.
Methods:
An RT and RN driven protocol was co-developed and adopted to better facilitate a more consistent ventilator weaning process for patients. Beginning in January 2018, an algorithm was piloted at SBLHS. Patients were evaluated daily by nursing with a safety screen and subsequent spontaneous breathing trial (SBT) by RT if the patient qualified. During the vent weaning process, and upon completion of the SBT, patients are evaluated by a remote telemedicine multidisciplinary team comprised of RT, RN, and an intensivist. Upon successful completion of a SBT, even if a SBLHS provider is unavailable, a remote telemedicine intensivist can provide optimization or extubation orders. Examples of optimization orders may be changes such as sedation, vent settings, further blood gas analysis or a repeat wean trial later in the day. Continuous feedback and case reviews were evaluated along the way.
Results:
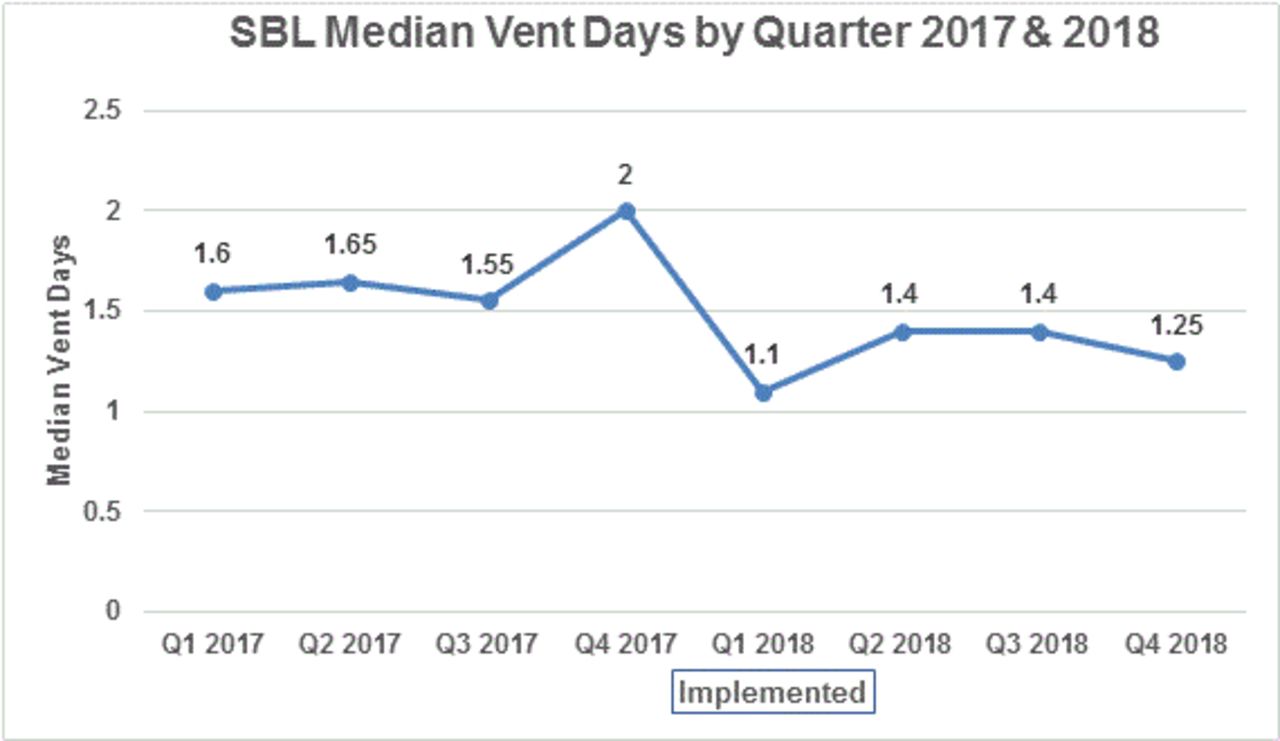
Two years of data was collected and evaluated. In 2017 and 2018, SBLHS had a total of 220 ventilated patients in our adult CCU. The top three diagnoses of patients who were maintained on ventilators were sepsis, surgery, and overdose, which account for nearly 63% of all intubated patients at SBLHS. One year after implementing the weaning process, our critical care unit saw a 24% reduction in median vent days.
Conclusions:
The addition of telemedicine support allows for timely provider orders and supports the bedside CCU staff with the vent weaning process. Regardless of time of day, this weaning process has improved communication and collaboration at the bedside through telemedicine support. This support has optimized ventilated patient outcomes, by decreasing ventilator days. RT and RN led protocols with the support of telemedicine have decreased median vent days in a rural community hospital. This study helps to set the stage for other opportunities that might exists between RT/RN led quality metrics. Barriers to this data include staff and provider buy-in. This study was approved by the institutional IRB. Disclosures: None
Meeting report
Restricted accessMeeting reportFirst published October, 2019pp. 3223902-3223902
The purpose of this study was to investigate if sleeping with a weighted blanket improves the quality of sleep for the user. Weighted blanket manufacturers claim that sleeping with a weighted blanket improves sleep quality by reducing anxiety, stress and insomnia. There is dearth research to support their claims besides user testimonies.
Methods:
Participation in this study included having individuals wear an out of center sleep testing device (OCST) for two nights. This device measured total sleep time, sleep efficiency, sleep onset and snoring. After the participants slept the first night wearing the OCST without the weighted blanket, they were then asked to sleep with weighted blanket and repeat the study. An 8 question Epworth Scale was also used to evaluate participants predisposition to sleep disorders. Informed consent was obtained.
Results:
A total of 10 subjects participated in this study. Due to tight academic time constraints the total number of participants was limited. Comparison between sleeping with and without the weighted blanket yielded mixed results. An increase in total sleep time was found in 40% of the participants, a decrease in sleep onset in 60% of participants, a decrease in snoring episodes in 40%, and an increase in sleep efficiency in 50% of the participants.
Conclusions:
There is an expanding market for consumers searching for easy solutions to poor sleep quality as well as a huge emphasis on the need for sleep education today. Dearth amount of data is available to prove or disprove the claims that weighted blankets improve the user’s sleep quality. With the mixed results from this study, and the lack of available research, more research needs to be done to determine the effects of weighted blankets on sleep quality.
Meeting report
Restricted accessMeeting reportFirst published October, 2019pp. 3224120-3224120
Sherwin E. Morgan, George V. Mathai, Gino Thomas , [...]
View All
Abstract
Background:
The standard for administering aerosolized medication (AM) to infants and toddlers has been via jet nebulizer with face mask (FM). Continuous nebulization (CN) with a bronchodilator has been used to treat asthma symptoms. High flow nasal cannula (HNFC) is the treatment of choice for kids in respiratory distress. Globally, trans-nasal (TN) pulmonary AM delivery via HFNC has been receiving increasing clinical attention for comfort treatment, but, presents a challenge when used in conjunction with CN via FM. Several published in vitro studies demonstrated that AM deposition in infant lung models were vastly reduced when interfaced with a FM. Particularly, if applied on top of the HFNC appliance or if a pacifier is present or the baby is stressed. Furthermore, comfort levels for infant and parent may decrease and impact AM delivery.
Methods:
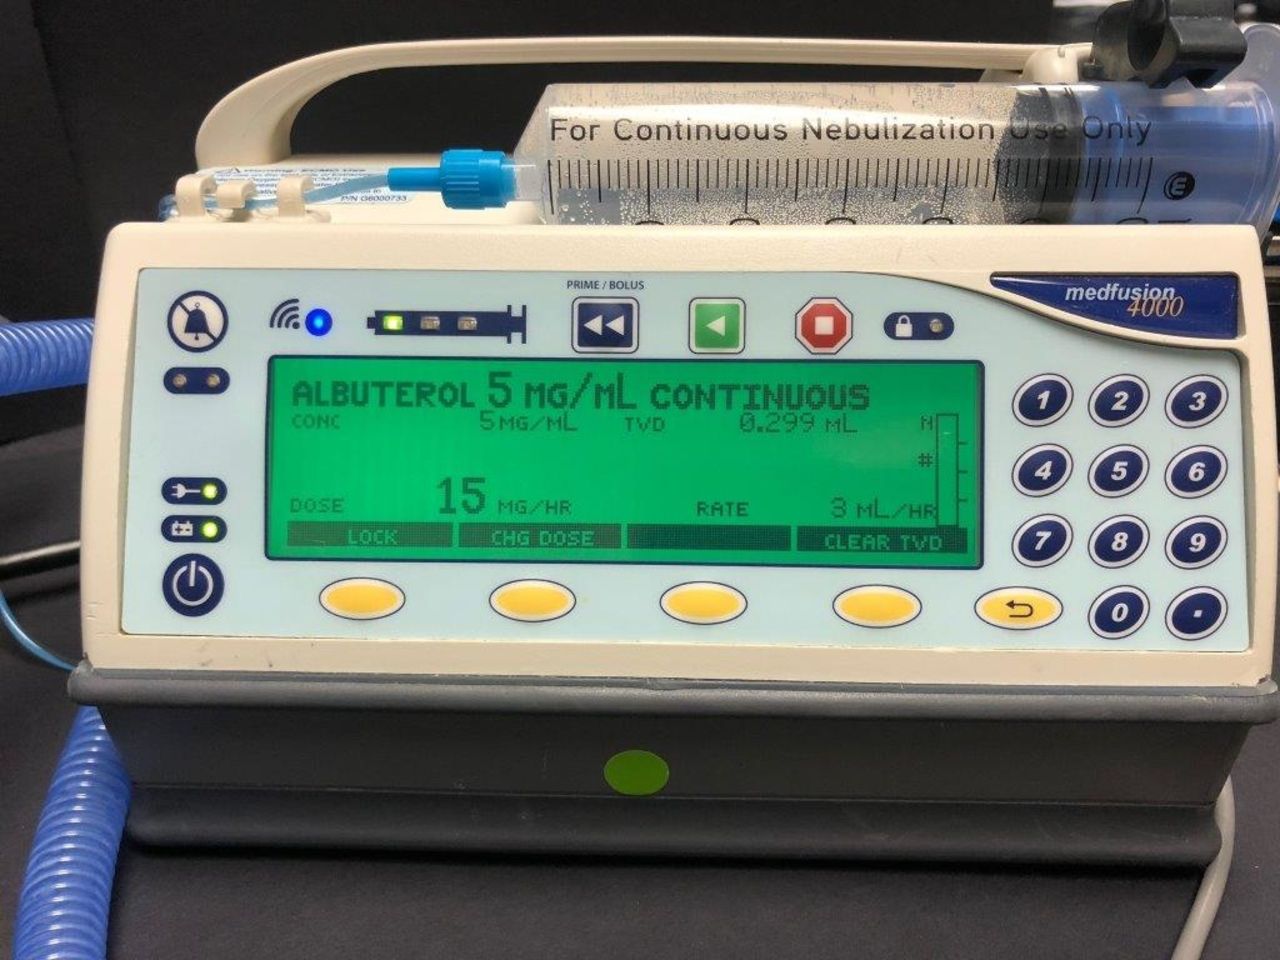
This study examined the performance of a vibrating mesh nebulizer (VMN) (Aerogen nebulizer), HFNC in conjunction with an MedFusion 4000 syringe pump (SP) to measure AM output at varied mg/h. The HFNC equipment consisted of: (MR850 humidifier chamber (HC) with an RT329 infant heated wire circuit), products by Fisher & Paykel Healthcare. Our Pharmacy Department added 0.5% (albuterol - 5 mg/mL continuous) into the SP library program. NaCL solution was substituted for albuterol, 20 mL was drawn up into a 60 cc syringe was connected to the SP. The VMN was installed on the dry side of the HC. An RT329 circuit was used during the evaluation with gas flows set at 2 to 6 L/min. The SP was programmed in mg/h. The liquid solution was dropped onto the VMN for the creation of aerosol mist.
The SP performed up to manufactures specifications comparing set mL/h to total volume delivered in mL/h at different mg/h. The advantages of TN-AM via SP; precise drug concentration delivered in mg/h, no (NaCL) dilution required with less AM loss into the surrounding environment with more available for inhalation. The FM is not required and may improve comfort score and overall AM deposition. Liberation is achieved by modifying mg/h or frequency/h. More In vitro and in vivo investigations are needed to determine objective dose effectiveness of TN - AM delivery, or if different mg/h concentrations have an effect on clinical outcomes.
Meeting report
Restricted accessMeeting reportFirst published October, 2019pp. 3224136-3224136
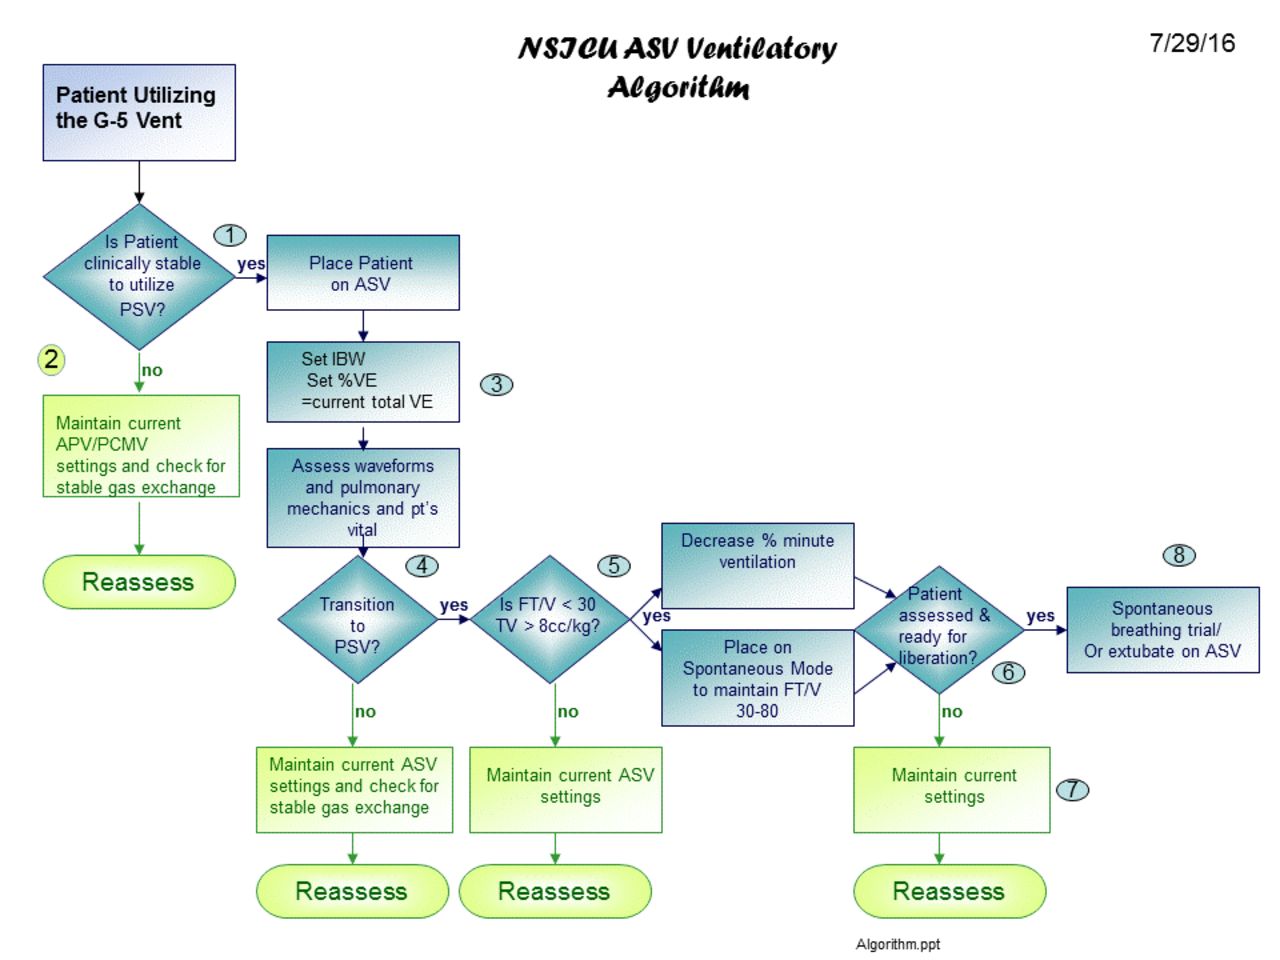
The role of mechanical ventilation is to improve gas exchange and reduce the patient’s work of breathing. Unfortunately, prolonged ventilation is associated with many negative sequelae. It is imperative when clinical stability is achieved that the goal of ventilator liberation is facilitated. Adaptive support ventilation (ASV) is a novel mode of ventilation that provides a closed loop assessment of mechanically ventilated patients. The mode will adjust delivered tidal volume and set respiratory rate based on feedback physiological data and patient interaction. If the patient starts breathing spontaneously, the mode adjusts from time-cycled ventilation to flow-cycled ventilation and may wean the patient without clinician ventilator interaction. This facilitation of weaning may decrease ventilator duration and facilitate ventilatory liberation. Mechanical ventilation in a neuro-science ICU (NSICU) is often utilized for patients with a normal respiratory status but an altered neurological function. The goal of mechanical ventilation in the majority of patients is to optimize gas exchange until the patient is neurologically stable and awake. Typically pedestrian ventilator parameters are required to achieve these clinical end-points. The standard practice to facilitate ventilator liberation was to transition the patient from volume target CMV ventilation to flow-cycle PSV and then perform a spontaneous breathing trial prior to extubation.
Methods:
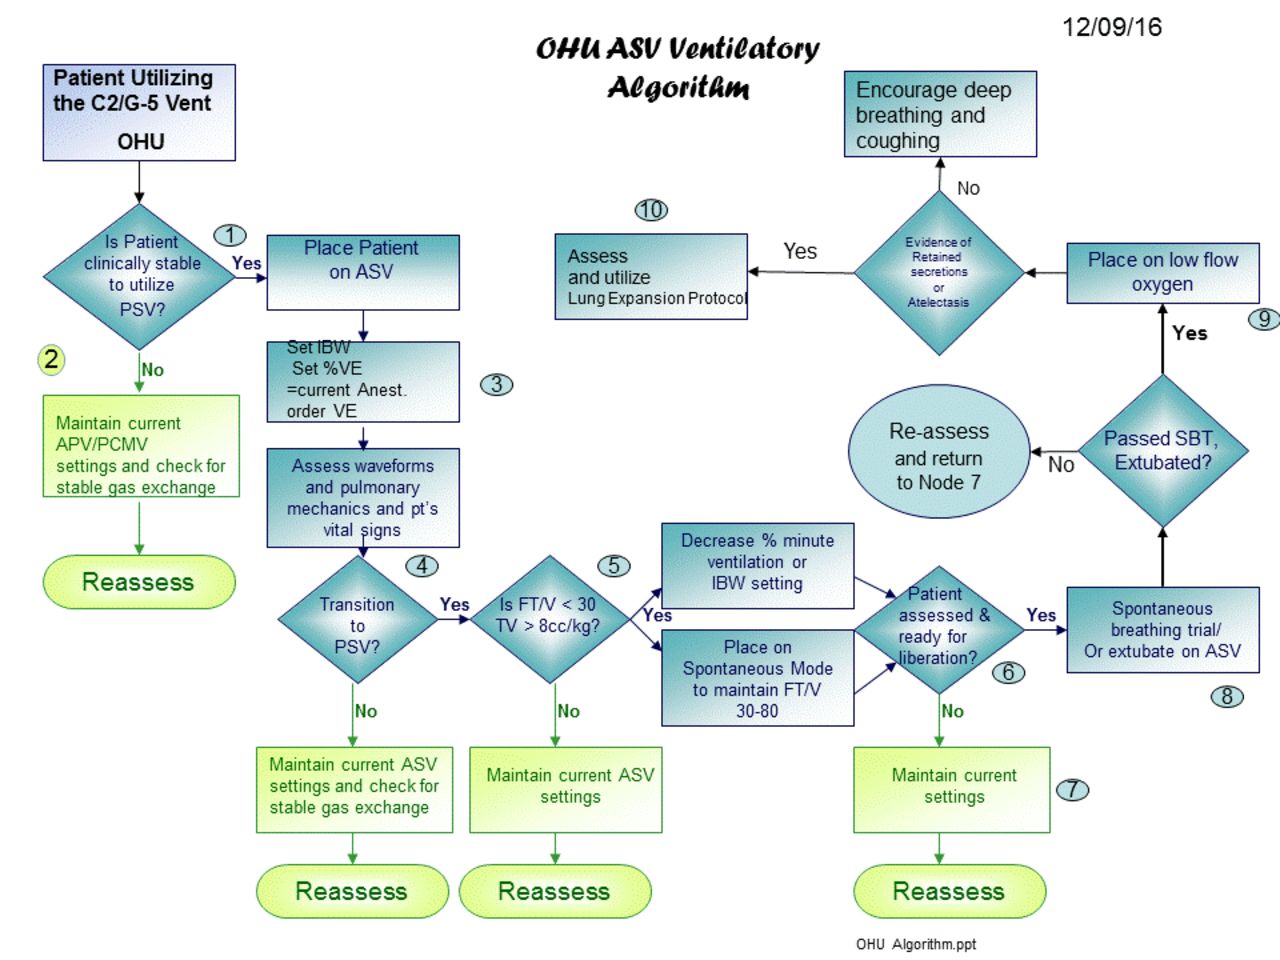
In attempt to facilitate ventilator liberation thus decrease ventilator duration we implemented ASV as the default ventilator mode in stable NSICU patients. An ASV ventilator protocol was developed and any patient meeting the inclusion criteria was placed on 100% MV via ASV mode (figure 1).
Results:
Over a 6-month time frame the utilization the ASV mode in the NICU reduced ventilator duration from the historical length of 5.6 days to 4.1 days. Re-intubation rates remained < 5% and ventilator-associated pneumonia< 1%.
Conclusions:
Based on our clinic experience ASV can facilitate the weaning process and reduce ventilator duration in a NSICU. By automatically transitioning from time-cycle to flow cycle ventilation and titrating PSV levels to a desired tidal volume the ASV mode can expedite the weaning process in clinically stable patients.
Meeting report
Restricted accessMeeting reportFirst published October, 2019pp. 3224144-3224144
The role of mechanical ventilation is to improve gas exchange and reduce the patient’s work of breathing. Unfortunately, prolonged ventilation is associated with many negative sequelae. It is imperative when clinical stability is achieved that the goal of ventilator liberation is facilitated. Adaptive support ventilation (ASV) is a novel mode of ventilation that provides a closed loop assessment of mechanically ventilated patients. The mode will adjust delivered tidal volume and set respiratory rate based on feedback physiological data and patient interaction. If the patient starts breathing spontaneously, the mode adjusts from time-cycled ventilation to flow-cycled ventilation and may wean the patient without clinician ventilator interaction. This facilitation of weaning may decrease ventilator duration and facilitate ventilatory liberation. Mechanical ventilation in a thoracic open heart unit (OHU) is often utilized for patients with a normal respiratory status but an altered neurological function secondary to post-operative sedation. The goal of mechanical ventilation in the majority of patients is to optimize gas exchange until the patient is awake and spontaneous breathing. Typically pedestrian ventilator parameters are required to achieve these clinical end-points. The standard practice to facilitate ventilator liberation was to transition the patient from volume target CMV ventilation to flow-cycle PSV and then perform a spontaneous breathing trial prior to extubation.
Methods:
In attempt to facilitate ventilator liberation and thus decrease ventilator duration we implemented ASV as the default ventilator mode in stable OHU patients. An ASV OHU ventilator protocol was developed and any patient meeting the inclusion criteria was placed on 100% MV via ASV mode (figure 1).
Results:
Over a 6-month time frame the utilization the ASV mode in the OHU reduced ventilator duration in clinically stable OHU patients from the historical length of 11.1 h. to 5.5 h. Re-intubation rates remained< 1% and ventilator-associated pneumonia< 1%.
Conclusions:
Based on our clinic experience ASV can facilitate the weaning process and reduce ventilator duration in OHU patients. By automatically transitioning from time-cycle to flow cycle ventilation and titrating PSV levels to a desired tidal volume the ASV mode can expedite the weaning process in clinically stable patients in a OHU.
Meeting report
Restricted accessMeeting reportFirst published October, 2019pp. 3224195-3224195
Matthew S Pavlichko, Joshua Good, Marnie Lisa Cerino , [...]
View All
Abstract
Background:
Employee engagement is a hot topic in healthcare and a strategic focus in many high performing organizations. Engagement leads to improved performance, higher productivity, and less turnover yet, according to a Gallup poll, 68% of the U.S. workforce is disengaged. The Studer Group, an authority on this topic, believes eliciting employee feedback through rounding is a foundation tactic to improve engagement. But, gathering feedback without mining for solutions delivers no opportunity for improving operational results.
Methods:
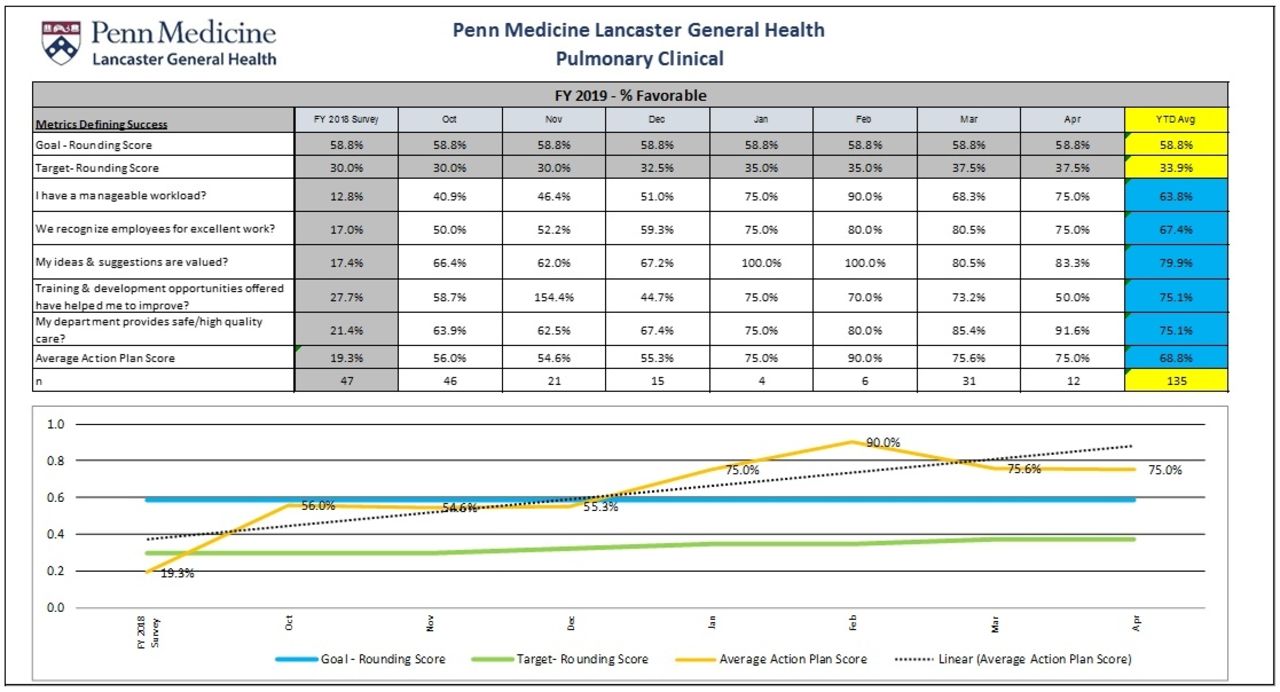
In 2018, the Penn Medicine Lancaster General Hospital's Pulmonary department enhanced their rounding strategy to include focused solution finding. Termed Purposeful Rounding", the department's leadership team added questions to their rounding that focused on lower scoring items from their previous year's organizational employee engagement survey which included: workload, recognition, ideas and suggestions, training opportunities, and safe care (AHRQ question). Using a Likert scale, therapists were asked to rate their feelings on these topics and offer solutions to improve them. The team was continually asked for feedback to measure the impact of improvements made in the department.
Results:
The experiment was measured over 7 months where all therapists were rounded on at least once with a total of 135 individual rounds. The average score of the lowest scoring items of the 2017 survey was 19.3% favorable. As improvements were made and feedback was re-measured, favorable scores improved to 68.8%. Therapist retention rate was measured at 92.8% during the same time period.
Conclusions:
Eliciting feedback, mining for solutions, and idea execution resulted positive changes in the pulmonary department. The use of purposeful rounding provided the department the insight to identify these opportunities while providing an objective measure to the subjective metric of engagement. We hypothesize that these results will predict the results of our next formal engagement survey and improve the overall score by focusing on the lowest scoring items. "
Meeting report
Restricted accessMeeting reportFirst published October, 2019pp. 3224252-3224252
Jennifer Julia Krzyzewski, Gretchen Thompson, Kristine Rogers , [...]
View All
Abstract
Background:
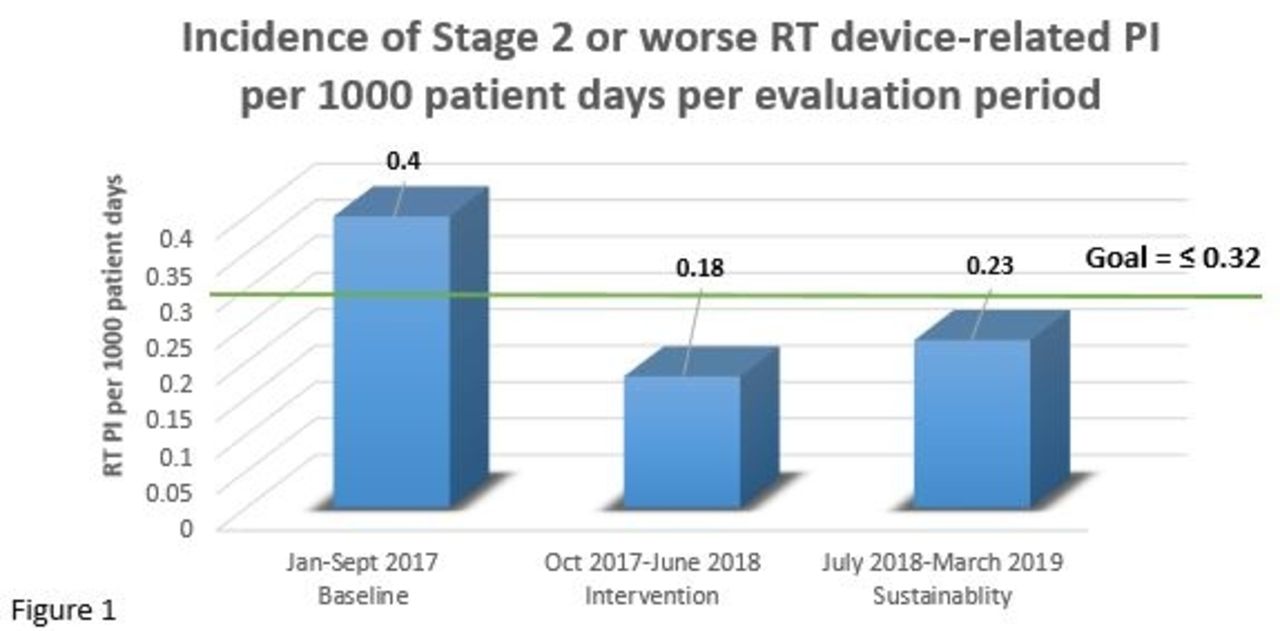
The therapeutic use of respiratory (RT) devices in the ICU places patients at increased risk for the development of device related pressure injuries (PI). After a sustained elevation in RT device-related PI in the ICUs of a large academic children’s hospital, a quality improvement project was initiated. Goal: To decrease the incidence of RT device-related PI by 20% from baseline over a 9-month period.
Methods:
Patients admitted to the ICU of a pediatric academic medical center were evaluated for the outcome of RT device-related PI. Each PI was staged in accordance with the National Pressure Ulcer Advisory Panel. Data for hospital acquired PI was examined, and PI from RT devices were extrapolated and reported per 1000 inpatient days. Only stage 2 or worse PI were included in this evaluation (Stage 2, 3, 4, unstageable, and deep tissue injury). Interventions included: 1) Multi-disciplinary group assembly to focus on RT device-related PI 2) Skin care bundle recommendations during noninvasive ventilation (NIV) for both neonatal and pediatric applications 3) Education to clinicians for proper securement of endotracheal tubes (ETT) 4) Increased surveillance and documentation of skin assessments in the electronic medical record every 3-4 hours. Outcomes over a 9-month baseline were compared to a 9 month intervention period followed by evaluation of a 9 month sustainability period. Sustainability measures included frequent process measure audits and ongoing education to providers on service in the ICUs.
Results:
During the baseline period, RT device-related PI were associated with ETT (n = 9), pediatric NIV (n = 3), neonatal NIV (n = 5) and trach tube (n = 1). Baseline incidence rate for RT device-related PI was 0.4/1000 patient days, which decreased during the subsequent 9-month period (Figure 1). The skin protective strategies implemented resulted in a 55% reduction in the incidence of RT device related PI, and results were sustained for a 9-month period.
Conclusions:
A collaborative and multi-faceted pressure injury prevention strategy contributed to reducing skin harm, while allowing for the continued use of critical respiratory support devices. Acknowledgement: Our thanks to the JHACH department of Respiratory Care and the Save our Skin workgroup for their commitment to reducing patient harm.
Meeting report
Restricted accessMeeting reportFirst published October, 2019pp. 3224342-3224342
Thomas Malinowski, Ryan M Sharkey, Daniel D Rowley , [...]
View All
Abstract
Background:
Low tidal volume targeted ventilation (LTVV) has been recommended as a standard strategy for adult mechanically ventilated patients and is associated with reduced mortality. Adoption of LTVV has been reported to range between 19% – 75%. All cause hospital mortality for adult mechanically ventilated patients has been reported at 28%. We sought to evaluate how a respiratory therapist directed LTVV model applied at the onset of mechanical ventilation would compare to previously reported LTVV practices. We also compared all cause hospital mortality.
Methods:
This IRB approved retrospective analysis included electronic medical record review of adult mechanically ventilated (MV) patients managed between March 2018 and March 2019. 1,425 subjects required MV for > 24 hours. The primary outcome was the percentage of subjects receiving set VT < 8 mL/kg of predicted body weight at onset of MV when compared to a reported average of 75%. Secondary outcome was all cause hospital mortality compared to a reported average of 28%. Categorical data is reported as frequency (%) and continuous data is reported as median (IQR). Chi-Square goodness-of-fit test was applied to compare outcomes. Alpha (2-tailed) < .05.
Results:
At initiation of MV, VT was < 8 mL/kg in 96.8% of subjects when compared to reported average of 75% (P < .001). Median VT at initiation of MV was 6.0 mL/kg (IQR 5.9-6.3) whereas median VT for the duration of all days of MV was 5.9 mL/kg (IQR 5.8-6.0). All cause hospital mortality was significantly lower among our subjects (18.4%) when compared to previously reported values (28%; P < .001). Median age was 61 y (60% male). Cardiac (32%), Medical (21%), and Surgical (12%) subjects accounted for the majority of the cohort. Refer to Table for additional descriptive characteristics.
Conclusions:
A respiratory therapist-directed LTVV strategy initiated at the onset of adult MV resulted in high adherence when compared to previous publications. The overall mortality observed in these subjects was significantly less than previously reported.
Meeting report
Restricted accessMeeting reportFirst published October, 2019pp. 3224415-3224415
Health care facilities that choose not to utilize 24-hour on-site respiratory therapist coverage, such as some freestanding emergency departments, critical access hospitals, and skilled nursing facilities, rely on other licensed health care professionals to assume such clinical responsibilities. The use of a virtual respiratory therapist via a telehealth cart provides another alternative. The current evaluation investigates the accuracy and efficiency of registered nurses (RNs) utilizing a remote virtual respiratory therapist in the absence of an on-site respiratory therapist.
Methods:
Institutional review board was consulted, and determined that this evaluation was exempt. In a simulated patient room, 20 emergency room RNs were guided by a virtual respiratory therapist via a telehealth cart in the following procedures: 1) initial starting up and entering initial ventilator settings on an acute care ventilator and a transport ventilator, 2) changing ventilator settings, 3) starting up and entering initial BIPAP settings, and 4) changing BIPAP settings. The accuracy was calculated based on the number of tasks completed correctly divided by the total number of tasks assigned in each procedure. Efficiency was measured based on the time taken for completing each procedure. For comparison, the same procedures were performed independently by 10 respiratory care practitioners (RCPs) and were evaluated using the same parameters.
Results:
As shown in Table 1, RNs utilizing a virtual respiratory therapist took longer to perform all procedures. A two-sided, two-sample t-test with equal variance assumption showed that this difference was statistically significant. The RNs exhibited 100% accuracy, as did the RCPs, in changing ventilator and BIPAP settings and in initial starting up of the transport ventilator. However, the accuracy of initial starting up and entering initial settings on the acute care ventilator (97.8%) and BIPAP (99.0%) were slightly less in the RN group than in the RCP group (100%).
Conclusions:
Although it was possible for a virtual respiratory therapist to assist RNs in completing tasks remotely via a telehealth cart, facilities interested in pursuing this staffing model will need to consider the extra time needed to perform these tasks and the potential for decreased accuracy in completing tasks as compared to staffing a respiratory therapist on-site at all times. Disclosures: No potential conflict of interest.
Average time to complete each procedure (minutes: seconds)
Acute care ventilator setup
Change acute care ventilator settings
BIPAP setup
Change BIPAP settings
Transport ventilator setup
Change transport ventilator settings
RN
3:30
0:56
1:12
0:22
0:45
0:17
RCP
1:22
0:22
0:48
0:18
0:32
0:10
RN, registered nurse; RCP, respiratory care practitioner
Meeting report
Restricted accessMeeting reportFirst published October, 2019pp. 3224433-3224433
Prevalence of tobacco smoking is poorly declining especially in low and middle-income countries. There are numerous studies on effect of cigarette smoking on tuberculosis treatment outcomes but with dissimilar conclusion. Objective: to determine the effect of cigarette smoking on tuberculosis treatment outcomes Methods: PubMed, Cochrane library and Google Scholar databases were searched last on February 27, 2019. Stata version 14 with meta-extension and Comprehensive Meta-analysis (CMA) software were used to analyze the dataset. Random effects model was applied for the analysis and forest plot was displayed together with the effect sizes (odds ratios) and the 95% confidence intervals of the studies. Sub-group analysis and meta-regression were also run to identify reasons for heterogeneity. Publication bias was assessed using funnel plot with superimposed Egger’s regression line and its test of significance. Furthermore, contour enhanced funnel plot, Orwin’s Fail-Safe N, cumulative meta-analysis were performed to check for small study effects.
Results:
Twenty-two studies were included in the qualitative synthesis. Eight studies reported P -values (< .05) that show smoking significantly increases risk. Four studies also report the same effect albeit they indicated the effect was dependent on dose of the cigarette smoked per day. However, 10 studies reported non-significant P-value (> .05). From the meta-analysis, smoking was found to increase risk of poor tuberculosis treatment outcomes by 51% (OR = 1.51; 95% CI = 1.30 to 1.75 and I-square = 75.1%). The effect is higher for countries with lower-middle income (OR = 1.74; 95% CI = 1.31 to 2.30) and upper-middle income economies (OR = 1.52; 95% CI = 1.16 to 1.98) than for high income ones (OR = 1.34; 95% CI = 1.03 to 1.75) though not statistically significant. The effect of smoking doesn’t show significant improvement over years (P = 0.82). Test of publication bias reported publication bias is unlikely (P = .403) and the Orwin’s Fail-Safe N analysis indicated at least 50 small missing studies are required to bring the computed combined effect to 1.10 trivial odds ratio. The effect of small studies was negligible.
Conclusions:
Cigarette smoking increases risk of poor tuberculosis treatment outcomes
Meeting report
Restricted accessMeeting reportFirst published October, 2019pp. 3224439-3224439
Thomas M. Siler, Edmund J. Moran, Chris N. Barnes , [...]
View All
Abstract
Background:
No nebulized form of a long-acting dual bronchodilator exists for patients with chronic obstructive pulmonary disease (COPD). With the approval of once-daily, long-acting muscarinic antagonist (LAMA) revefenacin (REV), it may be possible to deliver a LAMA and a long-acting _-agonist via a standard jet nebulizer. These prespecified and post hoc analyses assessed the safety and efficacy of REV 175 µg administered sequentially before or combined with formoterol (FOR) 20 µg via a standard jet nebulizer, in subgroups of patients with COPD defined by certain demographic and clinical characteristics.
Methods:
In Study 0167, a randomized, double-blind, phase 3, 42-day trial (NCT03573817), 122 patients with moderate to very severe COPD were randomized to receive REV (n = 63) or placebo (PBO) (n = 59), then FOR in the morning and evening for 21 days (sequential administration), all via a standard jet nebulizer. Patients continued treatment for an additional 21 days. However, the morning treatments, REV or PBO, and FOR, were given as mixed solutions via a single nebulization (combined administration), and FOR was given alone in the evening. Adverse events (AEs), serious AEs (SAEs), discontinuations, deaths, and trough forced expiratory volume in 1 second (kg/m2) changes vs baseline were assessed in the following subgroups: smoking status, age, current inhaled corticosteroids (ICS) use, reversibility to a short-acting bronchodilator, sex, and Global Obstructive Lung Disease 3 and 4 patients. Approval for this trial was obtained from an Institutional Review Board.
Results:
Patients (mean age 64 y; 57% men; 57% smokers) had an kg/m2 of 55% predicted; 24% were on ICS. The proportion of AEs by subgroups are shown in the Table. Across all subgroups, exacerbation/worsening of COPD, cough, and dizziness were the most common AEs, with more AEs reported in the PBO-treated subgroups. No AEs led to discontinuation in the REV-treated subgroups and there were no SAEs or deaths in any subgroup. Trough kg/m2 vs baseline over each 3-week treatment period by subgroups are shown in the Table. For former smokers and patients who were not reversible to ipratropium, the least squares mean differences were smaller vs the other subgroups.
Conclusions:
Across all subgroups, REV, administered sequentially before or combined with FOR via a standard jet nebulizer, had a tolerability profile similar to FOR alone. Trough kg/m2 response was greater in patients treated with REV + FOR, vs FOR alone.
AEs and trough FEV1 changes from baseline by subgroup
AEs n (%)
PBO + FORSequential(n=59)
PBO + FOR Combined(n=55)
REV + FOR Sequential(n=63)
REV + FORCombined(n=62)
Current smoker
4 (12.5)(n=32)
1 (3.6)(n=28)
1 (2.7)(n=37)
1 (2.8)(n=36)
Former smoker
3 (11.1)(n=27)
5 (18.5)(n=27)
2 (7.7)(n=26)
4 (15.4)(n=26)
GOLD 3/4
2 (10.0)(n=20)
1 (5.3)(n=19)
2 (8.0)(n=25)
0(n=25)
Aged ≥65 years
4 (14.3)(n=28)
5 (17.9)(n=28)
2 (8.7)(n=23)
4 (17.4)(n=23)
Aged <65 years
3 (9.7)(n=31)
1 (3.7)(n=27)
1 (2.5)(n=40)
1 (2.6)(n=39)
Current ICS use
3 (20.0)(n=15)
2 (14.3)(n=14)
0(n=13)
1 (7.7)(n=13)
No current ICS use
4 (9.1)(n=44)
4 (9.8)(n=41)
3 (6.0)(n=50)
4 (8.2)(n=49)
Reversible to ipratropium
4 (12.1)(n=33)
4 (13.3)(n=30)
2 (6.7)(n=30)
2 (6.9)(n=29)
Not reversible to ipratropium
3 (11.5)(n=26)
2 (8.0)(n=25)
1 (3.0)(n=33)
3 (9.1)(n=33)
Trough FEV1 from baseline, LS change (mL)
Trough FEV1 from baseline, LS change (mL
PBO + FOR Combined(n=59)
REV + FOR Sequential(n=63)
REV + FORCombined(n=63)
Current smoker
30.5 (42.4)(n=27)
−9.5 (42.9)(n=26)
205.3 (41.3)(n=32)
159.1 (41.0)(n=33)
Former smoker
75.6 (41.6)(n=27)
77.6 ( 41.6)(n=27)
98.7 (42.8)(n=25)
63.1 (42.3)(n=26)
GOLDb 3 and 4
75.1 (47.8)(n=19)
65.3 (48.4)(=18)
168.4 (47.9)(n=22)
118.5 (47.2)(n=23)
Aged >65 years
33.4 (43.4)(n=28)
30.5 (43.4)(n=28)
66.0 (47.3)(n=22)
68.6 (46.7)(n=23)
Aged ≤65 years
74.1 (43.0)(n=26)
38.2 (43.5)(n=25)
231.3 (38.7)(n=35)
162.0 (38.5)(n=36)
Current ICS use
-37.3 (57.5)(n=14)
-19.47 (58.6)(n=13)
96.3 (62.3)(n=11)
128.2 (60.7)(n=12)
No current ICS use
116.6 (33.7)(n=40)
86.22 (33.7)(n=40)
207.30 (31.5)(n=46)
147.97 (31.3)(n=47)
Reversible to ipratropium
45.7 (39.3)(n=30)
30.0 (39.3)(n=30)
253.5 (43.4)(n=27)
170.5 (42.8)(n=28)
Not reversible to ipratropium
67.2 (43.9)(n=24)
45.5 (44.6)(n=23)
79.6 (39.1)(n=30)
75.1 (38.7)(n=31)
aAEs were collected from days 1 to 42. b2017 GOLD criteria. cFEV1 was collected in the morning at baseline and on days 21 and 42. n= evaluable n. AE, adverse event; FEV1, forced expiratory volume in 1 second; FOR, formoterol; GOLD, Global Obstructive Lung Disease; ICS, inhaled corticosteroids; LS, least squares; PBO, placebo; REV, revefenacin, SE, standard error.
Meeting report
Restricted accessMeeting reportFirst published October, 2019pp. 3224447-3224447
Jason Michael Blonshine, Ellen M Moran, Susan Belinda Blonshine , [...]
View All
Abstract
Background:
The American Thoracic Society and European Respiratory Society 2005 guidelines recommend weekly spirometry linearity checks for flow sensing devices and weekly syringe DLCO checks using a calibrated 3-L syringe. The expected failure rate for these checks is unknown. One abstract from a multi-center study suggests < 10% failure rate. This study identified the current frequency and source of failures with syringe linearity and syringe DLCO checks. Quality control (QC) failure reasons were also categorized.
Methods:
A mechanical QC program for an inhaled medication study included biweekly syringe linearity and syringe DLCO checks to ensure reliable equipment function for subject testing. Results were sent to a central repository for expert review. Onsite training was provided to 114 pulmonary function labs (PFLs) from North America, Europe, and Israel. Over 42 months ending in 2018, 108 PFLs continued with the study. The syringe linearity checks used peak flows < 2 L/s, 3 to 7 L/s, and > 8 L/s. Acceptable linearity data were within the expected flow range and had FVC variance ≤ .09 L. Syringe DLCO checks were accepted when 2 trials fell within pre-established ranges for DLCO, IVC and VA. Percentage failure rates for onsite training checks and subsequent study period were calculated. The reasons for failure were categorized.
Results:
Of 114 PFLs, onsite training syringe linearity failure occurred in 2 (1.8%) sites, syringe DLCO check failures occurred at 6 (5.3%) sites. Syringe linearity failures during training were related to inadequate 3-L calibration syringe equipment. Of the 6 syringe DLCO failures, 3 were due to inadequate calibration equipment and 3 required service calls for hardware repairs. During the study period, 108 sites completed 5083 syringe linearity and 4992 syringe DLCO checks. Of the 5083 syringe linearity checks, 496 (9.76%) failed and of the 4992 syringe DLCO checks 311 (6.23%) failed. Reasons for QC failure are shown in Figure 1.
Conclusions:
The failure rates for both syringe linearity and syringe DLCO checks were < 10%. Over 40% of syringe linearity checks failed due to technologist errors. In contrast, equipment errors accounted for 86% of syringe DLCO failures. The QC failure reasons define and target areas for corrective action and education for PFL staff. Assuring that equipment is within established QC limits is essential for accurate subject test results.
Meeting report
Restricted accessMeeting reportFirst published October, 2019pp. 3224448-3224448
In 2016 alone, 490,000 multidrug-resistant TB (MDR-TB) cases reported worldwide. The failure to control the disease in the presence of effective drugs to cure it implies that psychosocial and economic factors of the cases need to be addressed and such studies are uncommon in Ethiopia. Objective: To understand psycho-social challenges patients with multi drug resistant tuberculosis face and the perception of patients with multi drug resistant tuberculosis as a threat to community Methods: A hermeneutic phenomenological study design was used to explore the lived experience of patients with MDR/XDR-TB at ALERT hospital during December 28, 2017. Purposive sampling technique was employed to recruit the study participants. A semi-structured interview guide which had main questions and probing question was developed to undertake in-depth face-to-face interview. Open Code software version 4.02 was employed to make the analysis. Emergent codes were assigned to segments of the transcript that were relevant to the study objective. Finally, themes were developed from the categories. In reporting the findings, the consolidated criteria for reporting qualitative research (CORE-Q) which is a 32-items checklist was followed. Lastly, the inter-relationship among codes, categories and themes was displayed using a diagram.
Results:
From the analysis, 6 categories were identified from the codes as contributors of psychosocial problems in MDR-TB patients. Those were; Apprehension about economy for survival of dependent family or self, phobia development against risk factors of TB disease, regretting of handling previous life condition to protect self from TB, feeling hated or stigmatized, hopelessness and harm to mind. These categories in turn used to develop two major themes, namely anxiety/depression and intending revenge to transmit the disease to others.
Conclusions:
Control of MDR-TB spread demands beyond therapeutic treatment of the patients Recommendation Psychological therapy and designing income generation mechanism for MDR-TB patients while they are at treatment center are commendable.
Meeting report
Restricted accessMeeting reportFirst published October, 2019pp. 3224489-3224489
Crystal M Alfred, Sarah Varekojis, Jill Clutter , [...]
View All
Abstract
Background:
Bullying is a well-documented issue for healthcare workers, and can have a significant impact on an institution in regards to employee retention. Retention of healthcare workers is an important concern, as turnover is costly to the healthcare system. The retention problem has become even more complex as managers have had to adopt individualized strategies to account for the multigenerational workforce. Intent to leave has been described in the literature to be an accurate predictor of actual turnover. This study explores the relationship between bullying experienced in the workplace and an individual’s intention to leave, stratified by generational cohorts.
Methods:
This study was approved by the IRB. A multi-institution electronic survey was conducted of registered nurses and respiratory therapists working in hospitals throughout central Ohio using the 22-item Negative Acts Questionnaire Revised (NAQ-R) and the Turnover Intention Scale (TIS-6).
Results:
Over 23% of respondents indicated they experienced bullying in the workplace. Respondents indicated they were exposed to unmanageable workloads, had their views and opinions ignored, and felt excluded in the workplace. Baby Boomers had the highest mean score on both the NAQ-R and TIS-6, indicating they experienced the most negative acts in the workplace and had the highest intention to leave of the three cohorts. Millennials had the lowest mean score on the NAQ-R, and the second highest score on the TIS-6. A Pearson Product moment correlation was used to examine relationships in sum scores between the TIS-6 and NAQ-R. Results indicate a somewhat low-moderate positive relationship between the two measures (r = 0.30; P < .001).
Conclusions:
Bullying is still a problem facing healthcare professionals. Baby Boomers are likely to leave their positions to retire, which may account for their high intent to leave scores. Millennials had the second highest scores on the TIS-6. Millennials, who have previously been described in the literature as having the highest rates of turnover, are starting to show more loyalty to their current employers, compared to previous years. Higher scores on the TIS-6 did correlate with high scores on NAQ-R, but the correlations were low-moderate, suggesting that a relationship exists between workplace bullying and intention to leave. Future studies in various settings will need conducted to confirm these preliminary findings, and to account for the next cohort, Generation Z.
Meeting report
Restricted accessMeeting reportFirst published October, 2019pp. 3224521-3224521
Denise Willis, Bailey Lessenbery, Randy Willis , [...]
View All
Abstract
Background:
Heated high-flow nasal cannula (HHFNC) systems are used to treat children with hypoxemia and respiratory distress. These devices allow modification of flow and FIO2. We evaluated the effect of different FIO2 settings and the relationship between inspiratory and cannula flows on tracheal FIO2.
Methods:
An anatomically correct orotracheal model of a 5 y old child was connected to a breathing simulator (frequency = 20 breaths/minute, tidal 180 mL, TI 0.9 s, inspiratory flow 12 L/min), and an oxygen analyzer was interposed. A Fisher Paykel (FP) Optiflow Junior 2 XL cannula was used with the Fisher Paykel HHFNC system with a blender and the AIRVO 2 device with cannula flows of 6, and 12 L/min. Another oxygen analyzer was placed in-line with the circuit at the cannula connection. FIO2 was set at 0.95, 0.70, 0.50 and 0.35. Circuit and tracheal FIO2 was measured. Absolute difference between device and tracheal FIO2 (Delta FIO2) at different FIO2 s, and Delta FIO2 at 6 and 12 L/min were analyzed. Measurements were done in quadruplicate after 7 minutes of continuous operation.
Results:
See table.
Conclusions:
Delta FIO2 was greater at higher FIO2 settings. The effect of air entrainment was more evident at higher FIO2 settings. The AIRVO 2 device was more effective than the FP device when cannula flow matched inspiratory flow.
Delta FIO2 expressed in absolute % points, X ± SD
Flow
6 L/min
12 L/min
FI02
FP
AIRVO 2
FP
AIRVO 2
0.95
-36 ± 6*
-30 ± 1*
-12 ± 4
-3 ± 3#
0.70
-14 ± 4
-17 ± 5*
-9 ± 1
4 ± 1#
0.50
-9 ± 2
-9 ± 2*
-6 ± 0
2 ± 0#
0.35
-3 ± 2
-3 ± 1
-2 ± 4
-3 ± 3
*6 is > 12 L/min. # AIRVO < FP.
Meeting report
Restricted accessMeeting reportFirst published October, 2019pp. 3224874-3224874
Eustace Fernandes, Lisa Burris, Brad Gibson , [...]
View All
Abstract
Background:
The primary objective of the study was to determine whether home usage of warm humidification can potentially reduce the number of exacerbations in patients with a diagnosis of chronic obstructive pulmonary disease (COPD) stage II-IV. There have only been a few small studies evaluating the efficacy of warm air humidification in reducing the number of hospitalizations in this population.
Methods:
The study was conducted as an open label, non-randomized prospective trial, with use of a retrospective comparable control group. Patients with stage II to IV COPD were asked to participate in the study. A warm air humidifier was provided for home use as either a stand-alone unit, or in addition to their current long-term oxygen therapy (LTOT). Patients were followed for 1 year. Measurements taken at base, 1 month 3 month, 6month, 9 month, and 1 year time periods, included pulmonary function testing, hospitalizations, Steroid or antibiotic therapy, six minute walk test, and Quality of Life questionnaire. The study was reviewed and approved by a local IRB. All patients were consented and provisions of HIPAA were followed. Student's T test was applied for all continuous variables, Bonferroni adjustment not applied.
Results:
A total of 22 patients were enrolled into the study with a 45.5% (10 of 22) completion rate at 12 months. Pulmonary function test change after 12 months for kg/m2 and kg/m2/FVC were -0.035 L/s (P = .53) and -0.501 L/s (P = .043) respectively. Quality of life (QOL) measures differed at 6 months with an improved mean of 4.06 (P = .0005), to a worsened value of 1.79 (P = .07) at 1 year. Compared to a separate control group, annual hospitalizations decreased from 12 to 8 in the treatment group (P = -0.534), with yearly use of antibiotics, steroids, and self-treatments decreasing from 48 vs. 25 (P = .10), 40 vs. 23 (P = .13), 41 vs. 17 (P = .07) respectively. When the year prior to enrollment hospitalization rates and use of antibiotics and steroids were analyzed, the statistics yielded similar results.
Conclusions:
In this study, the daily use of warm humidification, statistically did not improve lung function or quality of life in those with stage II-IV COPD at 12 months. The device also lacked statistical significance in decreasing hospitalization, antibiotics, steroids, or use of self-treatments. Device or treatment tolerance was an issue and lead to a high dropout rate. Disclosures: None of the authors have any disclosures to report.
Meeting report
Restricted accessMeeting reportFirst published October, 2019pp. 3224963-3224963
Respiratory therapists (RTs), nurses (RNs), nurse aide (NAs), and emergency medical services (EMS), are required to work together to provide care. Shared learning through interprofessional education (IPE) enhances education, and patient outcomes. The objectives are to understand student and faculty readiness for IPE and to ascertain if it is an effective teaching strategy in conjunction with the use of high-fidelity simulation for Advanced Cardiac Life Support (ACLS) instruction. A secondary goal is to explore student and faculty perceptions and attitudes toward IPE.
Methods:
60 students and 10 faculty from 4 health science programs attended a code blue simulation in the Sim Lab at Southwestern Community College (SCC). The Readiness for Interprofessional Learning Scale (RIPLS) was completed by all participants pre/post to measure readiness for and attitudes toward IPE. Data were collected using a pre-post quiz pertaining to ACLS as well as a video to assess knowledge and perceptions. Data were analyzed using descriptive statistics. Approval to undergo this study was given from the Institutional Review Board (IRB) at SCC and from the IRB at the University of North Carolina at Charlotte.
Results:
The average score on the pre quiz (67%) increased to 89%, indicating improved learning. NA and first year RT students combined saw the most improvement (54% pre, 85% post). Results demonstrated a higher degree of readiness at SCC for IPE than average. The overall mean scores of students’ readiness (79) and faculty (90) was higher than the average score on the RIPLS survey (48). Results suggest that participation in the study enhances attitudes toward IPE, collaboration, understanding of others’ roles, and confidence.
Conclusions:
The study exposed an exceptional degree of readiness and a positive attitude among participants toward IPE and the value of collaboration. The research suggests that incorporating IPE in community college health science programs using ACLS simulation yields several benefits. These include improved student learning outcomes, confidence, and knowledge as it relates to the curriculum. Faculty and student attitudes and readiness for IPE is positive. Learning using IPE increases understanding of the roles of other healthcare professions, improves confidence, enhances clinical preparation, improves communication, and promotes teamwork.
Meeting report
Restricted accessMeeting reportFirst published October, 2019pp. 3225084-3225084
Julie Gemignani, Daria Donelly, Robin Connolly , [...]
View All
Abstract
Background:
Respiratory therapists are an integral part of the critical care team as they are specialist in airway and ventilator management. Currently newly graduated respiratory therapists have limited exposure to advanced critical care technologies and critical training. Once the allotted orientation period is over, the expectation is for recent graduates to master equipment and procedures in a high stress environment. The post orientation period is when recent graduates would benefit from practicing skills and reviewing policies. The Respiratory Care Department at Boston Children’s Hospital adopted a high fidelity simulation for new RTs to become proficient with low volume high risk procedures, skills and knowledge. The SIMPeds center at Boston Children’s Hospital offers 2 simulation sites on campus and also an entire SIM center across the street from the hospital Methods: While the respiratory care department was involved with numerous multidisciplinary simulations throughout the hospital but they were not fulfilling the needs of the post orientation periods of our new therapists. We decided to offer a safe environment fostering communication skills as they practice these identified high risk skills. The course consists of didactic skills sessions; two simulations and debriefings, lasting in total five hours. Participants employed six months to a year and a resource therapist. To enhance the dynamic of the simulations, we have recruited an RN and MD to make the experience more realistic. The didactic concentrates on communication and other principals of crisis resource management. The simulation scenarios combine both the skill sets reviewed and didactic portion for a cohesive curriculum.
Results:
There were 57 RTs, (73% of the department) who completed this course. We have held 12 courses in the past 3.5 years. Participants are asked to complete a Likert scale survey at the end of the course, with IRB approval. Of the 57 responses: Conclusions: After reviewing the results from the Likert survey and the answers to some of the open ended questions, it was evident that not only was there a need for the course, but also a request for more simulations in the future. There were 12 requests for more simulations and among those requests were 8 for simulations twice a year for all staff members
Results
Strongly agree
Disagree
Neutral
Agree
Strongly Agree
The program will help me provide safer/more effective pt care
1 (2%)
9 (16%)
47 (82%)
I feel that I can now function more effectively in the ICU
12 (21%)
45 (79%)
Despite limitations, the SIMS were realistic
1 (2%)
13 (23%)
43 (75%)
During debriefings, I was treated with respect
4 (7%)
53 (93%)
The atmosphere was supportive
4 (7%)
53 (93%)
I was comfortable sharing my feelings/thoughts in debriefings
8 (14%)
49 (86%)
Debriefings clarified the clinical objectives of the scenarios
8 (14%)
49 (86%)
Meeting report
Restricted accessMeeting reportFirst published October, 2019pp. 3225163-3225163
Working in collaboration with the NICU Skin team to evaluate pressure injury rates (HAPI Healthcare acquired pressure injury) it was discovered that a large amount of the injuries was related to respiratory therapy devices. With these results, a literature review was conducted to evaluate the findings compared to published results. The Journal of Neonatal Nursing found 247 neonatal patients were reviewed, of these infants 77 were identified as having a skin injury (a prevalence rate of 31.2%). The Respiratory therapy noninvasive CPAP delivery devices were associated with 14.0% of those HAPI. The mean gestational age was 28 weeks. A Literature review on prevention of HAPI found the use Hydrocolloid dressing to be beneficial in the preventing nasal trauma secondary to nasal CPAP in preterm infants. (2) Along with continuous education to nursing and respiratory therapy were found to be beneficial to decreasing the rate of HAPI events (3).
Methods:
Continue to perform NICU skin assessments and collect data starting January 1st 2017 till April 2019 with a total of 812 babies assessed. Starting January 2017 event reports were completed for all issues including redness. Prior to 2017 multiple changes were implemented to include standardizing equipment to use only Fisher & Paykel Flexi trunk CPAP system. Starting simultaneous RN and RT skin assessment along with nasal prong and mask sizing any changes occurred at this time. The team instituted the use of Septal H, a hydrocolloid barrier device.
Results:
The NICU HAPI rate was < 2% of annual admissions and assessments (15/812). The Respiratory Therapy related injuries were 1.3% (9/812) of the HAPI. The mean gestational age was 26 weeks. The HAPI rate remained stable at < 2% of NICU admissions. In 2017, with the introduction of Septal H there was 5 HAPI in a 2 month time frame. This was analyzed and found not to be the product itself, but due to a deviation from traditional skin assessment technique. From September 2017 till March 2019 the HAPI rate remained less than 2%.
Conclusions:
Strong nursing and respiratory therapy relationship can achieve a significant reduction in Neonatal HAPI. While there are many CPAP interfaces available, mastering proper fit and sizing along with attentive skin assessment will lead to reduction in HAPI. . While being successful in all of the previously mentioned changes, continuing education for RT and RNs had the largest impact on the reduction of HAPI.
Reported HAPI VS published national average
Meeting report
Restricted accessMeeting reportFirst published October, 2019pp. 3225254-3225254
Extubation failure considers a common issue in intensive care units (ICUs) and leads to increased associated complications, mortality, and costs. Many factors have been identified as predictors for failed extubation, but the role of electrolytes and glucose were not fully examined in the previous research. The aim of this study, therefore, was to investigate the impact of electrolytes disturbance and glucose level on extubation outcomes among adult patients in ICU.
Methods:
A cross-sectional study was conducted using data from electronic medical records at King Abdulaziz Medical City (KAMC) between 2016 and 2017. Adult patients who were admitted to ICU and intubated for at least 72 hours were included in this study. Glucose and electrolytes levels were obtained 72 hours before and after extubation attempt. We used unpaired t-test to compare the mean of electrolytes and glucose level between patients with successful extubation and patients with failed extubation. This study has been approved by the King Abdullah International Medical Research Centre IRB committee (protocol number SP18/225/R).
Results:
A total of 2,385 patients were screened for inclusion and 82 of them met inclusion criteria A total of 82 patients were included in this study. 88% of the populations were male with a mean age of 40 years (± 14). The mean of glucose was 7.88 mmol/L for those patients who had successful extubation, where this was higher in those with failed extubation 10.2 mmol/L. The mean level of sodium was statistically different between patients who had successful extubation compared to patients with failed extubation 140.4 mmol/L vs 145 mmol.L) Conclusions: Hyperglycemia before extubation and hypernatremia after extubation may be considered predictor factors for extubation failure. The finding of this study provides insight on the possible association of glucose and sodium one the risk of extubation failure. Further epidemiological studies with the rigorous methodological design are needed to examine this association in more depth. Disclosures: All authors have nothing to disclose.
Meeting report
Restricted accessMeeting reportFirst published October, 2019pp. 3225259-3225259
Fatmah Othman, Taha T Ismaeil, Ahmed Alanazi , [...]
View All
Abstract
Background:
Obesity (defined as body mass index (BMI) of ≥30 kg/m2) considers a rising health problem around the world. Currently, the influence of obesity on acute illness has been explored in the literature. However, the effect of obesity on the duration of mechanical ventilation among patients who admitted to the intensive care unit (ICU) remains unclear. The current study; therefore, examined the effect of the obesity on the duration of mechanical ventilation among injured patients who admitted to the ICU and were involved in road traffic accidents.
Methods:
An analytic cross-sectional study was conducted using data from electronic medical records at King Abdulaziz Medical City in Riyadh, Saudi Arabia between 2016-2018. Adult ICU patients receiving mechanical ventilation who were involved in road traffic accidents were included in this study. Patient’s demographic and clinical information were extracted from the medical files. The association between BMI categories (normal BMI (18.5-24.9 kg/m2), overweight (25-29.9 kg/m2), obese (≥30 kg/m2), and underweight (<18.5 kg/m2) and the duration of mechanical ventilation (in days) were examined using ANOVA test. This study has been approved by King Abdullah International Medical Research centre IRB approval committee (protocol number SP18/060/R) Results: Total of 128 patients were included in this study. Majority of the study population were male (94%) with a mean age of 29 ± 12 years. The average duration of mechanical ventilation among the study population was 8 days (SD ± 6). 46.9% of the patients had normal BMI, 27.3% were overweight, 13.3% were obese, and 12.5% were underweight. The mean duration of mechanical ventilation were longer among underweight patients (10 ± 7 days) compared to overweight patients (mean duration was 8 ± 6days). There was no statistical significant difference in the mean duration of mechanical ventilation between BMI categories by one-way ANOVA (F = 1.49.7, P = .22).
Conclusions:
The current study provides insight for a possible influence of BMI level on the duration of mechanical ventilation in acute illness. This can add new evidence to support the obesity paradox that refers to a lower mortality rate among obese patients with many daises. ICU physician and respiratory therapists have to consider the impact of BMI in the management of patients who involved in a road traffic accident. Disclosures: All authors have nothing to disclose.
Meeting report
Restricted accessMeeting reportFirst published October, 2019pp. 3225351-3225351
Deborah Anne Igo, Kimberly Kingsley, Elisabeth Malaspina , [...]
View All
Abstract
Background:
Unplanned extubation (UE) is a preventable adverse event and may lead to additional complications such as cardiovascular resuscitation or respiratory compromise in a critically ill neonate during an emergent reintubation. A quality improvement project to reduce unplanned endotracheal tube dislodgement would reduce these morbidities. Aim: To reduce unplanned extubations in the NICU to 1 UE/100 ventilator days by October 2018. Setting: A level 4 NICU with 950 annual admissions and a baseline rate of 9.9 unplanned extubations/100 ventilator days Culturally, our NICU clinical team accepted unplanned extubation as a normal risk factor in the patient population and did little to challenge this status –quo. We felt we could decrease our UE rate through the use of standardized securement equipment, standardized care delivery models and a re-education program for all NICU staff.
Methods:
We formed an inter-professional task force consisting of a Neonatologist, two Respiratory Therapists and the NICU Nurse Educator. We tracked all of our unplanned extubations as well as required the staff involved to file an electronic safety report. PDSA cycles consisted of: staff attitude survey, development of data collection tool, protocol of 2 staff members for all transfers of intubated patient, staff education around securement device and daily retaping of ETT to securement device. UE and ventilator days were extracted from a respiratory database and electronic medical record. Control charts (u-chart) were created using QI Macrosã and IHI-Healthcare control chart rules used to determine special cause variations. The Maine Medical Center Institutional Review Board determined that this was quality improvement and did not qualify as research.
Results:
A special cause variation was noted via control chart rules for the mean UE rate from baseline of 9.9 UE/100 ventilator days (8/2017-11/2017) compared to post-intervention mean of 1.6 UE/100 ventilator days (8/2018-3/2019). In addition, during the intervention phase of the project (12/2018-7-2018), a special cause variation was noted with an UE rate of 5 UE/100 ventilator days (Figure 1).
Conclusions:
Development of a QI project by a multidisciplinary taskforce, along with several PDSA cycles including education and staff awareness, reduced UE rate by 84% in a level 4 NICU. Ongoing surveillance, education and review of UE cases will be key to maintaining UE at a goal of 1 UE/100 ventilator days.
Meeting report
Restricted accessMeeting reportFirst published October, 2019pp. 3225397-3225397
Opioid related deaths are rapidly increasing and are a national focus1. Uintah Basin Medical Center is a 49-bed hospital located in eastern Utah. Following 3 unplanned home deaths in patients taking opioids as prescribed post-operatively who had undergone Ear, Nose and Throat (ENT) procedures, we piloted an initial study of a home monitoring protocol to earlier identify and intervene with pts most at risk for opioid induced respiratory depression (OIRD). This is our second study.
Methods:
From July 2017-June 2018, all pediatric and adult ENT post-op pts prescribed opiates were discharged with a Masimo RAD 8 or Masimo Rad 97 monitor for 7 days. Data was recorded during sleep/naps and analyzed after device return. Pts were educated on risks of opioid use, the relation between OIRD and falling blood oxygen levels. They were instructed to call/come to the hospital if oxygen saturation (SpO2) alarmed and read < 85%.
Results:
Two-hundred fifteen pts were monitored. Results are reported in Table One.
Conclusions:
It was our impression that using the Masimo technology would diminish false alerting since it differentiates between artifact and actual out-of-range alerting. Our collaborating hospital is conducting a side-by-side study comparing SpO2 and end-tidal carbon dioxide in home monitoring of pts. With 210 (98%) of the patients studied being opioid naive, we agree with guidelines from the CDC which recommends short-acting opioids rather than long-acting or extended release opioids for the treatment for acute pain in opioid naïve patients. Other factors such as age, gender, hepatic/renal impairment, comorbidities, polypharmacology and drug metabolism should also be considered. We have identified the need for more education to ED staff regarding protocol compliance and recognize that relying on patients/caregivers to identify and respond to out of range parameters is not ideal. We are considering remote monitoring in the home via Telemedicine for our higher risk pts. It is our impression that opioid related deaths are under diagnosed and reported and are often reported as “pneumonia” by medical examiners. We are pursuing validation of this impression. Our initial work facilitated Utah SCR004 being signed into law March 2018. Utah legislators requested more studies regarding home monitoring of high-risk opioid patients, and our goal is to meet that request. RTs are in a unique position to further this work. Reference: https://www.cdc.gov/drugoverdose/epidemic/index.html
2017-2018 Post-Operative High Risk Opioid Patient Home Monitoring Outcomes
Ramona Davis Herrington, Michelle Sweat, Shannon Melissa Jennings , [...]
View All
Abstract
Background:
The FY2016 Agency for Healthcare Research and Quality (AHRQ) Quality Indicators report indicated our hospital had a performance worse than expected O/E ratio for PSI 03 Pressure Ulcer Rate. We have had a Pressure Ulcer Prevention (PUP) team in place actively working to manage and reduce hospital acquired pressure ulcers (HAPU) within the Department of Nursing. Data routinely compiled by our Wound Ostomy Care Department provided detailed information on pressure injuries by type and location occurring in the hospital. In FY16, 40% of all HAPU were medical device related pressure ulcers (MDRPU); 37% of all MDRPU were respiratory device related. An opportunity existed to reduce respiratory device related HAPU with a collaborative effort between Respiratory and Nursing Departments.
Methods:
Initially, we developed a Pareto chart to identify what devices caused the most respiratory related injuries. OETT and NIV masks accounted for 57% of respiratory device related injuries in FY 16. We focused on two goals in adult ICU patient population. Our first goal was to decrease pressure injuries related to OETT devices in the ICU by 30% for FY2017. Our second goal was to decrease pressure injuries related to NIV masks by 15% for FY2017. Using brainstorming, our group identified possible causes and solutions related to OETT and NIV pressure injuries. With this data, we created an effort/yield matrix and a focused action plan on reducing pressure injuries which included standardization of OETT and NIV maintenance and rotation processes, education of RT and nursing staff on these protocols, concurrent rounding audits of adherence to the protocols with immediate feedback to caregivers, and proper ventilator arm positioning, repair or replacement as necessary.
Results:
Our results exceeded both of the goals. On our goal to decrease pressure injuries related to OETT/securement devices in the ICU by 30%, we attained a decrease of 57% from 21 in FY2016 to 9 in FY2017. The second goal was to decrease pressure injuries related to NIV masks in the intensive care units by 15%, and we attained a decrease of 31%.
Conclusions:
In conclusion, the collaboration of both respiratory staff, nursing staff and Wound Ostomy Care Department to reduce respiratory device related injuries proved successful. We continue to show improvement and meet quarterly to review data and ensure that identified reduction strategies continue to prevent respiratory device related injuries.
Meeting report
Restricted accessMeeting reportFirst published October, 2019pp. 3225775-3225775
Andrew G Miller, Natalie Napolitano, Akira Nishisaki , [...]
View All
Abstract
Background:
Endotracheal intubation by respiratory therapists (RTs) is a well-established practice and has been described primarily in adult and neonatal patients. However, minimal data exist regarding RT intubation practice in pediatric intensive care units (ICUs). The purpose of this study was to describe the current landscape of RT intubation in pediatric ICUs.
Methods:
A multi-center quality improvement database, the National Emergency Airway Registry for Children (NEAR4KIDs) was queried from 2015-2018. Data were prospectively collected on patient demographics, indication for intubation, difficult airway history and feature presence, provider discipline, medications and device. Intubation outcomes included first attempt and overall success rates, and tracheal intubation adverse events (TIAEs). One attempt was defined as an insertion of a device (e.g., laryngoscope) into the oropharynx. Overall intubation success was defined as tracheal intubation achieved in ≤ 2 attempts. Statistics were descriptive with Chi-squared test to compare proportions with statistical significance set at 0.05.
Results:
There were 12,056 initial intubation encounters analyzed, with 109 (0.9%) by RTs. Nine centers reported at least one intubation encounter by RTs. The number of RT intubation attempts per center ranged from 1 to 46 (RT attempt rate per center: 0% to 19.6%). Overall RT success rate was 76.1%, with first attempt success rate 60.6%, and adverse TIAE rate 22.9%. First attempt success rate (range 0% to 73.3%, P = .03), overall success rate (0% to 100% range P = .004), any TIAE rate (0% to 100%, P = .02) and severe TIAE rate (0 to 42.9%, P = .006) varied across centers. Three centers reported a minimum of 10 intubation attempts by RTs, with first attempt success rates of (56.0%, 71.7%, and 73.3%), overall success rates of (80.0%, 82.6%, 86.7%), and adverse TIAE rates of (36.0%, 10.9%, 33.3%). When RT attempts were compared to other providers, airway characteristics were similar except RTs were more likely to intubate children due to a neurologic indication (RT 1.9% vs. 0.8%, P < .001). Results are summarized in Table 1.
Conclusions:
RTs infrequently intubate in pediatric intensive care units, with success rates similar to other providers, although adverse events were higher overall. RTs were more likely to use video laryngoscopy. RT intubation success and complication rates varied greatly across centers.
Comparison of RTs to other Providers of Intubation
Table 1
RTs
Non-RTs
P value
n
109
11,947
Overall success rate
76.2%
82.4%
0.087
First attempt success rate
60.6%
69.2%
0.051
Any TIAE
22.9%
13.8%
0.006
Severe desaturation, SpO2 < 80%
16.5%
16.9%
0.91
Profound desaturation, SpO2 < 80%.
11.9%
11.4%
0.85
Severe TIAE
11.0%
5.6%
0.02
Video laryngoscopy use
53.2%
28.1%
<0.001
TIAE = Tracheal intubation adverse event
Meeting report
Restricted accessMeeting reportFirst published October, 2019pp. 3225783-3225783
Andrew G Miller, Michael A Gentile, Joseph P Coyle
Abstract
Background:
Endotracheal intubation is a common procedure performed by respiratory therapists (RTs). The purpose of this study is to describe current RT intubation practices in North Carolina through the use of survey instrument.
Methods:
A survey was developed by the authors and sent via email to all licensed RTs in North Carolina. An exemption was granted by the Duke Institutional Review Board. Questions included: respondent demographics, intubation practices (including training and skill maintenance) and attitudes about RT intubation practices. Data are presented as percentages or medians with interquartile range (IQR).
Results:
The survey was sent to 4,817 licensed RTs, with 411 responses from 133 unique institutions and 81 (61%) intubated at their facility. RTs who performed intubation were more likely to be from community hospitals and less likely to be from level one trauma centers. 60% of respondents defined an intubation attempt as an endotracheal tube passed through the oropharynx with 34% defining an attempt as a laryngoscope in the mouth. Respondents reported intubating adults (91%), pediatric (61%), and (65%) neonatal patients. The most common areas RTs reported performing intubation were the adult ICU (80%), ED (76%), outside the OR for emergencies (76%), neonatal ICU (43%), the delivery room (45%), and pediatric ICU (25%). Training for intubation varied among respondents with classroom training (51%), written materials (38%), written test (27%), skill demonstration in a simulation setting (85%), and supervised intubations (71%) reported as training methods. Supervised intubations were performed in the operating room (54%), ICU (68%), ED (59%), delivery room (29%), and other (23%). 84% respondents reported there was no minimum amount of experience before intubation training. The reported number of supervised intubations required to be competent was 5 (3-5). Less than 10 intubations were required by 81% of respondents. The perceived number of intubations to gain competence was 6 (range 5-10) and did not differ based on years of experience. Most respondents believed their RT intubation program was safe (93%), effective (91%), RTs were well-trained (81%), their intubation skills objectively evaluated (66%), and receive sufficient feedback on performance (68%).
Conclusions:
RTs in North Carolina frequently provided intubation and had high confidence in their programs. Training methods and clinical practice varied throughout the state.
Meeting report
Restricted accessMeeting reportFirst published October, 2019pp. 3225788-3225788
High-frequency jet ventilation (HFJV) has been utilized as a modality in infants with respiratory distress syndrome who are refractory to conventional ventilation. There is a paucity of data informing initial PEEP selection during HFJV. Therefore, we sought to describe parameters that were associated with PEEP levels following conversion to HFJV.
Methods:
An IRB approved single-center retrospective review was conducted on subjects who underwent HFJV between 01/2015-01/2019. Subjects were enrolled if birth weight ≤ 2,000 grams and ≤ 34 weeks gestational age. Subjects were excluded if they received HFJV as a first line therapy upon admission. Ventilator parameters and laboratory data were extracted and analyzed prior to HFJV transition and at hours 1, 4, 6 and 12 following conversion. Data included: PEEP, mean airway pressure, FIO2, peak inspiratory pressure (PIP), pH, capillary carbon dioxide level and sigh-breaths. Since the data were not normally distributed, they are reported as median (interquartile range). The Kruskal-Wallis test with Dunn posttest were used in order to evaluate differences in parameters over time.
Results:
Fifty-three premature subjects (n = 37 male) were studied. Median gestational age was 25.5 weeks (24.1 – 27.8) and birthweight of 900g (695 – 1,555). Subjects received conventional ventilation for a median of 50 hours (13.8 – 218) prior to HFJV; with PIP 20 cm H2O (18 – 24) and frequency 40 breaths/min (38 – 44) respectively. A HFJV frequency of 420 breaths/min and on-time of 0.02 seconds were used for all subjects. A target pH ≥ 7.25 and FIO2 ≤ 0.4 was achieved in 54% and 60% of subjects at four hours, respectively. Ventilator parameters and laboratory data are displayed in Table 1.
Conclusions:
We observed a statistically significant increase in PEEP, PIP, pH and decrease in PcCO2 compared with baseline. Our findings may inform initial PEEP during conversion to HFJV.
Results are presented as median (interquartile range)* PEEP significantly higher than baseline † PIP significantly higher than baseline ‡ pH significantly higher than baseline§ PcCO2 significantly lower than baseline
Meeting report
Restricted accessMeeting reportFirst published October, 2019pp. 3225821-3225821
High-frequency jet ventilation (HFJV) has been used in conjunction with conventional ventilation (CV) for premature infants with respiratory failure. We sought to identify parameters that were associated with mortality in subjects who underwent HFJV.
Methods:
An IRB approved single-center retrospective review was conducted on subjects who received HFJV between 01/2015-01/2019. Subjects were enrolled if birth weight ≤ 2,000 grams and ≤ 34 weeks gestational age. Subjects were excluded if they received HFJV at time of admission with the aim of studying subjects who failed conventional ventilation. Ventilator parameters and laboratory data were extracted and analyzed prior to HFJV and at hours 1, 4, 6 and 12 following conversion. Subject demographics, including duration of ventilation, infection status, and inhaled nitric oxide usage were analyzed. Since the data were not normally distributed, they are presented as median (interquartile range). Mann-Whitney un-paired t-test was used to assess differences in continuous variables and the chi-square and Fisher exact test were used for categorical variables between the groups.
Results:
Fifty-three premature subjects, (n = 37 male) were studied. Prior to HFJV, PEEP was lower in non-survivors (5 cm H2O vs. 6 cm H2O, P = .18) and FIO2 (.50 vs. .35, P = .049) was higher. Initial HFJV PIP (29 cm H2O vs. 26 cm H2O, P = .02); inhaled nitric oxide use (∼8% vs. 4%, P = .04) and FIO2 (.50 vs .34, P = .03) at 4-hours were higher in non-survivors. Non-survivors were more likely to be female (50% vs. 16%, P = .02); larger (1,200 grams vs. 800 grams, P = .04); and transitioned to HFJV at later postmenstrual age (29.5 weeks vs. 27.7 weeks, P = .04). Subject demographics and characteristics are displayed in Table 1.
Conclusions:
We identified that PMA, weight, initial HFJV PIP, FIO2 and nitric oxide use were higher in non-survivors, and baseline PEEP was lower. These data may help to inform ventilation strategy and identify patients who are most likely to benefit from HFJV in the neonatal intensive care unit.
* Postmenstrual age at time of HFJV† Duration of conventional ventilation prior to HFJV NEC = necrotizing entercolitis PDA = patent ductus arteriosus
Meeting report
Restricted accessMeeting reportFirst published October, 2019pp. 3226031-3226031
The Virtual Critical Care Respiratory program collaborated with a fourteen bed ICU, Atrium Health Union, to establish a target time for the daily Spontaneous Awakening and Breathing Trials (SAT/SBT). Once the targeted time was in place, the Virtual Respiratory Therapists (VRTs) would implement the idea of SBT re-trials on patients who meet criteria to decrease VLOS to a higher degree. Re-trials are defined as a second trial for those meeting the criteria per protocol, who failed the initial daily trial, or did not meet criteria previously but have been managed up. This program can positively impact overall VLOS by encouraging re-trials resulting in earlier extubations and decreased ventilator days.
Methods:
IRB approval was received, and the project was deemed quality improvement. A cohort study was performed. All vented subjects during quarter 1 2019 at a comparable facility, Atrium Health Cleveland, were identified. Encounters were analyzed for re-trial opportunities in addition to the daily SBT. The VCC teams collaborated with bedside teams to set a specific time for daily SBTs at AH Union. VRTs assessed remaining vented patients after the daily trails to make suggestions for optimization and re-trials.
Results:
330 encounters were analyzed at AH Union during quarter 1. 303 encounters remained vented after the daily SBT. 48 of 57 re-trials were scheduled and completed. 32 of 48 re-trials were done and passed resulting in 31 encounters liberated from the vent with the VRT initiative. The total vent days, average vent days, and vent days/patient days (%) were compared between AH Cleveland, with no VRT intervention, and AH Union, with VRT intervention. The total vent days at AH Cleveland for 2019 quarter 1 were 300.5, with the average being 4.4 days. The total vent days at AH Union for 2019 quarter 1 were 326.2 days, average 3.8 days yielding a vent days/patient days 44%. In comparison to AH Union’s 2018 quarter 1 total vent days of 370.1, average of 4.4 days yielding a vent days/patient days 49.3%. A significant reduction in ventilator days was identified with the VRT re-trial initiative.
Conclusions:
Virtual Respiratory Therapists implemented the process of ventilator liberation re-trails that positively affected VLOS as the Power BI, Atrium Health’s system data base, vent days for January 2018 were 3.75 and decreased for January 2019 to 3.31 days for AH Union. AH Cleveland’s VLOS for Jan 2019 was 4.39 days without any VRT interventions.
Atrium Health Union Ventilator Length of Stay O/E trends from before and after VRT SBT re-trial iniative.
Meeting report
Restricted accessMeeting reportFirst published October, 2019pp. 3226632-3226632
Michelle A Bair, Rachel Denise Dowd, Tiffany Bollman , [...]
View All
Abstract
Background:
The Center for Disease Control (CDC) and National Health Safety Network (NHSN) have defined VAE as a deterioration in respiratory status following a period of stability-determined by PEEP or FIO2, evidence of inflammation or infection-determined by patient temperature and white blood cell count or lab evidence of a respiratory infection. VAE rate is defined as the number of events per 1000 ventilator days. The VAE rate had been higher than expected in our adult Surgical/Trauma and Neuro ICUs. We wanted to determine if a performance improvement process could reduce that rate. METHOD: This is a retrospective review of all ventilator patients in our Surgical/Trauma and Neuro ICUs during the baseline (January 2013 to September 2018) and pilot (September 2018 to present) periods. We employed a PDCA performance improvement process. The main performance improvement implementations that occurred were caregiver education on the VAE criteria and initiating a new standard baseline PEEP setting of 6 cm H2O for all ventilator patients instead of 8 cm H2O.
Results:
Mean VAE rates for the Surgical/Trauma and Neuro ICUs were 18.9 and 15.7, respectively, prior to project implementation. After implementation, VAE rates fell to 3.7 and 2.6, yielding an 80% and 83% reduction in the VAE rate. The reduction is statistically significant for both ICUs (P < .05). See image for control chart of VAE rate in the Surgical/Trauma ICU over time with baseline and pilot periods Conclusions: Changing the standard baseline PEEP level for adult ventilator patients and improving understanding of how PEEP management can trigger a VAE resulted in a significant reduction in the VAE rates. Since the success of the project, the new standard baseline PEEP has been implemented system-wide and VAE rates will continue to be monitored for ongoing success.
Meeting report
Restricted accessMeeting reportFirst published October, 2019pp. 3226853-3226853
Michael McPeck, Sunya Ashraf, Ann D Cuccia , [...]
View All
Abstract
Background:
Inhaled albuterol and prostacyclin continuous infusion aerosol delivery during mechanical ventilation (MV) evolved as a popular off-label treatment for refractory asthma and severe respiratory failure with pulmonary arterial hypertension and arterial hypoxemia. Initial protocols used a sidestream jet nebulizer (JN) and, more recently, a vibrating mesh nebulizer (VMN). Breath-enhanced (BE) JN has potential advantages. This study compared aerosol delivery of BEJN to VMN during continuous infusion.
Methods:
4 samples of BEJN i-VENT (InspiRx, Somerset NJ) and VMN Solo (Aerogen, Galway Ireland) were used in rotation during testing. Using infusion pump flows between 1.5 - 12 mL/h, radiolabeled saline was infused into nebulizers during MV of a test lung. Four breathing patterns with 2 L/min bias flow, 5 cm H2O PEEP and duty cycles (DC, % inspiratory time) ranging from 0.12 - 0.33 were tested. The VMN was placed on the dry (inlet) side of an F&P MR850 heated humidifier (run at 37°C to achieve temperature prior to all tests). The BEJN, placed on the wet (outlet) side, was operated by an air flow meter at 3.5 L/min. Test runs for each DC and humidifier placement were conducted for 1 h, after which radioactivity collected on a filter (Inhaled Mass, IM) at the test lung’s airway opening was measured by gamma scintigraphy and expressed as a percentage delivery rate of the radioactivity initially placed in the infusion syringe per hour (IM%/h). Humidifier retention of aerosol was also measured.
Results:
IM%/h vs infusion pump flow regression for VMN (y = 0.45x, R2 = 0.29) and BEJN (y = 0.61x, R2 = 0.93) showed greater scatter for VMN due to failures (Figure). At 10-12 mL/h, some VMNs did not keep pace with infusion rate, accumulated excess solution and failed to nebulize. Otherwise, IM%/h for both BEJN and VMN tended to plateau between 10-12 mL/h. The VMN dry side placement deposited 14.7%/h in the humidifier versus 0.2%/h for BEJN wet side placement.
Conclusions:
Our data demonstrate that continuous infusion aerosol delivery rate, IM%/h of the i-VENT breath-enhanced JN, which can be utilized for continuous albuterol and prostacyclin aerosol delivery during MV, is more consistent than VMN, suggesting that: (1) predictable dose delivery can be achieved with a breath-enhanced JN, (2) BEJN is more reliable than VMN, (3) 10 mL/h infusion flow is a practical maximum for both devices, and (4) BEJN avoids humidifier contamination.
Meeting report
Restricted accessMeeting reportFirst published October, 2019pp. 3226893-3226893
Nishimura reported in his article regarding respiratory care in 2016 that high-flow nasal cannula (HFNC) was a reliable therapy device for respiratory failure patients with hypercapnia. However, we often experienced carbon dioxide narcosis in patients using Venturi-effect typed HFNC (HFNC/Venturi). PURPOSE We hypothesized that oxygen concentration was increased by back pressure in the circuit of HFNC/Venturi which was produced during breathing.
Methods:
FIO2 on HFNC/Ventrui was adjusted to 32%, which is the minimum concentration (MaxVenturi, Maxtec, US). Three volunteers using the Venturi-effect typed HFNC maintained stable breathing for 30 seconds. Then, the back pressure and the oxygen concentration in the circuit during their stable breathing were measured three times for each examinee. The experimental conditions used are shown as below. Total flow: 20 to 60 L/min. Breathing style: mouth and nose.
Results:
Back pressure in the mouth breathing when the total flow was 60 L/min reached a median of 14.2 cm H2O (interquartile range [25th to 75th percentile], 14.0 to 14.2), as compared with 1.65 cm H2O (IQR, 1.60 to 1.80) in that of the total flow 20 L/min (P < .001). In the nose breathing, back pressure of the total flow 60 L/min reached a median of 15.9 cm H2O (IQR, 15.4 to 16.3), as compared with 1.90 cm H2O (IQR, 1.63 to 2.18) in the total flow 20 L/min (P < .001). Similarly, the oxygen concentration in the circuit increased significantly in proportion to the increase of the total flow (figure).
Conclusions:
The results support the hypothesis that FIO2 in the circuit of the Venturi-effect typed HFNC would increase in proportion to the back pressure produced during breathing. Therefore, the use of the Venturi-effect typed HFNC in COPD is recommended to be avoided in clinical situations.
Oxygen concentration in the circuit of the Venturi-effect typed HFNC on the setting: FIO2 32%: It increased in proportion to total flow in both breathing styles. Especially, the measured oxygen concentration of nasal breathing was significantly higher than that of mouth breathing.
Meeting report
Restricted accessMeeting reportFirst published October, 2019pp. 3227255-3227255
Sarah Bazelak, Jennifer Popies, Sarah Vanderlinden , [...]
View All
Abstract
Background:
In the fall of 2016 as we aligned with Cleveland Clinic Alliance Network, it became clear that we had a significantly larger cardiac bypass and graft (CABG) patient population experiencing prolonged mechanical ventilation versus the national STS data. From January through September 2016, we had 11 patients (9.7%) receiving mechanical ventilation for >24 hours post-operatively versus the national Society of Thoracic Surgery database at 7.9%.
Methods:
Using the Plan-Do-Study-Act (PDSA) approach, an interdisciplinary team was formed comprised of RNs, providers, RTs, physical therapy and pharmacy. An early extubation protocol was developed to guide all disciplines within all phases of care from pre-operative to post-extubation. Once implemented, ongoing evaluation of patient outcomes and caregiver feedback supported a continued PDSA cycle.
Results:
In fiscal year 2018 an increase of prolonged ventilation occurred. Interdisciplinary quarterly meetings were established to review cardiac surgery prolonged ventilation cases and determine trends. Challenges were also identified: three new cardiac surgeons joined our hospital in 2017, case volume increased by 21% (311 procedures in FY2017 to 376 in FY2018). We experienced an increase in high acuity cases such as ventricular assist devices (VADs), heart transplants, etc. that made up almost 33% of the total cardiac cases. After identifying the obstacles, changes were made utilizing the PDSA model. Changes made included new approach to identifying patient trends, broadened eligibility criteria and a 20-hour bedside huddle with RT, RN and provider if patient was still intubated. Once the protocol was established, the process saw impressive results regarding the percentage of CABG patients with prolonged ventilator times during our fiscal year 2017: Q1 8%, Q2 14.3%, Q3 (roll out of early extubation protocol) 3.7% and Q4 0%. In fiscal year 2018, a resurgence of prolonged mechanical ventilation after the success in fiscal year 2017: FY2018: Q1 11.1%, Q2 6.3%, Q3 14.3%. After the interdisciplinary workgroup made modifications using the PDSA model which led to a reduction of prolonged ventilation in Q4 to 4.5%.
Conclusions:
An interdisciplinary approach is necessary to facilitate and maintain the process of striving for early extubation in cardiac surgery patients. We incorporated this process for all cardiac surgery types in our CVICU and continue to meet as a team on a quarterly basis to review and adjust our protocol as needed utilizing the PDSA model.
Meeting report
Restricted accessMeeting reportFirst published October, 2019pp. 3227278-3227278
Rachel A Carragher, Clair L Daly, Lynne A Belazarian , [...]
View All
Abstract
Background:
Patients admitted to emergency departments (ED) with breathlessness are often ordered on bronchodilator therapy. Due to limited clinical response, dosing of these short acting bronchodilators has necessitated the use of hour-long aerosol therapy with jet nebulizers (JN) to accommodate the required high dosages for asthma and COPD patients admitted to our ED. Our aim was to determine whether treatment with vibrating mesh nebulizer (VMN) compared to (JN) would result in less total amount of albuterol (mg) required for adult asthma and COPD patients.
Methods:
We designed a prospective, single center, non-randomized chart review study of adult asthma and COPD patients in the ED with breathlessness requiring bronchodilator therapy (at the treating physician’s discretion). They were treated according to current standards with JN during period 1 or VMN during period 2 (sample size calculation, 80% power). At the end of the two treatment periods, demographic and endpoint data were extracted from the electronic medical record (EMR) for patients meeting inclusion and exclusion criteria. This study was IRB approved.
Results:
A total of 199 patients (118 JN, 81 VMN) were extracted from the EMR between December 10, 2018 and April 5, 2019. The total mean amount of albuterol (mg) required was significantly less in asthma patients treated with VMN compared to JN (7.9 ± 5.4 vs. 13.8 ± 9.6. respectively) (P = .0003) but it was not significant in the COPD patients (7.6 ± 4.4 vs. 8.8 ± 6.5. respectively) (P = .84). Patients treated for asthma and COPD combined with VMN required significantly fewer treatments compared to JN (2.1 ± 1.6 vs. 2.7 ± 1.6. respectively) (P = .009). Total treatment time (minutes) for asthma patients treated with the VMN was significantly less than the JN (40.7 ± 24.9 vs. 63.1 ± 40.4. respectively) (P = .002) but for COPD it was not significant (40.4 ± 23.1 vs. 42.6 ± 26.3. respectively) (P = .99). In asthma patients, 1 in 42 (2.4%) VMN required an hour-long treatment compared to 30 in 63 (47.6%) in the JN group (P < .001). In COPD patients 0 of the 39 VMN required hour-long treatments compared to 9 in 55 (16.4%) in the JN group (P < .001).
Conclusions:
Asthma patients treated with the VMN required significantly less total albuterol and shorter treatment times. Combined COPD and asthma patients treated with VMN required significantly fewer treatments. Both diagnoses required significantly fewer hour-long treatments with VMN vs JN.
Meeting report
Restricted accessMeeting reportFirst published October, 2019pp. 3227325-3227325
Bradley Arthur Kuch, Barbara Madison, Jennifer Milavec , [...]
View All
Abstract
Background:
Bubble continuous positive airway pressure (bCPAP) in preterm infants has been associated with fewer doses of surfactant, fewer days on mechanical ventilation, and lower fraction of inspired oxygen (FIO2). Most bCPAP evidence focuses on delivery room initiation and extubation of low birth weight preterm neonates. We sought to evaluate outcomes associated with bCPAP in a diverse population admitted to a quaternary-academic neonatal intensive care unit. We hypothesize application of bCPAP is associated with decreased ventilator days, fewer surfactant doses, and shorter length of stay (LOS) in a diverse patient population.
Methods:
A respective analysis of neonates supported via bCPAP between July 2018 and April 2019, comparing pre- vs. post-implementation outcomes. Differences determined by student T-Test for continuous variables presented as mean ± standard deviation. Demographics, bCPAP measures, and failure rates (need for intubation) were evaluated. Outcomes included average monthly ventilator days, surfactant doses administered per month, and NICU LOS. The project was approved by the Quality Improvement Review Committee.
Results:
One hundred twenty-five patients were included in the study. Gestational age were 36.9 ± 7.2weeks, weight 2.4 ± 0.9 kilograms, 63 (50.4%) were male, and 28 (22.4%) had surgical intervention. Diagnostic categories illustrated in Figure 1. Duration of bCPAP support was 7.3 ± 8.7 days with an initial FIO2 of 0.32 ± 0.13 and FIO2 of 0.27 ± 0.13 at cessation of support. Fourteen (11.2%) patients failed bCPAP. Of infants successfully weaned from bCPAP, 52.8% were on room air, 26.4% were supported by low-flow nasal cannula, and 9.6% received high-flow nasal cannula. We found a significant decrease in surfactant doses per month (7.0 ± 1.0 vs. 1.3 ± 0.6; P < .001) when comparing pre- vs. post-implementation groups. No difference was found between ventilator days or NICU LOS.
Conclusions:
We describe the use of bCPAP in a diverse NICU population with low rates of bCPAP failure. Greater than 50% of the cohort did not require supplemental oxygen support post therapy. A significant decrease in surfactant administration following bCPAP adoption was found, having workflow and financial implications. No difference in ventilator days or NICU LOS was found.
Meeting report
Restricted accessMeeting reportFirst published October, 2019pp. 3227362-3227362
Jasmine Brown, John Trimboli, Teresa J Miller , [...]
View All
Abstract
Background:
The National Board of Respiratory Care (NBRC) reports that the national first-time pass rate for the Clinical Simulation Exam (CSE) is < 65%. This relatively low performance coincides with the results of the closed CSE given to Middle Georgia State University students within the respiratory therapy (RT) program. The purpose of this study is to compare student performance on the CSE before and after implementation of high-fidelity simulation in the respiratory curriculum. The secondary purpose is to determine the progression of students’ performance with high-fidelity simulation exposure over time.
Methods:
The RT program implemented a high-fidelity simulation program into the curriculum in 2016. The program utilizes certified patient case scenarios based on the NBRC matrix. Each simulation involves pre-brief, simulation, debrief and post-debrief questions written for NBRC Board preparation. Data was collected over a 2-year period (2016-2018) over the course of two semesters for each cohort increasing the number of simulations completed between groups (none, 3, and 8 simulations) including grade point averages (GPA). GPAs were compared between each group using one-way ANOVA with Tukey HSD analysis via 95% confidence intervals (N = 58 students).
Results:
There is no statistical difference between students’ first time CSE pass rate (.625) and the national pass rate (.579) for students completing three high fidelity simulations (z = .37, P = .36). Respiratory therapy students’ first time CSE pass rate for students completing eight high fidelity simulations (.937) is significantly greater than the national pass rate (.712), (z = 1.99, P = .023).
Conclusions:
The use of eight high-fidelity simulations improved the performance of MGA students on the closed CSE and national board exam, whereas the use of three simulations did not. Therefore, increased exposure to high-fidelity simulation improves student performance on the National CSE.
Meeting report
Restricted accessMeeting reportFirst published October, 2019pp. 3228001-3228001
Todd F Huzar, Tonya George, Russell E Graham , [...]
View All
Abstract
Background:
Bronchoscopy is a common procedure in the ICU setting (1). It is often performed for airway inspection/visualization and secretion removal. While the procedure is among those of low to moderate risk, the question of cross contamination of patients by use of fiber optic scopes remains, with some reports of cross contamination as high as 20%(2). Single patient use disposable bronchoscopes have recently become available, but have received mixed reviews by users. Our study sought to determine the functional ability of a disposable versus a flexible fiber optic bronchoscope.
Methods:
A bench study involving direct comparison of two commercially available bronchoscopes (Olympus America, Southborough MA; Ambu Inc., Colombia MD). Each manufacturer offers a scope with a channel size of slim, standard, and therapeutic. Picture quality was not directly addressed, but was deemed adequate for routine work in the ICU. Suction capability was assessed by attempting aspiration of three solutions. 0.9% Saline was used to simulate thin liquids, Clorhexadine Gluconate 2% solution represented a medium thickness secretion, and “honey” consistency barium sulfate suspension (29% w/w) comprised a thick/tenacious secretion. Suction was applied at two settings (150 mm Hg and Full) for either 10 or 20 seconds. Solution(s) acquired were weighed on a scientific scale to an accuracy of 0.1 g (Tree Instruments, China). Findings of mass were converted to liquid volume by weighing a measured quantity (1 mL) in a 10 mL syringe. Scope choice and solution tested were randomized throughout.
Results:
Table 1 details our findings. There was no statistical difference in terms of scope tested against the same solution. There was statistical significance between solutions (P < .0005), and time of suction applied (P < .05) when results were placed in a predictive multiple regression model.
Conclusions:
In instances where the enhanced picture quality of a flexible fiber optic scope is not required, the functional ability of single patient use bronchoscopes is equal to that of the flexible fiber optic. The eliminated risk of cross contamination and the reduced cost of acquisition/maintenance of single patient use scopes should be among the deciding factors for ICU bronchoscopic procedures. References: (1) BJA Education 17;2:48-56. (2) Infect Control Today, August 10, 2018 Disclosures: The authors claim no conflict(s) of interest in this research.
Meeting report
Restricted accessMeeting reportFirst published October, 2019pp. 3228205-3228205
Russell E Graham, Randi Thompson, Kwame Bennam , [...]
View All
Abstract
Background:
Bland aerosol therapy via large volume nebulizer remains a standard of care in tracheostomy patients (1). Our facility routinely provides care for > 20 tracheostomy patients on a daily basis, and respiratory care is solely responsible for all aspects of their tracheostomy care needs. After a recent product substitution, staff began to anecdotally report a negative quantitative and qualitative change in the sputum characteristics of their tracheostomy patients. Given the timing of these reports, the new product became immediately suspect. It was felt that the new large volume nebulizer was inferior to the old one, with reduced aerosol output being the cause of thicker and more tenacious secretions. Aerosol characteristics of both the old and new large volume nebulizer were not readily available. Our study set out to objectively evaluate both products.
Methods:
A bench study utilizing a hygrometer placed in line at the distal end of an aerosol circuit via a tee piece. This placement would evaluate function as aerosol was delivered. Standard large bore aerosol tubing was utilized. Outputs from the two nebulizers (Teleflex, Temecula, CA; AirLife, San Diego, CA) were sampled at varying flows and FIO2 illustrated in Table 1. The minimal FIO2 (0.28) was sampled, as was a 1:1 entrainment ratio at a FIO2 of .60 and a maximal FIO2 (no entrainment) for each device.
Results:
There was no statistically significant difference noted in the humidity level provided by either device again as noted in Table 1. Readily visible mist output was noted on all but one FIO2/flow combination on one device. Ambient temperature (22.8 C) and RH (59%) were constant throughout the study.
Conclusions:
The product change occurred during the winter season, and ambient conditions from that time are not known and are thus unable to be duplicated. It is possible that the ambient conditions were the cause of the clinical concern and that the product substitution had no effect. It should be noted that the finer mist from the low flow/low FIO2 combination more than likely contributed to the cause of the complaint(s). Reference: Egan’s Fundamentals of Respiratory Care, 9th Edition Disclosures: The authors claim no conflicts of interest in this research.
Meeting report
Restricted accessMeeting reportFirst published October, 2019pp. 3228971-3228971
Kenneth Miller, Anne Rabert, Vanessa Ribaudo-Kaufman
Abstract
Background:
Utilization of high-flow oxygen is an expanding clinical intervention in adult and pediatric patients. Clinical indications for adult high-flow oxygen via a nasal cannula or tracheostomy aim to improve oxygenation, meet ventilatory demand, provide mucokinetic therapy, provide post-extubation humidification, and enhance work of breathing comfort at the end of life. With this continually expanding indication list, clearly defined resource allocation is imperative. Unfortunately, the therapy popularity often times results in the clinical needs exceeding device availability.
Methods:
To facilitate optimal resource allocation for high-flow oxygen, a multi-disciplinary team at Lehigh Valley Hospital Cedar Crest developed a clinical management protocol focusing on high-flow oxygen (Fig. 1). Providers’ requirements of clinical indication for use and SpO2 target were imbedded in the protocol and in the electronic order set. Based on these clinical goals, the bedside nurse and registered respiratory therapists followed the designed protocol to escalate, reduce or liberate the high-flow oxygen delivery. Time restrictions were also placed on the post- extubation and enhanced work of breathing comfort indications to facilitate high-flow oxygen termination.
Results:
Post protocol implementation of the high-flow delivery treatment strategy resulted in an average time duration of high flow use reduction from a historical mean of 18.3 hours to 11.7 hours. Return to high flow oxygen post- termination remained similar between 20 and 25 percent.
Conclusions:
Based on this experience, care giver collaboration and compliance to the developed high-flow protocol assists to define clear clinical end-points and optimize resource allocation. Reducing high flow oxygen device duration allows the equipment to be used more appropriately on patients in acute distress.
Meeting report
Restricted accessMeeting reportFirst published October, 2019pp. 3229109-3229109
As a follow up report on last year’s abstract, we continued to monitor and adjust our High Flow Nasal Cannula (HFNC) use in all areas. Our previous success of HFNC use outside of the critical care areas on our medical floors resulted in decreased ICU days and decreased noninvasive ventilation (NIV) use. This study was to evaluate our continued success of appropriate HFNC use, including where to care for the patient, as well as whether we continued to decrease NIV cases. Prior to our initiation of HFNC use on the medical floors, all patients on HFNC would have gone to the ICU on NIV.
Methods:
We evaluated all patients on HFNC from 5/1/18-1/31/19. We looked at where HFNC was initiated, whether it was used on the medical floors or whether an ICU admission was needed. If an ICU transfer occurred, we then reviewed each case to determine if that patient required an escalation to NIV once in ICU. We stretched the limits of our current policy on HFNC on the medical floors, on a case-by-case basis, as our comfort with HFNC increased.
Results:
There were 99 HFNC treatments on 95 patients admitted through the Emergency Department. Fifty-one treated patients were admitted directly to the medical floor on HFNC. Two of these patients required a transfer to the ICU, where only one required NIV. Thirty-five of the 48 patients admitted directly to the ICU were managed with HFNC alone. Three of these patients transitioned to the floor on HFNC successfully, not requiring NIV. Eight of these ICU patients required escalation of respiratory support to NIV. Three patients admitted to the ICU on NIV were transitioned to HFNC successfully. Two patients were treated with NIV at night and HFNC during the day by schedule. HFNC patients treated on the medical floors were managed successfully without NIV 98% of the time. Eighty-eight of the ninety-five patients never required NIV. Forty-nine ICU admissions were avoided and many ICU days were decreased using HFNC.
Conclusions:
Patients requiring HFNC can be safely managed on the medical floor. This can free up ICU resources and decrease NIV use. Disclosures: Acevedo - consultant for Monaghan Medical and Sunovion.
Meeting report
Restricted accessMeeting reportFirst published October, 2019pp. 3229128-3229128
Tiotropium HandiHaler posed significant issues to respiratory care and pharmacy even with our common canister approach. We looked for alternatives to improve respiratory therapist (RT) workflow and to manage cost. We piloted the non-institutional size tiotropium Respimat due to the increase use in the outpatient settings. At the time of the initial trial Respimat was not available in an institutional size. Our findings showed that the non-institutional size was cost prohibitive, however improved RT workflow. In July of 2018 the institutional size was made available. For the above reasons we evaluated the institutional size Respimat using common canister.
Methods:
All patients receiving tiotropium by Handihaler from 1/18 onwards were converted to the non-institutional size Respimat and administered by common canister. On 7/18 Respimat was converted to the institutional size and administered by common canister. We compared the actual pharmacy costs of non-institutional and institutional size Respimat, both administered with common canister. Costs with 100% or no common canister delivery were estimated.
Results:
Costs: HandiHaler (5 capsules) $37.22, $7.44 per day; non-institutional size Respimat (30 doses) $333.02, $11.10 per day; institutional size Respimat (14 doses) $36.29, $2.59 per day. Pre-intervention monthly HandiHaler cost was $3,481. Average non-institutional size Respimat monthly cost using common canister was $11,375, a 3.27 fold increase in cost. Common canister was used 72% of the administrations. Average Institutional size Respimat monthly cost using common canister was $1,641, a 53% reduction in HandiHaler cost. Common canister was used 76% of the administrations. Treatments on influenza and isolation patients were done without common canister. Estimated average monthly cost of institutional size Respimat without common canister would be $1,212, a 14% reduction in HandiHaler cost.
Conclusions:
Tiotropium delivered by institutional size Respimat is cost effective compared with HandiHaler. Significant additional cost savings can be achieved with common canister. Delivery with the HandiHaler can be eliminated. Disclosures: Acevedo - consultant for Monaghan Medical and Sunovion.
"Tiotropium Respimat Pilot(COPD LOS 5.7 days)"
Cost per day
Cost ratio to HandiHaler
Estimated monthly cost
Actual monthly average cost
Actual cost ratio to HandiHaler
HandiHaler cost
$42.41
1
$3,482
1
Non-Institutional size Respimat -no Common Canister
$333.02
7.85
$27,343
Non-Institutional size Respimat 72% Common Canister
$63.27
$11,376
3.27
Non-Institutional size Respimat 100% Common Canister
$63.27
1.49
$5,195
Institutional size Respimat no Common Canister
$36.29
0.86
$2,980
Institutional size Respimat 76% Common Canister
$14.76
$1,641
0.47
Institutional size Respimat 100% Common Canister
$14.76
0.35
$1,212
Meeting report
Restricted accessMeeting reportFirst published October, 2019pp. 3229173-3229173
Ann D. Cuccia, Sunya Ashraf, Michael McPeck , [...]
View All
Abstract
Background:
Aerosol delivery during mechanical ventilation is uncontrolled and a function of duty cycle, bias flow, nebulizer position and methods of humidification. The present study tested a novel nebulizer and circuit (i-VENT, InspiRx, Somerset, NJ) that utilizes the energy of ventilator flow to generate aerosol (breath enhancement) combined with stand-alone breath actuation to minimize ventilator influences. The unique circuit design incorporates ‘wet side’ jet nebulization at the humidifier outlet designed to prevent unpredictable tube losses of generated aerosol with active humidification. The system was studied using several ventilator brands over a wide range of settings, with and without humidification.
Methods:
During a treatment, a 3-way valve directed all ventilator flow to the nebulizer. Aerosol was generated during inspiration by activation of a pressure sensitive breath-actuated circuit. O2/air at 50 PSIG powered the nebulizer at a flow of 3.5 L/min. In vitro testing was performed using a heated wire circuit with humidification or by-passable/valved HME (BP-HME) on several ventilator brands over a range of breathing patterns, ventilator modes and bias flows (0.5-5 L/min). The nebulizer was charged with 6 mL of radiolabeled saline. Mass balance was performed using a gamma camera. Mann-Whitney test was used.
Results:
IM (% neb charge): mean ± SD [all data] 31.1 ± 6.33, n = 82; humidified 35.6 ± 5.47, n = 30; BP-HME 28.6 ± 5.31, n = 52. There was a significant difference in IM between humidification type (BP-HME and active humidification) for all data (P < .001), CMV modes (P < .001), and pressure support/APRV modes (P < .001). Bias flow had no effect, MMAD: Humidified 1.1 µm, BP-HME 0.9 µm.
Conclusions:
Breath enhancement with breath actuation overcomes much of the variability in aerosol delivery providing a predictable dose at any ventilator setting or type of humidification. Preservation of drug delivery during heated humidification is a new finding, compared to previous studies, with clinically minimal effects of humidification method. The use of wall gases and stand-alone breath actuation standardizes conditions driving the nebulizer independent of ventilator design. ‘Wet side’ nebulizer placement at the humidifier outlet allows delivery without introducing aerosol into the humidification chamber and circuit design allows nebulizer servicing without circuit interruption.
Meeting report
Restricted accessMeeting reportFirst published October, 2019pp. 3229349-3229349
Sunya Ashraf, Ann D Cuccia, Michael McPeck , [...]
View All
Abstract
Background:
Aerosol technology during modern mechanical ventilation is constantly evolving. This in vitro study compared 3 nebulizer designs: a new breath-enhanced jet nebulizer (BEJN), i-VENT (InspiRx, Somerset NJ); vibrating mesh (VMN), Solo (Aerogen, Galway Ireland); and jet nebulizer (JN), Hudson MicroMist (Teleflex Medical, Morrisville NC) during mechanical ventilation. Aerosol delivery (Inhaled Mass, IM) was measured using multiple ventilator settings (TI = 0.45 to 1.01). Device reproducibility, humidification effects and fill volume were assessed. Measurements included mass balance across the ventilator circuit and particle size distribution.
Methods:
Using radiolabeled saline and gamma scintigraphy, bench studies were performed using 2 ventilators, 4 breathing patterns. Four examples of each nebulizer type were randomly rotated during testing to assess reproducibility. 3- and 6-mL fill volumes were tested wet and dry [with and without heated wire humidification (Hudson Neptune Heated Humidifier, Teleflex Medical)]. Measurements of IM, nebulizer residual and exhaled mass, plus circuit losses were made to account for the total mass balance. Aerosol particle size distribution (APSD) at the distal ETT tip was made with a Marple cascade impactor. Statistical analysis was performed using Mann-Whitney.
Results:
Mean ± SD IM (% of nebulizer charge) averaged 17.5 ± 4.99%, 17.2 ± 7.81%, and 6.43 ± 6.43%, for BEJN, VMN and JN respectively (Figure). IM for VMN varied widely due to random failures to complete nebulization. For all ventilator settings, IM for JN was significantly affected by combined effects of fill volume and humidification compared to the BEJN (P = .002) and VMN (P = .02). BEJN and VMN were not different (P = .74). Mass balance indicated that large particles were lost in ventilator tubing for all devices and, for VMN, also in the humidifier (17%), resulting in similar APSD measurements (MMAD = 1.05, 1.05, 1.2µm for BEJN, VMN, and JN). Humidity effects were significant only for JN using 3 mL volume fill (P = .002).
Conclusions:
Aerosol delivery during BEJN nebulization was less sensitive to fill volume, humidification and ventilator settings than VMN or JN. VMN delivery was not predictable over the range of individual devices and settings. All devices delivered similar particle size distributions to the distal ETT. Breath-enhanced nebulizer technology can ensure better control of drug delivery during mechanical ventilation.
Meeting report
Restricted accessMeeting reportFirst published October, 2019pp. 3229360-3229360
Continuous positive airway pressure (CPAP) is a noninvasive method to deliver positive pressure with the goal of increasing the preterm infant’s functional residual capacity (FRC) and improving gas exchange. Use of CPAP has been shown to aid in the prevention of atelectasis while reducing the number of obstructive and central apnea events for preterm infants. Bubble CPAP (BCPAP) is one modality to provide CPAP to infants. Some preterm infants suffer from Bronchopulmonary Dysplasia (BPD), which is a form of chronic lung disease. Due to the immaturity of the lungs, infants born prematurely, less than 33 weeks and of low birth weight are at a greater likelihood to develop the disease. BPD is associated with inflammation and scarring in the lungs, caused by mechanical ventilation and long-term use of oxygen. The amount of oxygen or respiratory support an infant requires at a corrected gestational age of 36 weeks determines the severity of BPD.
Methods:
Data and criteria presented at a major institution with notably low BPD rates prompted the development of practice guidelines. A multidisciplinary team of Nursing, Respiratory Care, Nurse Practitioners and Neonatology assessed the BPD rates of the Vermont Oxford Network (VON) and compared our institutional BPD rate. Based on our data and the guidelines of another institution, the practice guidelines include the level of CPAP at initiation, increasing or decreasing CPAP level based on oxygen requirements, and criteria to trial off. Because infants less than 30 weeks are generally in a low birth weight category, they were the group of patients concentrated on for the guidelines. The data collected in regards to the BPD rate included the number of ventilation days and number of CPAP days. Modification to the trail off criteria evolved after review of other facilities trialing off CPAP at an earlier state and maintaining low BPD rates.
Results:
Implementation of BCPAP guidelines decreased our BPD rate to 26% from 36-41% in previous years 2014-2017; respectively, intubation rates for very low birth weight, and improved consistency of CPAP therapy utilization.
Conclusions:
Guideline implementation for initiation, maintenance, and weaning BCPAP decreases BPD in the preterm infant.
Meeting report
Restricted accessMeeting reportFirst published October, 2019pp. 3229773-3229773
Interprofessional education (IPE) is recognized by the World Health Organization (WHO) and Institute of Medicine (IOM) as foundational to achieving safe, high quality, accessible, patient-centered care (Buring et al., 2009). Interprofessional (IP) teams provide opportunities to exchange knowledge and appreciate the scope of practice among healthcare professions. Hospitals utilize a variety of IP teams. IP early mobility (EM) teams are common among the regionÍs hospital systems; however, occupational therapy students (OTS) and respiratory therapy students (RTS) have minimal opportunity to participate. The purpose of the study is to describe this IP activity and evaluate and summarize student perceptions of this peer-teaching and learning activity.
Methods:
The study was approved by the IRB. Participants included graduate OTS and undergraduate RTS. To provide students with realistic patient interactions and optimal feedback during the simulation, volunteers were recruited from the local OT and RT network to role-play mechanically ventilated patients and patients on bland aerosol therapy via tracheostomy tube. Prior to the simulation, OTS and RTS presented on various components of their profession (scope of practice, importance of functional and EM, how to perform a stand-pivot transfer, overview of oxygen modalities and assessment parameters). Next, students were required to safely transfer the patient while maintaining equipment, monitoring vital signs, and appropriately assessing the patient. Finally, students were debriefed and asked to participate in a 4-point Likert scale survey consisting of 6 questions focused on the peer-teaching experience. Results were summarized by ni and fi.
Results:
47 students participated; 31 OTS and 16 RTS. The ni and fi of students responding ñStrongly Agreeî to the 6 survey questions (Q) are: Q1 (n = 39) 83%, Q2 (n = 37) 79%, Q3 (n = 32) 68%, Q4 (n = 35) 74%, Q5 (n = 34) 72%, and Q6 (n = 46) 98%. Majority of students strongly agree with each survey question.
Conclusions:
Overall, student perceptions of this IP peer-teaching and learning activity and working in an IP environment were positive. Faculty plan to continue this IP activity. Reference: Buring SM, Bhushan A, Broeseker A, Conway S, Duncan-Hewitt W, Hansen L, Westberg S. Interprofessional education: definitions, student competencies, and guidelines for implementation. Am J Pharma Educ 2009;73(4). Disclosures: None
Survey Questions
Survey Responses
ni
fii
Q1: What I have learned in this unit will help with my OT/RT role.
Strongly Agree
39
83%
Agree
8
17%
Disagree
0
0%
Strongly Disagree
0
0%
Q2: The peer-teaching experience was time and effort well spent.
Strongly Agree
37
79%
Agree
10
21%
Disagree
0
0%
Strongly Disagree
0
0%
Q3: From this experience, my understanding of the principles underpinning teaching and learning has increased.
Strongly Agree
32
68%
Agree
13
28%
Disagree
2
4%
Strongly Disagree
0
0%
Q4: The peer-teaching experience allowed me to reflect on my own previous learning.
Strongly Agree
35
74%
Agree
12
26%
Disagree
0
0%
Strongly Disagree
0
0%
Q5: I will be more confident teaching a clinical skill after this experience.
Strongly Agree
34
72%
Agree
12
26%
Disagree
1
2%
Strongly Disagree
0
0%
Q6: Occupational therapists/Respiratory therapists have a professional responsibility to teach students and their peers.
Strongly Agree
46
98%
Agree
1
2%
Disagree
0
0%
Strongly Disagree
0
0%
Meeting report
Restricted accessMeeting reportFirst published October, 2019pp. 3229787-3229787
Kelly Chatham Patrick, Denise Willis, Ariel Berlinski
Abstract
Background:
Traditionally, the role of the respiratory therapist (RT) has been patient care delivery in the hospital setting. That has evolved over the last few decades to include patient education not only in the hospital but also outpatient clinics. However, formal training for patient education may not be part of the curriculum in all RT school programs. There are many RTs providing patient education that may not have received training regarding effective learning strategies in their RT school program.
Methods:
This study was not deemed human subject research by the local Institutional Review Board. RT staff at our institution were invited to complete an anonymous survey about their training and experiences with patient education. Data was collected electronically in the Research Electronic Data Capture application.
Results:
The response rate was 39% (64/164) with 81% (52/64) females, and 80% (51/64) white non-Hispanic. Most respondents (73%, 47/64) held a bachelors or higher degree. The RRT, CRT, and NPS credentials were reported by 98% (63/64), 2% (1/64), and 47% (30/64) of respondents respectively. The mean ± SD years of experience was 16.4 ± 10.8. The primary work area reported by most participants was inpatient (78%, 50/64). Sixty-six percent (42/64) graduated from RT school 10 or more years ago. Many respondents, 44% (28/64) felt that the RT school program they attended provided courses and training in patient education while 42% (27/64) did not and 14% (9/64) were neutral. The majority of respondents (58%, 37/64) would have liked more training for patient education while in RT school. RTs who graduated 10 or more years ago were less likely to have received training for patient education when compared with those who graduated less than 10 years ago (50% vs. 27%, P = 0.024). Respondents reported having been trained in the following strategies: teach back (61%, 39/64), teach to goal (40%, 25/64), and motivational interviewing (44%, 28/64). Most respondents (66%, 42/64) indicated they would like to receive additional training regarding effective learning strategies.
Conclusions:
This survey identified an educational need regarding proficiency in patient education teaching strategies. We plan to implement an educational intervention. Respiratory therapists who graduated RT school 10 or more years ago are less likely to have had patient education teaching strategies as part of their curriculum.
Meeting report
Restricted accessMeeting reportFirst published October, 2019pp. 3229808-3229808
In our pediatric institution, a dedicated respiratory therapist (RT) discharge planner coordinates the inpatient acquisition of home respiratory equipment, while multiple RTs assist with outpatient orders. Lengthy delays in receiving equipment have occurred, including cases with significant delays not discovered until hospital readmission. With no process in place to ensure that ordered equipment was provided, delays and associated obstacles were unknown or inconsistently reported.
Methods:
We conducted a quality improvement study in which a follow-up process was implemented to confirm delivery of home equipment ordered through inpatient discharges and the outpatient pulmonary clinic. The process consisted of the RT who assisted with the order placing a follow-up call to the caregivers, intervening when necessary, confirming receipt of equipment. To evaluate the process, a retrospective and prospective chart review was done from November 2017-April 2019. The length of time to obtain equipment and reasons for delay were monitored before and after process implementation. Orders for oxygen, pulse oximeter, suction, airway clearance devices, CPAP, and bi-level devices were included. Home ventilators were excluded because they must be utilized prior to discharge.
Results:
Records were reviewed for 257 orders for home respiratory equipment. Of 182 inpatient orders (92 pre/90 post), there was no change in the mean number of days to obtain the equipment after process implementation. Delays were due to late notification to the discharge planner, orders placed after discharge or on a holiday, and difficulty contacting caregivers for delivery. For the 75 orders originating in the pulmonary clinic (35 pre/40 post), the mean number of days to obtain equipment decreased from 24 days to 12 days post implementation. Outpatient delays were due to the equipment provider not receiving faxed orders, difficulty in obtaining a provider of pediatric-specific equipment, insurance verification, and the need for additional documentation of medical justification. See table.
Conclusions:
As equipment ordered during an inpatient hospitalization is generally delivered prior to discharge, the follow-up process had minimal effect on equipment delays. By providing early problem identification and timely intervention, the outpatient RTs role is valuable in reducing delays in equipment acquisition.
Time to Obtain Home Respiratory Equipment
Group
Number of orders
Mean number of days
Min
Max
Inpatient Pre-change
92
0
0
19
Inpatient Post-change
90
0
0
6
Outpatient Pre-Change
35
24
1
212
Outpatient Post-change
40
12
1
26
Meeting report
Restricted accessMeeting reportFirst published October, 2019pp. 3229835-3229835
Continuous high-frequency oscillation (CHFO) of the airway is a therapeutic mode for secretions mobilization. The device also incorporates aerosol administration using an integrated jet nebulizer. However, the effectiveness of aerosol delivery and influential factors remain largely unreported.
Methods:
A collecting filter was placed between an adult manikin with representative upper airway and a breath simulator, set to represent quiet and distressed patterns of adult spontaneous breathing. The CHFO device (Metaneb, Hill Rom) was attached to the manikin via a mask. Two jet nebulizers (JN) were tested with placement in the manifold and between manifold and mask. A vibrating mesh nebulizer (VMN, Aerogen) was placed between the manifold and mask with and without extension tubing. Aerosol administration was compared during CHFO and nebulization mode alone. Albuterol (2.5mg in 3mL) was nebulized for each condition (n = 3). Drug was eluted from the filter and assayed with UV spectrophotometry (276 nm).
Results:
During CHFO, inhaled dose with JN were low (∼2%), regardless of nebulizer placement. Inhaled dose was improved with VMN placed between manifold and mask (12.48 ± 2.24 vs 2.58 ± 0.48 %, P = .004). Inhaled dose of JN in manifold with nebulization mode alone was lower than JN with aerosol mask (4.03 ± 1.82 vs 10.39 ± 2.79 %, P = .004). Inhaled dose was greater with distressed breathing than quiet breathing. VMN (P < .001) and distressed breathing (P = .001) were identified as predictors of increased inhaled dose.
Conclusions:
Inhaled dose with JN via Metaneb was lower than JN alone. Placement of VMN at airway and distressed breathing increased inhaled dose.
Inhaled dose in quiet and distressed breathing with different nebulizer and its placement
Continuous high-frequency oscillation (CHFO) of the airway has been reported to improve secretion clearance and lung expansion. The device also provides continuous aerosol using a jet nebulizer (JN). Concomitant aerosol therapy during CHFO is appealing during invasive ventilation. However, evidence on the efficiency of aerosol delivery is rare. We investigated the aerosol delivery efficiency with Metaneb during invasive ventilation in both adult and pediatric settings, and explored methods to improve efficiency.
Methods:
A model lung (TTL, Michigan Instruments) was connected to an ICU ventilator (PB840, Medtronic) via endotracheal tubes (ETT) of 8.0mm, 6.0mm, and 5.0mm respectively to simulate adult (COPD and healthy), and pediatric (5 and 10 y old) patients. Tidal volume was set at 6 mL/kg for all scenarios and frequencies were 16 breaths/min, except the 5 y-old patient (20 breaths/min). A collecting filter was placed between ETT and the model lung. Metaneb was set at high frequency oscillation with low flow. A vibrating mesh nebulizer (VMN, Aerogen) was placed at the inlet of humidifier vs between ETT and Y-piece. Albuterol (2.5mg in 3mL) was nebulized for each condition (n = 3). Drug was eluted from the filter and assayed with UV spectrophotometry (276 nm).
Results:
With CHFO during invasive ventilation, inhaled dose with JN at its manifold position was low in both adult (1.52 ± 0.44 %) and pediatric (0.86 ± 0.05 %) patients; substituting VMN for JN increased inhaled dose: VMN placed at the inlet of humidifier vs between ETT and Y-piece in adult (13.35 ± 1.01 vs 7.17 ± 0.23%, P = .004) and pediatric patients (7.79 ± 2.46 vs 4.21 ± 0.70 %, P = .004). Regardless of VMN placement, inhaled dose with CHFO was lower than inhaled dose with VMN without CHFO [22.66 (19.54, 25.44) vs 7.19 (5.11, 11.61) %, P < .001].
Conclusions:
Using Metaneb per label to deliver aerosolized medication during invasive ventilation was inefficient for both adult and pediatric patients. Vibrating mesh nebulizer during CHFO improved inhaled dose, but still lower than standard practice without CHFO.
Inhaled dose of VMN vs JN in different placement for adult and pediatric scenarios
Nebulizer
Placement
CHFO
Inhaled dose (%)
COPD
Healthy Adult
10 years old (30 Kg)
5 years old (20 Kg)
VMN
The inlet of humidifier
Off
25.53 ± 0.53
24.75 ± 1.19
21.14 ± 0.71
18.63 ± 0.47
On
7.04 ± 0.20
7.30 ± 0.20
4.84 ± 0.22
3.58 ± 0.10
VMN
Between ETT and Y-piece
On
14.04 ± 0.47
12.65 ± 0.93
10.02 ± 0.26
5.56 ± 0.44
JN (Salter lab)
Metaneb manifold
On
1.80 ± 0.21
1.24 ± 0.46
0.84 ± 0.06
0.87 ± 0.05
JN (Carefusion)
1.49 ± 0.20
1.65 ± 0.30
NA
NA
CHFO, continuous high frequency oscillation; VMN, vibrating mesh nebulizer; JN, jet nebulizer; ETT, endotracheal tube; NA, not available.
Meeting report
Restricted accessMeeting reportFirst published October, 2019pp. 3229948-3229948
To assess the benefits of telehealth (TH) on decreasing exacerbations and emergency room visits with COPD, it is important to explore the Behaviour Change Techniques (BCTs) associated with TH interventions. BCTs are important strategies which could help to generate and implement effective TH interventions with COPD. This study describes the most common BCTs demonstrated to COPD invited to TH.
Methods:
Included studies were randomized controlled trials (RCTs) and observational single arm pre-post trials that evaluated TH with COPD. A systematic search was performed from the earliest records to May 2019 in CINAHL, MEDLINE (Ovid), Cochrane library, and Embase databases. The Preferred Reporting Items for Systematic review and Meta-Analysis (PRISMA) guidelines was used to guide the selection process. Two independent reviewers retrieved titles, abstracts, full texts, and completed data extractions. BCTs were extracted from the description of TH found in the included studies. To categorize and summarize BCTs, we used the taxonomy of Abraham and Michie that published in 2008. This taxonomy details 26 BCTs that can be combined in interventions, ranging from the simple provision of information on consequences of one’s behavior to more complex techniques.
Results:
Among 1480 abstracts identified, 93 articles underwent full-text review, and 33 were eligible and included. Twenty-seven were RCTs, and six were pre-post studies. Overall, 16 of BCTs were used within our included studies, out of the 26 possibilities of Abraham and Michie’s taxonomy. The most commonly used technique was to provide information about the consequences. It has been reported in 30/33 studies. The lowest frequent BCTs was prompt barrier identification. It was used only in 6/33 studies. All included articles used four or more BCTs combinations. 27/33 of the studies have the combinations between four BCTs which are provide information about behavior, provide information about consequences, prompt self-monitoring, and provide feedback. All BCTs delivered using video calls, online education martials, online activities and healthcare professional supports.
Conclusions:
TH intervention with COPD used a combination of BCTs. BCTs are essential features of TH interventions with COPD. The current review suggests optimizing the design of TH studies by considering BCTs. The next step will be to evaluate if using more BCTs in TH intervention with COPD will increase the positive impact of TH interventions.
Meeting report
Restricted accessMeeting reportFirst published October, 2019pp. 3229987-3229987
For years there has been a belief that the Percussionaire Turbohub delivers rebreathed CO2 to patients. Primary Children’s Hospital uses the VDR with Turbohub in our NICU and PICU, so we wondered just how much CO2 was being rebreathed and if there was a way to eliminate it.
Methods:
The Percussionaire VDR with Turbohub was set up with an F&P Evaqua 2 infant ventilator circuit and attached to a 0.59 cc/cm H2O compliant ridged test lung. CO2 analyzers from the Drager Evita XL were attached at the test lung to read exhaled CO2, and at the inspiratory side of the Turbohub to measure the amount of CO2 being rebreathed. CO2 was injected into the test lung via blended air/CO2 mixture at 0.3 L/min to achieve an ETCO2 of approximately 35 torr. O2 tubing for external flow was attached to the inspiratory relief valve on the Turbohub and to a flow meter. External flows up to 6 L/min were used during testing. The VDR was set at a working pressure of 40 psi, 1 second convective rate I time and high frequency I:E ratio at 1:1. Various peak pressures, peeps as well as some different convective rates and percussive rates were used to see how much CO2 was rebreathed at each setting and if it changed using different settings. CO2 measurements were obtained after settings had 5 minutes to stabilize. External flow ranging from 1 to 6 L/min was added at each setting after initial measurements were taken, and CO2 was measured again.
Results:
Thru all ranges of settings rebreathed CO2 was 3 to 6t orr without added external flow. Upon adding external flow to the Turbohub the CO2 gradually decreased until it reached 0 at 6 L/min of flow in all test settings.
Conclusions:
According to the data collected, it appears that patients do in fact rebreathe CO2 on the VDR with Turbohub. Adding 6 L/min of flow to the inspiratory side of the Turbohub would likely be beneficial to eliminating CO2. We also found that adding the additional flow required us to decrease the pulsatile flow and oscillatory CPAP/PEEP to maintain the PIP and PEEP test setting. Further testing may be indicated to change clinical practice.
Meeting report
Restricted accessMeeting reportFirst published October, 2019pp. 3230194-3230194
The basis for the knowledge of a patient’s condition begins with verbal handover from another respiratory therapist (RT). This handover includes vital information that plays an integral role in patient safety and outcomes. Despite including the Situation-Background:-Assessment-Recommendation (SBAR) communication technique in courses and classroom labs, often students lack confidence and struggle to give thorough handovers. High-fidelity simulations have been found to be an effective technique in training health care providers in targeted skills. Reflective practice is also recognized as core to professionalism and skill development. The purpose of this study was to develop and analyze the effectiveness of a high-fidelity simulation experience with self-reflection on SBAR handover skill development.
Methods:
Eighteen first-year RT students participated in this IRB approved pilot study. The simulation experience was an endotracheal intubation scenario in the operating room where students gathered clinical information throughout the experience. SBAR handover was video recorded and both an expert (faculty) and students used a rubric to rate SBAR and communication effectiveness post-simulation and post-skill check-off. An online survey instrument also measured pre and post-simulation self-efficacy and student satisfaction. Data analysis included descriptive statistics and paired t-tests.
Results:
Expert ratings showed a statistically significant improvement in all SBAR categories, along with communication and mean total handover score (P <.001) from post-simulation to post-checkoff. Students’ self-ratings also demonstrated a statistically significant increase in the “Situation” (P = .048), “Recommendations” (P = .009) categories, as well as communication ratings (P = .02), and mean overall score (P = .005). Self-efficacy for identifying landmarks for intubation improved and students rated the simulation environment to be more realistic than the low-fidelity lab.
Conclusions:
Participation in a simulation-based experience with self-reflection requirements gives students the opportunity to enhance SBAR communication skills before entering the clinical environment. Significant improvements were made in handover skills including student self-efficacy. The simulation structure developed in this study could be adopted to enhance interpersonal communication competence in RT students.
Meeting report
Restricted accessMeeting reportFirst published October, 2019pp. 3230206-3230206
Carolyn La Vita, Beverly Ejiofor, Esther Chung , [...]
View All
Abstract
Background:
New generation ICU ventilators frequently enter the market. To determine the performance of these ventilators they need to be compared to established ICU ventilators. In this study we compared the gas delivery capabilities of the new Nihon Kohden 550 ventilator (NKV 550) to that of the Medtronic PB980 and the Drager V500 ventilators. We hypothesized that if these ventilators were optimally set in pressure support ventilation there would be no differences in trigger response, pressurization time and volume delivery.
Methods:
Evaluations were performed with the IngMar ASL 5000 computerized lung simulator using a dry circuit and the Fisher & Paykel RT380 adult ventilator circuit. The ASL 5000 was set to simulate normal, COPD and ARDS lung mechanics with two ventilatory drives 1.7 and 6.7 cm H2O and inspiratory times varying from 500 to 900 milliseconds, ms. Ventilator trigger sensitivity, rise time and termination criteria were optimally set. Each ventilator was set to deliver 5/5, 10/5 and 15/10 cm H2O pressure support above PEEP. A total of 18 trials were conducted on each ventilator. Each trial lasted 2 min. The last 10 breath of each trial were analyzed. Trigger time (TT, ms), max pressure to trigger (MaxTrigP, cm H2O), time to max trigger pressure (T-Tpress, ms), trigger pressure time product (PTP, cm H2O -ms) time to 90% of peak pressure (T90, ms), and tidal volume (VT, mL) were compared among ventilators using ANOVA for repeated measures. Potentially important clinical differences were defined as a P < .001 and >10% difference among ventilators.
Results:
Potentially clinically important differences were identified among all variables except tidal volume(see table). Variables differed among ventilators with a P < .001 and >10% difference except for tidal volume. These differences were a result of increased time to trigger during COPD lung mechanics and a low ventilatory drive. Both independently increased time to trigger (data not shown).
Conclusions:
There are clinically important difference in the performance of the NKV 500, PB 980 and V500 ventilators during adult pressure support ventilation. Disclosures: Robert Kacmarek is a consultant for Medtronic’s and Orange Medical and has received research grants from Medtronic’s and Venner Medical. All other authors report no conflict of interest
TT(ms)
MaxTrigP(cmH20)
T-Tpress(ms)
PTP(cmH20-ms)
T90(ms)
Vt(ml)
NKV500
76.9±20.7
-0.68±0.39
65.5±20.6
27.2±19.8
102.8±49.8
558.6±285.3
PB980
119.9±35.7
-1.11±0.56
93.2±34.0
71.2±45.0
195.3±43.5
564.7±311.4
V500
123.7±66.1
-1.60±0.80
96.8±32.6
87.2±59.8
172.0±95.2
489.8±226.7
P value
<0.001
<0.001
<0.001
<0.001
<0.001
<0.001
% difference
61%
135%
48%
221%
67%
15%
Clinically Important Difference
YES
YES
YES
YES
YES
NO
Values in the NKV500, PB 980 and V500 rows are mean ± SD of the variable above it.
Meeting report
Restricted accessMeeting reportFirst published October, 2019pp. 3230250-3230250
Carolyn La Vita, Beverly Ejiofor, Esther Chung , [...]
View All
Abstract
Background:
Essentially all new generation adult ICU ventilators are designed to provide ventilation of neonates to adults. Nihon Kohden recently introduced a new ventilator to the market the NKV 500. To determine the performance of this ventilator during neonatal pressure support it needs to be compared to established ICU ventilators. In this study we compared the gas delivery capabilities of the new Nihon Kohden 550 ventilator (NKV 550) to that of the Medtronic PB980 and the Drager V500 ventilators. We hypothesized that if these ventilators were optimally set in pressure support ventilation there would be no differences in trigger response, pressurization time and volume delivery.
Methods:
Evaluations were performed with the IngMar ASL 5000 computerized lung simulator using a dry circuit and the Fisher & Paykel RT260 neonatal ventilator circuit. The ASL 5000 was set to simulate neonatal lung mechanics with a weak, normal and strong ventilatory drive (P0.1 1, 4.2 and 7.3 cm H2O) and inspiratory time varying from 250 to 400 milliseconds (ms). Evaluations were performed without a leak and with a leak (1 to 1.5 L/min). Ventilator trigger sensitivity, rise time and termination criteria were optimally set. Each ventilator was set to deliver 5/5, 10/5 and 15/10 cm H2O pressure support above PEEP. A total of 18 trials were conducted on each ventilator. Each trial lasted 2 min. The last 10 breath of each trial were analyzed. Trigger time (TT, ms), max pressure to trigger (MaxTrigP, cm H2O), time to max trigger pressure (T-Tpress, ms), trigger pressure time product (PTP, cm H2O -ms), time to 90% of peak pressure (T90, ms), and tidal volume (VT, mL) were compared among ventilators using ANOVA for repeated measures. Potentially important clinical differences were defined as a P < .001 and >10% difference among ventilators.
Results:
The only potentially clinically important difference identified among variables evaluated was maximum trigger pressure(see table). Even this difference, although it met our criteria (P < .001 and >10%), is small (-0.23 vs -0.28 cm H2O across ventilators) and unlikely clinically important.
Conclusions:
The NKV500, PB980 and V500 all performed similarly during this evaluation. The only potentially important difference was maximum trigger pressure. Disclosures: Robert Kacmarek is a consultant for Medtronic’s and Orange Medical and has received research grants from Medtronic’s and Venner Medical. All other authors report no conflict of interest
TT(ms)
MaxTrigP(cmH20)
T-Tpress(ms)
PTP(cmH20-ms)
T90(ms)
Vt(ml)
NKV500
99.2±43.4
-0.23±0.11
84.4±38.1
8.97±3.4
112.2±17.0
23.2±7.7
PB980
95.3±29.7
-0.26±0.15
77.4±27.7
10.6±6.8
114.8±38.4
23.7±7.7
V500
87.9±42.8
-0.28±0.15
75.4±36.7
10.2±4.6
106.2±29.0
23.0±7.8
P value
0.021
<0.001
0.036
0.006
0.019
0.36
% difference
13%
22%
12%
18%
8%
3%
Clincally Important Difference
NO
YES
NO
NO
NO
NO
Values in the NKV500, PB 980 and V500 rows are mean ± SD of the variable above it.
Meeting report
Restricted accessMeeting reportFirst published October, 2019pp. 3230276-3230276
Nazmin N Shah, Brian M Daniel, Christine Garvey , [...]
View All
Abstract
Background:
Chronic Obstructive Pulmonary Disease (COPD) is one of the leading causes of morbidity and mortality. COPD is included in the Hospital Readmissions Reduction Program (HRRP), a Medicare value-based purchasing program that penalizes hospitals for 30-day readmissions. Implementation of cost effective care methods to prevent readmissions has become a greater challenge for many health care systems. Such challenges include identification of gaps between the inpatient and outpatient care settings; that would allow for continuity in respiratory care and other pulmonary rehabilitation modalities. In fiscal year 2018, the overall 30-day readmission rate for Medicare Fee-For-Service (FFS) patients with COPD was 26.4% with 52% of these readmissions being within 7 days of discharge. Continuity of care between the inpatient and outpatient care areas is imperative to achieving a successful HRRP, while improving quality of life for the patient.
Methods:
We implemented COPD Transitional Care Coordination (TCC) as a strategic model of promoting efficient collaboration between the inpatient and outpatient care settings. For in-patient care, the model includes, a COPD Action Plan and interdisciplinary collaboration to formulate efficient care, with appropriate outpatient referrals (i.e., smoking cessation, pulmonary rehabilitation). For out-patient care we established post-discharge follow up telephone calls, via a health care navigator (HCN), per inpatient respiratory care practitioners (RCPs) assessments and recommendations. The HCN provided continual information sharing between outpatient practitioners to allow for further referrals and collaboration of care; reinforcement of the COPD Action plan and inhaler reconciliation.
Results:
A total of 177 patients were seen for COPD Action Plan as part of our COPD TCC model. Between August 2018 and May 2019, 13% of the COPD TCC patients seen were successfully enrolled with the ambulatory palliative care program for additional layer support, 8% of patients were referred for pulmonary rehabilitation.
Conclusions:
Active collaboration between all patient care areas plays an important role in promoting efficient patient care. Utilization of tools such as a COPD Action Plan allows for better patient engagement, leading to a better patient outcome.
Meeting report
Restricted accessMeeting reportFirst published October, 2019pp. 3230278-3230278
Lauren Cunningham, James Rudegeair, Marilou Magnaye
Abstract
Background:
Pressure injuries from medical devices have become a key quality initiative for patient care. Endotracheal tubes (ETT) are a lifesaving medical device yet the risk of a medical device-related pressure injury (MDRPI) associated with ETTs can be life threatening if not managed appropriately. From July 1, 2017 to June 30, 2018, the Neuroscience Critical Care Unit (NCCU) fell in third place out of all other clinical units for MDRPIs with a leading cause due to ETT-related pressure injuries. An ETT Repositioning Schedule was created to reposition the medical device every two hours. This responsibility is shared between Nursing and Respiratory Therapy (RT) to enhance collaborative practice and increase awareness of skin breakdown.
Methods:
A trial was instituted in the NCCU for three months, July 1, 2018 to September 30, 2018, to evaluate a decrease in MDRPIs specific to ETTs by 50%. Current practice for ETT repositioning is completed by staff nurses every two hours. A laminated Endotracheal Tube Repositioning Schedule was created for both Nursing and RT. RTs reposition the ETT at 0800, 1200, 1600, 2000, 0000 and 0400. Nurses reposition the ETT at 0600, 1000, 1400, 1800, 2200 and 0200. The schedule was hung at the patient’s head of bed as a visual reminder. Education was provided to all nursing and RT staff.
Results:
Data collection occurred from July 1, 2018 to February 28, 2019. The initial three month trial was continued and established in the NCCU. From fiscal year 2018 (FY 2018) to fiscal year 2019 (FY 2019), all medical device-related hospital acquired pressure injuries (HAPI) in the NCCU decreased 10%, from 24 to 13. ETT-related HAPI in the NCCU decreased 50%, 11 to 6. In addition to respiratory device-related HAPI, all categories of medical device related HAPI have decreased in the current FY 2019 as compared to FY 2018.
Conclusions:
The overall goal of the trial was achieved and an unintended benefit resulted in an overall decrease in all categories of MDRPIs. This trial helped to establish a need for collaborative ETT repositioning and visualization of skin in all adult intensive care units in pursing best practice and further reduction in MDRPIs. The success of the intervention was shared throughout the institution and was recently implemented as a standard of care in all adult ICU’s of the hospital. This change has been identified as an opportunity to enhance collaboration between RT and nursing in providing quality care.
Meeting report
Restricted accessMeeting reportFirst published October, 2019pp. 3230323-3230323
Susan B. Blonshine, Ellen A. Becker, Jason Blonshine , [...]
View All
Abstract
Background:
One step for assuring accuracy of pulmonary function laboratory (PFL) equipment is performing a biologic quality control (BioQC). The American Thoracic Society (ATS) and European Respiratory Society’s (ERS) 2017 standard for DLCO BioQC requires weekly performance with a coefficient of variation (CV) of 12% based upon a study using 8 individuals. The aim of this study was to assess the DLCO BioQC %CV results from a large clinical trial.
Methods:
This study received institutional review board approval from Rush University Medical Center, ORA# 19032007. A DLCO BioQC program was developed for an inhaled medication study that spanned over 42 months ending in 2018. Onsite training was provided to 114 PFLs from North America, Europe, and Israel using equipment from five different manufacturers. Results were sent to a central repository for expert review. The annual DLCO %CV was based upon a minimum of 10 DLCO values separated by at least 5 days with no control for diurnal variation. Each BioQC had to be technically satisfactory according to ATS/ERS 2005 DLCO standards without failure of other mechanical quality control tests. Descriptive statistics were computed. Paired t-tests were conducted to compare the rate of %CV changes between years and tested at α = .05 using SPSS.
Results:
Of 217 BioQCs, 168 participants met the inclusion criteria for DLCO BioQC tests the first year of the study with fewer in subsequent years. As indicated in Table 1, over 90% of %CV values were < 8% and the %CV decreased with experience. There was < 1% change in %CV across the 2-year time span.
Conclusions:
The DLCO BioQC %CV standard could be reduced to < 8%. This could improve precision of this important diagnostic test by 33% without impairing the function of PFLs. The PFL BioQC staff do not need to recalculate their %CV more frequently than every two years based upon the low variation of < 1%.
Table 1: DLCO BioQC Coefficient of Variation (CV) Results
Year
%CV Range
%CV Mean (SD)
% of Tests with %CV < 8%
Paired t-Test:Mean (SD)
Year 1n = 168
1.79 – 11.06
5.04 (1.74)
93%
Year 1 and 2:0.68 (1.97),P = .003, n = 83
Year 2n = 89
1.73 – 10.23
4.25 (1.58)
99%
Year 2 and 3:0.27 (2.53),P = .58, n = 28
Year 3n = 28
0.65 – 13.28
4.01 (2.24)
96%
Year 1 and 3:0.82 (2.28),P = .093, n = 24
Meeting report
Restricted accessMeeting reportFirst published October, 2019pp. 3230372-3230372
Kevin P Collins, Christopher Russian, Joellen Coyrell
Abstract
Background:
The American College Health Association reported in 2016 that 8.9% of college students indicated having an asthma diagnosis. When asthmatic students transition to a college campus, they may be ill-equipped to self-manage their asthma due to a lack of proper education, misinformation from their physician, or lack of acceptance of the chronicity of their disease. The research questions are: (1) How do students with asthma learn from their experiences in the self-management of their asthma during their college years? (2) How do these students cope with their asthma on the college campus? Methods: This qualitative case study recruited five college students with partially controlled asthma through the student health center (SHC) of a large public university. Approval for this study was granted from the university’s IRB (#5359). The students were interviewed individually and in a focus group session. Data collected from the interviews underwent coding and analysis to include: (1) initial coding, (2) focused coding, and (3) axial coding. Once codes emerged, they were assembled into themes and the data was subjected to the constant comparative data analysis.
Results:
Qualitative coding and analysis of the data revealed the following themes: (a) students have learned from lived experiences to adapt to weather conditions and campus terrain to avoid asthma triggers, (b) students want to establish an educative, meaningful relationship with healthcare providers at the SHC, (c) students have acquired coping strategies from learned behaviors of living with asthma on campus, and (d) as students transition to an adult role they become more autonomous with healthcare decision-making.
Conclusions:
Based on the findings of this study there is a need for well-written asthma literature that is tailor-made for college students. The need for access to affordable medications is necessary for the overall health and well-being of students with asthma. Study findings reveal there is a need for training of students in the proper use of medication delivery devices and the role of inhaled medications in controlling asthma symptoms. Students prefer a working relationship with healthcare providers at the SHC that utilize a patient-centered approach in the delivery of asthma care. Disclosures: All authors have no conflicts of interest or industry relationships to disclose. This research project was partially funded by a doctoral stipend through Texas State University.
Meeting report
Restricted accessMeeting reportFirst published October, 2019pp. 3230682-3230682
Students entering different Health and Human Service majors (HHSM) have been on a steady decline. This issue can be related to whether or not high school students are being given up to date information regarding HHSM. If counselors do not have a full understanding of all HHSM, high school students may not have the ability to make career/major choices in these areas. In this study, we will attempt to explore the perceptions and needs of high school guidance counselors related to HHSM. The hypothesis of this study is that fifty percent of high school guidance counselors lack knowledge and feel uncomfortable providing students with information about HHSM.
Methods:
The Institutional Review Board of Youngstown State University (YSU) approved this study. A survey instrument was developed to evaluate high school guidance counselor's perceptions and needs regarding HHSM. The survey was sent to the regions surrounding YSU.
Results:
Of the 88 local high school guidance counselors that were emailed the survey, 29 responded (32.9%). When asked if they felt as if they see a need to improve their resources and understanding of HHSM, 22 of the 29 (75.9%) said yes. Of the HHSM that are offered at YSU, the top 3 that counselors felt most knowledgeable about, (strong and very strong ratings), were nursing, 25 (86.21%), physical therapy, 24 (82.76%), and social work, 23 (79.31%). The counselors were also asked to rate their level of comfort in discussing each HHSM that are offered at YSU. The top 3 majors that counselors felt more, and very comfortable discussing, were nursing, 21 (72.41%), social work, 20 (68.97%), and physical therapy, 20 (68.97%). When asked what methods they prefer in gaining information to the HHSM, web based format and written handouts were the preferred methods. They were then asked what methods in educating their students about HHSM would best suit their needs, campus program visit and web based format were the preferred methods.
Conclusions:
The hypothesis for this study is rejected. However the results of the survey showed that 75.9% of the high school guidance counselors felt as though they needed to improve their resources and understandings of HHSM. A limitation to this study is the sample size and that it only pertains to the regions surrounding YSU. Further research could investigate high school guidance counselors nationally.
Meeting report
Restricted accessMeeting reportFirst published October, 2019pp. 3230719-3230719
Joseph L Di Peppe, Daniel D Rowley, Thomas P Malinowski , [...]
View All
Abstract
Background:
Patients with acute rib fractures have significantly higher rates of pulmonary related complications and increased ICU readmissions from acute care units. A Respiratory Therapy Assess and Treat protocol (RTAT) was developed to assess and manage respiratory care interventions based off a scored patient assessment algorithm. We sought to determine if an RTAT Protocol impacted outcomes when compared to a physician directed approach. Null hypothesis: Among adult subjects with > 3 rib fractures, there is no association in pulmonary related ICU readmissions when comparing a RTAT Protocol Group to a Physician-ordered Respiratory Care Treatment Group (Physician Group).
Methods:
This was an IRB approved single-center retrospective and prospective analysis. Data from 626 subjects was evaluated. The Physician Group (n = 254) was evaluated from January 2016-December 2016. RTAT Protocol Group (n = 372) was evaluated from June 2017-December 2018. The primary outcome was pulmonary related ICU readmissions between Groups. Secondary outcomes were age, presence of lung disease, prevalence of polytrauma, hospital length of stay and number of rib fractures. Descriptive characteristics are reported as median (IQR) and frequency count (%). Chi-square of independence and Mann-Whitney U tests were applied as appropriate. Alpha (2-tailed) < 0.05. Factors independently associated with pulmonary related ICU readmissions were assessed by multivariate logistic regression modeling.
Results:
There was no difference in pulmonary related ICU readmissions when comparing the RTAT Group (1.9% [n = 7/372]) to the Physician Group (3.1% [n = 8/254]); P = 0.31. Multivariate logistic regression modeling revealed the following variables were independent predictors of respiratory related ICU readmission: Presence of lung disease (OR 5.3 [1.7-16.4], P <0.01) and Group assignment (OR 0.31 [0.09-0.96], P = 0.04). There was a difference in age (P = 0.02), Presence of lung disease (P < .01), polytrauma (P = .01) and number of rib fractures (P < .01) in the RTAT managed Group (Table).
Conclusions:
There was no difference in the relationship between pulmonary related ICU readmissions when comparing a RTAT Protocol to physician ordered therapy. The RTAT Group had greater age, higher prevalence of lung disease, polytrauma and number of rib fractures compared to the Physician Group. In a predictive model, the RTAT Group was found to have less likelihood of a pulmonary related ICU readmission.
Meeting report
Restricted accessMeeting reportFirst published October, 2019pp. 3230726-3230726
Ralph David Zimmerman, Michelle Mavreles Ogrodnick, Iris Mavreles Feinberg , [...]
View All
Abstract
Background:
A patient’s ability to follow recommendations and manage their medical condition is related to the respiratory therapists’ (RTs) communication skills. Teach-Back is a health-literate communication technique that allows RTs to confirm patient understanding, and enhances patient-centered care by improving RT communication skills.
Methods:
After obtaining IRB approval, first-year undergraduate RT students’ completed a Health Literacy Knowledge and Belief Survey Pre (n = 20) and Post (n = 18) intervention. Students attended a one-hour Health Literacy and Teach-Back skills training intervention. Simulated patients assessed RT students for teach-back use during a regularly scheduled simulation center experience. RT students’ perceptions were documented in a semi-structured interview immediately after the simulation center experience.
Results:
Facilitators to Use of Teach-Back 1. Confirm patient understanding “… [I] wanted to make sure they understood the reason behind it [the medication] since I’m not going to be supervising them all the time when they are doing it.” 2. Confirm proper use of medical devices “[I] wanted to make sure the patient knew how to properly use the device before I gave it to him. To make sure there weren’t any mishaps pretty much.” Barriers to Use of Teach-Back 1. Discharge scenario used in the simulation I had a mental health patient scenario and I didn’t get that far. It was hard to bring up and incorporate many things because of the scenario.” 2. Forgot/Nervous The patient was paraplegic so I was thinking about other things I was overwhelmed by the setting and forgot about it.” 3. Engagement level of the patient “She [the patient] didn’t really ask anything. While I was observing her it seemed like she was doing it right.” 4. Individual communication style “I’m not the type of person [to use Teach-Back]. I want to use it, but because I don’t have much communication with other people- so I didn’t use it.” Conclusions: Results indicate that RT students benefited from a one-hour Health Literacy and Teach-Back skills training. There was a moderate effect size for both Knowledge (d = 0.539) and Beliefs (r = 0.489) which indicates they are both clinically and statistically significant. Findings show that adding health literacy skills training into the RT curriculum improved RT students understanding and use of patient-centered communication skills when working with simulated patients.
Meeting report
Restricted accessMeeting reportFirst published October, 2019pp. 3230745-3230745
Respiratory care students spend hundreds of hours in clinical practica. University faculty orients and prepares the students for these essential learning experiences; however they typically are not the primary instructor in the clinical setting. The RT employee who precepts/mentors/takes the student assumes the primary role of teaching in the clinical setting. Discovering perceptions of students regarding learning experiences in the clinical setting will assist RT preceptors and faculty to develop favorable clinical teaching practices that enhance student learning.
Methods:
With IRB approval, students enrolled in respiratory care programs in the Greater Cincinnati-Northern Kentucky area were invited to participate in a survey describing their perceptions of clinical practicum experiences. The survey (used with permission) consisted of 10 open-ended questions and had been used previously (Dunlevy and Wolf, 1994; Wolf and Dunlevy, 1996). Survey was distributed in the spring 2019 semester. Qualitative responses were categorized by themes.
Results:
89 students were invited to participate; response was 30%. The vast majority of participants identified the most rewarding experiences occurred when they had opportunities to do hands on care. The most frustrating experiences were when they were not allowed to do anything or when it was obvious the RT preceptor did not want to have the students with them. Characteristics of preceptors who were most helpful to their learning were those who asked questions, were kind, nice, respectful, and friendly. Characteristics of preceptors that hindered the students’ learning included a bad attitude, complaining, rude and lazy. Students felt their opinion was valued when the RT preceptor asked questions and invited their input. Advice students would give a new preceptor included: letting them fumble, do hands on care, and ask questions. The most fun ways to learn in the clinical setting was by doing hands on care. The most boring learning activity was downtime. Results were very similar to previous surveys in the literature.
Conclusions:
Students shared that they learn the most in the clinical setting when they are with RTs who allow them to ‘DO’, asked them questions, and had an overall positive attitude.
Table 1. Perceptions of Clinical Practicum Experiences (used with permission, Dunlevy and Wolf, 1994)
1. Describe a rewarding/exciting incident.
2. Describe a frustrating or disappointing incident; time when you felt discouraged as a learner.
3. List the characteristics of helpful preceptors
4. List preceptor behaviors that hindered learning
5. Situations in which students thought their opinion was valued.
6. Advice to a new preceptor.
7. Situations when you felt humiliated
8. Most important item student learned about themselves
9. Fun ways to learn in supervised clinical setting
10. Most boring activities in supervised clinical setting
Meeting report
Restricted accessMeeting reportFirst published October, 2019pp. 3230782-3230782
Developing a useful and effective survey tool can be difficult. Developing a valid survey tool that can be utilized without geographical bias can present even more challenges. Can the Delphi Process of anonymous group consensus be utilized to develop a survey tool that does not possess geographical bias? Methods: IRB approval was granted before any research began. The Delphi Process can be utilized to allow all participants equal voice in the creation process. The members of the Delphi panel should consist of experts in the field for which the Delphi was convened. Through anonymous feedback the end product or tool of the Delphi process is considered to possess validity and reliability. A survey tool was developed and then distributed to the stakeholders. The stakeholders then provided feedback and face validity was obtained. An invitation was then sent to the state representative of the National Association of School Nurses (NASN) inquiring if they would agree to participate in a survey validation process. The NASN was chosen as they were considered the experts on the topics of this survey. In addition, efforts were made to have equal representation from all sections of United States. The participants were asked to evaluate each question on question clarity, comprehensiveness, and ease of answering. A Likert scale of 0 to 3 was utilized to rate the approval rating of the question as well as a comment box for feed back. As a question received 75% approval, it was then removed from the evaluation process and considered approved by the committee.
Results:
Over the course of 4 rounds, all questions received approval. Questions were modified based upon feedback of the Delphi Panel and then resubmitted for approval. The resultant survey received approval by the Delphi members and was considered to possess reliability and validity.
Conclusions:
As a result of this study, a research tool can be utilized to create a tool that does not possess geographical bias. This process was used to develop and validate a survey. This same process could also be utilized to develop other tools and/or processes. Disclosures: None.
Meeting report
Restricted accessMeeting reportFirst published October, 2019pp. 3230849-3230849
End of life care is difficult for all medical professionals, causing struggles with grief during and after the death. Caregivers with higher mastery of care situations have more positive responses to providing care because they perceive themselves as able to meet care demands which can reduce caregiver distress and increase their coping strategies. Very few respiratory therapists (RTs) perceive they are prepared to assist the dying process. These same RTs have to remove life support or stop life sustaining therapy. Objective: To determine if a one hour course on end of life education to RT staff was effective in increasing staff perception of; their knowledge of end of life practices, value to their care of end of life patients, comfort with providing end of life care, and knowledge of long and short term ways to deal with their own grief.
Methods:
A convenience sample of 130 pediatric RTs were provided a one hour end of life education course on the technical and emotional/spiritual aspects of end of life care which served as the intervention for this study. After the education a voluntary online survey was used to collect data. Participants were asked four questions, but each question was optional. Statistical analysis included percent change.
Results:
Voluntary online participants (N = 63), 68.3% (n = 41) strongly agreed their knowledge of end of life care increased after this course, 26.7% (n = 16)) agreed, 5% (n = 3) disagreed, and 0% (n = 0) strongly disagreed. 67.7% (n = 42) strongly agreed that this course would add value to their care of end of life patients, 30.7% (n = 19) agreed, 1.6% (n = 1) disagreed, and 0% (n = 0) strongly disagreed. 66.6% (n = 42) strongly agreed that this course made them more comfortable with providing end of life care, 27% (n = 17) agreed, 6.4% (n = 4) disagreed, and 0% (n = 0) strongly disagreed. 65.1% (n = 41) strongly agreed that this course increased their knowledge of long- and short-term ways to deal with grief, 31.7% (n = 20) agreed, 3.2% (n = 2) disagreed, and 0% (n = 0) strongly disagreed.
Conclusions:
RTs perceived an increase in: knowledge of end of life practices, the feeling of value added to the care of end of life patients, increased comfort with providing end of life care, and increased knowledge of long and short term ways to deal with their own grief after the course. End of life care should be included as part of continuing education for RTs. Disclosures: None
Meeting report
Restricted accessMeeting reportFirst published October, 2019pp. 3230876-3230876
Jennifer Julia Krzyzewski, Catherine Keelin, Michele DeMiceli , [...]
View All
Abstract
Background:
Preterm neonates (gestational age< 32 weeks) often need respiratory assistance in the delivery room (DR) and during transport to the Neonatal Intensive Care Unit (NICU). As part of a quality improvement (QI) project evaluating initial interventions for preterm infants, it was identified that the time to establish respiratory support upon arrival to the NICU was a barrier to completing the required care within the first hour of life. The DR team was challenged to improve team workflow and develop an apparatus that allowed for resuscitation and initiation of invasive or nasal noninvasive (NIV) respiratory support in the DR, thus decreasing time spent initiating such support in the NICU. Given that respiratory support is always placed prior to umbilical line (UL) placement, the start time of UL placement was used as a measure of completion of respiratory support establishment in the NICU. Goal: To decrease the time from NICU arrival to start of UL placement by 20% over a period of 5 months.
Methods:
QI data collected for preterm deliveries was examined at two points: 1.) Time in minutes from birth to arrival in the NICU 2.) Time in minutes from arrival in the NICU to start of UL placement. Plan-do-study-act (PDSA) cycles included: #1 Role clarification and work flow improvement for DR team. #2 Application of skin barrier for nasal NIV in DR prior to transport to NICU. #3 Development of a mobile stand outfitted with a t-piece resuscitator, oxygen blender, transport ventilator, intubation and NIV supply bags, and cylinder holders for air and oxygen tanks. #4 Education and simulation for DR team prior to roll out. #5 Implementation of mobile system and ongoing feedback collected to improve device performance.
Results:
Base line data collected over 3 months showed the average time from NICU arrival to UL placement was 20 minutes (n = 12). After all PDSA cycles, this time decreased to 7 minutes (n = 13), a 65% reduction over a 5-month period. (Figure 1). As a balancing measure, data showed the average time from birth to NICU arrival was 24 minutes (baseline) and 23 minutes (post-intervention).
Conclusions:
Improvements in team workflow and implementation of a standalone mobile respiratory support unit demonstrated success in improving key time measurements in the first hour of life for preterm infants without increasing time spent in the delivery room or delaying arrival to the NICU.
Meeting report
Restricted accessMeeting reportFirst published October, 2019pp. 3231053-3231053
An advance in medical technology and increase of old patients with chronic respiratory failure are increasing the prevalence on noninvasive ventilation. This study was done to evaluate the clinic characteristics, outcomes, and prognostic factors of adult patients requiring noninvasive ventilation in a regional hospital.
Methods:
Retrospective chart review was performed on ICU adult patients, who received noninvasive ventilation at Taiwan middle medical center hospital with approximately 200 beds from April, 2017 to March, 2018. We analyzed the characteristics between the weaning success and the weaning failure group. Data were expressed as the number or median. This study was approved by the ethic committee of Canghua Christian Hospital.
Results:
The median age of patients was 60.91 years and 67% were male. The cause of noninvasive ventilation were acute respiratory failure 59.4%, acute exacerbation of chronic respiratory failure 20.6%, and neuromuscular disease 7.3%. Mortality was 10.3% and the patients requiring home BiPAP at discharge were 5.7%. The overall weaning rate from noninvasive ventilation was 73.8% . The weaning success group had a higher heart failure 48.5% and a lower total duration of noninvasive ventilation, median 7.8 days vs 3.2 days, compare to weaning failure group. Total duration on noninvasive ventilation above 5 days, chronic lung disease,and heart failure were independently associated with successful noninvasive ventilation weaning.
Conclusions:
Chronic lung disease, heart failure and duration of noninvasive ventilation appeared to be significantly associated with successful weaning from noninvasive ventilation.
Meeting report
Restricted accessMeeting reportFirst published October, 2019pp. 3231072-3231072
Britany Lendrum, Angela Murphy, Edward Shepherd , [...]
View All
Abstract
Background:
The Comprehensive Center for Bronchopulmonary Dysplasia (CCBPD) at Nationwide Children’s Hospital is a referral center for term and post-term patients with severe BPD. The CCBPD strongly promotes family centered care. There is very little data regarding the optimal criteria and timing for the decision of a tracheostomy in this patient population. Risks of tracheostomy long-term are poorly understood and followed. An objective scoring tool of important factors were created for infants with severe BPD with need for mechanical ventilation and prolonged positive pressure in 2015.
Methods:
Infants at 44 weeks corrected gestational age and beyond were scored monthly by the interdisciplinary team. Identified 16 clinical triggers based on disease physiology and past clinical decision making developed an objective scoring tool that assigned numerical values within each category. The total score was evaluated by zones: green for low risk, yellow for caution for need for tracheostomy and red reflecting likely need unless progress occurs soon. Infants scoring high in the high yellow zone or low red zone, triggered a care conference with family to discuss the score. We reviewed the percentage of parents with resistance to accept and consent to tracheotomy for 2 years before implementing the scoring tool and for 2 years after, as measured by the number of repeat care conferences. Also, rates and scores of tracheostomies before and after implementation were reviewed.
Results:
Parental resistance to tracheostomy placement decreased from 62% to 10%. Scoring resulted in high reliability separately amongst disciplines and within 2 points. All patients scored higher than 15 on scoring tool and all but 1 scored >20 at time of trach insertion. Tracheostomy rates remained stable before and after scoring tool implementation. 6 patients received a trach out of 13 scored in 2016. 4 patients received a trach out of 11 scored in 2017. 6 patients received a trach out of 15 scored in 2018.
Conclusions:
The tool provides an objective assessment determining the best timing for the decision of tracheostomy placement that provides a standardized approach to help parents understand why a tracheostomy might be recommended. Utilization of this scoring tool has helped decrease variability of decision making, anticipate discussions with family, and follow our outcomes over time for the severe BPD population.
Meeting report
Restricted accessMeeting reportFirst published October, 2019pp. 3231089-3231089
Bronchopulmonary dysplasia (BPD) is the most common complication of prematurity. Despite advances that have significantly improved extremely low birthweight (ELBW) survival, BPD rates have not made any significant improvement within our institution. While several potentially better practices have been proposed to prevent BPD, none of these have individually shown to affect the prevalence of BPD. Bedside staff engagement, revealed significant knowledge deficits, and workflow barriers to meaningful bedside assessment and effective application of supplemental oxygen. A recurring theme in these interviews led to the conclusion that there was a significant gap in understanding of neonatal physiology. Bedside education was needed on neonatal lung development, physiological drivers of BPD, target SpO2 ranges per gestational age, SpO2 alarm limits, and how to read and use histograms on the monitors. It was then decided to start weekly BPD Prevention rounds.
Methods:
The weekly BPD prevention rounds were led by a respiratory therapist and registered nurse. The goals for these rounds were to provide education to the bedside staff about neonatal lung development, physiological drivers of BPD, target SpO2 and alarm limits per gestational age, how to read and use histograms, and proper oxygen utilization. By providing this education the hope was to give the bedside provider the tools to help prevent BPD and ultimately, decrease our BPD rates.
Results:
87.50% of the team agreed that the BPD prevention rounds have been beneficial. 83.33% agreed that the BPD prevention rounds have taught them how to help prevent BPD as a bedside provider. 91.67% agreed the BPD prevention rounds have taught them to utilize histograms. 83.33% agreed the BPD prevention rounds have helped encourage them to use less oxygen.
Conclusions:
The weekly BPD prevention rounds have been instrumental in educating all of our bedside providers on BPD prevention and oxygen utilization in our level IV NICU.
Meeting report
Restricted accessMeeting reportFirst published October, 2019pp. 3231176-3231176
Evidence-based practice (EBP) is considered a major respiratory therapy competency established by the profession and essential to the clinical decision-making process. Currently, there is a limited understanding of what factors influence the use of EBP among respiratory therapists. The purpose of this study was to assess the factors associated with the use of EBP among respiratory therapy faculty teaching in a large community college system and post-professional students enrolled in a university-based, respiratory therapy baccalaureate degree completion program.
Methods:
An online self-administered questionnaire was developed and administered to assess EBP knowledge, self-efficacy, learning experiences, and use in practice. Binary logistic regression was conducted to determine which independent variables were predictors of EBP use in clinical decisions. IRB approval was obtained prior to initiation of this study.
Results:
A total of 25 faculty and 58 post-professional students responded to the survey. Faculty and students demonstrated sufficient knowledge and understanding of introductory concepts of EBP but knowledge of specific components of the EBP process was not as strong. Self-efficacy in knowledge and use of EBP among faculty and students was varied. Faculty and students rated their self-efficacy high in assessing patients’ needs, values and treatment preferences but were less confident using the PICO technique and interpreting common statistical tests. Students viewed their previous EBP learning experiences more favorably compared to faculty. Descriptive statistics for EBP knowledge, self-efficacy, and learning experiences are presented in the table. Faculty and students searched and read the research literature more often compared to critically appraising and using the research literature. Logistic regression analysis indicated no statistcally significant relationship of knowledge, self-efficacy, and learning experiences to the use of EBP, X2 (4, N = 54) = 7.73, P = .10.
Conclusions:
Results of this study suggested faculty and post-professional students in this study were knowledgeable and confident regarding EBP but the frequency of using EBP in clinical decisions was limited. While the EBP knowledge, self-efficacy, and learning experiences had minimal influence on the use of EBP, the results of the study provided the foundation for future research in this area.
Descriptive Statistics for EBP Knowledge, Self-Efficacy, and Learning Experiences
Total Score Possible
Faculty(n = 23)
Students(n = 54)
Content Area
Knowledge
6
4.84 (SD = 1.2)
4.74 (SD = 1.0)
Self-Efficacy in Knowledge
100
76.6 (SD = 18.5)
79.0 (SD = 15.5)
Self-Efficacy in Use
100
73.2 (SD = 15.6)
72.3 (SD = 14.5)
Learning Experiences
5
2.57 (SD = .88)
3.14 (SD = .82)
Meeting report
Restricted accessMeeting reportFirst published October, 2019pp. 3231296-3231296
Lance Pingul Pangilinan, Justin Scott Phillips, Edward Karim Saliba , [...]
View All
Abstract
Background:
The VOCSN (Ventec Life Systems, Bothell, WA) device integrates up to five therapies (ventilation, oxygen concentrator, cough assist, suction, and nebulization) and can operate using two low flow oxygen sources: internal concentrator or bleed-in from an external gas source. We evaluated the oxygen flow requirements using the VOCSN pulse dose internal concentrator (PDIC) vs the VOCSN and Trilogy 100 ventilator (Philips Respironics, Murrysville, PA) using an external oxygen concentrator (EC). We hypothesized the flow necessary to achieve a specified FIO2 would be lower when using the pulse dose internal concentrator.
Methods:
The VOCSN and Trilogy 100 were compared using passive and active circuits connected to a TTL test lung (Michigan Instruments, Grand Rapids, MI). Three simulated lung models using different TTL test lung parameters included: normal – Cst 60 mL/cm H2O and Raw 5 cm H2O/L/s, restrictive – Cst 30 mL/cm H2O and Raw 5 cm H2O/L/s, and obstructive – Cst 60 mL/cm H2O, Raw 20 cm H2O/L/s. Using pressure ventilation, the peak pressure and rise time were titrated to achieve VT of 500mL as measured by a Certifier FA Plus (TSI Inc, Shoreview MN). Additional settings include: 12 breaths/min, PEEP 5 cm H2O, and IT 1.0 second. VOCSN PDIC and a Millennium M10 (Respironics, Murrysville, PA) EC flow were adjusted to achieve a measured FIO2 of approximately 0.40. Flow from the EC was measured by the Certifier FA Plus and FIO2 was measured by the Handi + oxygen analyzer (Maxtec, Salt Lake City, UT) at the inlet of the test lung. At least three measurements were done for each ventilator, circuit type, lung model, and oxygen concentrator combination. Data for the three lung models were averaged for each test configuration and reported as the mean ± SD for each circuit type.
Results:
The oxygen flow in L/min required to maintain a FIO2 of 0.40 (mean ± SD) with passive and active circuits respectively was: VOCSN-PDIC 2.61 ± 0.02 and 2.68 ± 0.12, VOCSN-EC 3.05 ± 0.16 and 5.59 ± 0.36, Trilogy-EC 4.78 ± 0.70 and 8.28 ± 1.31. Measured VT and FIO2 for all lung models, test configurations, and circuit types averaged 502 ± 8 mL and 0.397 ± 0.006 respectively.
Conclusions:
Oxygen flow requirement was lowest with the VOCSN ventilator using pulse dose internal oxygen concentrator with both the passive and active circuits, and with VOCSN using an external oxygen concentrator with the passive circuit compared to the Trilogy 100 ventilator.
Meeting report
Restricted accessMeeting reportFirst published October, 2019pp. 3231560-3231560
Joshua A Good, Marnie Lisa Cerino, Kristen Meachum , [...]
View All
Abstract
Background:
A significant and unexplainable increase in ventilator-associated events (VAE) was noted in the ICU’s of Penn Medicine Lancaster General Hospital. An interdisciplinary team was formed, and LEAN A3 problem solving techniques were used to try and reduce VAEs. Multiple PDCA cycles were used to improve compliance with ventilator bundles. After compliance was verified, it was discovered that many VAEs were potentially avoidable and could be attributed to PEEP and/or FIO2 not being returned to baseline after a hypoxic event had resolved. We hypothesized that daily monitoring of ventilator settings could help to reduce unnecessary Ventilator-Associated Conditions (VAC); therefore, reducing Infection-Related Ventilator-Associated Complications (IVAC) and Possible Ventilator Associated Pneumonia (PVAP) as well.
Methods:
In December 2018, a standardized approach to monitor for VAE was implemented, and used a tool in the EMR that recorded the daily minimum settings for PEEP and FIO2. Frequent, preferably daily, audits of the ventilator settings compared baseline settings to current settings. If patients were at risk for “flagging” as a VAC, discussions of the current ventilator settings and plan of care occurred with the ICU care team at the bedside. Attempts to wean the PEEP and/or FIO2 back to baseline occurred if it was clinically indicated and appropriate for the patient.
Results:
In the 5 months prior to auditing, 23 VAE (14.17 VAE/1000 vent days) were observed. During the five months after auditing implementation, 6 VAE (4.04 VAE/1000 vent days) were observed. Infections (IVAC + PVAP) decreased from 16 (9.86/1000 vent days) without audits to 2 (1.34/1000 vent days) with audits during the same respective time periods. During the experimental period, a significant reduction in overall VAE were noted [P = .001].
Conclusions:
Standardized monitoring of ventilator settings can play a role in reducing overall VAE. Referred to as weaning with a goal, weaning of the PEEP and FIO2 contributed to this reduction due to known preferable/baseline ventilator settings. Patient safety and appropriate treatment must still remain a priority in this process. Lack of knowledge about VAE guidelines was a barrier that was overcome through real-time education at the bedside. Our next step will be to continue this process to determine if these results are sustainable.
Meeting report
Restricted accessMeeting reportFirst published October, 2019pp. 3231613-3231613
It is believed that underlying the current state of health (HRQL) is the lifestyle status of the patient. However, other factors such as spiritual well being and psychological, mental and motivational status may be at least as important as others but understudied. This research describes an attempt to validate a new wellness assessment questionnaire and to identify and investigate the status of several wellness domains in patients with COPD.
Methods:
The study consisted of two phases: first, the development of a new Wellness Questionnaire with the help of focus groups and then the validation and use of the questionnaire in a cohort of COPD patients.
Results:
Thematic analysis of findings from focus groups and original cohort respondents highlighted some factors that appear to influence wellness status. Five domains were explored as potential markers of wellness in patients with COPD, including spirituality. Quantitative analysis with Spearman correlation demonstrated a significant correlation between Physical/Personal Wellness as recorded by the questionnaire and other markers of COPD progression such as GOLD (0.006), kg/m2 % (0.01), health-related quality of life (0.009), multidimensional BOD score and quartile (0.003 and 0.02).
Conclusions:
This study led to the development of a new (Sunderland) Wellness Respiratory Questionnaire (SWRQ) to assess wellness status in patients with COPD and the observation that wellness status may have an influence on disease progression.
Meeting report
Restricted accessMeeting reportFirst published October, 2019pp. 3231620-3231620
More cystic fibrosis (CF) patients are living longer, and lifestyle-related behavior is becoming increasingly important for improving morbidity and mortality. Declining levels of exercise leads to a low cardiorespiratory fitness, which is a strong, independent predictor of mortality in CF. As a result, exercise training has become a regularly accepted form of treatment for CF patients. The purpose of this study was to determine the volume of physical activity (PA) and perception of exercise in adult CF patients.
Methods:
Adult patients from an in-patient CF clinic were recruited to participate. A structured interview and self-report questionnaires were used to collect information on volume (time and intensity level) of PA and exercise perception including preferences, readiness, and barriers.
Results:
Forty-six adult CF patients consented to participate in the interview and completed self-report questionnaires. The majority (76%) of participants self-reported performing PA at a moderate level or above. Mean (+ SD) hours per week of physical activity levels by category were as follows; moderate 11.8 + 12.2 (76.4%), hard 1.8 + 4.6 (17.4%), and very hard 0.4 + 1.6 (6.2 %). Most of the adult CF patients preferred walking and 65% of the participants felt exercise was very important. Lack of energy, good health, self-discipline, and time were noted as the most frequent barriers to exercise. Moderate PA was associated with both physiological and psychological factors.
Conclusions:
Based on this study, adult CF patients self-report performing an adequate amount of moderate PA. However, a small proportion of time is spent at a vigorous PA level. Clinicians providing individualized care during rehabilitation have an opportunity for improving adherence to prescribed exercise that may positively impact both physiological and psychological factors. Further, motivating CF patients to engage in more vigorous PA may provide a stimulus that improves clinical outcomes and potentially survival. Key words: cystic fibrosis; physical activity; exercise; aerobic fitness; exercise barriers; cystic fibrosis survival.
Meeting report
Restricted accessMeeting reportFirst published October, 2019pp. 3231646-3231646
Lindsey Kasten, Laurence Malloch, Patricia A Dailey , [...]
View All
Abstract
Background:
The air entrainment jet nebulizer (AEJN) is a type of jet nebulizer designed to deliver similar aerosol dose in less time and are marketed as a faster delivery device. Although time to deliver a dose may be a consideration in the selection of a device, more important factors include; delivered lung dose and patient clinical response. In vitro bench, imaging and clinical studies comparing jet nebulizer to vibrating mesh nebulizer (VMN) consistently demonstrate superior performance of VMN. We hypothesized that VMN would provide greater % tracheal dose compared to AEJN.
Methods:
Mask-mediated aerosol delivery with VMN (Aerogen Solo with Ultra, Aerogen Ltd., Galway, Ireland) and AEJN (Airlife Misty Fast, Carefusion Inc., Yorba Linda, CA) were compared in adult and pediatric models connected to a sinusoidal pump via a collecting filter at the level of the trachea. The following settings were used to simulate a spontaneously breathing adult (VT 500 mL, 15 breaths/min, I:E ratio 1:1) and pediatric model (VT 300 mL, 20 breaths/min, I:E ratio 1:2. The infant model utilized a blow-by interface held ½ inch from the upper airway of the spontaneously breathing lung model (VT 50 mL, 30 breaths/min, I:E 1:3). The VMN was powered by the Pro-X controller with a driving gas flow of 2L/min from a 30 psi source (Aerogen, Galway, Ireland) and the AEJN powered by 8 L/min gas flow from a 30 psi source. The AEJN was loaded with a (2.5 mg/3 mL) solution of albuterol and aerosolized to sputter plus one minute and the VMN was run until aerosol was no longer produced (n = 4). Drug eluted from the filter was assayed with UV spectrophotometry (276 nm). Descriptive statistics and t-test were used for data analysis using SPSS. P < .05 was considered statistically significant.
Results:
The VMN resulted in significantly higher % tracheal dose compared to AEJN in adult and pediatric models (28.30 ± 0.62, vs 7.20 ± 0.22, P < .001 and 30.75 ± 2.18 vs 6.45 ± 0.59, P < .001, respectively). Percent tracheal dose with the blow by infant model was low with both VMN and JN (1.65 ± 0.79 vs 0.27 ± 0.10, respectively, P = .013). There was significantly less residual weight retained in the reservoir of the VMN (1.3%) compared to AEJN (43.6%) in all models tested, (P < .001).
Conclusions:
The VMN provided significantly greater % tracheal dose in the adult and pediatric models, 4-5-fold higher and significantly lower residual waste retained in the reservoir in all models tested when compared to AEJN.
Meeting report
Restricted accessMeeting reportFirst published October, 2019pp. 3231813-3231813
In 2017, I attended a seminar educating respiratory therapists on how to implement a vascular access program. The workshop introduced me to the benefits of using Point of Care Ultrasound (POCUS) for needle puncture procedures. I returned to my home hospital with aspirations of diving into developing a vascular access team of Respiratory Therapists. Unfortunately, when I brought the idea to my leadership team I was stopped in my tracks with a hard, No." My inherent persistence would not allow me to let go of the concept altogether. Respecting the boundaries set forth by my profession’s scope of practice and my hospital’s policies I conducted a pilot study comparing POCUS-guided arterial punctures with the traditional blind-stick palpation method.
Methods:
Data was collected from 100 adult patients to include 50 POCUS-guided and 50 blind-stick arterial punctures. The POCUS-guided team performed 35 successful POCUS-guided punctures before data collection to gain competency for the procedure. The study group included data from both radial and brachial puncture sites, using both transverse and longitudinal ultrasound views.
Results:
Average time for the blind-stick method in 50 patients was 31.68 minutes versus 12.14 minutes for the POCUS-guided method. For the blind-stick method, 18 of the 50 ABG’s (36%) were resulted in <20 minutes versus 43 of the 50 (88%) for the POCUS-guided method. Average puncture attempts required to successfully obtain a sample using the blind-stick method was 1.36 (35 successful on first attempt, 12 successful on second attempt and 3 successful on third attempt.) With 35 of 50 procedures being successful on first attempt, that gives a 70% first attempt success rate for the blind-stick method. Average puncture attempts required for the POCUS-guided method was 1.01, a first attempt success rate of 96% (48 successful on first attempt, 2 successful on second attempt.) Conclusions: POCUS was recognized as a best practice for deep needle puncture procedures in 2001. The technology is constantly evolving in terms of affordability, portability, miniaturization and ease of use. Drawing blood is the single most frequently performed medical procedure, with roughly 760 inpatient blood draws performed in the United States every minute. POCUS is a billable procedure that improves success rate, decreases complications and enhances the patient experience. POCUS should be considered the standard of practice for all needle puncture procedures including venous and arterial punctures. "
Meeting report
Restricted accessMeeting reportFirst published October, 2019pp. 3231934-3231934
Che-Jung Chang, Han-Shui Hsu, Chien-Ling Su , [...]
View All
Abstract
Background:
Noninvasive ventilation (NIV) and high-flow nasal cannula (HFNC) are extensively applied to prevent extubation failure. The advantages of HFNC include stable oxygen supply and positive end expiratory pressure effect have been demonstrated in patients with heart failure to reduce right heart preload and relieve dyspnea. We aimed to compare the effectiveness of HFNC with NIV for preventing extubation failure in critical ill patients with heart failure.
Methods:
This was a three-year retrospective and single-center study approved by the ethics committee of Taipei Medical University. A total of 104 patients with heart failure (Left ventricular ejection fraction less than 50%) who were treated with prophylactic HFNC and NIV after extubation were included. Patients who refused reintubation were excluded. Clinical data including demographics, comorbidities, echocardiographic data and weaning parameters were collected. The primary outcome was treatment failure within 72 hours. Treatment failure was defined in the HFNC cohort as escalation to NIV or reintubation, and it was defined in the NIV cohort as requiring reintubation. Secondary outcomes were reintubation, intensive care unit (ICU) and hospital lengths of stay (LOS), and hospital mortality. Chi-square, Fisher exact and Mann-Whitney U test were used to compare variables between two cohorts. We performed two multivariate logistic regression analyses including clinical variables associated treatment failure and hospital mortality, with a P value < .2 using univariate analysis.
Results:
Treatment failure within 72 hours was no significant difference between the two cohorts (P = .106). Hypoxemia respiratory failure was significantly lower in NIV (P = .031). Hospital mortality was significantly lower in HFNC cohort (P = .044). No significant differences were found in reintubation, ICU and hospital LOS. The multivariate logistic regression model revealed that NIV as prophylactic treatment and reintubation were independently associated with hospital mortality.
Conclusions:
In patients with heart failure, the effectiveness of prophylactic HFNC in preventing extubation failure is similar to NIV. However, prophylactic HFNC resulted in lower hospital mortality. We suggest that HFNC can be routinely applied after extubation, but selective patients may need NIV. Disclosures: All authors conflict of interest: none. All research funding, sponsorships, provision of equipment, or other financial support: none
Meeting report
Restricted accessMeeting reportFirst published October, 2019pp. 3232134-3232134
Abdullateef Aljuaid, Abdullah Sahari, Abdullah A Gazwani , [...]
View All
Abstract
Background:
Recent advanced ventilation modes (AVMs) of mechanical ventilation are closed-loop modes that have the ability to automatically adjust some respiratory settings. Despite their effectiveness in several clinical trials, it is unclear to what extent these modes are actually used in daily clinical practice. The aim of this study is to define the practice of AVMs in intensive care units (ICUs) in the Eastern Province of Saudi Arabia, and to explore reasons for not applying AVMs.
Methods:
A cross sectional survey was conducted among all adult ICUs in the Eastern Province of Saudi Arabia. ICU respiratory therapists were identified for each ICU and were asked to participate in the survey. We have divided the ICUs into three levels depending on the number of beds. Use of closed-loop modes was classified as frequently, occasionally or never. From (1 to 10) as level 1, (11 to 20) as level 2, and more than 20 as level 3. Institutional Review Board (IRB) approval was obtained.
Results:
A total of 100 ICU respiratory therapists were approached, only 83 including 60 male were completed the survey. Of those 83, 70 were holding bachelor degree, 13 were diploma, and only 40 of 83 have more than 5 years’ experience. The percentage of ICUs that had access to AVMs was 73.5%, which 62.7% were occasionally or never use them. Table 1 shows the frequency of use (frequently or occasionally/never) per ICU levels (1, 2 and 3). The most frequent used modes were neurally-adjusted ventilatory assistance (NAVA) (35.34%), airway pressure release ventilation (APRV) (19.83%), proportional assist ventilation (PAV) (17.25%), while INTELLiVENT-ASV mode was rarely used with only (0.86%). Reported reasons for not using AVMs were lack of knowledge (50.8%), no enough trust in these systems (23.4%), lack of value (20.5%) and no AVMs in the ICUs (5.3%).
Conclusions:
The results showed that AVMs were clinically underused and their value seems to be underestimated in the adult critical care areas. Further investigations are needed to overcome possible barriers that may hinder the utilization of the newer ventilation modes, which would improve patients’ outcome.
The frequency of use (frequently or occasionally/never) per ICU levels
Meeting report
Restricted accessMeeting reportFirst published October, 2019pp. 3232195-3232195
Lung disease compromises breathing, decreases activity and decreases quality of life. The purpose of this study is to investigate innovative strategies used by pulmonary rehabilitation leaders to keep patients motivated and engaged in completing pulmonary rehabilitation, thus increasing quality of life.
Methods:
This study, approved by the International review board, utilizes a descriptive design gathering information through the eyes of pulmonary rehabilitation leaders. To gain a better understanding of the ways that leaders keep patients motivated to complete pulmonary rehabilitation, this researcher administered an questionnaire asking participants the various strategies they use to keep patients motivated in completing pulmonary rehabilitation.
Results:
A summary of the responses from completed surveys shows that constant positive reinforcement, maintaining flexibility, giving individualized attention, placing patients in social networks that work for them, and providing healthy foods helped keep patients engaged. Keeping the environment fun and offering any needed assistance including psychosocial, resolving home care and medication issues also kept patients motivated. Survey participants believed that patient success and motivation could be enhanced through the pulmonary rehabilitation leader. Paying attention to the patient’s needs, helping them resolve problems as well as creating an environment that is positive and supportive helped keep patients motivated. Respondents wrote that PR leader possess the skills and knowledge to engage the patient and learn patient interests. Improvements in QOL, depression, and functioning are a few indicators of patient motivation and success noted by the respondents. Leaders were motivated by seeing the disease process and its effects on both the patient and family as well as by improvements in patient’s overall status.
Conclusions:
Pulmonary rehabilitation has become an important treatment modality prescribed by doctors for those with lung disease that increases quality of life. Information gained from literature of reasons why patients don’t comply as well as responses gained from leaders in PR to enhance patient compliance can be utilized to keep patients motivated. Survey results show listening, support, socialization, comfort, and education all increase QOL for patients and all help increase the likelihood that patients will be motivated to complete pulmonary rehabilitation. Thus, increasing quality of life.
Meeting report
Restricted accessMeeting reportFirst published October, 2019pp. 3232613-3232613
Chin-Jung Liu, Chia-Chen Chu, Pei-Tseng Kung , [...]
View All
Abstract
Background:
Prolonged mechanical Ventilation patient (PMV), who used the ventilator equal or over 21days need caregivers (most are family members) to 24-hour care. Studies have shown that the physical and psychological stress on the caregivers of PMV patients, but no one compares the physical and psychological stress among caregivers of the intensive care unit, respiratory care center (RCC), respiratory care ward (RCW) and home care (HC) patient.
Methods:
We conducted a cross-sectional study from November 2013 to April 2014. We used a structured questionnaire to survey main caregivers on a 5-point Likert scale. The survey was conducted in 64 Cooperative institutions (6 medical centers, 11 regional hospitals, 23 local hospitals, 15 nursing homes, and 9 home care centers) conducted questionnaire surveys and collected 687 questionnaires.
Results:
A total of 601 questionnaires were included (effective rate 87%), including 150 ICU stages, 150 RCC stages, 150 RCW stages, and 151 HC stages. There were no significant differences in caregivers, social, and economic performance among the four groups of respondents. Physical stress, compared with ICU caregivers, RCC is 1.94 times, RCW is 1.22 times, HC is as high as 3.67 times; psychological stress, compared with ICU caregivers, RCC is 1.20 times, HC is as high as 2.39 times Conclusions: The caregivers of PMV patients at Home were under high physical and psychological stress compared to ICU, RCC and RCW. It is recommended that more support to them were needed.
Table 1 the satisfaction (agree and strongly agree) on caregiver of PMV patients compare to ICU, RCC, RCW, and RHC.
Item
ICU
RCC
RCW
HC
physical stress
n/N
73/150
71/150
77/150
104/151
%
48.67
47.33
51.33
68.87
OR
1
1.94
1.20
3.67
psychological stress
n/N
113/150
103/150
103/150
116/151
%
75.33
68.67
68.67
76.82
OR
1
1.20
0.76
2.39
ICU=Intensive Care Unit; RCC=Respiratory Care Center; RCW=Respiratory Care Ward; HC=Home care; OR=odds ratio
Meeting report
Restricted accessMeeting reportFirst published October, 2019pp. 3232630-3232630
The aim of this study was to investigate the predictors of mortality after planned extubation in the nonagenarian pneumonia patients with acute respiratory failure.
Methods:
A retrospective review from medical records was conducted for the nonagenarian patients with acute respiratory failure. All of these patients were under endotracheal tube intubation with mechanical ventilation support in intensive care units (ICUs) of Chi-Mei Medical Center, Taiwan from 1 Jan 2010 to 31 Dec 2017. Patient characters, such as disease severity (APACHE II, and TISS scores), body mass index (BMI), vital signs, laboratory data were collected. Reintubation was defined as intubation again due to acute respiratory failure after the first planned extubation in the hospital. The stay time in hospital and their medical costs were measured also. Statistical analysis of the data was done by SPSS version 18.0. Logistic regression statistical analysis was done. Statistical significance was set at P < .05.
Results:
114 nonagenarian patients over 24 hours MV support were enrolled in this study. The average age of all patients was 92.5 ± 3.0. The hospital survival rate was 71.1% (81 over 114 cases) of these patients. Compared with the hospital survival cohort, high APACHE II (23.5 VS 21.5), high blood urea nitrogen(BUN) level (42.4 VS 31.4 mg/dL) and low hemoglobin (Hb) before extubation (9.3 vs. 10.3 mg/dL) were found in the hospital death patients. Compared with the hospital deaths cohort, higher rate of beginning weaning over 3days after intubation (29.6% VS 60.6%),lower reintubation rate during hospital (13.6% VS 33.3%) and lower prolonged weaning rate (45.7% VS 66.7%) were found in the hospital survival patients. Moreover, prolonged ICU (17.1 VS. 13.2days) with higher costs of medical care (33.8 vs 27.7 thousands in New Taiwan dollars) were also found in this cohort. The higher reintubation rate during hospital, lower Hb (Hb<10.3 mg/dL) and higher rate of beginning weaning over 3days after intubation,revealed the independent risk factors of hospital mortality (P < .05) for the cohort.
Conclusions:
Reintubation was one of the three independent predictors of mortality in acute respiratory failure after planned extubation in nonagenarian patients with pneumonia. The hospital death patients exhibited a prolonged ICU with higher costs of medical care. Keywords: reintubation, planned extubation, nonagenarian, respiratory failure, pneumonia.
The independent predictor factors of mortality in the planned extubation nonagenarian patients received endotracheal intubation
Parameters
odds ratio
95%CI
p value
reintubation during hospital
3.565
1.210-10.504
0.021
Hb<10.3 mg/dL
3.525
1.341-9.262
0.011
beginning weaning over 3days after intubation
4.060
1.613-10.222
0.003
The statistical analysis ways were the logistic regression and ROC statistics analysis.
Meeting report
Restricted accessMeeting reportFirst published October, 2019pp. 3232693-3232693
The established treatment for most OSA patients is PAP, for prevention of apnea due to upper airway collapse while sleeping. OSA patients are often not compliant with prescribed PAP therapy, most sources state adherence rates of 50% or less. Non-adherence to PAP impacts both long term health, as well as patient safety. When admitted to the hospital the sedative effects of anesthesia, and additional medications increase these risks. Patient Empowerment is a behavior change interaction administered by trained Respiratory Care Practitioner Coaches. This interaction is known to facilitate behavior change by impacting patient engagement and activation leading to patient empowerment. We sought to investigate the effects of a Patient Empowerment coaching on the inpatient adherence of OSA patients to prescribed PAP therapy.
Methods:
Patient Empowerment coaching for OSA patients was implemented at Sharp Memorial Hospital in June 2018. The interaction has four phases: Building Rapport, Engagement, Facilitating Activation, and Empowerment. The coach uncovers implementational, as well as motivational factors that may be barriers to PAP use. The former may include interface issues such as mask type and fitting. The motivational factors are aspects where patient behavior is not in line with medical recommendations. Patients are often not absolutely refusing, they are rather in a state of ambivalence. The role of the coach is to build rapport and engage the patient in exploring and resolving their ambivalence. PAP adherence data from a 2-week period, August 1-14, 2017 (pre-intervention) was compared to the same period the following year August 1-14, 2018 (post-intervention). Adherence was defined as documented evidence of PAP therapy. A comparison was made of total nights PAP was ordered, to the total nights adhered to for each group. A two-sample t-test between proportions was performed to determine whether there was a significant difference between the groups. The Sharp Institutional Review Board approved this research as not subject to regulation.
Results:
There was a statistically significant increase in PAP adherence rates of patients receiving Patient Empowerment coaching, when compared to the pre-intervention time period. (87.4%, 46.7%, P < .001) (Table 1) Conclusions: In our cohort, Patient Empowerment coaching had a positive impact on the PAP therapy adherence rate of inpatient OSA subjects. Disclosures: None
Meeting report
Restricted accessMeeting reportFirst published October, 2019pp. 3232721-3232721
Margo Ann Bell, Michael H. Draughn, Wendy D. Malizia , [...]
View All
Abstract
Background:
Video-enhanced patient education may help to standardize educational content and improve patients’ retention of instructions when compared with current written/verbal modalities of patient education. The purpose of this project was to investigate the impact of understanding pulmonary disease and medications in those receiving video-enhanced instruction compared with those who did not. A secondary evaluation comparing comprehension of pulmonary disease and medications improve after receiving instruction of any kind was conducted Methods: In the past, patients at a large, tertiary medical center were offered discussion supplemented with written forms of education. Although the literature implies that video-enhanced learning would lead to better comprehension of the information, the Pulmonary Disease Navigators did not have consistent access to video content. Through a quality improvement project, the navigators were provided access to video content to supplement the standard written/verbal education. Chronic obstructive pulmonary disease (COPD) patients (n = 62) consented to participate in this study. Inclusion criteria was patients >18 years of age with no cognitive impairments to participating. They were randomized into two groups: those that received supplemental video-based instruction (n = 32) or those who received standard written/verbal education without videos (n = 30). An electronic link was provided to the patients who consented to participate and was utilized to determine their satisfaction and comprehension of the materials presented.
Results:
There was no statistically significant difference in the scores for understanding pulmonary disease between the two groups (P = .36). There was a significant difference between the two groups in understanding of medications (P < .001). In comparing all patients before and after the educational interventions, there was a significant difference in pre- and post-understanding of pulmonary disease (P < .001) and in pre- and post-understanding of medications (P < .001).
Conclusions:
Although there was no significant difference in understanding of COPD when video-enhanced education was used, there was a significant difference in understanding of medications in the group that received video-enhanced education. Additionally, education provided was beneficial, as there was a significant improvement in learning between pre- and post- scores for all types of modalities. Further research would be beneficial.
Meeting report
Restricted accessMeeting reportFirst published October, 2019pp. 3233024-3233024
During the past 20 years, because of respiratory care policies in Taiwan, delivering high-quality services in a cost-effective and efficient manner has been a challenge. Although hospitals are all different, this study discovered common problems with respect to respiratory care, namely interrupted patient care, lengthy wait times, excess motion, and diminished intellectual performance by respiratory therapists. To resolve these complex problems, we undertook this project to identify process components, increase efficiency and standardization, and encourage a teamwork approach in implementing solutions. Lean thinking combined with mobile medical cart (MMC) use was demonstrated to effectively improve the intensive care unit (ICU) respiratory care process.
Methods:
From January to December 2018, data were collected concerning 23 respiratory therapists in the respiratory care division of a 162-bed hospital, and observations were made across 6 ICUs. We adopted lean thinking (understanding user value, mapping value-streams, creating flow and continuous improvement) and quality improvement tools (Kanban) to simplify numerous processes. The MMC is a reliable wireless system that contains all the information required for delivering effective care. It provides storage space for essential supplies, making them easily accessible. Because of the success of the 1-year trial, we evaluated the time wasted in daily activities, common variation, and process components and used the Taiwan Clinical Performance Indicator (TCPI) parameter to assess outcomes.
Results:
Through the streamlined process enabled by using the MMC, the time wasted was reduced to 45 minutes during respiratory therapist treatment. To assess the common variation and process in daily work, the rate of improvement in the performance of various tasks was determined; these tasks and their improvement rate are outlined as follows (Table 1). These results indicate improvement in respiratory care accreditation.
Conclusions:
By applying lean thinking combined with MMC use, a respiratory therapist can have a positive effect in the ICU because that combination entails investigating and optimizing processes and ensuring the proper skill set is utilized in performing necessary daily tasks. It can effectively decrease time wasted, facilitate the provision of patient-centered care, improve workflow, and reduce staff workload and delay times, all of which can create a culture that emphasizes patient safety.
Table.1 The rate of improvement in the performance of various tasks
Easily perform various tasks for critically ill patients
100%
Simultaneously perform multiple tasks and device replacement
75%
Multidisciplinary team communication
75%
Electronic medical record recordkeeping
87.5%
Correct administration of inhaled drug
95.8%
The outcomes with respect to the TCPI parameter are outlined as follows: (1) ventilator-associated pneumonia rate, 0.92‰; (2) ventilator weaning rate, 74.14%; and (3) 24-hour to 72-hour reintubation rate, 2.95% to 4.81%.
Meeting report
Restricted accessMeeting reportFirst published October, 2019pp. 3233526-3233526
Intermountain Healthcare is an integrated health system comprised of 23 acute-care hospitals supporting clinical rotations for 4 RT college/university programs. Students in BSRT programs complete an executive rotation at the corporate office. Topics covered include: 1) QI projects, 2) interviewing skills, 3) literature reviews, 4) profession forecasting, and 5) management strategies for problem identification/solutions. After student complaints during this rotation, we sought to identify problems and solutions for clinical rotations.
Methods:
Using a 45-minute activity for conflict resolution, 16 students from 2 universities.
Results:
Detailed results are reported in Table One. Issues included preceptor, student and program faculty areas for improvement. Issues and solutions were categorized under four key headers: 1) Communication, 2) Staff/Student Relations (negativity), 3) Learning Opportunity Concerns, and 4) Patient Interaction/Sensitivity. We thought communication was the largest issue; however, this activity identified 2 other key areas: staff/student relations and learning opportunity concerns.
Conclusions:
We acknowledge a limited number of students participated; however, some key issues supported comments expressed over the last 2 semesters. Negative comments regarding taking students and the profession came from facilities where all RTs were required to take students. We recognize heavy workloads may be a challenge for preceptors to fully engage with students. We are thankful for our professionals who volunteer to be student preceptors; however, we recognize for implementation some key next steps: 1) conducting this activity with preceptors across the system, 2) coordinating for more timely evaluations from students and preceptors shared with managers, 3) improved coordination of rotation objectives for students/preceptors, 4) formalized preceptor training, 5) frequent, formalized coordination among students, college faculty, industry leaders and preceptors, and 5) consideration for awards by students for preceptor(s). At the time of abstract submission, a student co-led this activity with preceptors to illicit issues/solutions. It is our impression this will also allow a student(s) to learn leadership skills and more exposure to preceptors. As we grow future leaders, improved coordination among students, program faculty, industry leaders and preceptors will be required.
Table One: 2019 Spring Semester Student Reported Issues and Suggested Solutions
Issues of Concern
Communication
Staff/Student Relations
Learning Opportunity Concerns
PatientInteraction/Sensitivity
22
33
34
12
Proposed Solutions
13
22
29
3
Note: Some issues were mentioned multiple times.
Meeting report
Restricted accessMeeting reportFirst published October, 2019pp. 3233624-3233624
Susan Elizabeth Gole, Robert L. Chatburn, Matthew Jurecki
Abstract
Background:
Cleveland Clinic is implementing a new protocol as a decision-making algorithm for oxygen management. The goal of the protocol is for respiratory therapists (RTs) to safely and effectively manage oxygen administration for adult patients. Because of the protocol complexity, we are uncertain about the method of training for implementation. The purpose of this study is to compare two forms of disseminating information; a graphical flow chart or a text based algorithm, both representing the same information content. The first hypothesis was either form of the algorithm would improve knowledge acquisition (test scores). The second hypothesis was that both forms of the algorithm would yield the same results.
Methods:
The study population was volunteer RTs from eight hospitals in the US Cleveland Clinic system. The study was implemented as an on-line learning module with pre-test comprised of 10 patient scenarios to determine baseline knowledge before exposure to the protocol. There were two versions of the post-test (same scenarios); one that provided the decision-making algorithm of the oxygen management protocol as a graphical flow chart and the other the text based version of the algorithm. The pre-test and post-test questions were worded differently but tested the same decisions. Participants were randomly assigned to the two versions of the post test. Outcome data were mean differences between the pre-test and post-test scores hypothesis 1) and percent change between pre- and post-tests (hypothesis 2). Data were compared with t-tests and P < .05 indicated significance.
Results:
Fifteen therapists were in each group. Both groups demonstrated significant knowledge acquisition (flow chart: 43% pre, 68% post, P < .001; text based: 45% pre, 83% post, P < .001). But there was no difference in the change in score between groups (flow chart 25%, text based 38%, P = .08). The power of the latter test was only 0.29 due to the low sample size.
Conclusions:
This pilot study suggests that dissemination of complex protocol algorithms may be achieved with either flow charts or text based tools. However, flow charts may be less effective, perhaps due to therapists’ unfamiliarity with reading flow charts. Further study is required to confirm these results and investigate underlying reasons. For now, we intend to include both methods in the protocol.
Meeting report
Restricted accessMeeting reportFirst published October, 2019pp. 3233646-3233646
Coral N. Ringer, Rebecca J. Engberg, Kristen E. Carlin , [...]
View All
Abstract
Background:
There is limited evidence supporting an optimal method or frequency for suctioning hospitalized infants with bronchiolitis. This study was designed to evaluate short-term physiologic outcomes between nasal aspiration and nasopharyngeal suctioning in this population.
Methods:
Sixteen infants requiring hospitalization for supportive management of bronchiolitis were instrumented with transcutaneous carbon dioxide (TcCO2) and oxygen (SpO2) monitors. Global and regional changes in inspiratory and end-expiratory lung volumes were recorded with electrical impedance tomography (EIT). Subjects were suctioned with both nasal aspiration and nasopharyngeal suctioning methods in a randomized order. Noninvasive gas exchange and lung volumes were measured at baseline (pre-suction) and at 10, 20, and 30 minutes following each suctioning intervention. Pre-and-post clinical respiratory severity scores and sputum mass were obtained with each suctioning epoch.
Results:
There were no differences in SpO2 (P = .88), TcCO2 (P = .41), heart rate (P = .31), breathing frequency (P = .15), inspiratory lung volumes (P = .93) or delta end-expiratory lung volumes (P = .53) over the course of suctioning between nasal aspiration and nasopharyngeal suctioning. Figure 1A and 1B show inspiratory lung volumes and delta end-expiratory lung volumes, respectively. The sputum mass was approximately 33% greater with nasopharyngeal but sputum mass (P = .14) and clinical respiratory score pre-post suctioning (P = .97) were not different between the two suctioning interventions. Sputum mass was not associated with delta end-expiratory lung volumes at 30 minutes for nasal aspiration (ρ = 0.11, P = .69), but had a moderate association for nasopharyngeal suctioning (ρ = 0.048, P = .048).
Conclusions:
Infants with viral bronchiolitis appeared to tolerate both techniques without any increased short-term risk in signs of clinical deterioration, gas exchange, lung volumes or adverse events following sputum removal. These findings may help aid clinicians in selecting appropriate suctioning techniques in infants with viral bronchiolitis. It is possible that a subset of patients may benefit from one type of suctioning over another. Future research focusing on important outcomes with suctioning patients with bronchiolitis with varying degrees of lung disease severity is needed.
Figure 1A values represent weight adjusted, global inspiratory lung volumes (arbitrary units/kilograms) and Figure 1B values show weight adjusted, global delta end-expiratory lung volumes (arbitrary units/kilograms) at baseline and at three time points (10, 20, 30 minutes) following nasal aspiration and nasopharyngeal suctioning. The median is the middle line inside the box with the mean designated as either a circle or + sign inside the box.
Meeting report
Restricted accessMeeting reportFirst published October, 2019pp. 3233657-3233657
Terry L Forrette, John Hunt, Patrick Greiffenstein , [...]
View All
Abstract
Background:
We sought to determine what our baseline level of positive end expiratory pressure (PEEP) should be set at to minimize ventilator-induced lung injury (VILI). Amato and co-workers determined that a driving pressure (Pd) of 13 cm H2O or less reduced the incidences of VILI. They determined Pd by subtracting PEEP from plateau pressure (Pplat).
Methods:
After receiving IRB approval, we first measured Pd, using the inspiratory pause function on the ventilator to obtain a Pplat level, at our standard baseline PEEP of 5 cm H2O on 66 patients in our Level 1 trauma ICU (TICU). Following an initial analysis of these patients we elevated the baseline PEEP to 8 cm H2O and measured Pd on 112 patients in the TICU. Patients from both groups were ventilated at 6 mL/kg/PBW in either the AC or PAV ventilation mode.
Results:
The results of our study showed a significant difference, P < .05 in Pd between 5 and 8 of PEEP.
Conclusions:
Our data reflects that of others suggesting that a higher level of PEEP may aid in reducing VILI. Following this study our ventilator protocol was changed to an entry PEEP level of 8 cm H2O.
Meeting report
Restricted accessMeeting reportFirst published October, 2019pp. 3233663-3233663
The two-years in-service training program for the new graduated respiratory therapist (Post Graduate Year, PGY) is implemented by the Ministry of Health and Welfare (MOHW) od Taiwan in July 2007, the purpose of the program that use the teaching and learning as a strategy to improve the clinical quality care. After ten years’ implementation, MOHW want to strengthen the education program is measureable, Therefore, it is hoped that the EPAs will be integrated into the PGY trainee training courses in various medical professions. Base on the background, we start to apply EPAs to the respiratory therapist category, but the first things to choice the urgent and useful items from previous 57 courses.
Methods:
This study was based on the current 57 PGY course which was divided to basic, advanced and critical care stages, we divided into four groups by 26 colleagues (5 tutor group, 7 senior teachers group, 7 just finished PGY training and 7 in the PGY student). They choice the urgent and useful items from 57 courses according to their experience. The response rate was 100%.
Results:
According to the results, the 26 colleagues were divided into four groups, and the top ten of each group were selected according to the results. Then they were mixed and analyzed by the pivot table to give priority to the training courses. The four groups agreed to give priority to the five training courses, which are the oxygen therapy at the basic stage and the respiratory care and treatment of COPD and ARDS patients in the critical stage. In addition, the training of the two main ventilator labels in our hospital (Vela and Evita4), and reply to teaching. (table1) Conclusions: The main purpose of two-year in-service training program for the PGY staff that can become familiar with the hospital characteristics and integrate into clinical work as soon as possible, so as to improve the quality of respiratory care and patient safety. This study shows that projects that should be prioritized as training courses should disclose basic treatments (oxygen therapy), common disease subjects (COPD and ARDS), and the main machines in the hospital. After the survey is integrated, the next stage of the project that should be included in the trusted professional activities can be laid out and the assessments at each stage be made. Disclosures: This study was supported by the China Medical University Hospital (CMUH-EDU10701). The authors disclose no conflict of interest.
Meeting report
Restricted accessMeeting reportFirst published October, 2019pp. 3233719-3233719
Michelle Chang, Brandon Burk, Karla Vavruska , [...]
View All
Abstract
Background:
A variety of pulmonary conditions can lead to increased mucus production that can become tenacious and difficult to mobilize. Percussive devices such as the Intrapulmonary Percussive Ventilator (IPV) (Model-2C, Percussionaire Sandpoint, ID) and MetaNeb system (Hill-Rom, St. Paul, MN) are marketed as devices that assist in mobilizing secretions. The purpose of this study is to determine if coaching patients to achieve a specific I:E ratio will assist in secretion mobilization while using these devices.
Methods:
The Ingmar Medical ASL 5000 (Pittsburgh, PA) was used to simulate a spontaneous breathing patient with active exhalation. The simulator was programmed with a compliance of 60 mL/cm H2O, resistance of 18 cm H2O/L/s to represent chronic bronchitis, with a tidal volume of 800 mL and a respiratory rate of 15. Three I:E ratios were used to represent different breathing patterns: 1:3 (normal spontaneous breathing), 3:1 (inverse), and 1:1 (equal). Both IPV and MetaNeb were used for testing. Each device was tested on its high frequency and low frequency settings. For the mucous simulant, 100 mL of locust bean gum solution (1.9 g LBG/500 mL Water) was mixed with 3 mL of sodium tetraborate solution (8 g Tetraborate/1 L water). A 33.2 cm long section Tygon tubing with an internal diameter of 13 mm was used to simulate the trachea. For each trial, 1 mL of mucous simulant was injected into the middle of the tubing. Each I:E ratio and frequency setting was performed in triplicate. The velocity was calculated in centimeters per minute (cm/min) using picture analysis on ImageJ software (National Institute of Health, Bethesda, MD).
Results:
There was no difference in mucous velocity between devices (P = .53) or frequency setting (P = .38). There was, however, a significant difference in mucous velocity between I:E ratios, with the largest difference occurring between a ratio of 3:1 and 1:1 (P = <.001). The average mucous velocities were 4.0, 1.45, and -0.06 (cm/min) at I:E ratios of 3:1, 1:1 and 1:3 respectively.
Conclusions:
This study demonstrated an increase in mucous movement when instructing a patient to achieve an I:E ratio of 3:1 while performing these therapies. Clinical follow-up is needed to determine if instructing patients to perform a long inspiratory phase, followed by a short, forceful exhalation, improves secretion movement while performing these therapies.
Meeting report
Restricted accessMeeting reportFirst published October, 2019pp. 3233803-3233803
Monitoring cuff pressure on intubated patients is important to prevent tracheal ischemia and aspiration. The goal of this study is to determine the accuracy of the AG Cuffill Pressure Manometer (Hospitech Respiration, Kiryat Matalon, Petach Tikva, Israel) by measuring various pressures compared to the Fluke VT Plus HF Gas Flow Analyzer (Biomedical, Cleveland, OH). Our hypothesis is that there will be no difference between the readings of the two manometers when measured at various pressures.
Methods:
A model trachea composed of large bore tubing (Care Fusion, Yorba Linda, CA), a 7.5-mm endotracheal tube (ETT) (Covidien, Mansfield, MA), and the Fluke, were used to test the accuracy of the AG Cuffill. The ETT was inserted into the model trachea and the Fluke was zeroed. The cuff was inflated until the Fluke read pressures of 10, 20, 30, and 40 cm H2O. By utilizing two stopcocks (Smiths Medical, Dublin, OH) to isolate the Fluke, the pressures were able to be independently analyzed. Each pressure was then obtained using the Cuffill, and recorded. Three trials were performed at each of the 4 targeted pressures.
Results:
At the targeted pressures, the Cuffill consistently overestimated the measured pressure when compared to the Fluke (P < .001). When tested at a pressure of 10 cm H2O the Cuffill measured the most accurate with an average of 12 cm H2O. As the pressure was increased to 40 cm H2O, the Cuffill accuracy decreased, with a mean of 44 cm H2O.
Conclusions:
At each targeted pressure, the Cuffill had a 4 cm H2O or less difference than the control. Although, the difference in pressure measured between the Cuffill and the Fluke was statistically significant, we found that it was not clinically significant when measuring within therapeutic ranges (20-30 cm H2O). The Cuffill is a quick and accessible pressure manometer and can be used as a convenient bedside tool to check cuff pressure.
Meeting report
Restricted accessMeeting reportFirst published October, 2019pp. 3233823-3233823
Patients with tracheostomies are often required to be medically treated with high flow oxygen therapy as well as nebulized medication. ConMed Corporation’s MUNODA Universal Respiratory Adapter (Utica, NY) allows healthcare providers to eliminate the need to disconnect high flow oxygen by delivering both inhaled medication and high flow oxygen to the patient simultaneously. The purpose of this research is to determine if using this adapter impacts the amount of medication delivered to the airway. We hypothesized that there would be no difference in solute deposition between using the MUNODA Universal Respiratory Adapter (Y-tube adapter) combining a high flow device and nebulizer versus a traditional treatment delivered via aerosolized nebulizer alone to deliver nebulized medication.
Methods:
A simulated patient with a 7.0mm Shiley Tracheostomy Tube (Tyco Healthcare, Minneapolis,MN) was ventilated by a Hans Rudulph Series 1101 Breathing Simulator (Shawnee Mission, KS) utilizing a normal breathing pattern. For the trials with the Y-piece-tube adapter, a Salter Labs NebuTech HDN nebulizer (Arvin, CA) and a Carefusion Venturi high flow device (San Diego, CA) were attached to the Munoda y-tube. The y-tube was then attached to the trach via a t-piece with an exhalation port using large bore tubing measuring one link. A Teleflex Bacterial/Viral Filter (Morrisville, NC) was attached to the airway and connected via large bore tubing to the breathing simulator. A 3-mL solution of 10% hypertonic saline solution was nebulized for 4 minutes. The Venturi device was set to deliver a total flow of 32 L/min. For the trials without the Y-piece-tube adaptor, a nebulizer was placed directly into the t-piece. Each filter was weighed before and after the treatment was given, and the difference was recorded. Each trial was performed in triplicate.
Results:
The average change in weight of the filters following nebulization utilizing the Y-piece adapter and high flow O2 was 26.7 mg, and the nebulizer alone was 70 mg. The difference in weight between the two trials was significant (P = .015).
Conclusions:
Based on the results from these trials, using the Munoda adapter with high flow O2 delivered significantly less aerosol than the T piece method. We discovered an incidental finding; when the nebulizer and high flow Venturi were used with the Y- piece, it generated less visible aerosol than when the nebulizer was used alone.
Meeting report
Restricted accessMeeting reportFirst published October, 2019pp. 3233913-3233913
and Aims: In 2015 our organization identified varying practices of care and education for our increasing adult population of surgically altered airway patients. The variances created inconsistencies in patient care and outcomes. With administrative support, a team consisting of an Otolaryngology physician, Quality and Safety Medical Director, representatives from Nursing, Speech Language Pathology, and Respiratory Therapy began to formalize a structured tracheostomy care pathway. The purpose of the pathway was to standardize all aspects of care in a safe and effective practice throughout the organization by creating practice guidelines and a specialized team educated in the management of caring for the tracheostomized patient.
Methods:
The pathway was implemented with over 750 staff members, utilizing clinical scenarios and simulation along with bedside competency validation. Clinical simulation included anatomy of the airway, resuscitation devices, manipulation of the different types of tracheostomy, lary tubes, filters, humidification needs; suctioning and airway clearance; documentation and bedside safety supplies. A bundled order set was established utilizing mnemonics to standardize room setup, bedside and travel safety supplies with an emphasis on patient education. A specialized team known as CATT, Care and Assessment of the Tracheostomy Team was established and comprised of designated Speech Language Pathologists and Respiratory Therapist. THE CATT educates providers, clinical staff and patients regarding care, tracheostomy tube changes, downsizing, voicing options, capping trials, and decannulation.
Results:
On average over 600 surgically altered airway visits are seen annually, the pathway was phased in beginning in 2015 and by 2018 results show that consistency in supporting the education of staff over 94.6% of patients receive discharge education which coincides with a noted reduction in tracheostomy related readmissions from 26 in 2015 to zero in 2018. Bedside safety supplies are monitored and documented as present each shift with a 99% compliance rate. Rapid Response Team calls for tracheostomy related events have also been reduced by 68.4%.
Conclusions:
Educating a large hospital staff at entry level for a tracheostomy program should not be overlooked. Providing a solid foundation for bedside care providers in understanding how to safely manage and care for a patient with an altered airway is beneficial to the overall outcomes.
Pre and Post Implementation
Indicators
2015
2018
Results
Trach Discharge Education Compliance
15.4%
94.6%
79.2% Increase
Bedside Safety Supplies Compliance
74.4%
99%
24.6% Increase
Number of Trach related Rapid Responses
19
6
68.42% Decrease
Number of Readmissions for Trach related events
26
0
100% Decrease
Meeting report
Restricted accessMeeting reportFirst published October, 2019pp. 3234139-3234139
Brian J Smith, Hadley Sauers-Ford, Elizabeth Wood , [...]
View All
Abstract
Background:
Bronchiolitis is the leading cause of hospital admission for infants in the US. Evidence supports the use of HFNC for bronchiolitis. The use of HFNC was not standardized in our children’s hospital. We identified the need of an evidence based protocol for the treatment of bronchiolitis and initiated a children’s hospital quality improvement (QI) effort.
Methods:
In our single center QI project we created a HFNC protocol guiding physicians, RTs and RNs on the introduction and titration of HFNC in children 0-36 months with bronchiolitis. The pilot went live 12/18- 1/19 with HFNC Bronchiolitis Protocol 1.0 which included a previously published respiratory assessment tool to guide HFNC titration. Staff was surveyed through face to face conversation and e-mail seeking feedback. The protocol was changed and re-implemented 2/19 with HFNC Bronchiolitis Protocol 2.0. This 2nd version the initiated flows changed and a new Respiratory Assessment Classification (RAC) was created based on qualitative feedback from staff.
Results:
Qualitative analyses of our Protocol have been overall positive. Version 1.0 included a published respiratory assessment tool. However, staff reported the tool too complicated and we found staff titrated HFNC per clinical judgment versus protocol. We queried staff for clinical indicators used for titration of HFNC and identified 3 top criteria: breathing frequency, WOB, and mental status. Staff reported the first tool was complicated and time consuming. We adapted a 2nd tool to create the Respiratory Assessment Classification (RAC) that classifies a patient’s status as mild, moderate, or severe. Qualitative data from the 2nd version show staff find the RAC easy to use and that HFNC is titrated most often per protocol versus clinical judgment. Initial flows were increased with 2.0. RTs reported desire to “dial in” the initiation flow for a patient during version 1.0. Version 2.0 allowed for titration 1-2 L/kg for patients with Moderate RAC, and then 2 L/kg up to max of 20 L for those with Severe RAC. Following the second implementation, staff reported increased confidence with higher flows.
Conclusions:
A simplified respiratory assessment tool that includes common clinical categories used by staff for HFNC titration is better received than more complex published assessment tools and leads to HFNC titration in a protocolized manner. Our protocol has provided RTs and RNs with more autonomy and confidence in the use of higher flows.
Meeting report
Restricted accessMeeting reportFirst published October, 2019pp. 3234198-3234198
Carrie Marie Winberg, *Corey W. Sillito, Jason Jacobs , [...]
View All
Abstract
Background:
Unintended extubations (UEs) are considered an indicator of healthcare quality in intensive care units (ICUs). We define endotracheal tube (ETT) and tracheostomy decannulations as UEs. UE is a complication of artificial airways in patients with and without mechanical ventilation. UEs involving ETTs have been reported in 3-16% of mechanically ventilated patients (1), and several studies identify UEs as a marker of quality of weaning care. Intermountain Healthcare is an integrated healthcare system in the intermountain west with 23 acute care hospitals of which 20 provide respiratory care services. We sought to identify the incidence and root causes of UEs & trends in artificial airway practices associated with adult patients in our ICUs.
Methods:
During Q4 2018, outcomes regarding UEs were tracked via electronic medical record documentation, event reports and daily safety huddles. Charts were reviewed to identify root causes such as activity level, securing device, caregiver/family presence, ventilator settings and reintubation. We acknowledge UEs may have been previously under-reported and true prevalence was unknown. While some element of normalization of UEs may have been prevalent, an increased culture of safety is occurring. With data tracking, we have appreciated improved reporting behaviors.
Results:
Documented UEs were noted in 30 pts (Table 1). Trends included: 1) time of day (11 UEs occurred before 10 AM with only 1 occurring after 10 PM), 2) no difference in UE occurrence appeared associated with the airway securing method, 3) 15 pts were in a spontaneous ventilator mode, and 4) the majority of UEs did not occur during early mobility. The ICU with the most aggressive mobility practice (TID) had zero UEs. We found 3.3% of mechanically ventilated pts had a UE with 7 (23%) of them requiring reintubation.
Conclusions:
Additional methods of baseline data inquiries found that the most consistent contributors were sudden wakefulness and variation in restraint application. During 2019, all UEs are being reviewed for further trend analysis as well as standardized response interventions to assess efficacy of UE mitigation. We emphasize the importance of baseline analysis to identify root causes and care plan gap solutions. Reference: 1. Boulain T. Unplanned extubations in the adult intensive care unit: a prospective multicenter study: association des Reanimateurs du Centre-Ouest. Am J Respir Crit Care Med 1998;157:1131-1137.
Table 1: Oct 1, 2018- Dec 30, 2018 Adult Unintended Extubation/Decannulation Outcomes Across an Integrated Healthcare System
Pts on Ventilator#
Vent Days*#
Pts with UE#
UEs Per 100 Vent Days
Pts Requiring Re-intubation#
Pt. Mortality Related to UE#
902
3774
30
0.08
7
0
Meeting report
Restricted accessMeeting reportFirst published October, 2019pp. 3234246-3234246
pulmonary aspiration is a common clinical event in critically ill patients. Enteral nutrition is one of established predisposing factors for pulmonary aspiration. This study aimed to evaluate the safety and effectiveness of nasointestinal tube versus nasogastric tube for preventing pulmonary aspiration in critically ill patients.
Methods:
We systematically searched English (Cochrane Library, PubMed, EMBASE) and Chinese databases (CBM, CNKI and WANFANG), update to December 31, 2018. The studies have no limitation on the language, but only for human research. We include the randomized controlled trials (RCTs) and quasiexperimental studies comparing nasointestinal versus nasogastric tube feeding in critically ill patients aged 18 and over. Data extraction and evaluated trial quality were conducted separately by two researchers, including primary outcomes (pulmonary aspiration, aspiration pneumonia) and secondary outcomes (length of hospital stay, vomiting, etc). Meta-analysis and narrative synthesis were performed.
Results:
We pooled data from 21 English trials and 65 Chinese trials of 6126 participants in this meta-analysis. Meta-analysis showed that the incidence of reflux of gastric contents (RR 0.2, 95% CI 0.16 to 0.25), pulmonary aspiration (RR 0.32, 95% CI 0.25 to 0.40) and aspiration pneumonia (RR 0.48, 95% CI 0.41 to 0.56) was reduced in patients with nasointestinal feeding, compared with nasogastric tube feeding. Patients with nasointestinal feeding showed lower gastric residual volume (RR 0.23, 95% CI 0.17 to 0.31), lower frequency of vomiting (RR 0.38, 95% CI 0.27 to 0.55), less length of hospital stay (mean difference (MD) -3.02 days, 95% CI -4.95 to -1.09) and intensive care unit (ICU) length of stay (MD -3.12 days, 95% CI -4.33 to -1.09) than that with nasogastric tube feeding.
Conclusions:
Evidence from this study shows that nasointestinal tube feeding may be more safety on reducing the incidence of pulmonary aspiration and pneumonia, and showed better outcome in critically ill patients, compared with nasogastric tube feeding.
Figure 1-Nasointestinal versus nasogastric tube feeding in critically ill patients: the incidence of pulmonary aspiration and aspiration pneumonia
Meeting report
Restricted accessMeeting reportFirst published October, 2019pp. 3234391-3234391
The definition of prolonged mechanical ventilation (PMV) continued using ventilator over 21 days. The problem of PMV patients were increase in many countries. In Taiwan, the number of PMV patients was 7.24 times higher in 2009 than in 1995. Previous studies have investigated the factor of ventilator liberation, but no studies examined the factor of institution and physicians’ characteristic. In this study, we investigated the influence of institution and physician characteristics on the length of ventilator use day in PMV patients.
Methods:
This retrospective study analyzed a cohort of PMV patients who were age ≥ 17 using a population-based database from the Taiwan National Health Research Institutes Database from 2006 to 2010. The T-test, ANOVA and Multiple Regression Analysis were used in the study.
Results:
A total of 30,576 patients were included in 2006-2010, exclude the patients who death within half year (10,234 patients); there were 20342 patients in final analysis. For the institution characteristics; Comparing to medical center, the regional hospital, district hospital and others has higher day of using ventilator from 14.94 to 112.8 days (P < .05). The average days of using ventilator the private hospital is 5.14 days fewer than the public hospital. For the physician Characteristics, the physician in age 41-45 and over 51 have longer days compare to age under 35 with 2.19 days (P < .05) and 4.78 days (P < .05). The physician has higher services volume, his patients have a higher average ventilator use days.
Conclusions:
Both of the institution and physician characteristics influence the length of ventilator use day in PMV patients. They are in the non-medical center and public hospital, have higher ventilator use days. Physician has higher age or patient service volume, his PMV patients have higher ventilator use days.
Variables
N
Mean
Std
P-value
Estimate
Std
P-value
Level of health-care organization
<0.001
Medical center
7736
40.5
30.0
Regional hospital
8222
58.8
52.6
14.94
0.72
<0.001
District hospital
4039
149.7
52.7
98.49
0.92
<0.001
others
345
164.9
30.4
112.8
2.45
<0.001
Ownership of organization
0.062
Public hospital
4771
70.2
61.5
Private hospital
15571
72.1
61.9
-5.14
0.75
<0.001
Physician age
<0.001
Under 35
3561
63.5
55.5
36-40
5253
66.6
59.3
0.57
0.96
0.552
41-45
4879
70.8
62.0
2.19
0.97
0.024
46-50
3589
74.8
62.8
1.68
1.04
0.107
Over 50
3060
87.8
68.0
4.78
1.10
<0.001
Patient services volume
<0.001
Low
656
50.7
47.0
Median
4713
71.1
62.4
2.40
1.83
0.189
High
14973
72.8
62.0
4.35
1.76
0.013
Wean mechanical ventilator
<0.001
No
7238
90.5
69.4
Yes
13104
61.3
54.5
-9.97
0.67
<0.001
Meeting report
Restricted accessMeeting reportFirst published October, 2019pp. 3234425-3234425
Mohammed M Alqahtani, Lynda Goodfellow, Peter S Hendricks
Abstract
Background:
Pulmonary rehabilitation is considered the standard of care for patients who have lung diseases or lung disease. Pulmonary rehabilitation is aimed to decrease symptoms, improve functional status, and improve quality of life. Limited studies have examined the effects of the rehabilitation programs on psychosocial factors such as stress, depression, anxiety, and social isolation. Purpose: This study evaluated the effect of the rehabilitation programs on the preceding psychosocial factors Methods: We included cardiac and pulmonary patients who were attending the rehabilitation programs at a single quaternary care academic hospital from March 2015 onwards. Participants who completed the rehabilitation programs were eligible to be included in this study. After Institutional Review Board (IRB) approval, 583 pulmonary patients and 718 cardiac patients were included in this study. Data were analyzed using SAS v.9.3. Paired t-test was used to compare the PRFS scores at Intake and Discharge.
Results:
For the Cardiac group, there were significant changes in all PRFS scores (total distress score, depression, anxiety, hostility, and social isolation) from intake to discharge (P < 0.05). For the pulmonary group, there were significant decreases in psychosocial scores (total distress score, depression, anxiety, and hostility) from intake to discharge (P < 0.05). The change in social isolation score was not significant (P >.05).
Conclusions:
Rehabilitation programs are effective in decreasing the psychosocial scores for the pulmonary and cardiac patients. Further studies with larger sample sizes with a control group are needed to generalize the findings in this study.
Table.1 Comparing the Pre and Post values for PRFS Scores for the Pulmonary Group: Change from Intake to discharge (Discharge Values – Intake Values)
Mean (SD)
P value
PRFS Total Distress Score
-2.32 (7.11)
<.0001
PRFS Depression
-2.98 (7.22)
<.0001
PRFS Anxiety
-2.37 (7.45)
<.0001
PRFS Hostility
-1.20 (6.98)
0.008
PRFS Social Isolation
-0.52 (8.21)
0.323
*paired test p-values given
Table.2 Comparing the Pre and Post values for PRFS Scores for the Cardiac Patients: Change from Intake to discharge (Discharge Values – Intake Values)
Mean (SD)
P value
PRFS Total Distress Score
-02.26 (7.33)
<0.0001
PRFS Depression
-02.31 (6.72)
<0.0001
PRFS Anxiety
-02.22 (7.18)
<0.0001
PRFS Hostility
-01.52 (7.31)
0.0001
PRFS Social Isolation
-00.78 (7.34)
0.0447
*paired t-test done
Meeting report
Restricted accessMeeting reportFirst published October, 2019pp. 3234551-3234551
Perioperative pulmonary complications (PPC) are more common in patients undergone gastrointestinal surgery, however, the awareness and attention of surgeons on perioperative lung protection (PLP) is still seriously inadequate. The study was designed to investigate the situation of PLP in gastrointestinal surgery in mainland China.
Methods:
The Second Affiliated Hospital of Fujian Medical University was taken as the initiating unit. A WeChat questionnaire was delivered to physicians who have worked more than two years and respiratory therapists (RT) with unlimited years of experience in gastrointestinal surgery or intensive care unit (ICU) in mainland China. Two rounds of investigation were conducted for initial screening and WeChat follow-up.
Results:
A total of 157 valid questionnaires were collected, including 89 hospitals in 24 provinces, autonomous regions and municipalities directly under the central government. There were 57 hospitals among them (57/89, 64.0%) have respiratory therapists, they mainly worked in the ICU and respiratory departments. RTs from only 9 of 57 (9/57, 15.7%) hospitals provided assistance to patients in the perioperative of gastrointestinal surgery. The prevalence of respiratory therapy techniques remains unsatisfactory (Figure). 60 gastrointestinal surgeons were surveyed totally, 52 (86.7%) out of them considered PPC as the most important perioperative complication during gastrointestinal surgery. However, their awareness of respiratory therapy technology project still needs to be further improved.
Conclusions:
Gastrointestinal surgery patients are supported from respiratory therapy in mainland China is seriously lacking. The main reasons are the shortage of RTs, and they do not pay enough attention to gastrointestinal surgery. We call for more attention to the training of RTs and PLP in gastrointestinal surgery patients.
Popularizing rate of postoperative lung protection program
Meeting report
Restricted accessMeeting reportFirst published October, 2019pp. 3234628-3234628
Respiratory therapy was introduced in India in 1995 based on the curriculum taught in the USA. Several leading universities realized the value of Respiratory therapists (RT) and started respiratory therapy programs at the certificate, baccalaureate (BS) as well as masters (MS) level locally. An association of members was also established to bring all RTs together, to introduce them to the employing healthcare fraternity and to have a common curriculum for all. Despite that, unfortunately, there is very little evidence that tells us about the education and services of RTs in India. Hence, this survey was done to gain an insight into the background and understand the competencies performed by RTs in India.
Methods:
502 RTs who graduated with either a certificate, BS or an MS degree from across India were invited to participate in this cross-sectional survey. 410 RTs responded and 223 answered all questions. The survey was conducted using a paper-based, telephonic or the electronic (survey monkey) questionnaire. Participants were asked about their education, experience, current job, responsibilities and how frequently they utilized the competencies learned during training. Descriptive statistics were performed using SPSS Version 22. Approval was obtained from the institution’s ethics committee.
Results:
Out of the 223 respondents, 52% were females and 48% males. They had a mean age of 26.4 ± 5.4 years with clinical experience of 3.6 ± 4.2 years. 70% had a BS degree, 18% had an MS degree, 2% Ph.D. and 10% certificate, RT diploma or other educational backgrounds. 93% participants worked as RT or any job role that required RT knowledge while 7% either quit or changed careers. Although they may have multiple job roles, 75.7% work as a staff respiratory therapist in hospitals. RTs in India spend 51% of their time in adult intensive care unit (ICU), 7% in an emergency room, 7% pulmonary function testing, 5% pediatric ICU 5% neonatal ICU, 5% university, 5% clinic and 15% other areas.
Conclusions:
The results of the survey indicate that the majority of RTs in India have a BS degree and work predominantly in the Adult ICU. The results emphasize that the majority of RTs work in an acute environment. They also give an indication of the competencies that are used more frequently, than others. The responses show that RTs in India seldom plan and providing pulmonary rehabilitation and administer home-based care.
Table 1: Percentage of Competencies performed per week
Meeting report
Restricted accessMeeting reportFirst published October, 2019pp. 3234723-3234723
An estimated 100 million people are homeless worldwide, approximately 19% smoke. The purpose of this research was to analyze if socioeconomic status influences individuals to start smoking, access to smoking cessation assistance and drivers behind start and starting smoking.
Methods:
The institutional IRB and homeless shelter leadership approved a 10 question descriptive survey inquiring about an individual's smoking history, knowledge of and accessibility to smoking cessation assistance, and socioeconomic background.
Results:
A total of 131 people completed the survey. Results were separated by shelter participants and online participants. Of the shelter participants (74.2%) claim income below the poverty line, while most (72%) of the participants in the online survey claim they are not. Approximately half (54.5%) of shelter adults self report as current smokers; most (89%) online participants are not. Nearly half (45.5%) of shelter participants claim regular smoker"; most (71.1%) of online participants report "never smokers". Participants online (20.5%) claim to be regular smoker only smoked 0-0.5 packs of cigarettes a day compared to shelter adults who more commonly smoked 1 pack or more. Both populations (61.5%, homeless; 65.5%, online) began smoking between ages 12-18. Common factors reported for starting to smoke (66.66%, homeless; 96.43% online) were friends and stress. Most (80.77% homeless; 76.67% online) either previously quit or currently want to quit. Few shelter residents (32%) are aware of formal support groups; similarly (35.48%) participants online claim that no support groups are available. Similar reports from both groups (35.7% homeless; 40% online) report quitting "cold turkey" to be most effective method. Less than half (31.8%) of participants from the shelter have an interest in quitting; many (68.9%) online participants already have quit. Few (25.8%) non-smoking participants from the shelter said it was health concerns that inhibited them from starting. Half of non-smoking online respondents (47.2%) claimed lack of interest kept them from starting.
Conclusions:
The survey results show that socioeconomic status may not play a role in why individuals start smoking. Both identified socioeconomic classes showed that ages 12-18 years was the most common age range to start smoking and reasons were due to peer pressure and stress. Quitting cold turkey is reported as the most effective method for smoking cessation. "
Meeting report
Restricted accessMeeting reportFirst published October, 2019pp. 3234729-3234729
Pneumonia and COPD are two diagnoses that carry a 30-day hospital readmission penalty implemented by the Centers for Medicare and Medicaid Services in 2012. Based on two 2018 studies, COPD patients are not knowledgeable on the signs and symptoms of pneumonia. COPD patients are also more likely to develop pneumonia. The purpose of this study was to evaluate the outcomes of a patient education program for the reduction of early hospital re-admission for these two diagnoses.
Methods:
Using the same survey items from two 2018 studies, an educational brochure Pneumonia and You” was developed for patients enrolled in this study. The brochure identifies seven major symptoms of pneumonia: fever, cough, chest pain, mucus production, shortness of breath, fatigue, and nausea/vomiting/diarrhea. Institutional and hospital IRB approvals were obtained. In-patients with COPD were recruited from a private hospital in Alabama. Verbal and written consents were obtained. Following patient education on the signs and symptoms of pneumonia, the brochure and a reminder key chain were given to the patient. Each patient was contacted by phone 5 weeks following initial patient contact. Patient admission records were also reviewed to cross-check the readmission information, if any. Data was reviewed and summarized by a descriptive method.
Results:
All 10 enrolled patients had a diagnosis of COPD plus one of these conditions: pneumonia, CHF, chest pain, STEMI, head injury, general weakness, and atrial fibrillation. Six answered the phone when called five weeks after initial contact. Readmission information for all 10 patients were cross-checked using the EMR. Of the 10 enrolled COPD patients, only 2 were readmitted within 30 days of discharge from hospital, one for chest pain and the other for CHF. One patient had not left the hospital during the time period of study. Two patients were admitted to nursing homes upon discharge from the hospital. The remaining 5 patients were discharged home and were not readmitted to any acute care facility. In summary, of the 9 discharged COPD patients, none of them were readmitted for COPD or pneumonia.
Conclusions:
The patient educational program (in-person visit, brochure, and reminder key chain) appears to be an effective tool to prevent hospital readmission within 30 days. Due to time constrains, the limitations of this study include low number of enrolled COPD patients and short duration of data collection (5 weeks). "
Meeting report
Restricted accessMeeting reportFirst published October, 2019pp. 3234758-3234758
The Global Initiative for Chronic Obstructive Lung Disease supports the daily use of long-acting muscarinic antagonists (LAMAs), such as tiotropium, for long-term treatment regimens. LAMA agents are primarily designed for patients with spontaneous breathing and, unfortunately, none exist for intubated patients. The optimal inhaled drug dose and method of connecting Respimat to the ventilator system is unknown. We aimed to evaluate Respimat delivery with different adaptors and timing of priming during mechanical ventilation.
Methods:
A Draeger V300 ventilator operated under volume control (500 mL, 15 breaths/min, PEEP 5 cm H2O, TI 1.3 s) with heated humidification at 37 ○C was connected to an endotracheal tube, with an inline collecting filter connected to a lung model (Michigan Instruments, Kentwood, MI). The tiotropium Respimat (2.5 mg, Boehringer Ingelheim) was connected as follows: 1) an inline adaptor (RTC 26-C, Instrumentation Industries Inc.) was placed between the Y-adaptor and the inspiratory limb, 2) a T-adaptor was placed between the Y-adaptor and the endotracheal tube, and 3) a T-adaptor was placed between the endotracheal tube and an Ambu bag. Four actuations of tiotropium were administered, synchronized with inspiration or expiration, according to the ventilation waveforms. The drug was administered only at the beginning of inspiration with the Ambu bag. To test the inhaled drug dose with spontaneous breathing in a control group, the Respimat was connected to a collecting filter and then to a breath simulator (500 mL, 15 breaths/min, ASL 5000; IngMar Medical). The collected drug dose was eluted with a salt-base solvent and analyzed using high-performance liquid chromatography.
Results:
The inhaled dose for the spontaneous breathing was 8.4 ± 1.2%. The average inhaled drug dose percent was 4.44 ± 0.8% for the RTC- at inspiration, 15.36 ± 2.0% for the RTC- at expiration, 2.4 ± 1.2% for the T-adaptor at inspiration, 2.04 ± 0.1% for the T-adaptor at expiration, and 5.6 ± 2.9% for the Ambu bag. The figure below compares the inhaled doses. The inhaled dose of RTC-expiration was significantly greater than the other four groups (P < .001), and the inhaled dose with the Ambu bag was significantly greater than that with the T-adaptor (P = .035).
Conclusions:
Respimat delivery of tiotropium led to a greater drug dose with the new RTC adaptor only with expiratory synchronization.
Comparison delivered dose among 5 methods
Meeting report
Restricted accessMeeting reportFirst published October, 2019pp. 3234844-3234844
Patient receiving prolong mechanical ventilation (PMV) often have a high level of depression and low self-esteem, and are unable to express their inner pain. The family's mental pain and stress are no less than that of the patient. We used a questionnaire to conduct an investigation exploring the mental state of family members of patients on PMV in order to provide care and counseling in a timely manner.
Methods:
This was a cross-cut design study, and used a scale that has been shown to exhibit reliability. A 6-point Likert scale was used, with higher scores indicating a better the mental health status. There were 4 parts to the questionnaire: Purpose and Meaning of Life, Innerness or Inner Resources, Unifying Interconnectedness, and Transcendence. Analysis was performed using the chi-square, t-test, and Kruskal-Wallis no-parent test. Institutional Review Board (IRB):TTMHH-107R0017.
Results:
Of the participants, 73% were between 45 and54 years old (28%). The average Purpose and Meaning of L score was higher (3.22∼4.50). The main caregiver's spiritual health highest average score for a single question was for the Purpose and Significance of Life (M = 4.10), and the average minimum score for a single question was for Sense of Unity of Heaven and Earth (M = 2.59). The total average score was 101.19, with a standard deviation of 22.55 (Table 1). According to Howden, the classification of spiritual health is moderately general.
Conclusions:
The total spiritual health score in this study was the greatest with respect to life objectives and meaning. The highest score was 28.33. Mao Xinchun (1997) found that patients with terminal diseases often understand the value of their existence, and the meaning of life, because of the care of others. Therefore, based on the results of this study and the experience gained from the process of collecting data, the recommendations for spiritual education and practice are: (1) Proposal for spiritual education: Most subjects believe that spiritual education is insufficient. Therefore, design of a spiritual education program should consider how to integrate spiritual issues, especially the adjustment of long-term care stress, basic nursing, health assessment, and health promotion. (2) Suggestions for clinical practice: A spiritual, whole-person medical team can be established to provide counseling resources for the main caregiver's personal spiritual distress, and to provide spiritual care for the patient.
Meeting report
Restricted accessMeeting reportFirst published October, 2019pp. 3234931-3234931
Sherry Babic, Matthew C Jurecki, Robert L Chatburn
Abstract
Background:
Studies confirm that excessive tidal volume (VT) increases the risk of ventilator induced lung injury. A previous model study by Chatburn et al (Comput Biol Med 2016;75:235-242) showed that VT measurement error may occur during pressure control ventilation (PCV) with preset inspiratory time (TI). Some ventilators calculate VT as integral of flow over TI or expiratory time (TE). For a passive patient during PCV, this calculation is accurate. However, an inspiratory effort increase then relaxation results in expiratory flow during TI. Integration of expiratory flow results in volume deducted from the calculated VT (see figure). Hence the displayed volume is lower than the peak value of the volume waveform, the true VT. The displayed VT will be inaccurately low, possibly leading to inadvertent tidal volume over-dosage. The purpose of this study was to determine the prevalence of two main outcome variables: VT error and VT over-dosage (ie, VT >8 mL/kg) during routine mechanical ventilation with PCV modes in our ICUs.
Methods:
All patients in medical and neuro ICUs with active inspiratory efforts, in PCV modes, using Medtronics PB840 or GE Carescape R860 ventilators were included. Volume (V) waveforms were observed for at least 10 breaths per patient. Waveforms with downward V deflection (see figure) during TI were deemed to have VT error present. If error was present, error size was calculated by subtracting the digital display of VT from the peak value of the V waveform.
Results:
We recorded data for 50 patients. A VT error was present in 32% of patients. Average error was -1.2 mL/kg (range -0.6 to -2.6). However, 75% of the time the error was too small to calculate. VT over-dosage occurred in one patient whose displayed VT was 7.9 mL/kg but true VT was 10.4 mL/kg. This patient also had the longest TI (1.2 s).
Conclusions:
In this small pilot study, we observed that VT error is present in a substantial portion of patients during PCV, with the largest error being associated with the longest TI as expected from the previous study. Results of this study warrant the need to monitor V waveforms for patients receiving PCV with an active exhalation valve feature to ensure patients are receiving VT in the range of 6-8 mL/kg of ideal body weight
Meeting report
Restricted accessMeeting reportFirst published October, 2019pp. 3235243-3235243
There are many secretion mobilization devices available for patient care. These devices differ in their designs and functions: manual or mechanical, with or without adjustable settings, high or low cost. The objective of this study was to compare the effectiveness between two mechanical secretion mobilization devices. The Percussive-Neb 2.0 (P-Neb) uses high pressure and high flow and it has multiple settings including soft and hard for secretion mobilization and lung expansion. The MetaNeb (M-Neb) also has two settings; continuous positive expiratory pressure (CPEP) for lung expansion and continuous high frequency oscillation (CHFO) for secretion clearance.
Methods:
A test lung simulation unit (Model 2600i Michigan Instruments, Grand Rapids, MI) and an endotracheal tube (ETT) were used to simulate a mechanically ventilated patient. The settings on the test lung simulation unit were adjusted to minimally create secretion mobilization. A mucus-like substance Polyox (Education Innovations, Bethel, CT) was made and diluted to a mucus consistency and placed at the 20 cm mark of the ETT. For the P-Neb, a “mouthpiece” was made from small PVC pipes so that it would fit onto the ETT. This mouthpiece was placed between the P-Neb and proximal end of ETT. The setting for P-Neb was set to “hard.” For the M-Neb, it was attached to the proximal end of the ETT. For both devices, the distal end of ETT was attached to the test lung simulation unit. Both devices were run for five trials each with a continuous duration of 6 minutes. The ETT was positioned at a 35 degree angle leading to the test lung simulation unit mimicking the position of ETT on an intubated patient. The distance of mucus movement was determined by the difference between the start position (20 cm mark of ETT) and the end position (after 6 minutes).
Results:
Figure 1 shows the average composite data between these two devices. The graph shows that both P-Neb and M-Neb are effective in secretion mobilization. The difference in distance mobilized between P-Neb and M-Neb is about 0.5 cm.
Conclusions:
Both P-Neb and M-Neb can be an effective secretion mobilization device during mechanical ventilation. Not able to use human subjects and actual secretions are two limitations of this study.
Figure 1 Average distance (5 trials each) of secretion mobilization between Percussive Neb 2 (top) and MetaNeb (bottom)
Meeting report
Restricted accessMeeting reportFirst published October, 2019pp. 3235323-3235323
Interprofessional education (IPE) among healthcare students provides a foundation for learning to work effectively as a team. Nursing and respiratory care students have cared for dying patients in the clinical setting with little experience. The purpose of this IPE was to give nursing and respiratory students the opportunity to work together in a simulated learning environment caring for a patient at end of life.
Methods:
Nursing and Respiratory Care students participated in an end of life simulation using a high fidelity manikin and ‘wife’ (instructor acting as) at the bedside. The scenario, by Gina Fieler, was developed from National League for Nursing and Laerdal Medical. A structured format for pre and debriefing was followed: the instructor gave a short pre-briefing report and directed all students to enter the simulation room to observe the patient and clinical scene. Students recorded their observations and returned to the debriefing classroom. Prebriefing continued as students shared their findings, discussed significance, identified further information needed, and developed a plan of care. Student caregivers (two nursing and two respiratory) were instructed to enter the patient room, assess and treat as ordered. Student observers remained in debriefing classroom and watched via video. Instructor ended simulation when objectives were met. Student caregivers returned for debriefing. Duration was approximately 2 hours. With prior Institutional Review Board approval, students were invited to complete a simulation effectiveness evaluation.
Results:
15 respiratory and 42 nursing students completed the survey (n = 57). The majority strongly agreed that the pre and debriefing (95% n = 54; both pre and debrief) were beneficial to learning. 87% (13) respiratory and 64% (27) nursing students strongly agreed they had the opportunity to practice clinical decision making skills. 93% (14) respiratory and 95% (40) nursing students strongly agreed that debriefing was valuable in helping improve their clinical judgment. 73% (11) respiratory and 76% (32) nursing strongly agreed they were more confident in reporting information to the team. Comments: value in role clarification; realistic; want more sims together; suggest different scenarios.
Conclusions:
Student responses reflect increased learning, confidence and desire for IPE simulation. Implementing IPE simulations of various patient scenarios is encouraged. A structured pre and debriefing format enhances learning.
Simulation Effectiveness Tool - Modified (SET-M)
Strongly Agree - 3
Somewhat Agree - 2
Do Not Agree - 1
Prebriefing increased my confidence
Prebriefing was beneficial to my learning.
I am better prepared to respond to changes in my patient’s condition.
I developed a better understanding of the pathophysiology.
I am more confident of my nursing assessment skills.
I felt empowered to make clinical decisions.
I developed a better understanding of medications. (Leave blank if no medications in scenario)
I had the opportunity to practice my clinical decision making skills.
I am more confident in my ability to prioritize care and interventions
I am more confident in communicating with my patient.
I am more confident in my ability to teach patients about their illness and interventions.
I am more confident in my ability to report information to health care team.
I am more confident in providing interventions that foster patient safety.
I am more confident in using evidence-based practice to provide nursing care.
Debriefing contributed to my learning.
Debriefing allowed me to verbalize my feelings before focusing on the scenario
Debriefing was valuable in helping me improve my clinical judgment.
Debriefing provided opportunities to self-reflect on my performance during simulation.
Debriefing was a constructive evaluation of the simulation.
What else would you like to say about today’s simulated clinical experience?
Leighton, K, Ravert, P., Mudra, V., & Macintosh, C. (2018). Simulation Effectiveness Tool - Modified. Retrieved from https://sites.google.com/view/evaluatinghealthcaresimulation/set-m
Meeting report
Restricted accessMeeting reportFirst published October, 2019pp. 3235361-3235361
Ventilated transport procedure changes and increased infection prevention has reduced the risk of Ventilator Associated Events from occurring during transport. Ventilator Associated Events (VAE) cost an estimated 48,000.00 per event, according to the US Department of Health and Human Services. As a larger goal of reducing VAE, ventilated transports were identified as a high risk procedure due to risk of; aspiration, multiple disconnections from the ventilator and possible circuit contamination while not in use.
Methods:
The transport procedure was revised in collaboration with the Infection Prevention Department to include more stringent infection control procedures. Procedural steps were added to ensure airway care was performed prior to transport. This included cuff pressure management, completing above and below cuff as well as oral suctioning and confirming tube placement. Additional steps were added to ensure proper infection control of the ICU ventilator circuit while not in use. Bacterial filters or circuit caps were required on all ventilator circuits while not in use in order to reduce the risk of contamination if not sealed properly. A transport audit tool was created to evaluate transport procedure and perform corrective action in real time. Transport audits helped identify points of improvement for staff. The primary deficiencies found were in regards to the pre transport airway management. Along with real time corrective education, deficiency information was reported in staff meetings, leadership meetings and communicated to staff as points of education.
Results:
After revising transport procedures and staff education, transport audits showed that the number of deficiencies decreased dramatically. Transport procedures with no deficiencies increased from 33% to 75% in a 3-month period.
Conclusions:
The creation of an audit tool in tandem with revised ventilated transport procedures allowed for identification of points of needed improvement and staff reeducation. This has increased the awareness and quality of patient care during ventilated transport therefore reducing the risk of ventilator-assoicated events.
Meeting report
Restricted accessMeeting reportFirst published October, 2019pp. 3235386-3235386
Rebecca Oppermann, Sarah Varekojis, Katherine Roland , [...]
View All
Abstract
Background:
Critical thinking is defined as the ability to apply higher cognitive skills based upon evidence-based practice. Critical thinking is a skill respiratory therapists (RT) utilize every day in their clinical practice. Due to the key role this plays in patient care, critical thinking development is a vital aspect of respiratory therapy education. However, as of now, there is no standardized tool for measuring respiratory therapy students’ critical thinking skills as they relate to the field of respiratory care. Purpose: Identify the guidelines for the development of a critical thinking assessment tool for use in respiratory therapy education programs using a non-experimental, descriptive research methodology.
Methods:
Participants in this study were program directors and directors of clinical education of entry-to-practice Bachelor’s degree respiratory therapy programs accredited by the Commission on Accreditation for Respiratory Care (CoARC). The research involved surveying a panel of experts, gathering their opinions on how to best assess critical thinking in RT competencies, and the best testing format to assess critical thinking. The responses from the survey can be used as the basis for developing a critical thinking assessment tool specific to respiratory therapy students.
Results:
Across all four critical thinking domains clinical simulation was the most frequently selected testing method. Across a variety of different competencies, application was the most selected critical thinking domain to be tested.
Conclusions:
Based on expert opinion, application would be the best domain utilized when assessing and measuring respiratory therapy students’ critical thinking skills. Due to the high selection of clinical simulation as the preferred testing method, experts believe this format would be best to assess students’ ability to apply the competencies of respiratory therapy.
Meeting report
Restricted accessMeeting reportFirst published October, 2019pp. 3235398-3235398
Timothy Corcoran, Anthony Wesolowski, Mark Nagel , [...]
View All
Abstract
Background:
Medication nebulizers are commonly used to delivery aerosolized medications to patients with respiratory disease. To compare in vivo aerosol delivery characteristics of a breath-actuated nebulizer (BAN) to that of a standard small volume jet nebulizer (SVN) we evaluated output and regional lung deposition of indirectly radiolabeled albuterol.
Methods:
Eight healthy subjects received albuterol (2.5 mg/3 mL) admixed with 2 mCi of Tc-DTPA (Technetium-99m bound to diethylenetriaminepentaacetic acid) administered using both the BAN (Aeroeclipse II) and SVN (Nebutech HD). Regional doses were then determined from anterior and posterior gamma camera images collected after delivery. Lung perimeters were defined using Cobalt-57 transmission scans and applied to Tc-DTPA deposition images. The study was approved by the University of Pittsburgh Institutional Review Board.
Results:
Average age of the 8 subjects (4 male, 4 female) was 33 years. The dose deposited in each subject, on average, was 1.03 ± 0.14 mg vs 0.89 ± 0.15 mg for the BAN and SVN respectively. The dose deposited in each subject regionally quantified into the following regions and averages were expressed as percentage of deposited dose (%) ± one standard deviation.
Conclusions:
The BAN (75.0%) demonstrated increased aerosol deposition to the lungs in healthy subjects as compared to the SVN (46.8%) (P < .006). Further studies in patients are needed to confirm the clinical benefit of this increased lung deposition. In vivo deposition patterns also demonstrated that the SVN delivered significantly more aerosol to the upper respiratory tract as indicated by deposition found in both the stomach and tracheo-esophageal regions (P < .005). Disclosures: This study was funded by Monaghan Medical Corporation.
AEROECLIPSE* II BAN
Nebutech* HD SVN
Left lung (%)
35.9 ± 9.2%
21.7 ± 8.2%
Right lung (%)
39.1 ± 7.8%
25.0 ± 8.9%
Stomach (%)
15.0 ± 13.2%
34.4 ± 17.0%
Tracheo-esophageal (%)
7.4 ± 2.5%
11.9 ± 6.0%
Mouth (%)
2.6 ± 1.5%
6.9 ± 3.9%
Lungs (%)
75.0 ± 15.5%
46.8 ± 17.1%
Meeting report
Restricted accessMeeting reportFirst published October, 2019pp. 3235481-3235481
In the past year low staff morale has had a profound effect on our department. Low morale is causing low productivity, increased turnover, un-engaging peer to peer encounters and an overall decline in leadership approval. Low morale makes our employees not want to be their best! Cincinnati Children’s Hospital Medical Center is ranked #2 by US News World Report. In our ideal staffing model our respiratory therapist should be boasting with pride in regards to their employment at Children’s. However, recently at Children’s we were having a difficult time retaining and recruiting new employees. Everyone knew that morale was low and needed to change in order for our culture to change. Leadership and shared governance believes that employees with high morale levels are more productive, engaging, works as a team and have a sense of self-worth. We want our employees to invest in themselves and be the best they can be! Methods: Based off our survey results we are focusing on recognition from peers, patients and families. Team building and serving others was also a request from our RTs. We believe that if we increase morale we will increase staff retention. In order to get a baseline of staff morale a survey was sent to staff prior to research being done.
Results:
Since the results of the survey were unsatisfactory, stating the obvious that staff morale is lower than anticipated. We decided that we will use this as an opportunity for a QI project for our division. Multiple things will be implemented throughout the year by the shared governance team and the leadership team will increase recognition of employees. We will re-survey and trend the data to see if it worked. We will then need to determine which programs facilitated the increase in employee satisfaction. The following programs will be implemented: Grab and Go Cards, Code Lavender Bags, Serving Others, Sunflower Award, RT Outings, Liberty Branch of the Sunshine Club, Monthly Raffles, Leadership sponsored one a month drawing for RTs that pick up extra shifts, we appreciate the way you ventilate bags and setting up a core planning committee for Respiratory Care Week.
Conclusions:
The results of the study showed us the single most important factor was staff wanted recognition. Our next resurvey will be in July 2019.
Meeting report
Restricted accessMeeting reportFirst published October, 2019pp. 3235587-3235587
Bradley Arthur Kuch, Sherry Gadley, Jessica Semenko-Meli , [...]
View All
Abstract
Background:
Continuous high-frequency oscillation therapy (CHFO) delivers rapid sub-tidal-volume bursts of gas during spontaneous and assisted ventilation, increasing mean airway pressure, dilating distal airways, and facilitating airway clearance. Use of CHFO has demonstrated improved radiologic findings following one day of therapy. We sought to identify whether CHFO is effective in intubated patients with documented atelectasis. We hypothesize CHFO use is associated with decreased atelectasis and ventilation parameters.
Methods:
A respective analysis of intubated patients from the cardiac or pediatric intensive care units receiving CHFO between January 2015 and February 2018. Differences determined by χ2 analyses expressed as (n, %) for categorical data and Mann-Whitney Rank Sum Test for continuous variables presented as Median [interquartile range]. Chest x-rays were graded using a scale from -1 (worsening), 0 (unchanged), and 1 (improved atelectasis). Overall and unit specific rates of improvement were compared using radiographic reports prior to, first, and second-day post CHFO therapy. Deterioration was combined with no change group then evaluated for improvement following 1 then 2 days of CHFO.
Results:
One hundred four patients were included in the study. Cardiac intensive care patients were, younger, had higher incidence of surgery, inhaled nitric oxide, higher set respiratory rates, and lower saturations (Table 1). Ninety patients (86%) had chest radiographs categorized as worsening or unchanged prior to CHFO therapy. The cohort had a 46.1% (41/89; P < .05) therapy response rate after day one and an additional 28.8% (10/48; NS) response rate in the group that did not demonstrate response after 1-day of therapy. No Difference was found between ICU groups, ventilator or blood gas measures.
Conclusions:
Continuous High-Frequency Oscillation Therapy was effective in treating atelectasis in intubated infants and children with documented atelectasis. Not response rate differences were found regarding ventilator settings or response rates in all-comers and between CICU and PICU. More study is needed to identify the longitudinal outcome benefits in the pediatric population.
Meeting report
Restricted accessMeeting reportFirst published October, 2019pp. 3235709-3235709
Timothy H. Roark, Don DePriest, Brian Moore , [...]
View All
Abstract
Background:
Kangaroo care (KC) is the valuable practice of holding a naked diaper-clad infant on the bare chest of a parent. High frequency jet ventilation (HFJV) is lung protective ventilation that is designed to minimize volume-induced injury to immature surfactant deficient alveoli. This type of ventilation requires one ventilator to deliver the Jet breaths and another ventilator to deliver the PEEP. Therefore, there are 2 circuits that are tethered to the already small endotracheal tube (usually 2.5 mm – 3.0 mm). This type of ventilation complicates the KC process because of the risk of an unplanned extubation (UE). Therefore, NICU’s Tiny Baby Workgroup composed of Physicians, Respiratory Therapists, Nurses and APP’s carefully developed a standardized method to provide KC to this population to reduce the risk of UEs.
Methods:
This is a Quality Improvement Observational Cohort Study, Retrospective Chart Review in which all premature infants (born 23.0-29.6 weeks gestation admitted to UK-KCH NICU who received HFJV from October 2017 to February 2019 were included. Comparison of neonates who received KC while on HFJV (Jet/KC) to those who did not receive KC while on HFJV (Jet/Non-KC). UE rates during KC on Jet-KC neonates was compared to UE due to other causes (poor ETT securement, repositioning, nursing care, emesis, agitation/spontaneous movement) in Jet/non-KC group. Chi-squared or Fisher’s exact tests were used to compare categorical variables.
Results:
Data was collected for a total of 34 extremely premature infants placed on HFJV between October 2017 and February 2019. Three neonates were excluded due to insufficient clinical information. Out of 61 neonates on HFJV, 20 neonates received KC (Jet/KC group), of which 4 had UEs during KC. There were 41 neonates in the Jet/non-KC group, of which 14 had UE due to other causes as mentioned in the Methods Section. There was no significant difference in the incidence of UE between the 2 groups (P = .56) using Chi Square analysis as a measure of association. Gestational age in weeks (24.9 ± 1.46 vs 25.7 ± 1.52, Mean ± SD, P = .06) and birth weight in grams (742.8 ± 225.14 vs 812.9 ± 234.27 Mean ± SD, P = .27) were comparable in Jet/KC and Jet/Non-KC groups respectively.
Conclusions:
This observational cohort study demonstrates that KC can be safely used with HFJV without significant risk of UE. KC while on HFJV did not result in an increase in UE in extreme prematurity compared to other causes.
Meeting report
Restricted accessMeeting reportFirst published October, 2019pp. 3236260-3236260
Ahmed Al Rajeh, Yousef Aldabayan, Abdulelah Aldhahir , [...]
View All
Abstract
Background:
The implementation of tele-health to support the management of COPD patients is increasing. Evaluating patients’ perception, acceptance, and adherence to different tele-health methods may contribute to improve the outcomes of tele-health and its efficacy, in the context that the effectiveness of tele-health in COPD remains inconclusive. We hypothesized that the level of acceptance of continuous overnight monitoring may vary with patient characteristics. Aim: To evaluate patients’ acceptance of continuous overnight home pulse-oximetry monitoring.
Methods:
A cross-sectional questionnaire study was conducted on COPD patients receiving overnight home pulse-oximetry monitoring as part of a research project at the Royal Free Hospital, London, UK. The questionnaire consisted of 10 questions across four domains: a) willingness to use the monitoring equipment, b) effect on sleep quality, c) convenience of the device, and d) charging preference. Patients’ responses were recorded using a visual analog scale that ranged from 0-10, where the anchor statement at 0 was strongly disagree and 10 was strongly agree. Total acceptability score is presented as mean (SD) as the data were normally distributed. Univariate and multivariate linear regression analyses were applied in order to identify patient characteristics associated with acceptability of use of the home pulse oximeter device. Ethical approvals were obtained from the UK Health Research Authority.
Results:
29 participants completed the questionnaire. 72% of participants were compliant with being monitored. Patients had an overall moderate acceptability score with a mean (SD) total score of 59.8 (± 12.6). The use of two multivariate regression models showed no statistically significant associations between patient demographics or their clinical measures and acceptability level. However, univariate linear regression showed that patients who had a higher Charlson comorbidity Index and those living alone had higher acceptability (P = .01, P = .02) respectively. There was no evidence of an association between compliance and patient acceptability of continuous overnight pulse oximeter monitoring (P = .12).
Conclusions:
There was good acceptance from COPD patients toward the use of home overnight monitoring devices. The majority of patients were willing to be continuously monitored if they thought it would benefit them, including and particularly patients who were living alone and had more comorbidity.
Meeting report
Restricted accessMeeting reportFirst published October, 2019pp. 3236318-3236318
Justin Scott Phillips, Lance Pingul Pangilinan, Edward Karim Saliba , [...]
View All
Abstract
Background:
The VOCSN (Ventec Life Systems, Bothell, WA) and Trilogy (Philips Respironics, Murrysville, PA) ventilators can deliver oxygen via low or high pressure sources utilizing different circuits. We evaluated and compared oxygen consumption from a high pressure gas source using the two ventilators with a null hypothesis that there would be no difference.
Methods:
The VOCSN and Trilogy ventilators were evaluated using a high pressure gas source (e-cylinders regulated to 50 psi) with both passive (constant leak) and active (exhalation valve) circuits connected to a TTL test lung (Michigan Instruments, Grand Rapids, MI). The three simulated TTL lung models were: normal - Cst 60 mL/cm H2O and Raw 5 cm H2O/L/s, restrictive - Cst 30 mL/cm H2O and Raw 5 cm H2O/L/s, and obstructive - Cst 60 mL/cm H2O, Raw 20 cm H2O/L/s. Using pressure ventilation modes, the peak pressure and rise time were titrated to achieve a tidal volume of 500 mL, as measured by a Certifier FA Plus (TSI Inc, Shoreview MN). Other settings include: frequency 12 breaths/min, PEEP 5 cm H2O and IT 1.0 second, set FIO2 of 0.40. Delivered FIO2 was measured by the Handi + oxygen analyzer (Maxtec, Salt Lake City, UT) at the lung inlet. In addition, the VOCSN pulse dose function was evaluated by titrating its oxygen flow to achieve an FIO2 of approximately 0.40. We measured the length of time to reduce e-cylinder pressure by 100 PSI for each lung model and test configuration, then calculated the liters of oxygen utilized per minute during each test run. A series of three tests were performed for all lung models and circuit configurations. Data for the three lung models were averaged for each test configuration and reported as the mean ± SD for both circuits.
Results:
Tidal volume delivery and measured FIO2 remained relatively constant during all lung models, test configurations and circuit types (501 ± 7 mL and 0.397 ± 0.01 respectively). Oxygen consumption using VOCSN with pulse dose oxygen delivery was 1.7 ± 0.7 and 1.7 ± 0.1 L/min, using VOCSN with set FIO2 was 4.8 ± 0.8 and 2.4 ± 0.1 L/min, and using Trilogy with set FIO2 was 5.2 ± 1.0 and 4.8 ± 0.9 L/min with passive and active circuits respectively.
Conclusions:
Oxygen utilization was lowest using the VOCSN ventilator with pulse dose oxygen delivery with both the passive and active circuits, and with VOCSN using a set FIO2 with the active circuit compared to the Trilogy 202 ventilator.
Meeting report
Restricted accessMeeting reportFirst published October, 2019pp. 3236819-3236819
Julie A Jackson, Lisa K Kingery, Sarah K Spilman , [...]
View All
Abstract
Background:
Nasal high flow (NHF) therapy is an option for respiratory support in patients with acute hypoxic respiratory failure. To reduce ICU-associated costs and ease ICU bed availability, a multi-phased, comprehensive implementation strategy was designed to make NHF available outside the intensive care unit (ICU) under the supervision of pulmonology or trauma providers in cooperation with a dedicated respiratory therapy (RT) team. This included initial rescue therapy in the Emergency Department (ED) or on medical-surgical floors. All ED and floor nurses received face-to-face education and interaction with the RT team in order to deliver concise, consistent education to nursing staff and alleviate concerns in caring for NHF patients. The purpose of this study was to evaluate the nurse education process for initiating NHF therapy outside of the ICU.
Methods:
Paper surveys were given to all nursing staff prior to education and included questions about familiarity and comfort regarding NHF and perceived impact on patient care. Six months later, nurses had the option to participate in a post-implementation electronic survey. All surveys were anonymous and approved by the Institutional Review Board (IRB) at the study hospital. Descriptive statistics were reported for continuous data as means and standard deviations (SD); categorical data were reported as counts and percentages.
Results:
Overall, 167 nurses were trained over a 15-month period and 250 patients received NHF in the ED or on medical-surgical floors. Nurse respondents (N = 145) averaged 7 years of nursing experience (SD = 9) and 38% had previously cared for a NHF patient. However, prior to education 38% of nurses were unsure if NHF would positively or negatively impact patient care. On post-implementation surveys (N = 40), 93% of nurses reported that NHF was beneficial to patients and 90% reported that NHF did not interfere with patient care.
Conclusions:
Introduction of a new therapy on general hospital floors is a challenge for any hospital, therefore it is critical to establish a strategy for education and implementation prior to initiation. Study findings revealed discomfort and uncertainty among nursing staff prior to caring for NHF patients. Our comprehensive and collaborative implementation plan improved comfort among nursing staff and allowed for appropriate and optimal care for hundreds of NHF patients outside the ICU setting.
Table 1. Pre-implementation survey data (N=145).
All Respondents
Age, mean (SD)
34 (11)
Years as nurse, mean (SD)
7 (9)
Years as nurse at study hospital, mean (SD)
5 (7)
Nurse for <1 year, n (%)
26 (18%)
Bachelor
76 (52%)
Familiar with humidified nasal high-flow (NHF) therapy, n (%)
59 (41%)
Previously cared for a patient placed on NHF, n (%)
55 (38%)
Comfort caring for a patient receiving NHF, n (%)
Very comfortable
21 (14%)
Somewhat comfortable
49 (34%)
Unsure
48 (33%)
Somewhat uncomfortable
17 (12%)
Very uncomfortable
10 (7%)
Impact of NHF on patient care, n (%)
Will dramatically improve patient care
36 (25%)
Will somewhat improve patient care
53 (36%)
Unsure
55 (38%)
Will make patient care somewhat more difficult
1 (1%)
Will make patient care much more difficult
0 (0%)
Meeting report
Restricted accessMeeting reportFirst published October, 2019pp. 3236842-3236842
Preterm infants are at risk to develop respiratory distress syndrome (RDS) due to insufficient production of surfactant. These preterm infants may require surfactant replacement therapy (SRT). Current modes to deliver SRT include the intubation, surfactant, rapid extubation technique (InSurE) and the less invasive surfactant administration (LISA) technique. LISA requires a small catheter for tracheal catheterization to deliver SRT while the patient remains on continuous positive airway pressure (CPAP) via a cannula, avoiding the need of positive pressure. We hypothesized no significant difference in number of surfactant doses would be required for LISA and InSurE techniques.
Methods:
A retrospective cohort analysis of aggregate patient data was conducted in a level III NICU, with IRB approval, from January 2018 to December 2018. Patient population included preterm infants at risk for RDS, <32 weeks, <1,300 g, any patient with respiratory failure requiring intubation and mechanical ventilation, or infants with meconium aspiration syndrome (MAS). Demographic information included: respiratory condition, method of surfactant delivery, doses required, respiratory support, gestational age (GA), and gender. A t-test was conducted using statistical software, SPSS 24 (IBM, Armonk, New York) with an alpha of .05 considered statistically significant.
Results:
Dosing was tracked as initial and second dose. Number of doses for LISA mean (SD) 1.0 (0.30) and InSurE mean (SD) 1.4 (0.35) were not statistically different (P = .45). Requirement of second dosing was similar for LISA and InSurE, P = .45 (Table 1).
Conclusions:
Number of surfactant doses was similar for LISA and InSurE administration methods. Adverse events and long-term effects related to LISA and InSurE surfactant administration, such as the impact of positive pressure, should be studied.
Meeting report
Restricted accessMeeting reportFirst published October, 2019pp. 3236861-3236861
Continuous albuterol delivered via large volume jet nebulizer (LVN) and aerosol mask is standard of care for status asthmaticus patients in our institution. Efficient aerosol delivery is dependent on properly fitting masks, which is difficult to maintain in children requiring continuous treatment. Recently, there has been interest in using high flow nasal cannula (HFNC) as an interface to deliver aerosol in children, but aerosol deposition data via this route is still evolving. The aim of this study was to compare continuous albuterol delivery between LVN with aerosol mask and vibrating mesh nebulizer (VMN) with HFNC in a simulated pediatric model.
Methods:
A lung model using a pediatric training manikin (TruCorp) with an anatomically correct airway of 6-year-old, was connected to a breathing simulator (ASL 5000, Ingmar Medical) via a collecting filter at the level of the carina simulating a spontaneously breathing child weighing approximately 20-25 kg (VT 150 mL, RR 28, I:E 1:2.5, Peak Insp Flow 23.8 L/min). 15 mg/h of albuterol was aerosolized for 3 hours per device. LVN setup: Per manufactures guidelines, a Flo-Mist (Smith’s Medical) LVN was filled with 9 mLs of albuterol (5 mg/mL) and diluted with 66 mL of normal saline for an output of 25 mL/h at 13 L/min and connected to a snug fitting dragon mask via 180-cm of large bore corrugated tubing. Output was verified prior to testing. HFNC setup: VMN (Aerogen Solo, Aerogen) was placed on dry side of humidifier (Fisher & Paykel 850) set at 37 C and connected to an infusion pump set to deliver 7.5 mL/h of albuterol (2 mg/mL) normal saline solution. Aerosol was delivered through adult breathing circuit (RT280) and Optiflow small adult cannula (OPT942) at 3 L/min, all by Fisher & Paykel. Circuit, nasal cannula size and flow were chosen based on previous bench study. Continuous nebulization was paused hourly to replace collection filters (n = 3). Drug was eluted from filters and assayed via spectrophotometry (276 nm). Dependent T-test used for statistical analysis.
Results:
The mean inhaled percentage of nominal dose delivered per hour was significantly greater with VMN and HFNC circuit (14.8% ± 0.7%) versus (3.17% ± 0.6%) with LVN and dragon mask (P < .001).
Conclusions:
In this simulated pediatric model, administration of continuous albuterol via VMN and HFNC lead to greater than 4-fold increase in albuterol delivery compared to LVN with aerosol mask.
Meeting report
Restricted accessMeeting reportFirst published October, 2019pp. 3237015-3237015
Use of high-flow nasal cannula (HFNC) as an interface to deliver aerosol has gained significant interest over the past few years. Recent studies have investigated factors influencing aerosol delivery in infant, toddler and adult models, however, data in older pediatric models is lacking. In older children, extra-large pediatric or small adult size HFNC cannulas may be appropriate, but cannula and circuit size may impact aerosol delivery. The aim of this study was to compare aerosol delivery using two different cannula and circuit sizes at varying flows in a simulated pediatric model.
Methods:
A pediatric training manikin (TruCorp) with an anatomically correct airway of a 6-year-old, was connected to a breathing simulator (ASL 5000, Ingmar Medical) via a collecting filter at the level of the carina to simulate a spontaneously breathing child weighing approximately 20-25 kg (VT 150 mL, RR 28, I:E 1:2.5, peak insp flow 23.8 L/min). Two HFNC configurations were tested; 1) Junior - Optiflow junior breathing circuit (RT330) + XL junior 2 nasal cannula (OJR418), and 2) Adult – adult breathing circuit (RT280) + Optiflow small adult nasal cannula (OPT942) all by Fisher & Paykel Healthcare. A vibrating mesh nebulizer (Aerogen Solo, Aerogen) was placed at the inlet of the humidifier (F&P 850) set at 37 C. 5 mg albuterol (2 mg/mL) was nebulized for each condition at nasal cannula flows of 3, 6, and 12 L/min (n = 3). Drug was eluted from filters and assayed via UV spectrophotometry (276 nm). Dependent T-test and One-way ANOVA used for statistical analysis.
Results:
Aerosol deposition was greatest at 3 L/min regardless of HFNC configuration, P < .05. At 3 L/min there was no significant difference in the inhaled dose between configurations (adult 12.6 ± 0.5% vs junior 10.1 ± 1.8%, P = .08). But, at 6 and 12 L/min, inhaled dose was greater in the adult versus junior configuration (10.5 ± 1.1% vs 6.5 ± 1.0%, P = .009) and (5.7 ± 0.3% vs 2.3 ± 0.6%, P = .001) respectively.
Conclusions:
In this simulated pediatric model, aerosol delivery through HFNC was greatest at lower flows regardless of HFNC configuration. At higher flows, aerosol deposition was significantly increased with the larger cannula and circuit.
Meeting report
Restricted accessMeeting reportFirst published October, 2019pp. 3237019-3237019
At our institution, respiratory therapists may be certified to perform endotracheal intubation in the adult population. Annual intubation certification includes both performing a certain number of successful endotracheal intubations as well as a passing a skills and knowledge test. Our practice has transitioned in the past few years from primarily using direct laryngoscopy to using video laryngoscopy. In the past, direct laryngoscopy was the main method available. Recently, our system placed a video laryngoscopy platform in all adult ICUs and Emergency Departments. We wanted to determine if respiratory therapists at our facility were more successful with endotracheal intubation when using video laryngoscopy.
Methods:
A retrospective review of intubation documentation by respiratory therapists was conducted for two different periods, January 2015 to December 2016 (direct - primary laryngoscopy type) and July 2017 to May 2019 (video - primary laryngoscopy type). Successful tracheal intubation versus unsuccessful tracheal intubation attempt were noted for each occurrence of intubation by a respiratory therapist. Data was also collected specifically for video versus direct laryngoscopy from January 2019 to May 2019, when video vs direct was added to the electric medical record as a discreet data element.
Results:
See data table for success rate during the time when direct (Jan 15-Dec 16) and video (Jul 17-May 19) were the primary type of laryngoscopy. Success rate increased 8% from 86% to 94% when video laryngoscopy became the primary type. The table also includes discreet data from January 2019 to May 2019 comparing video versus direct success rate. Video is currently used 3 times more frequently than direct (100 vs 32) and has a success rate 8% higher than direct.
Conclusions:
The success rate of a respiratory therapists certified in endotracheal intubation increased 8% when video laryngoscopy became readily available in our system. With both types currently available, respiratory therapists opt to use video laryngoscopy three times more frequently.
Laryngoscopy Type Data
PRIMARY LARYNGOSCOPY TYPE BY PERIOD
n
Success Rate, %
DIRECT - Primary Type (Jan15-Dec16)
554
86%
VIDEO - Primary Type (Jul17-May19)
485
94% *
COMPARISON OF VIDEO AND DIRECT (Jan19-May19)
Video Laryngoscopy
100
96%
Direct Laryngoscopy
32
88% **
*p<0.05, **p=0.07
Meeting report
Restricted accessMeeting reportFirst published October, 2019pp. 3237140-3237140
Christopher Chambers, Ryan Kessler, Valerie Riss , [...]
View All
Abstract
Background:
Heated high-flow nasal cannula (HFNC) has been used for treatment of bronchiolitis. Traditionally, HFNC was restricted to the ICU setting. The objective of this study was to assess implementation of HFNC at a small academic institution within a large adult hospital without dedicated respiratory therapists.
Methods:
In 2017, guidelines were developed to initiate HFNC for bronchiolitis treatment on the general pediatrics floor. Initiation of flow using Fisher & Paykel Opti-flow Jr nasal cannula was based on age (10 L/min for >90 days, 8L/min for <90 days). A retrospective chart review was conducted on patients ≤24 months old who were hospitalized from 2015-2019 with bronchiolitis and received HFNC.
Results:
Retrospective chart review was conducted on 244 patients and final analyses were conducted on 145 patient charts that met criteria; 71 patients pre HFNC implementation and 74 patients post. After implementation of HFNC on the floor, fewer patients were directly admitted to the PICU (38% post vs. 59% pre; P = .02) and fewer patients were intubated with more using CPAP (13% intubated pre vs.3% post; 20% CPAP pre vs. 39% post; P = .02). Patients were on HFNC for similar amount of time (46 hours pre vs. 43 hours post; P = .33) however, HFNC was started earlier in the hospitalization (post 5 hours vs 10 hours pre; P = .01) and at higher flows (1.3 L/kg post vs. 1.0 L/kg pre, P = .01). There was a decrease in LOS, although not statistically significant (5.7 days pre vs. 4.7 days post, P = .17). Hospital charges decreased following implementation ($22,662 post vs. $32,853 pre, P = .002). There were no severe adverse outcomes including pediatric codes, or intubations. Three patients had aspiration events, one requiring PICU transfer and eventually CPAP initiation.
Conclusions:
Our institution is a smaller academic center without a dedicated respiratory therapist to our unit or pediatric specialized RTs. HFNC was able to be implemented on our general pediatrics floor safely with some benefits including decrease intubations, trend towards shorter LOS, and decrease hospital charges for children hospitalized with bronchiolitis on HFNC. More research is needed to determine the impact of early initiation of HFNC on intubation rates and cost/benefit analysis of the increased use of HFNC nationwide over the past few years.
Table 1
Variable
Pre-Implementation
Post-Implementation
P-Value
Direct to PICU
42 (59%)
28 (38%)
0.01
Length of Stay (Days
5.7 (4.0)
4.7 (4.6)
0.17
Time on Floor Prior to Transfer (Hours)
16(17)
19 (21)
0.56
Urgent Transfers (<10 Hours on floor)
14(48%)
14.7 (47%)
0.9
Emergent Transfers (<2 hours on floor)
3 (10%)
2 (7%)
0.61
Time to Initiation of HFNC (Hours)
10 (10.1)
5 (13.0)
0.0125
Time on HFNC (Hours)
46 (38.7)
54 (54.9)
0.33
Antibiotics
39 (55%)
43 (58%)
0.7
CXR
51 (72%)
45 (58%)
0.16
Albuterol
44 (62%)
39 (53%)
0.26
Steroids
25 (35%)
21 (28%)
0.38
Blood Gas
48 (68%)
42 (57%)
0.18
Flow initiation HFNC (L/Kg)
1.0 (0.42)
1.3 (0.44)
0.0001
Flow Max HFNC (L/Kg)
1.2 (0.5)
1.5 (0.4)
0.0001
Max Respiratory Support Required
Initial HFNC
26 (37%)
25 (34%)
0.018
Increased HFNC
22 (31%)
18 (24%)
CPAP
14 (20%)
29 (39%)
Intubation
9 (13%)
2 (3%)
Charge comparison (All Patients)
$34,925 ($26,914)
$28,169 ($49,122)
0.3
Charge Comparison (2 Outliers removed)
$32,853 ($20,744)
$22,663 ($17,198)
0.002
Meeting report
Restricted accessMeeting reportFirst published October, 2019pp. 3237550-3237550
Kelly Fiorino, Carissa Novak, Christopher Culter , [...]
View All
Abstract
Background:
The time-controlled adaptive ventilation (TCAV) protocol for APRV states that Thigh should be 90% of the respiratory cycle and Tlow should transition to Thigh at 75% of the peak expiratory flow (PEFR). Respiratory care practitioners (RCPs) use ventilator graphics to set Tlow, but accuracy and consistency could be RCP dependent. A possible solution is to allow the ventilator to set Tlow based on a PEFR% target, such as the AutoRelease feature on the Dräger Infinity V500. The study aimed to compare RCP-set Tlow (RST) and AutoRelease Tlow (AR) at 75% PEFR at varying levels of compliance and Phigh.
Methods:
Participants were 25 RCPs from Michigan Medicine adult ICUs. A V500 ventilator was attached to a lung simulator (Michigan Instruments TTL). The ventilator was initially set to: Phigh 25 cm H2O (P25), Plow 0 cm H2O, Thigh 4 s, Tlow 1 s, FIO2 1.0, and Slope 0.2 s. In the experimental group, the RCP adjusted Tlow to achieve an end expiratory flow of 75% PEFR at compliances of 30 (C30) and 50 (C50) mL/cm H2O. Tlow was set back to 1 s, Phigh was set to 35 (P35) cm H2O, and the test was reproduced at C30 and C50. In the control group, AutoRelease was set at 75% for each condition and Tlow was noted. Data was summarized in SPSS. Total PEEP (PEEPtot) was measured post hoc for each condition at the average AutoRelease Tlow and the min and max RCP-set Tlow .
Results:
Mean ± SD Tlow for RST vs AR at C30/P25: 0.56 ± 0.1 vs 0.63 ± 0.0, P < .01; C30/P35: 0.66 ± 0.1 vs 0.72 ± 0.0, P < .01; C50/P25: 0.82 ± 0.1 vs 0.95 ± 0.0, P < .01; and C50/P35: 0.92 ± 0.2 vs 1.1 ± 0.0, P < .01. When pressures were averaged for a given compliance, mean ± SD Tlow for RST vs AR at C30/P25 and P35: 0.61 ± 0.1 vs 0.68 ± 0.0, P < .01; C50/P25 and P35: 0.87 ± 0.1 vs 1.0 ± 0.0, P < .01. When compliances were averaged for a given pressure, C30 and C50/P25: 0.69 ± 0.1 vs 0.79 ± 0.0, P < 0.01; C30 and C50/P35: 0.79 ± 0.1 vs 0.90 ± 0.0, P < .01. PEEPtot for AR vs RST max and min at C30/P25: 8.9 vs 7.5-13.1; C30/P35: 12.8 vs 8.6-18.0; C50/P25: 10.4 vs 9.8-14.4; C50/P35: 14.6 vs 13.4-22.5.
Conclusions:
RST was statistically significant when compared to AR at each condition of compliance and Phigh . Changing the compliance and the Phigh independently yielded statistically significant results between methods of setting Tlow. The differences in Tlow may be clinically important in that PEEPtot varied widely between those associated with AR and the RST min and max. A clinical trial should be conducted to determine the clinical impact.
Meeting report
Restricted accessMeeting reportFirst published October, 2019pp. 3237595-3237595
Similar to most healthcare providers, many respiratory therapists are wanting to advance into leadership roles. However, there are not clear guidelines on what competencies are most desired for future respiratory care managers. The aim of this study was to determine what competencies and education are most desired for future respiratory care managers.
Methods:
Survey Monkey was used to conduct an online survey for this study, exempt by A.T. Still University IRB. The sample was recruited by the Texas Society for Respiratory Care and clinical affiliates of Midwestern State University. The on-line survey was replicated with modifications from a previous survey. Upon completion of modifications the survey was pilot tested with various peers in respiratory care and past respiratory care directors. The survey was used with permission granted from Robert M. Kacmarek. The quantitative data were analyzed and consisted of descriptive statistics and inferential statistics. Responses were separated based on positions held by participants then further divided into groups of small and large hospital sizes. Hospitals were separated into small sized, less than or equal to 299 beds, and large sized, 300 or more beds. Independent t-tests were used to determine whether there was a difference in the competencies and qualities desired for future respiratory therapy managers between small and large hospitals. A two-tailed test was considered statistically significant with a P -value less than .05. The open-ended questions were also analyzed to determine if common themes existed.
Results:
Forty-seven responses were received and all responses were used for the study. The desired education for future managers was a baccalaureate degree (63%) and the recommended education level was also a baccalaureate degree (65%). The most desired skill competencies are patient assessment (92%) and critical care (92%). The most desired leadership competencies are team contribution (89%) and written and verbal communication (89%). The desired competencies did not vary much across facility sizes.
Conclusions:
The facility size does not really affect the desired competencies for future respiratory managers. The majority of the participants selected a baccalaureate degree as the preferred level of education because it shows the desire for advanced knowledge. The skill and leadership competencies selected appear to be desired to improve patient care and team dynamics. Disclosures: None.
Skill and Leadership Competencies Expected
Meeting report
Restricted accessMeeting reportFirst published October, 2019pp. 3237642-3237642
Indoor cooking practices, such as cooking indoors with a coal or wood stove without a pipe, are linked to higher carbon monoxide levels and lower peak flow measurements compared to cooking with an outside stove or a stove with a ventilation pipe. However, little is known about the differences across cooking practices, carbon monoxide levels, and peak flow measurements across countries. The purpose of this study is to determine differences in indoor cooking practices and vital signs across two middle-income countries, Dominican Republic and Nicaragua.
Methods:
This study used pooled data from both Nicaragua (n = 76) and Dominican Republic (n = 62). Participants were randomly selected from households in rural villages in the two countries. Descriptive statistics were computed among demographic, environmental, and behavioral characteristics across the two countries. Additionally, chi-square tests and independent samples t-tests were conducted to determine statistically significant differences between the two countries. The institutional review board approved this study.
Results:
Among all participants (n = 138), approximately half lived in Nicaragua (n = 76, 55.1%) and half lived in Dominican Republic (n = 62, 44.9%). A higher percentage of Dominican Republic participants reported using an inside cook stove (55.4%) compared to Nicaraguan participants (11.8%), which was statistically significant (P < .0001). The overall smoking prevalence in each country was low (9.2% in Nicaragua and 4.8% in Dominican Republic). There were no statistically significant differences in blood pressure, but there were statistically significant differences in SpO2 measurements between Nicaragua and Dominican Republic (98.3% vs. 99.4%, respectively). While these were statistically significant, these two measurements were not clinically significant. Finally, there were statistically significant differences in peak flow measurements, with Nicaraguan participants having a lower mean peak flow (260.6) compared to Dominican Republic participants (327.4). No differences were found between carbon monoxide levels.
Conclusions:
Differences between indoor cooking practices, peak flow measurements, and SpO2 measurements were found between Nicaragua and Dominican Republic. Future studies should examine a broader range of contextual and behavioral factors related to carbon monoxide and peak flow measurements in the two countries. Disclosures: None; Sponsored Research: None.
Meeting report
Restricted accessMeeting reportFirst published October, 2019pp. 3237700-3237700
Christopher Allen Culter, Andrew Weirauch, Ronald Dechert , [...]
View All
Abstract
Background:
Electrical impedance tomography (EIT) noninvasively monitors the degree and distribution of ventilation. We examined the effects of 2 ventilators (Respironics V-60 (D1) and Dräger V-500 (D2)) at various pressure levels. We hypothesized that tidal distribution of ventilation (TID) and end-expiratory lung impedance (EELI) will not differ when NIV is applied via different devices. Also, with increasing pressures, the lung volume distribution will shift from ventral to dorsal regions.
Methods:
After IRB approval was obtained 20 healthy volunteers were studied. A Dräger Pulmovista EIT device was used. The thoracic electrode belt was placed at the 5th ICS level; subjects were placed in semi-fowlers. After a short stabilization period, an oro-nasal mask was applied. At each pressure setting a 5-minute period of analysis (3-minute stabilization; 2 minutes of analysis) was performed. The mask was removed to allow the subject to return to baseline between devices. The main measures were the global and regional (ventral, dorsal) TID and the global and regional EELI. TID values represent the percent of ventilation in that area. EELI baseline is assumed to be 0 and other measures represent a percent change relative to baseline. Repeated measure ANOVA was used to compare groups.
Results:
Global TID for D1 vs D2 at baseline: 100 + 0 vs 100 + 0, CPAP5: 102 + 16 vs 109 + 22, PS 5/CPAP5: 132 + 40 vs 118 + 33, PS5/CPAP 10: 129 + 47 vs 126 + 46. Ventral TID for D1 vs D2 baseline: 43 + 14 vs 43 + 13, CPAP5 43 + 13 vs 48 + 21, PS5/CPAP5: 62 + 22 vs 57 + 26, PS5/CPAP10: 67 + 33 vs 60 + 25. Dorsal TID for D1 vs D2 baseline: 57 + 14 vs 57 + 12, CPAP5: 59.0 + 19 vs 61 + 18, PS5/CPAP5: 69 + 31 vs 62 + 22, PS5/CPAP10: 71 + 40 vs 67 + 33. Global EELI for D1 vs D2 baseline: 0 + 0 vs 0 + 0, CPAP5: 47 + 28 vs 71 + 69, PS5/CPAP5: 54 + 33 vs 61 + 54, PS5/CPAP10: 135 + 63 vs 141 + 101. Regional TID device data was combined for ventral vs dorsal at baseline: 43 + 13 vs 57 + 13, CPAP5: 45 + 16 vs 60 + 17, PS5/CPAP5: 60 + 21 vs 65 + 23, PS5/CPAP10: 58 + 17 vs 69 + 33. Regional EELI device data was combined for ventral vs dorsal at baseline: 0 + 0 vs 0 + 0, CPAP5: 42 + 28 vs 17 + 18, PS5/CPAP5: 42 + 25 vs 15 + 16, PS5/CPAP10: 97 + 53 vs 41 + 31.
Conclusions:
When using EIT to monitor lung volume distribution there was no statistical difference between devices. As pressure increased, the lung volume distribution did not shift from ventral to dorsal but rather increased in both areas to a similar degree.
Meeting report
Restricted accessMeeting reportFirst published October, 2019pp. 3237720-3237720
Indoor coal or wood stoves have been associated with high carbon monoxide levels and reduced peak flow measurements. The purpose of this study is to determine the associated factors related to carbon monoxide levels and peak flow measurements among participants in Dominican Republic.
Methods:
This study is based on data collected in March 2019 among participants in rural Dominican Republic (n = 62). This study was approved by the ethical board. Individuals were randomly selected from predetermined towns by randomly sampling households. Descriptive statistics were computed among behavioral and environmental factors, carbon monoxide levels and peak flow measurements. Linear regression was conducted to determine the associated factors associated with two outcomes: carbon monoxide levels and peak flow measurements.
Results:
Among all participants (n = 62), the majority were females (59.0%), had a mean age of 46.9, used wood or coal cookstove (63.9%), and used an inside stove (55.4%). The mean carbon monoxide level was 4.24%, and the mean peak flow was 327.4. For the carbon monoxide multivariable model, none of the predictors were statistically significant (age, gender, wood or coal vs. gas stove, and cook stove location). For the peak flow multivariable model, being female was statistically significantly associated with reduced peak flow levels (Est: -135.10, P = .0002), after adjusting for other covariates. Cook stove material and location were not associated with either carbon monoxide levels or peak flow measurements.
Conclusions:
Future studies should examine a broader context of behavioral factors associated with indoor cooking practices among this population Disclosures: None; Sponsored Research: None.
Meeting report
Restricted accessMeeting reportFirst published October, 2019pp. 3237766-3237766
Implementing interdisciplinary simulation experiences (ISE) into the curriculum of healthcare students often increases one's exposure to real-life scenarios while allowing educators the opportunity to utilize experiential learning strategies. These experiences also increase the quality and continuity of care and allow students the opportunity to develop teamwork, leadership, and communication skills. The purpose of this study was to measure the potential gain in these three skills through the use of ISE by assessing student perceptions and outcomes.
Methods:
Following IRB approval, 104 health science students from the respiratory care, nursing, and radiology programs at Midwestern State University were divided into two equal groups, the control group (CG) and the experimental group (EG). Within the study, the CG completed a pre and post survey but was not exposed to the ISE. The EG completed the pre-survey, took part in the ISE, and completed the post-survey. Both surveys were conducted to measure the students’ understanding of leadership, teamwork, and communication skills while determining if any significant differences were found after the exposure to the ISE. The results from the EG and the CG were evaluated to establish any significant differences between the two groups of students.
Results:
Based on pre-survey data obtained through independent samples t-tests, students from the EG and the CG had similar existing knowledge of all three skills: (leadership) EG (M = 4.65) and CG (M = 4.69), (t [102] = 0.31, P > .05); (teamwork) EG (M = 4.48) and CG (M = 4.48), (t [102] = 0, P > .05); (communication) EG (M = 4.88) and CG (M = 4.87), (t [102] = 0.29, P > .05). According to post-survey data, students that participated in the ISE had a better understanding of leadership, teamwork, and communication than those students that did not participate: (leadership) EG (M = 4.87) and CG (M = 4.65), (t [102] = 2.14, P < .05); (teamwork) EG (M = 4.83) and CG (M = 4.52), (t [102] = 3.08, P < .01); (communication) EG (M = 4.98) and CG (M = 4.83), (t [102] = 2.73, P < .01).
Conclusions:
According to the results, both groups had similar pre-existing knowledge of leadership, teamwork, and communication skills prior to the ISE. In contrast, according to the post-experience survey results, students that participated in the ISE exhibited far better understanding of leadership, teamwork, and communication skills than those that did not participate in the ISE.
Meeting report
Restricted accessMeeting reportFirst published October, 2019pp. 3237809-3237809
Robert Norton, Nikhil Chandravel, Deanna Taylor , [...]
View All
Abstract
Background:
There are approximately 3,000 confirmed diagnoses of primary ciliary dyskinesia (PCD) in North America. Delayed or missed diagnosis of PCD, due in part to limitations of available diagnostic tests, is quite common and approximately 25,000 Americans are estimated to have undiagnosed PCD. Nasal nitric oxide (nNO) measurement is a validated, noninvasive test that is recommended by the American Thoracic Society (ATS) and the PCD Foundation for PCD screening. Due to the paucity of centers capable of screening for PCD within our region, the Respiratory Therapy (RT) Research Team and the Pediatric Pulmonary Division of the Children’s Hospital of Richmond sought to establish an nNO measurement program and hypothesized that it could be successfully directed by RTs at our facility and used to improve PCD screening.
Methods:
An institutional review board (IRB) approved research protocol for nNO measurement from subjects over three years of age with a clinical phenotype for PCD was established by the RT Research Team. Dedicated RTs were trained in study screening, nNO measurement using the Sievers 280i NOA device, and interpretation of nNO results according to ATS guidelines. Per those guidelines, two measurements greater than two weeks apart with an nNO < 77 nL/min is considered positive for PCD. Results were included in a REDCap secure database for monitoring PCD within our region and used by the clinical team for guiding treatment.
Results:
Within the first 90 days of the program, nNO measurements were conducted in eight subjects suspected of having PCD with only one measurement failure during a second visit of a subject. Three subjects were positively screened for and subsequently diagnosed with PCD. Table 1 includes descriptive statistics of those screened. Screening has since expanded beyond the Pediatric Pulmonary Medicine Service and now includes Adult Pulmonary Medicine and Allergy, Asthma, and Immunology Services.
Conclusions:
Development of an RT-directed nNO measurement program for PCD screening has been successful at our facility. This program has led to successful screening of eight subjects in its first quarter of operation and confirmed diagnosis of three subjects. This study was designed to not only improve monitoring, diagnosis and treatment of PCD regionally but to also serve as a model for other centers. Future aims include working with other centers to develop similar RT-directed programs and improve PCD screening internationally.
Table 1 - Descriptive Statistics
#
Age (years, Average, Max/Min)
11.8, 18/7
Female
7
Male
1
nNO (nL/min, Average, Max/Min)
125.3, 260.5/5.5
Positive nNO for PCD
3
Meeting report
Restricted accessMeeting reportFirst published October, 2019pp. 3237863-3237863
Previously no device existed to manage partial occlusions of the neonatal endotracheal tube (ETT). Suctioning with or without lavage could be used with potential consequences of the lavage. An ETT that is partially obstructed and causing difficult ventilation would require elective or emergent reintubation as the only option. A new device has been designed to clear the ETT lumen of secretions causing a partial obstruction. We wanted to determine if this new device could clean the neonatal ETT lumen after secretions had partially occluded the tube.
Methods:
A bench study was performed to test the new device (Restore Neonate, endOclear LLC) to clean neonatal ETTs. A Drager VN500 with pressure-controlled settings was connected to an ASL 5000 test lung via an ETT. Three sizes of ETTs were tested: 2.5, 3.0 and 3.5 with a sequence of 3 partial occlusions each. The occlusions were created with simulated mucus (a propylene glycol mixture that was colored blue and was within the published range of human mucus viscosity). The occlusions were created by depositing 0.25 to 0.75 mL of simulated mucus until there was a brief airway occlusion as noted on the ventilator. A single pass of the catheter was used to clear the ETT each time. Flow-volume loops as well as breath to breath resistance measurements from the ventilator were used to evaluate effectiveness of the device to clean the ETT lumen.
Results:
Average ventilator resistance measurements (cm H2O/L/s) from the 3 simulated occlusions for each of the ETT were as follows. Size 2.5 ETT resistance measurements: 130-new ETT, 175-partial ETT occlusion, 135-post ETT cleaning. Size 3.0 ETT resistance measurements: 106-new ETT, 206-partial ETT occlusion, 108-post ETT cleaning. Size 3.5 ETT resistance measurements: 87-new ETT, 190-partial ETT occlusion, 86-post ETT cleaning. See figure for a representative set of flow-volume loops for the new ETT, the partial occlusion and the ETT after cleaning.
Conclusions:
The Restore Neonate appears to have fully recovered the lumen of the neonatal ETT in our bench study with a partial occlusion of simulated mucus as evidenced by resistance measurement returning to values similar to the new ETT as well as the flow-volume loops returning to the same shape as the new ETT. This new device may be valuable for cleaning the ETT of neonates instead of having to reintubate when partial obstructions occur.
Flow-volume loops displaying: new ETT, simulated partial occlusion and after cleaning of the ETT
Meeting report
Restricted accessMeeting reportFirst published October, 2019pp. 3237884-3237884
Amanda S. Albee, Denise Lauderbaugh, Kirsten Turner , [...]
View All
Abstract
Background:
Inadequate hand-off communication contributes to an estimated 80% of serious medical errors. Adverse events such as care omissions, inappropriate orders, inefficacy of work and patient harm can be attributed to miscommunication during hand-offs. This project aims to improve the hand-off communication of respiratory therapists at a pediatric facility by implementing specific hand-off strategies. The literature reviewed indicates performing hand-offs at the bedside and creating standardized expectations for staff to follow improves both communication and safety.
Methods:
An IRB approved study to improve hand-off communication amongst respiratory therapists with specific implementations for this initiative including: the creation of a team of role models, increasing staff education through skills fairs with knowledge based assessments, a specifically designed electronic medical record (EMR) hand-off tool, changing the location for staff to perform the hand-off to the patient’s bedside and providing staff EMR access. Chi-squared was used for statistical analysis.
Results:
Post-data analysis showed 100% compliance with respiratory therapists visualizing the patient and the ventilator during hand-offs while following the new standards. Prior to project implementation 6 ventilator related errors were reported through the Real Learning Systems incident reporting system. Post project implementation, 0 ventilator related errors were reported (P = .40). Staff perception that errors were “never” found increased from 0% (n = 17) before implementation to 33.3% (n = 12) after implementation (P = .01). No increases in overall staff overtime utilization were noted. An 11% reduction of incremental overtime utilization was noted post analysis which may indicate the new hand-off standards were actually more efficient than previous practices. Pre and post staff satisfaction surveys showed an improved perception of patient safety.
Conclusions:
Hand-off communications directly affects patient safety. Standardizing the critical content to be communicated while directly visualizing the patient during the hand-off process can decrease the number of ventilator incident discrepancies and help prevent data omission errors. Standardizing hand-off communication to promote patient safety can be achieved without increasing handoff duration. Disclosures: William Hearst Foundation
Meeting report
Restricted accessMeeting reportFirst published October, 2019pp. 3237904-3237904
Kristina Ramirez, Calandra D Snowden, David Hunt , [...]
View All
Abstract
Background:
ARDS is characterized by a refractory hypoxemia associated with a mortality rate as high as 40%. Ventilation in the prone position has been suggested to improve lung mechanics, gas exchange, and mortality rates in ARDS. Proning promotes a better distribution of perfusion and ventilation that often results in significant improvement of oxygenation. Although the PROSEVA trial has suggested that the prone position should be maintained for a minimum of 16 hours, clinical observations reveal variations from the recommended protocol. The primary goal of this study was to determine if the prone positioning protocol recommended at the PROSEVA trial was followed in a group of adult patients with ARDS admitted to the ICU. Institutional IRB was obtained.
Methods:
Retrospective chart review at a university affiliated hospital at a large metropolitan city in San Antonio, TX. Patients included in the study were intubated and mechanically ventilated (>18 and < 85 y old), diagnosed with ARDS. Patients with thoracic surgery, rib or pelvic fractures or unstable spine were excluded. Ventilator parameters, blood gases, oxygen indices and pulmonary mechanics were collected prior, during and post intervention were collected. During the intervention, the study recorded interruptions, complications, and changes in proning position to include rotation or tilt that may impact or disrupt the utilization of prone positioning. Institutional IRB approved the study.
Results:
Eight patients admitted to the ICU and ventilated were placed on a proning protocol and included in this study. The most frequent mode used prior to the initiation of proning was pressure control ventilation (PCV). Mean FIO2 during proning was 81.3% (± 17.3; range: 60-100). Mean PaO2/FIO2 prior to proning was 83.99 (± 26.31). Proning was implemented for < 8h in two patients; >8 but <16h in 6 patients (75%). Mean PaO2/FIO2 during proning increased to 117.24 (± 62.52; P = .09). Proning was either terminated, or the related information was not fully documented due to the decisions to offer patient the palliative care, transfer the patient, withdrawal of care, or death.
Conclusions:
Despite the association between proning implementation and improvement in oxygenation, this pilot project suggests that the PROSEVA protocol of at least 16 hours of prone positioning was not followed. This pilot study demonstrated the need for improved documentation for initiation and discontinuation of prone positioning.
Meeting report
Restricted accessMeeting reportFirst published October, 2019pp. 3237909-3237909
Kristina Ramirez, Thomas Stokes, Kevin Yeh , [...]
View All
Abstract
Background:
Tidal volume (VT) selection for patients undergoing mechanical ventilation continues to be a controversial issue. While ideal body weight (IBW) has been recommended to calculate the VT in adults, actual body weight (ABW) is often used for both children and adults. The purpose of this study was to determine if the VT selection (based on IBW or ABW) was consistent with a lung protective strategy (<8 mL/kg).
Methods:
Retrospective chart review using EMRs of pediatric and adult patients admitted to a medical and pediatric ICU. Patients less than 1 year of age, patients undergoing non-conventional modes of ventilation (airway pressure release ventilation [APRV], high frequency oscillatory ventilation [HFOV], high frequency jet ventilation [HFJV]) or extracorporeal membrane oxygenation (ECMO) were excluded from the study. Demographic information, vital signs, arterial blood gases, and ventilator parameters upon admission to ICU (FIO2, VT, PEEP) were collected. A VT of 8 mL/kg was defined as protective for comparison and analysis. Instituional IRB approved the study.
Results:
Data was collected from 141 patients (30 children; 111 adults) admitted to the ICU between January of 2016 and March of 2018. Mean pediatric age was 7.3 (± 5.8) years and for adults was 46.6 (± 25.7) years, 44% were female (n = 62) and 56% were male (n = 79). Mean PaO2/FIO2 (PF) ratio in adults was 213, while mean pediatric PF ratio was 278. The ABW was used as IBW in the pediatric group. Mean adult ABW was 56.4 (± 46.2) kg, while mean pediatric actual weight was 29.1 (± 23.9; IQR 25-75: 11.0-49.3) kg. Mean VT was 8.36 (± 3.64) and 7.64 (± 2.55) mL/kg when ABW was used for adult and pediatric patients, respectively (P = .15). Mean adult IBW was 64.0 (± 12.52; IQR 25-75: 52.27-75.45) kg, while mean pediatric ABW was 29.14 (± 23.93; IQR 25-75: 5.3-8.2) kg. When using IBW, the mean VT set for adult patients was 7.19 (± 1.51; range 6.16-10.68; IQR 6.18-8.11) mL/kg and was not significantly different from VT set in pediatric patients (P = .10). However, ten pediatric patients (33.3%) and 42 adults (37.8%) were set on a VT > 8 mL/kg.
Conclusions:
This retrospective chart review demonstrates that while the mean VT selected for these patients was less than 8 mL/kg, a large number of patients received a VT considered outside the range considered as lung protective. Published scientific data suggests evidence that using VT outside the range considered as lung protective is unsafe.
Meeting report
Restricted accessMeeting reportFirst published October, 2019pp. 3237925-3237925
Using simulations as a teaching method for respiratory care students is a growing trend among respiratory care programs. The purpose of this study was to examine whether or not students who participate in simulations during their time in a respiratory program have improved test scores and pass rates, increase confidence, and enhance critical thinking skills. The graduates who participated in simulations underwent a change from the traditional teaching method to a flipped classroom style of teaching. Additionally, these same graduates took the NBRC exam which was updated in 2015.
Methods:
A 10 question survey was sent to graduates from the years 2012 through 2017 of a respiratory care program. The graduates from the years 2012, 2013 and 2014 were not actively involved in simulations as part of the education. The graduates from years 2015, 2016 and 2017 were scheduled multiple simulation days each semester as part of the clinic course. The graduates from the classes that were involved in simulations were asked if they believed participation in simulations increased confidence, as well as critical thinking skills, while the graduates that were not involved in simulations were asked if they felt simulations would have increased confidence and critical thinking skills. Additionally, information was obtained from the NBRC regarding graduates from this program that graduated in the years stated above. Information assessed included year graduated and graduates’ credentials.
Results:
Survey results revealed graduates who participated in simulations felt it increased their confidence as well as critical thinking skills; whereas the graduates who did not participate in simulations felt that participating would have increased their confidence and critical thinking skills. The NBRC results revealed the following information: of the graduates that participated in simulations, 21% are CRT, 61% are RRT and 18% are not credentialed. Of the graduates that did not participate, 23% are CRT, 54% obtained the RRT credentials and 23% are not credentialed.
Conclusions:
The use of simulations as a teaching tool in respiratory care programs, not only improves NBRC exam pass rates, but also increases confidence and critical thinking skills in respiratory care students.
Meeting report
Restricted accessMeeting reportFirst published October, 2019pp. 3237932-3237932
Megan Carrion, Crystal D Garza, Sonia Quintanilla , [...]
View All
Abstract
Background:
APRV is a mode of ventilation designed to manage patients with refractory hypoxemia, particularly when other modes of ventilation fail. Despite its potential benefit, there is limited research that has evaluated the best initial settings, leading to confusion and doubts about the mode amongst practitioners. The purpose of this study was to determine if APRV is currently implemented according to established protocols.
Methods:
A retrospective chart review from patients admitted to ICUs at a 496-bed university-affiliated institution in San Antonio, between 2017 and 2019. This study was approved by the institutional IRB. The four main APRV parameters (Phigh, Plow, Thigh, Tlow) were documented and compared to current recommendations.
Results:
The mean age of the 11 patients selected for the study was 53 years (± 12.1). Most patients (63%) and were transitioned to APRV from PRV and were on APRV for an average of 30 hours (1-130). These patients had a mean PaO2 of 91.7 (± 42.5) mm Hg, FIO2 of 77.5% (± 20.9%), P/F ratio 110.2 (± 92.0), OI 26.2 (± 24.2), PIP of 27.5 cm H2O (± 9.32), PEEP of 14.2 cm H2O (± 4.9), and MAP 21.5 (± 9.0). Pplat was not recorded in the majority of patients prior to APRV. The mean values for APRV parameters obtained were P High 29.8 cm H2O (± 4.4; range 18-37), P low 3.13 cm H2O (± 1.57; range 0-15), T High: 4.11 s (± 0.72; range 3.0-5.2), and T Low: 0.59 s (± 0.18; range 0.3-1.0). Ventilator settings on APRV were maintained prior to switching back to conventional modes except mead pressures were and FIO2 were 10% lower. The oxygenation improved dramatically with a mean PaO2 of 178 and the OI decreasing almost 50% (26.2 vs 14.4). These improvements in PaO2 and OI did not reach statistical difference (P = .06 and .08, respectively). The use of the APRV mode was discontinued due to of improved oxygenation in two patients, worsening of ventilation in one patient, a worsening overall condition in one patient, and no documented reasons in the remaining seven patients.
Conclusions:
When selected, most APRV parameters were set in a similar fashion to recommended protocols. APRV was associated with improvement in oxygenation. A larger number of patients and evaluation at different institutions is necessary to evaluate how consistently suggested protocols are utilized and if a similar oxygenation response is attained.
pH
PaCO2
PaO2
HCO3-
BE
SaO2
Prior to APRV
7.30
54.3
91
26.5
-.2
90.4
While on APRV
7.37
48.7
162
28
2.5
94.8
ABG values before and while on APRV
Meeting report
Restricted accessMeeting reportFirst published October, 2019pp. 3237949-3237949
Maria Madden, Jennifer Gazda, Penny Andrews , [...]
View All
Abstract
Background:
The rapid shallow breathing index (RSBI) is a measurement that may be used to predict successful extubation and liberation from mechanical ventilation. The original study used a T-piece during a spontaneous breathing trial (SBT) and showed an RSBI less than 105 to be the acceptable parameter for successful extubation. The current standard in most institutions is to perform SBT and measure an RSBI while using the ventilator, typically with Pressure Support (PS) of 5 cm H2O and PEEP of 5 cm H2O. We hypothesized that an SBT using PS of 0 cm H2O, PEEP of 0 cm H2O with automatic tube compensation (ATC) would create a significant difference in the accuracy of using RSBI as a predictor for successful extubation when compared to PS of 5 cm H2O and PEEP of 5 cm H2O.
Methods:
After IRB approval, we performed a retrospective chart review study of all patients admitted to R Adams Cowley Shock Trauma Center in the Multi-Trauma Critical Care (MTCC) during 2015 that had SBT performed with the two various SBT settings to determine the reintubation rate. Data were also collected on patients that required noninvasive ventilation (NIV) or high flow nasal cannula (HFNC) post-extubation.
Results:
There were 201 patients extubated that completed an SBT on PS of 5 cm H2O PEEP of 5 cm H2O and 12.56% required re-intubation which wasn’t significant but double the rate of 5.3% of 95 patients that were reintubated when using an SBT of on PS of 0 cm H2O, PEEP of 0 cm H2O, and ATC.
Conclusions:
The more ventilation support provided during an SBT, the less likely an RSBI < 105 is as accurate. There was no significant difference between the two methods of SBT, but the reintubation rate was greater when using higher settings.
Meeting report
Restricted accessMeeting reportFirst published October, 2019pp. 3237953-3237953
Christina Pano, Wayne Barta, Stew Couillard , [...]
View All
Abstract
Background:
Utilization of invasive ventilation can lead to adverse events or hospital-acquired conditions for the neonatal patient such as long-term damage to the lungs, increased risk of infection, ventilator-associated events, and unplanned extubations. Implementation of a respiratory therapist (RT) driven protocol can safely standardize ventilator weaning strategies in post-operative neonatal patients, thereby reducing associated risks to patients.
Methods:
An RT driven protocol was developed, allowing the RT to manage the weaning of post-operative patients within the Neonatal Intensive Care Unit (NICU). Post-op patients greater than 2 kg were included if they did not receive blood products in surgery. Patients with pulmonary or airway comorbidities potentially impacting extubation success were excluded. The implementation of the protocol required a provider order. The Institutional Review Board approved this protocol. Real-time data was collected on patients admitted post-operatively to the NICU from November 1, 2016 to April 2, 2017. The NICU Post-op Ventilator Weaning Protocol was initiated on April 3, 2017. On December 3, 2019 the protocol was updated to be more inclusive; expanded to all invasively ventilated patients with postmenstrual age of greater than 29 weeks, and eliminated post-operative and weight requirements.
Results:
During the 6-month pre-data collection period, 5 patients were identified as fitting the protocol requirements. Mean weight was 2.69 kg, ranging from 2.44 to 2.84 kg. Average time to extubation was 17.8 hours, ranging from 7 hours to 23.75 hours. During the first two years, 33 patients were ordered for the NICU Ventilator Post-op Weaning Protocol. Of these, 5 patients were removed due to provider preference and 1 patient was removed due to multiple failed weaning attempts. There were 27 patients who successfully completed the protocol to extubation. Mean weight was 2.78 kg, ranging from 1.75 to 4.04 kg. The average time to extubation decreased slightly from the pre-data sample to 17.5 hours, ranging from 1.08 hours to 54.5 hours. Only one patient was reintubated within 24 hours of extubation due to stridor. No adverse events were reported.
Conclusions:
Implementation of a RT driven ventilator weaning protocol allows the RT to expand their scope of care and safely standardize the ventilator weaning process. Additionally, increasing the autonomy of the RT at the bedside, improved both RT staff and provider satisfaction
Meeting report
Restricted accessMeeting reportFirst published October, 2019pp. 3238058-3238058
In 2018, the KCH Respiratory Therapy (RT) team grew by 50% and transitioned to a vertical hospital environment. Several novel approaches were taken to make these changes successful for staff with minimal cost. In 2017, the KCH RT team was an experienced group of 30 respiratory therapists; 50% of the team had 10 or more years of experience as pediatric therapists. The RT team was bolstered by geographic proximity to each other throughout a shift. Plans to open a 72 bed single patient room NICU presented numerous threats. The new vertical geography meant that the RT team would lose their window on each other. RT staff would need to stay in their NICU “neighborhood” to assist nursing with patient monitoring in the single patient room environment. After the NICU move, there would only be 2 RTs left for all of PICU, progressive care and acute care. Although 13.5 FTEs were approved to address these concerns, adding so many new staff at once posed a significant challenge, especially with the pending geographical changes.
Methods:
A KCH RT Education Steering team was assembled in July 2017. This team re-wrote the orientation plan for new hires and participated in interviews. The KCH Lead RT role was established to provide clinical and logistical support to the shift. A Lead is assigned around the clock; the Lead team members work as regular staff therapists when not assigned to the Lead role for a shift. A start of shift huddle was implemented. The Leads function as clinical experts and are a lifeline of support for new therapists. The Lead also arranges just in time training for staff when unique or less common patient needs arise.
Results:
Fifteen therapists on-boarded to KCH between January 2018 and July 2018. One had prior pediatric ICU experience, 2 had prior adult ICU experience, and 12 were new graduates. The education committee and the Lead RT role augmented staff ownership of transition needs.
Conclusions:
The combined efforts of the education team and the introduction of the Lead RT as a clinical expert and peer mentor resulted in faster acclimation of new hires to all areas of KCH. Prior, a new graduate typically took two years to fully acclimate to NICU and PICU. 14 of the 15 new hires were taking full assignments in NICU by the end of three months. 80% of the new hires now attend deliveries, far sooner than the usual 12 months. The Lead therapists report increased job satisfaction. Employee engagement scores increased by 7%.
Meeting report
Restricted accessMeeting reportFirst published October, 2019pp. 3238080-3238080
Nirosshan Thiruchelvam, Mariela Madrilejos, Prof. Robert Chatburn
Abstract
Background:
Training of physicians on mechanical ventilation (MV) is highly variable among residency programs and little is known about best practices. In particular, few studies have compared online learning (eg, PowerPoint module) to computer-based simulation. The aim of this study was to evaluate the potential of a patient-ventilator simulator to facilitate MV education compared to traditional education with lecture slides, as a self-directed study of basic MV concepts. The hypothesis was the software-based patient-ventilator simulator results in more MV knowledge acquisition (ie, higher scores on a written test) compared to traditional education.
Methods:
The study was approved by the Cleveland Clinic (CCF) Institutional review board. Study participants were Internal Medicine Residents at CCF Main Campus and Fairview Hospital, whom we expect to have no substantive experience with MV and were enrolled during March and April 2019. Participants were randomly assigned to two learning tool groups; traditional lectures based on PowerPoint slides (TG) and patient-ventilator simulator programmed in Microsoft Excel (SG). The simulation-based group (SG) was also given an abbreviated set of slides that present the same content as the traditional group (TG) for definition of terms. In the SG, all graphic descriptions were presented with the simulator. Both groups were given the same pre-and post-test to evaluate knowledge acquisition. Outcome data were mean differences between the pre-test and post-test scores. Data were compared with t-tests and P < 0.05 indicated significance.
Results:
We enrolled 63 residents, of whom 33 were in the TG and 30 were in the SG. We excluded 5 residents due to not completing post-test questions. For the TG, the mean (SD) pre-test score (% correct) was 58.6 (11.8) and the post-test score was 78.5 (10.2). For the SG, the pre-test score was 58.8 (11.8) and the post- test score was 74.0 (9.9). The difference in pre-post test change (19.8 vs 15.2) was not significant (P = .17). The power of the study was only 0.145 due to the low sample size.
Conclusions:
This pilot study suggests that residents had relatively low knowledge of MV and gained substantially with either traditional or simulation methods. The lower mean scores of the simulation group may be explained by the unfamiliarity of the medium and longer time to complete. Further study is required to confirm these results and investigate underlying reasons.
Meeting report
Restricted accessMeeting reportFirst published October, 2019pp. 3238152-3238152
The newly developed oxygen conserving devices SmartDoze, is designed to automatically adjust the oxygen pulse dose according to the respiration rate and is automatically reduced the flow at rest. Therefore, we compared the conventional oxygen conserving devices with SmartDoze in the 6-minute walk (6MWD) test, and examined the influence on exercise tolerance and its factors.
Methods:
The subjects were 29 patients with COPD (mean age: 75.5 ± 5.6 y). The pulmonary function and respiratory muscle strength of the study patients were as follows (FVC: 2.68 ± 0.77 L, FEV 1:1.13 ± 0.55, FEV 1%: 41.7 ± 17.0%, PI max: 64.2 ± 21.4 cm H2O, PE max: 70.8 ± 22.6 cm H2O). 6MWD test was conducted using both oxygen synchronizers, and transcutaneous oxygen saturation, breathing frequency, heart rate, dyspnea and lower limb muscle fatigue by Borg scale, and blood pressure were compared before and after. Among the factors, we examined what influences walking with oxygen conserving device. This research is conducted after obtaining approval from the Kyorin University Ethics Review Committee.
Results:
The 6MWD by the conventional oxygen conserving devices was 366.2 ± 130.2 m, and the 6MWD when using SmartDoze was significantly improved to 378.3 ± 96.0 m (P < .05). In addition, after 6 minutes of walking, dyspnea showed a significantly lower value of 4.7 ± 2.6 for Smart Doze, compared with 5.6 ± 2.8 for the conventional oxygen conserving device (P < .01). Similar results were obtained after 3 minutes. Furthermore, it was found that Smart Doze showed a quick recovery of 1.0 ± 1.5 for Smart Doze, as compared with 1.4 ± 1.6 for leg muscle fatigue at 3 minutes after the end (P < .001). As a result of the multiple regression analysis, the factors that affect the 6MWD were lower extremity muscle fatigue and expiratory muscle strength at rest with conventional oxygen conserving devices, dyspnea and inspiratory muscle strength with SmartDoze.
Conclusions:
The new oxygen synchronizer improves exercise capacity, oxygenation and dyspnea by providing an amount of oxygen synchronized to the increase in working respiration rate. Lower extremity muscle is the most important factor that affects gait by using conventional oxygen conserving devices, dyspnea is the most important factor in SmartDoze, and it is recognized that recovery of dyspnea after walking is quick in SmartDoze.
Meeting report
Restricted accessMeeting reportFirst published October, 2019pp. 3238173-3238173
Michael Joseph Rafferty, Angela Saunders, Amanda Waits
Abstract
Background:
Since malacia is primarily assessed through bronchoscopy it has previously been difficult to determine the best therapies for these patients. We have had to rely on clinical assessments such as work of breathing, ventilator waveforms, and vital signs. This has often been challenging since many patients with malacia also have comorbidities such as BPD, CLD, PHTN, asthma, or neuromuscular conditions that can also affect their clinical assessment. Since malacia affects the shape of the airways, it can cause an increase in airway resistance (Raw). Bronchodilators can be used to help control the effect of malacia on the shape of the airway.
Methods:
This quality improvement study examined tracheostomy and ventilator dependent pediatric patients with malacia who were treated with bronchodilators. Using an NM3 we recorded the patient’s Raw once per minute for the duration of the study. These Raw readings are plotted in relation to the times when bronchodilators are given (see attached graph). We are then able to evaluate the patient’s Raw pre and post treatment. Looking at the trend of Raw readings pre and post bronchodilator treatment we can see if their Raw increases or decreases. If Raw decreases, we know the therapy was effective. We can also look at the Raw trends from one treatment to the next. If the Raw is increasing before the next treatment is given, we can increase our treatment frequency to provide better control. Since there is limited data on pediatric Raw, we do not target specific Raw ranges. We instead look at the trends for each patient individually.
Results:
9 patients were evaluated in the study. Patients required anywhere from 1 to 4 studies each to titrate optimal medications and medication frequencies. We were able to observe changes in Raw in relation to the treatment times.
Conclusions:
Using Raw trends we were able to establish that these patients benefited from more frequent treatments than the previous standard of BID Atrovent. All of the patients showed decreased Raw readings at Q8 or Q6 therapy. The use of Raw trends may be beneficial in titrating bronchodilator therapy for pediatric patients with malacia. (Fig 1: example of 1 patient) Disclosures: None of the authors have any industry or commercial relationships to disclose.
Meeting report
Restricted accessMeeting reportFirst published October, 2019pp. 3238189-3238189
Mobile phone-based interactive health tools can significantly improve the patient's disease knowledge level, treatment compliance, and effectively alleviate patients' nasal symptoms. The smart phone app platform will likely become a new carrier for providing high-quality health management. Holmen[1] et al found that patients with diabetes using the self-administered mobile app FTA (FTA) can improve their health management skills and improve the knowledge of disease (P = .04).
Methods:
One hundred and eight consecutive patients with chronic rhinosinusitis were recruited for this study between January 2018 and August 2018 were enrolled, all participants underwent surgery and were randomly divided into 2 groups (APP group and control group). The App group downloaded and installed sinusitis rehabilitation APP one day before discharge. The APP consists of 6 modules including education module, symptom self-assessment module, medication reminder module, ranking module, interactive platform module, questionnaire module. The APP group received intervention through 6 modules for 12 weeks. The control group underwent health education using regular graphic propaganda pages, discharge guidance . The baseline characteristics of the two groups were assessed by the baseline data questionnaire, the disease rehabilitation knowledge awareness questionnaire, and the VAS nasal symptom visual analogue scale. Knowledge of disease, treatment adherence and severity of nasal symptoms were evaluated at 2-week intervention, 4-week intervention and 12-week intervention by the disease rehabilitation knowledge awareness questionnaire and the VAS nasal symptom visual analogue scale in the 2 groups.
Results:
No significant differences were found between the two groups at baseline (P > .05). After the intervention, the differences of trends in disease knowledge level, treatment compliance, and VAS nasal symptom scores over time between the two groups were statistically significant (P < .05).
Conclusions:
The interactive health management tool of the smartphone app helps patients to manage their health better.
Meeting report
Restricted accessMeeting reportFirst published October, 2019pp. 3238286-3238286
We compared and studied the movement distance of mucus simulants (MS) with different viscoelasticity with different lung mechanics, driving pressure, ventilation mode and presence or absence of PEEP using by the cough assist function of VOCSN ventilator.
Methods:
We measured the movement distance of the MS under the following conditions. 1) Four types of lung mechanics: compliance (Cst) 50mL/cm H2O and airway resistance (Raw) 5cm H2O/L/s in normal lung, restrictive lung (Cst30 and Raw 5), obstructive lung (Cst50 and Raw 20) and mixed lung(Cst30 and Raw 20). 2) 3 types of insufflation and exsufflation driving pressure were 30/-30, 40/-40 and 50/-50 cm H2O. 3) 2 types of ventilation mode were VCV A/C and PCV A/C. 4) PEEP was 0 or 5 cm H2O. Under the above conditions, the movement distance was measured using two types of MS. A 1% lysis of MS is potage-like, corresponding to the secretion of chronic bronchitis, and a 4% lysis MS is jelly-like, close to the viscoelasticity of a mucus plug during an asthmatic attack. The analysis of the ventilatory dynamics was measured 5 times under each condition using flow analyzer PF300, and the average value was compared. Data analysis used software SPSS version 17 and JMP version 12 and P values < .05 were considered statistically significant. This research is conducted after obtaining approval from Showa University Ethics Review Board.
Results:
With regard to the viscoelastic properties of MS, the movement distance was larger for 1% MS than for 4% MS (P < .05). In addition, as the cough assist drive pressure increased, the movement distance of the MS increased (P < .05). With regard to the difference in lung mechanics, there was almost no difference in the movement distance of the MS regarding the difference in compliance, but the movement distance of the MS became smaller as the airway resistance became higher (P < .05). As for the ventilation mode, the movement distance of the MS tended to be larger in PCV A/C than in VCV A/C. The migration distance of PEEP with 5 cm H2O added was larger (P < .05).
Conclusions:
From these results, the effective setting method sets PEEP and the high driving pressure for restrictive lung. PCV mode and high driving pressure appeared to be more effective in cases of obstructive lung and high viscoelasticity secretions. In the future, further comparisons under different setting conditions are needed.
Meeting report
Restricted accessMeeting reportFirst published October, 2019pp. 3238436-3238436
Pulmonary rehabilitation (PR) is a comprehensive intervention to help the patient to improve sputum clearance, promote lung expansion. Despite PR has been clinically applied to patients after surgery, the deep inspiration and cough are inhibited by postoperative pain. Furthermore, it may result in sputum retention and atelectasis and lead to pneumonia, delay the chest tube removal, and prolong hospitalization. Recently, some studies found noninvasive ventilation (NIV) use for patients after thoracic surgery was able to facilitate lung function recovery, decrease the duration of chest tube insertion, and shorten hospitalization. However, the effect of combination of PR and NIV for the patients after thoracic surgery remains unknown. Our study aimed to evaluate the clinical outcome of the patients who received PR and NIV compared to the patient receiving only PR after thoracic surgery.
Methods:
Our retrospective study enrolled totally 182 patients after thoracic surgery during 2015-2018. In all of the 182 patients, 97 patients received PR and others received both PR and NIV. In the patients receiving PR and NIV, we applied NIV twice daily since the second day after surgery. The duration of chest tube insertion and the days of hospitalization were assessed as clinical outcomes.
Results:
As for the duration of chest tube insertion due to thoracic diseases (including those related to the lungs and esophagus), there was no statistically difference between the two groups (6.64 ± 4.46 vs. 5.74 ± 2.75 days, P = .11). In the patients with only pulmonary diseases (excluding esophagus-related diseases), the average duration of chest tube insertion was significantly lower in the PR + NIV group, than the PR group (5.43 ± 2.30 vs. 6.62 ± 4.58 days, P = .03). In the days of hospitalization, there was no statistically difference between the PR group and the PR + NIV group (10.11 ± 6.32 vs. 8.60 ± 4.58 days, P = .07). When esophagus-related diseases were excluded, the days of hospitalization was significantly lower in the PR + NIV group than the PR group (7.75 ± 3.36 vs. 9.86 ± 6.48 days, P = .01).
Conclusions:
Our study found that the combination of PR and NIV did help to reduce the duration of chest tube insertion and shorten the days of hospitalization after pulmonary surgery. According to our study, patients after pulmonary surgery should receive PR and NIV as standard postoperative rehabilitation.
Meeting report
Restricted accessMeeting reportFirst published October, 2019pp. 3238458-3238458
Chronic obstructive pulmonary disease (COPD) is characterized by chronic airway inflammation. Respiratory symptoms and acute exacerbation result in a decline of cardiopulmonary function and exercise tolerance in COPD patients, which in turn seriously affects their daily activities and health-related quality of life. However, effects of high-frequency chest wall oscillation vibratory vest in combination with whole-body vibration on COPD patients were not been reported.
Methods:
We enrolled 24 COPD outpatients from the Pulmonary Rehabilitation Center of Kaohsiung Medical University Hospital. All the research subjects received a regular rehabilitation program by using a HFCWO vibratory vest; 13 of them were randomized to the intervention group (the WBVT group) and received additional WBVT (twice a week for a period of eight weeks; three sessions each time, vibrating at an amplitude of 2mm and a frequency of 20Hz, and each session included vibration lasting three minutes and a sixty-second interval), and the remaining 11 subjects were in the control group without WBVT treatment. The parameters including demographic data, cardiopulmonary parameters including 6-min walking distance (6MWD) test, lung function test, and upper- and lower-limb muscle strength and endurance), chest radiography, and health-related quality of life (including sputum assessment, modified British Medical Research Council (mMRC) Dyspnoea Scale, COPD Assessment Test (CAT), and SGRQ were analyzed.
Results:
All the research subjects completed the eight-week rehabilitation program. The mean age was 67.4 ± 19.6, and the male-female ratio was 2.4. A significant improvement in the 6MWD test was observed in the WBVT group. The subjects in the WBVT group improved more than those in the control group in terms of two symptomatic measures, including CAT scores (WBVT: 11 points, control: 7 points, P = .01) and SGRQ (WBVT: 41.69 points, control: 26.86 points, with a between-group difference of 14.09 points, P = .001). The lower-limb muscle strength and endurance increased significantly after WBVT treatment. No difference was observed in sputum clearance ability and lung function test.
Conclusions:
Our results demonstrated WBVT is a new, safe, and time-efficient exercise modality and should be recommended as part of the regular pulmonary rehabilitation program, aiming at reducing symptoms and improving lower-limb muscle strength and the quality of life for COPD outpatients.
Meeting report
Restricted accessMeeting reportFirst published October, 2019pp. 3238492-3238492
Priscilla Flavia Bogoni, Anna Meschi, Riccardo Guarise , [...]
View All
Abstract
Background:
Primary ciliary dyskinesia (PCD) is a rare autosomal recessive disorder of motile cilia. Impaired mucociliary clearance in the lungs leads to sputum retention and recurrent respiratory tract infections. Accordingly, a program of physiotherapy is recommended to these patients with the inclusion of sinonasal irrigation, airway clearance techniques (ACTs), exercise and inhalation therapy. Mostly physiotherapy treatments are extrapolated from Cystic Fibrosis (CF) care, despite a notable difference in the pathophysiology and a limited evidence about them. OBJECTIVES To frame the characteristics of PCD adult patients followed in Verona CF centre and their respiratory physiotherapy treatments.
Methods:
The study has been performed in April 2019. 49 PCD adults are included in the centre database but 21 of them have not regular follow up visits in 2018. Descriptive analysis was conducted to define the current practice of physiotherapy management.
Results:
The study sample includes 28 subjects (15 F) with mean age 37 y (13,1), mean BMI 22,1(2,7), 64% of situs inversus, 75% of them have impaired lung function, but only 25% a very severe lung disease. 36% of the subjects received the diagnosis in the adult age. Pseudomonas Aeuroginosa Chronic colonization affects 68% of the sample. Sinonasal irrigation with isotonic saline is prescribed in 82% of cases. ACTs are undertaken by 93% of subjects and include various techniques: with PEP devices (57%), with Oscillatory PEP devices (18%) and Breathing control techniques (ACBT, AD, ELTGOL) (18%). Moderate or vigorous regular physical activity is performed by 19 subjects. The inhalation therapies prescribed includes: bronchodilators (75% short term and 57% long term), antibiotics (25%), hypertonic saline (11%), Dornase Alfa (4%).
Conclusions:
This study describes the experience of a large Italian centre and our casuistry confirms guidelines indication to physiotherapy management of PCD patients. Clinical practice highlights the need of further studies as multicentre trials in order to identify specific physiotherapy treatment for this disease. It could be important to investigate the effect of different regimens on symptoms, lung function, exercise tolerance, quality of life and adherence.
Meeting report
Restricted accessMeeting reportFirst published October, 2019pp. 3238511-3238511
Patients with a tracheostomy tube (TT) may receive varying standards of care post discharge from intensive care unit (ICU) in the absence of a specialized tracheostomy care team. The effect of a tracheostomy team on patients and safety outcomes remains equivocal in studies with physician-led multidisciplinary model that provided twice weekly reviews. A tracheostomy review service (TRS) was formed in our hospital in 2017. We aimed to evaluate the real-world impact of a TRS in terms of service uptake and timing of referral, and their effect on patient outcomes.
Methods:
This retrospective study included all patients discharged from Medical and Surgical ICUs with TT in-situ between January 2017 and December 2018. Data excluded patients under otolaryngology service, long term TT, discharged to other acute institutions, or deemed to require long-term mechanical ventilation for analysis. This study was approved by SingHealth Centralised Institutional Review Board (Ref: 2017/2313).
Results:
One hundred and fifty-six post ICU patients had TT in-situ in the 2-year study, out of which 63(40.4%) patients were referred to the TRS. A total of 52 subjects were included for analysis; 20 of which were referred to the TRS within 7 days (early group), and 32 after 7 days (late group). There were no significant differences in median age (65.0 vs. 63.5; P = .748), median Acute Physiology and Chronic Health Evaluation (APACHE) II Score (22.5 vs. 20.5; P = .37), and median timing of tracheostomy creation (12.5 vs.14.5; P = .66). A total of 32 patients were decannulated at hospital discharge. The early group had a higher proportion of decannulation success at discharge than the late group (80.0 vs. 50.0%; P = .04). In addition, the early group also tolerated cuff deflation trial sooner [7 (4-9) vs. 17 (9-22) days; P = .001] than the late group. The first tube change post-tracheostomy also took place earlier in the former group [10 (7-11) vs. 19 (11-32) days; P = .001] compared to the latter.
Conclusions:
Early referral to TRS within 7 days is associated with earlier cuff deflation, and tube change, and a higher rate of decannulation upon discharge. With these findings, we aim to implement early TRS review hospital-wide such that all TT patients post ICU discharge will benefit from this multidisciplinary service.
Meeting report
Restricted accessMeeting reportFirst published October, 2019pp. 3238543-3238543
Lyndee S Knisely, Amanda Richter, Ryan Bechtel , [...]
View All
Abstract
Background:
Effective communication and collaboration between multidisciplinary teams are crucial for quality patient care. It is essential for registered nurses (RNs) and respiratory therapists (RTs) to be viewed as one bedside care team, seamlessly coordinating plans of care and medical management. Patient experience is impacted when respect among teams are demonstrated and perceived by the patient. A workgroup of staff RNs and RTs from a medical/pulmonary nursing floor (4SW) was assembled with RN/RT leadership serving as facilitators. The focus was to evaluate perception of communication among RNs and RTs, develop and implement a focused action plan to determine if perception of communication could be improved.
Methods:
The 4SW workgroup developed a survey of staff RNs and RTs from 4SW to understand current perceptions of communication and to identify areas of opportunity. Top focus areas for opportunity were phone interactions, RT understanding of patient condition when called and RN awareness of RT timeframe. The action plan included RN/RT call logs, RNs scripting for patient assessment and urgency level, and RTs providing expected time of arrival.
Results:
The post implementation surveys showed a 30% improvement in the perception of communication from RTs and no change of perceptions of RNs. Further analysis of the call logs shows accurate assessment of patient condition by RN 69% of time, appropriate urgency level assigned by RN 56% of the time, and arrival within 5 minutes of expected time frame given by RT 96% of the time.
Conclusions:
By creating an action plan by key stakeholders, this workgroup demonstrated improvement in perception of communication for RT staff. Additional work is needed to evaluate additional opportunities and barriers. Further research is needed to understand larger impacts, including patient satisfaction, employee satisfaction, and patient outcomes.
Meeting report
Restricted accessMeeting reportFirst published October, 2019pp. 3238557-3238557
Kimberly J. Bennion, Makenna Christ, Allison Braden , [...]
View All
Abstract
Background:
A Utah RT created and implemented a community education program in 1995. Objectives were to raise lung health awareness and disease prevention among school-aged students. Key program elements include chest anatomy and physiology, basic gas exchange, asthma pathophysiology, interactive exercises and porcine heart and lung dissection. A full course requires 2.5-3 h of class time. When legislators failed to pass e-cigarette regulation during the 2014 open legislative session stating it was an education issue, we took the challenge to educate Utah’s youth regarding the impact of any form of inhalant on lung health. Strong lobbying since has resulted in e-tobacco legislation enforcement in 2018. Program materials and supplies were purchased for ≈$1500. The initial kit includes: an inflatable porcine lung model with normal and diseased lungs, scalpels, gloves, sanitizing wipes, educational posters and teaching aids, plastic storage bins, colored t-shirts, rope and batting. Porcine lungs were donated from a local butcher. An RT student from the university is annually assigned to lead the project, and student volunteers attend a Super User Training session. Lead duties include: communicating with schools, scheduling courses, coordinating volunteers and providing oversight at all sessions. Six courses were taught at 2 schools between Oct. 2018-Jan. 2019 to 6th graders. A total of 176 elementary students completed the course.
Methods:
Pre- and post-exams were given to all participants.
Results:
Exam outcomes are reported in Table One.
Conclusions:
Through the Breathe-zy program, we have appreciated an increased: 1) student awareness of the impact of tobacco on lung and overall health, 2) awareness of RT as a profession, 3) RT value as key members of the healthcare and community partners, and 4) RT student engagement in the profession and AARC/USRC initiatives. The program is an opportunity for RT students to be mentored as leaders as they are responsible to schedule courses, coordinate volunteers, input and assist with data analysis and outcomes reporting for abstract submission for publication. It is our impression that promotion of our profession will require strong community partnerships. The number of RTs in Utah is relatively small when compared with many other states. When RTs unite with clearly defined objectives to offer a high-quality product, we can make a difference. We offer all information for starting a program to any RT departments or college programs free of charge.
Table One: 2019 Breathe-zy Program Pre-/Post Assessment Exam Outcomes
School Type
Students Participating Pre/Post#
TotalExamQuestions#
Total # ofStudents xPossibleCorrectAnswersPre/Post#
Pre-ProgramExamQuestionAccuracy%
Post-ProgramExamQuestionAccuracy%
Pre-vsPost-ExamImprovement%
Elementary
176/176
4928
2464/2464
39.1
83.4
44.3
*Special thanks to Intermountain Healthcare, Inc, the Super Users comprised of Utah Valley University student volunteers & Circle V Meat in Spanish Fork, Utah for their generous support of the courses provided.
Meeting report
Restricted accessMeeting reportFirst published October, 2019pp. 3238559-3238559
Laura Bennett, Amanda Waits, Jennifer Gronauer , [...]
View All
Abstract
Background:
Hospital Acquired Pressure Injuries (HAPIs) result in harm that impacts patients, families, and care givers. The physical, emotional, and financial burden is significant, costing $9.1 -$11.6 billion annually. We had previously reported that > 60% of pediatric pressure injuries at our organization were associated with medical devices (Visscher et al 2015). Despite having decreased our overall rate of serious harm HAPIs by 50% in FY’18, our rate of stage II’s had increased to a rate of 1.17 per 1000 patient days. In FY’18, 78% of our pressure injuries were associated with devices with the top categories being Respiratory Care device related injuries. Objectives: To decrease the overall rate of stage 2 pressure injuries per 1,000 patient days from 1.17 to 0.77 by July 31, 2019.
Methods:
Utilizing the model for improvement, we determined smart aims, developed a key driver diagram, mapped failure modes, and tested interventions using PDSA cycles. Interdisciplinary sub-teams were formed consisting of RNs and RRTs from critical care and medical-surgical units. The teams focused on respiratory devices, EEG leads, tubing, and staff education and coaching to reduce pressure injuries. Using multiple PDSA cycles, teams focused on the following interventions: RNs and RRT skin champions conducted multidisciplinary skin rounds, Frontline teams used daily and weekly pressure injury data to identify trends and practices that needed coaching. Learning was shared organically across unit boundaries. Skin champions and wound teams actively coached at the bedside to empower front line staff to identify barriers to care and mitigation strategies. Skin champions engaged patients and families during rounds.
Results:
A 48% reduction in stage II pressure injuries from 0.96 to 0.5 per 1,000 patient days was achieved in Q2. For the same time period, we achieved an 81% reduction in serious pressure injuries (stage 3, 4, and unstageable) from 0.16 to 0.03 per 1,000 patient days Conclusions: Interdisciplinary collaboration across the system with an intentional focus, utilization of the model of improvement, and application of a differentiated practice model resulted in significantly reduced serious harm and stage II pressure injuries. An unexpected outcome was that by focusing on our stage II pressure injuries, we significantly decreased our serious harm pressure injuries to a rate of 0.03 per 1,000 patient days.
Meeting report
Restricted accessMeeting reportFirst published October, 2019pp. 3238603-3238603
During mechanical ventilation, endotracheal tube cuff pressure must be controlled and monitored regularly to avoid complications such as air leak, aspiration, and tracheal injury. Common methods of measuring and adjusting cuff pressure are a syringe and stopcock connected to a manometer, a squeeze bulb connected to a manometer (Cufflator) and an electronic/pneumatic inflator/monitor (Intellicuff). The purpose of this study was to determine the changes in cuff pressure associated with those devices, in the laboratory.
Methods:
We measured the changes in cuff pressure 10 times each using the Posey Cufflator, a syringe and stopcock connected to a water manometer, and Intellicuff. Measurements were made in-vitro using an adult airway management trainer intubated with an 8.0 mm ID ETT. Cuff pressures were initially set to 30 cm H2O with a water manometer in-line. The cuff inflation devices were disconnected, and cuff pressures were measured again. Data were analyzed using one-way ANOVA.
Results:
Cuff pressure decreased 1.9 + 0.31 cm H2O upon reconnection of the Cufflator (P < .001). Cuff pressure decreased 0.51 + 0.19 cm H2O when using a stopcock and a syringe (P < .001). Neither change was deemed clinically significant. When using the Intellicuff, the cuff pressure decreased 0.02 + 0.06 cm H2O (P = .34).
Conclusions:
While there was a loss of cuff pressure using the Cufflator and a syringe and stopcock, neither change could be interpreted as clinically significant. The Intellicuff maintained cuff pressure closer to the initial pressure of the three methods. Future in vivo studies may confirm this in-vitro evaluation.
Meeting report
Restricted accessMeeting reportFirst published October, 2019pp. 3238636-3238636
In many facilities, billing is directly connected to patient medical records and documentation. Unfortunately, the relationship between these two entities leave a lot of room for error. These errors can result in under and over charging of patients due to incorrect documentation, errors in coding, and poor interoperability between documentation and billing systems. This study looks specifically at errors of missing ventilator, BiPAP, or CPAP documentation and its effects on patient billing.
Methods:
For the purposes of this study, data related to documentation and billing was collected for one month. To find patients with missed documentation a report was pulled from a hospital worklist that showed all patients receiving respiratory treatment in the facility. The report was then reduced to show only ventilators, BiPAP, and CPAP tasks. This report was kept until the following day and was then manually cross referenced against charges from the day before. All patients then identified as having a task, but no charge from the previous day were further investigated by looking into the clinician documentation. After investigation of documentation all patients that were found to have missing documentation associated with charges were recorded and the correct charge entered into the patient’s charts. Data was then tallied on a daily basis to assign a dollar amount associated with what would have been losses in revenue.
Results:
After one month it was found that the facility we looked at was missing approximately 3.8 ventilator and 5.1 BiPAP or CPAP charges a day. According to our findings, the mean ventilator charge in a hospital setting is about $1,522 per day, and a BiPAP or CPAP is approx. $416.10 per day. Using those figures, we were able to determine that without auditing there was a potential loss of ventilator revenue amounting to $5729.88 per day. Loses from missing BiPAP and CPAP charges would account for an additional $2,117.21 per day. That is an estimated loss of revenue of $7,847.10 per day from just ventilator, BiPAP, and CPAP documentation errors alone.
Conclusions:
In conclusion, documentation in the healthcare setting is extremely important for many reasons. Not only does it act as a record for history of treatment and prior visits, but in today’s time is often responsible for the billing of treatment and care. In this study alone, the auditing and correction of documentation and charges could have saved an estimated $2,864,155 in missed revenue.
Meeting report
Restricted accessMeeting reportFirst published October, 2019pp. 3238653-3238653
Samantha Scott-Marquina, Jeruzelle DeVera, Isaiah Smith , [...]
View All
Abstract
Background:
The experience between in-patients and the health care systems they access has become more troublesome. In-patients are sending a loud message which brings health care’s quality of care into question. How the patient feels about his or her care is a significant driver of whether or not they will promote and/or recommend a health care institution within their sphere of influence. Three strategies have been suggested to enrich the patient’s experience: 1) individualization of patients based on their values, needs and preferences, 2) timely information sharing between the patient and care provider, and 3) use survey instruments which invites the patients to provide feedback about their hospital experience which can be compared with patient experiences regionally and nationally[1]. At UCSF Health we send all former in-patients a survey to determine if they would recommend our services for medical care. Our medical system has set a satisfaction rating metric of > 60% return of “yes, I would recommend” UCSF Health for medical care. Respiratory Care Services (RCS) provides respiratory care across all areas of UCSF Health, historically our service has never had a method or specific tool to evaluate and monitor patient’s satisfaction associated with the care provide.
Methods:
In an effort to measure the impact of RCS on Patient Experience, we implemented a 5 star survey tool for patients who were assigned to a RCS Clinical Pathway. Patients were surveyed on their overall satisfaction with our service. In addition, we also surveyed if the patient would recommend UCSF Health for medical care.
Results:
During the first quarter of calendar year ’19 we surveyed a total 46 patients, representing all areas of acute and transitional in-patient care. Considering the University’s True North metric for recommendation ratability, we are using our survey as a sample size metric. Thus far our results have produced a 100% return rate of “yes, I (patient) would recommend UCSF Health”.
Conclusions:
This survey provided patients with a platform to provide real time feedback, which allows for timely intervention. Selecting patients in whom we provide respiratory care services, ensures that we hold ourselves accountable to the service that we provide. The survey also provides us with a tool to deliver timely recognition to respiratory care staff. Reference: [1] Brook RH, McGlynn EA, Cleary PD. Quality of health care. Part 2: measuring quality of care. N Engl J Med 1996; 335:966.
Meeting report
Restricted accessMeeting reportFirst published October, 2019pp. 3238691-3238691
Kevin P Collins, Joellen Coyrell, Christopher Russian
Abstract
Background:
One resource for asthmatic students on a college campus is the student health center (SHC). The goals of the SHC are to provide high-quality health care services and to promote a healthy campus, lifelong health, and student well-being. The American College Health Association reported in 2016 that 8.9% of college students indicated having an asthma diagnosis. In addition, the literature reveals adult physicians feel unfamiliar with chronic disease as it is frequently a multisystem illness, so they tend to be more reactive to illness than proactive. The research question is: How do Healthcare Providers (HCPs) employed at a SHC perceive the current state of asthma education and management of college students? Methods: This qualitative case study recruited five healthcare providers from the SHC of a large public university in the southwest region of the U.S. Approval for this study was granted from the university’s IRB (#5359). The HCPs were interviewed individually and in a focus group session. Data collected from the interviews underwent qualitative coding and analysis to include: (1) initial coding, (2) focused coding, and (3) axial coding. Once the codes emerged, they were assembled into themes and the data was subjected to the constant comparative method of data analysis.
Results:
Qualitative coding and analysis of the data revealed the following themes: (a) learning from experience in managing asthmatic students was prominent among the HCPs, (b) providing high-quality health care services to asthmatic students is complicated by the exorbitant cost of medications, time constraints, and lack of student knowledge about asthma (c) HCPs perceive students have not taken full responsibility for managing their asthma during their college years.
Conclusions:
The HCPs are engaging in self-directed learning to gain knowledge about asthma. The participants recognize they need additional training in lung function testing and the implementation of the national asthma guidelines. In addition, the HCPs recognize the need for college level asthma education written materials at the SHC to aid students in the self-management of their asthma. Furthermore, the SHC needs a reliable method to identify which students on campus have an asthma diagnosis. Disclosures: All authors have no conflicts of interest or industry relationships to disclose. This research project was partially funded by a doctoral stipend through Texas State University.
Meeting report
Restricted accessMeeting reportFirst published October, 2019pp. 3238714-3238714
Pulse oximeters are commonly utilized medical devices used to measure blood oxygen saturation (SpO2). These devices are either stand-alone or integrated into physiologic monitoring systems, using 2 wavelengths of lights to determine SpO2. With recent advances in technology, some smartphones now have pulse oximetry capabilities. Since it is possible that some patients could utilize this technology, we sought to assess the accuracy, reliability and usability of smartphone pulse oximeters.
Methods:
This was an IRB-approved prospective, observational study which involved noninvasive measurements SpO2 by three devices: 1) Masimo Radical-7 pulse oximeter, 2) Kenek Edge Pulse Oximeter with the Apple iPhone 6S, and 3) Samsung S8 smartphone. Ambulatory patients above 18 years of age visiting the pulmonary function lab for a 6-minute walk test were eligible to participate in the study. Each participant’s SpO2 was measured using all three devices, simultaneously. Pre-test and post-test results were obtained for every participant. All results were calculated by Pearson correlation coefficient and Bland-Altman plots were used to compare smartphone values to the pulse oximeter used in the lab. When devices failed to provide a SpO2 result, it was recorded as Unable to Obtain (UTO).
Results:
48 participants enrolled in the study. Of the 48 participants, 77.1% were females and 22.9% were males. For SpO2, there was a moderate, positive correlation between pre-test Masimo and Apple devices (n = 47, r = .519, P < .001) and Masimo and Samsung (n = 35, r = .552, P < .001). There was a moderate, positive correlation between post-test Masimo and Apple devices (n = 44, r = .675, P = < .001) and Masimo and Samsung (n = 31, r = .672, P = < .001). UTO pre-test SpO2 results: Samsung: 13/48 (27%), Apple: 1/48 (2%); UTO in post-test SpO2 results: Samsung: 17/48 (35%), Apple: 4/48 (8%). The Masimo device was able to obtain a SpO2 result in each study participant (50/50, 100%). Pre- and post-test Bland-Altman plots show inconsistent agreement between devices.
Conclusions:
Smartphone pulse oximetry technology is inconsistent when compared to a device designed to measure oxygen saturation. More research is needed to assess differences in smartphone pulse oximetry applications and to better understand if this technology can be utilized in patients with varying degrees of hypoxemia.
Meeting report
Restricted accessMeeting reportFirst published October, 2019pp. 3238761-3238761
A quick and cost-efficient way to monitor carboxyhemoglobin (COHb) levels in the blood is vital to providing the best patient care to patients who may have carbon monoxide (CO) poisoning. The purpose of this experiment was to compare noninvasive pulse COHb measurements (NIpCO) to blood analyzed through a co-oximeter (Co-ox).
Methods:
After receiving IRB approval, a random selection of ED patients who had arterial blood gases ordered by the physician were included. A finger probe from a NIpCO was placed on the patient’s finger at the time of the arterial puncture for an ABG. The value from the NIpCO was recorded and compared to the COHb value from the Co-ox. A Pearson’s r correlation was used to analyze the data to determine if there was a correlation between the two measurements.
Results:
Fourteen patients were included in the sample to gather data for this project. A Pearson’s r correlation was performed on the results giving an r value of 0.48. This value gives a positive but weak correlation between the Co-ox and the NIpCO values. Looking at differences between the Co-ox and the NIpCO, several comparisons were > 4% (6 vs 0; 5 vs 1; 4.6 vs 0; 7.3 vs 2) Conclusions: Noninvasive monitoring devices present a promising future in healthcare. The NIpCO offers a quick screening for patients with possible CO poisoning. There was a positive but weak correlation between the Co-Ox and the NIpCO measurements and at times the difference was fairly large (> 4%).
Co-ox versus NIpCO / Difference
Co-ox
NIpCO
Difference
1.8
0.44
1.36
6.8
5
1.8
7
4
3
6
0
6
6.3
7
-0.7
4.5
2
2.5
3.6
0
3.6
5
1
4
3.8
1
2.8
2.9
4
-1.1
4.6
0
4.6
3.2
0
3.2
3.6
2
1.6
7.3
2
5.3
Meeting report
Restricted accessMeeting reportFirst published October, 2019pp. 3238764-3238764
Organ procurement and transplant is an integral part of a Pediatric Intensive Care Unit (PICU). As of March 2019, 33 children are waiting to receive a lifesaving lung transplant in the United States1. The longer these children remain on waitlists, the less likely they are to have good survival rates after transplant2. From 2015-2017 our lung procurement rate for consenting pediatric donors (n = 18) was 0%. We aimed to increase the lung procurement rate in our PICU using a continuous improvement model.
Methods:
A multi-disciplinary team was developed and led by the PICU medical director. The team included physicians, nurses, donation agency staff, social work, and respiratory therapists. The team met quarterly to review all possible organ donation cases and assess them utilizing a continuous improvement model. Learnings from this meeting were then disseminated to bedside caregivers on an ongoing basis. Based on these learnings, the PICU team was able to implement changes to aid in improving lung procurement success. Early identification of lung donor candidates was integral to program success. The screening was done via bedside chest x-ray and bronchoscopy. A bronchial alveolar lavage and sputum culture were obtained. An oxygen challenge was considered every 4 hours. Candidates then received airway clearance every 2 to 4 hours until procurement.
Results:
By utilizing an interdisciplinary team approach and a model of continuous improvement, we were able to increase lung procurement rates by 16% (n = 6). We also increased the number of organs transplanted per donor from 3.62 to 4.0 organs per donor.
Conclusions:
By utilizing an interdisciplinary team and continuous improvement approach, our PICU was able to increase lung procurement rates for our pediatric donors. In our analysis, we also determined that an overall increase in organs donated occurred after we completed our continuous improvement process. A standard protocol for assessment and treatment until procurement is vital in maintaining organ viability for procurement. Increasing the number of successful organs procured per donor means the gift of donation potentially saves more lives. We recommend that all cases of possible organ donation be reviewed in order to be better stewards of organs procured after death. References: 1. UNOS optn.transplant.hrsa.gov/data 2. Lauerer M et al. Organ transplant in the face of donor shortage. Visc Med 2016;32(4):278-285.
Annual Data on Lung Procurement and Donor Transplants
Year
Potential/Actual Donor
Transplants per Donor
Lung Procurement Patients
2015
11/8 (72%)
2.75
0/8 (0%)
2016
13/4 (30%)
3.0
0/4 (0%)
2017
11/6 (54%)
2.33
0/6 (0%)
2018
10/6 (60%)
3.17
1/6 (16%)
Meeting report
Restricted accessMeeting reportFirst published October, 2019pp. 3238767-3238767
David G Boston, Joshua A Good, Matthew S Pavlichko
Abstract
Background:
Determining an appropriate staff to workload ratio can be a daunting task. Utilizing a quantifiable approach to match labor resources to work volume is key to fair and manageable assignments for frontline staff. Development of the Fair Assignment Tool at Penn Medicine Lancaster General Hospital provided a safe and fiscally responsible solution. Guided by the nationally accepted time standards from the AARC Uniform Reporting Manual, the Fair Assignment Tool assisted in quantifying the workload using a point system, dividing it evenly amongst scheduled staff, and determining staff productivity. With further development, we found it could monitor trends in workload and the number of staff members required to safely manage fluctuations in work volume and patient acuity.
Methods:
The original version of the Fair Assignment Tool was inherently descriptive. Revisions made in January 2019 added predictive elements. Average productivity during a set seven day interval was assessed weekly. If the average productivity was >110%, incentives were offered to staff working additonal hours in the following week. Average workload from the same seven day interval was used to determine the number of staff needed for each shift in the following week to maintain a productivity ≤ 110% where predicted staffing = average workload divided by desired % productivity. The work schedule was reviewed and extra shifts were posted in attempt to bring scheduled staffing numbers to predicted staffing levels. A 21-week analysis was then conducted to track the impact of these revisions on staffing and productivity.
Results:
The new features of the Fair Assignment Tool allowed us to adjust staffing numbers to manage fluctuations in the workload. Staffing numbers were increased to maintain a productivity less than or equal to 110% for 18 out of the 21 weeks (85%). This analysis was communicated to executive leadership in order to have an objective discussion for adding more FTEs.
Conclusions:
The revised Fair Assignment Tool allowed us to manage labor resources while maintaining high quality work and safe patient care. Maintaining the proper staff to workload ratios also increased staff morale as staff felt they had more time to provide proper patient care when faced with heavier than normal work volume as often seen during the winter months. We hypothesize that this tool could be used to manage non-labor resources such as equipment inventory and determine when equipment is rented.
Meeting report
Restricted accessMeeting reportFirst published October, 2019pp. 3238779-3238779
The use of heated ventilator circuits (HVC) is common practice in a majority of hospitals. HVCs are designed to maintain inhaled gas at body temperature pressure saturated (BTPS) and reduce rain out for optimal patient comfort. HVC temperature can be variable based on the room temperature and other supplies utilized near the ventilator circuit. Patients can experience burns at 44 degrees Celsius (109.4°F)1. In our Pediatric Intensive Care Unit (PICU), a 12 kg patient sustained burns from a HVC while undergoing a bedside surgical procedure. We aimed to create a bench model to validate this scenario and ensure all methods for patient safety while using HVCs are considered.
Methods:
A Gettinge Servo-i ventilator was set up with a Fisher & Paykel 202 infant circuit to simulate a spontaneously breathing patient. A Fisher & Paykel (MR850) heater was integrated with the HVC and ventilator. A standard Hill-Rom patient bed was utilized, and the HVC was draped across to the middle of the bed where a patient would be positioned. Control temperatures were obtained with the HVC exposed to room air (69.6°F). Scenarios were benched with a standard hospital grade blanket, forced air patient heater, and surgical drape placed over the HVC. Temperatures were obtained with a Fluke Infrared 561 Thermometer at four locations along the HVC. The temperature of the circuit was measured from a distance of 5 inches. Bench scenarios were repeated three times.
Results:
The temperature range of the HVC was 34.61 – 52.14°C with an average of 42.88°C in all models. The simulated blanket model produced the highest temperatures. Measurements at 20 cm and 30 cm from the patient produced the highest temperature readings. See graph for detailed results.
Conclusions:
In our bench model temperatures within the HVC rose to 52.14°C in specific scenarios. While the heater temperature at the humidifier and temperature probe remained within specifications, the circuit temperature rose well above safe limits. Other bedside supplies may be a necessity but the HVC location should be a vital concern to avoid patient harm. Warning labels to highlight this potential harm should be included with HVCs so that bedside clinicians can be aware of the risks. Reference: 1. Evers L, Vhavsar D, Mailander P. The biology of burn injury. Exp Dermatology 2010;19(9):777-783. doi:10.1111/j.1600-0625.2010.01105.x.
This graph displays the recorded temperatures in the inspiratory circuit in the bench model with a blanket drapped over the HVC.
Meeting report
Restricted accessMeeting reportFirst published October, 2019pp. 3238782-3238782
Flexi trunk and RAM Cannula are common interfaces used with Bubble CPAP to provide positive airway pressure (PAP) respiratory support in the neonatal intensive care unit. Local neonatal providers anecdotally noted that subjects treated with flexi trunk have demonstrated consistent goal of PAP therapy vs the use of RAM Cannula. This study looked at potential differences in delivered pressure and flow from the sized-paired devices.
Methods:
This bench study measured pressure and flow using the RAM Cannula (Neotech) and Flexi Trunk (Fisher & Paykel) delivered to a simulated infant head (Michigan Instruments). Both interfaces were connected to a Bubble CPAP System (Fisher & Paykel) with pressure set at 5 and 8 cm H2O and continuous flow set at 10 L/min. The Mallinckrodt Puritan-Bennett PTS 2000 Ventilator Tester was used to measure the pressure and flow, once stabilized, via ports downstream from the simulated nares of the infant model head. Three sizes of Neotech RAM Cannula were used (3mm, 3.5 mm, and 4mm). Three Infant Nasal Prongs BC3020-10, BC3520-10, and BC4030-10 (Fisher & Paykel) were connected to Different sizes Flexi Trunk Midline Interfaces 50mm, 70 mm, and 100mm. Reported Flexi Trunk data is average of all readings for respective prong size. All interfaces were attached to the model head in fashion like patient care. All other openings, within simulated head, were occluded to prevent leak during measurements. IBM SPSS software was used for t-test analysis and significance is set at P <.05.
Results:
The chart below describes the flow and pressure measured with the size-paired interfaces. In many cases, Flexi trunk device delivered more pressure and, in every test, delivered flow was higher than the similar sized RAM cannula.
Conclusions:
In this study with a single simulated head, there were significant differences in delivered pressure and flow between the sized-paired RAM Cannula and Flexi Trunk interfaces. This study cannot infer that one interface is more effective than another device in neonatal subjects. Further research should include in vivo study to compare the interfaces’ performance.
RAM Cannula Versus Flexi Trunk
pressure setting 10L/min set
Prong size
RAM Cannula mean (cmH2O)
Flexi Trunk mean (cmh2O)
p value
5 CPAP
3 mm
2.6
2.03
0.0002*
5 CPAP
3.5 mm
5.4
5.8
0.2021
5 CPAP
4 mm
5.5
6.13
0.0009*
8 CPAP
3 mm
3.56
3.01
0.001*
8 CPAP
3.5 mm
7.7
8.33
0.002*
8 CPAP
4 mm
8
8.33
0.1756
Flow setting 10 L/min
Prong size
RAM Cannula mean (L/min)
Flexi Trunk mean (L/min)
p value
5 CPAP
3 mm
4.14
4.59
0.001*
5 CPAP
3.5 mm
4.87
7.29
0.0003*
5 CPAP
4 mm
5.56
9.83
0.001*
8 CPAP
3 mm
5.2
5.61
0.0011*
8 CPAP
3.5 mm
6.4
9.64
0.001*
8 CPAP
4 mm
7.4
9.86
0.001*
Meeting report
Restricted accessMeeting reportFirst published October, 2019pp. 3238788-3238788
Two devices are available to clear partial occlusions of the adult endotracheal tube (ETT). Both devices claim the removal of secretions and biofilm from the ETT. There is limited information in the published literature about these devices and to our knowledge, no head to head comparisons on the performance of these devices to clear the lumen of a partially occluded ETT. We wanted to compare both devices in a bench model with simulated mucus for effectiveness to clear the ETT of a partial obstruction.
Methods:
A bench study was performed to test both devices: Restore 2, endOclear LLC (a balloon tipped catheter with a wiper) and CAM Rescue Cath, Omneotech (a balloon tipped catheter with mesh covering). A Drager V500 with volume-controlled settings was connected to an ASL 5000 test lung via an ETT. An adult size 8.0 ETT was tested with a sequence of 3 partial occlusions for each device. The occlusions were created with simulated mucus (a propylene glycol mixture that was colored blue - within the published range of human mucus viscosity). The occlusions were created by depositing approximately 2 mL of simulated mucus until there was a brief airway occlusion as noted on the ventilator. The devices were evaluated after a single pass of the catheter. Pressure-volume loops as well as breath to breath resistance measurements from the ventilator were used to evaluate the effectiveness of each device to clean the ETT lumen.
Results:
Average resistance measurements (cm H2O/L/s) for an 8.0 ETT with each device were as follows: CAM Rescue Cath: 23 (new ETT), 34 (ETT partially occluded), 24 (post ETT cleaning). Restore 2: 24 (new ETT), 34.5 (ETT partially occluded), 24.5 (post ETT cleaning). Both devices returned the measured resistance to within 1 cm H2O/L/s of a new ETT after clearing the partial obstructions of simulated mucus. Upon inspection of the endotracheal tubes post cleaning, the Restore 2 had no visible blue color remaining, but the CAM Rescue Cath left a visible film of blue throughout the endotracheal tube. See figure for a representative set of pressure-volume loops displaying the partial obstruction and the loop after cleaning the ETT.
Conclusions:
Both devices fully restored the original lumen of the ETT in our bench study after clearing a simulated partial occlusion based on the resistance measurements and pressure-volume loops. The Restore 2 visibly removed the blue coloring but with the CAM Rescue Cath a blue film was visible after cleaning.
Pressure-volume loops: new ETT, partial occlusion and post cleaning of both ETT cleaning devices
Meeting report
Restricted accessMeeting reportFirst published October, 2019pp. 3238831-3238831
The objective of this study was to characterize aerosol droplet size and distribution with laser diffraction for nebulized 3% NaCl, albuterol, and epoprostenol sodium.
Methods:
A series of flow tests were run on each of 8 Aerogen Solo nebulizer heads prior to the study to verify accuracy of flows in mL/minute. Aerosolized droplets exiting the nebulizer heads were then measured using a phase Doppler particle analyzer. Data collected during delivery of 3% NaCl, albuterol, and epoprostenol sodium included aerosol droplet size distribution, mass median aerodynamic diameter (MMAD), and geometric standard deviation. For each nebulizer head, droplet size measurements were taken at the following locations: 2 cm away from the nebulizer head and 2 cm away from the Y-piece of a heated, humidified adult ventilator circuit. For measurements taken at the Y-piece, 4 distinct, continuous flows (2, 10, 20, and 40 L/min) were generated by an air pump to simulate inspiratory flows delivered with mechanical ventilation. The expiratory limb was capped, and the nebulizer head was inserted into the breathing circuit upstream of the humidifier.
Results:
Each Solo nebulizer met Aerogen’s recommended minimum flow of 0.2 mL/min, ranging from 0.23 to 0.31 mL/min. The MMAD of the 3 tested aerosols was several times larger when measured directly at the cup outlet (MMAD, 4.6-7.3 µm) than at the outlet of the heated/humidified breathing circuit (MMAD, 0.85-2.73 µm). See Figure displaying MMAD and geometric standard deviations. The lower limit of detection for droplet size of the phase Doppler particle analyzer is 0.5 µm.
Conclusions:
Aerosol size was smaller than expected with the simulation. Previous studies using cascade impactors to evaluate MMAD indicate that vibrating mesh nebulizers should be expected to generate droplets <3.3 µm in diameter. Evaluation of Solo nebulizers in high-flow nasal cannulas shows that over 80% of the inhalable mass is fine particles between 0.4-4.4 µm. In the current simulation study, most particles ≥3 µm in diameter appeared to be trapped in the inspiratory circuit before they could have had a chance to be delivered to the patient. Droplets up to 1 µm may be exhaled before diffusion takes place. This may result in less drug being delivered to the patient than previously realized.
Meeting report
Restricted accessMeeting reportFirst published October, 2019pp. 3238872-3238872
Time spent by patients in daily management of cystic fibrosis (CF) affects adherence, therefore the choice of aerosol delivery device system becomes important, in order to achieve good lung deposition and satisfactory compliance. The I-Neb Adaptive Aerosol Delivery (AAD) system results in shorter treatment times and better deposition of the drug, if used properly. Most importantly, this device allows patients, caregivers and CF team to have feedback on the ongoing therapy. The aim of this study was to evaluate the change in recorded adherence and inhalation technique of patients with CF using I-Neb after an educational intervention (EI).
Methods:
This descriptive study was run at the CF Paediatric Centre of Milan. All patients using I-Neb and registered to online software “Insight Online” (IoL) were evaluated by respiratory physiotherapists during regular outpatient visits. EI consisted of 2 sessions: some theory to explain the technical characteristics of the device and cleaning and disinfection procedures, and some practice using a training software with visual feedback to optimize inhalation. Baseline and one-month follow-up data about adherence, inhalation, nebulization time before and after EI was analysed. Privacy rule authorization was obtained according to the local Ethics Committee.
Results:
24 patients (14 females) with CF, aged 5 to 34 y old, with a mean (SD) kg/m2 of 78(22)%pred. were included: 22 used Target Inhalation Mode (TIM) and 2 Tidal Breathing Mode (TBM). I-Neb compliance before EI was 74.5(33.7)%. Using TIM, mean nebulization time was 2.8(2.2) min; mean time with TBM was higher: 5.5(1.2) min. The mean inhalation time per breath using TIM was 2.8(2.5) s while using TBM was 1.4(1.1) s. The mesh performance was 84.6(38.5)%. After EI, the I-Neb use increased by 11.8%, the mesh performance grew of 6.4%. The rest time decreased by 2.9%. The inhalation time per breath using TIM increased of 1.2 s, using TBM 0.7 s. Nebulization time decreased for patients using TIM (0.4 min) while increased of 2.7 min using TBM.
Conclusions:
There was space for little improvements in the inhalation technique and device maintenance in the observed sample, even considering the optimal starting level. TIM offers several advantages over TBM, increasing the likelihood of a more effective inhaled therapy with shorter administration time. EI should be always part of the routine evaluation of patients with CF.
Meeting report
Restricted accessMeeting reportFirst published October, 2019pp. 3238888-3238888
The jet nebulizer (JN) and vibrating mesh nebulizer (VMN) are used to treat children with asthma and reactive airway disorder (RAD) in the emergency department (ED) setting. Imaging data demonstrates greater aerosol delivery to the lung with VMN compared to JN. There is no data comparing clinical outcomes of JN vs. VMN in the pediatric ED setting. The purpose of our study was to compare albuterol delivery with a large volume JN versus VMN to determine the effect on outcomes in pediatric patients with asthma and RAD exacerbations in the ED.
Methods:
The study was a prospectively designed chart review to compare 90-day treatment periods from December to March for two consecutive years (2018 and 2019) in pediatric asthma and RAD patients (2–18 y old) seen in the ED for an acute exacerbation. Patients weighing less than 20 kg received 2.5 mg albuterol and patients weighing greater than 20 kg received 5 mg albuterol with a VMN with a valved holding chamber (Aerogen Solo with Ultra, Aerogen, Galway, Ireland) instead of an hour- long weight based dose between 5 and 20 mg delivered with a large volume JN (Airlife Misty Finity Large Volume Nebulizer, Carefusion, Yorba Linda, CA). Primary outcome was the total amount of albuterol (mg) administered. Secondary outcomes included total number of treatments, ED length of stay (LOS) before discharge or disposition, admission rate, and 48-hour ED readmission rate. IRB approval was obtained. Data was extracted from Meditech and analyzed with independent sample t-tests.
Results:
Patient data was evaluated in year one JN (608, mean age 6.24 ± 3.64) and year two VMN (537, mean age 6.43 ± 3.81) resulting in a mean dose of 11.23 mg ± 5.21 and 3.72 mg ± 1.28 respectively (P < .001). Mean number of treatments administered in JN group compared to the VMN group was 1.52 ± 0.72 and 1.45 ± 0.64 (P < .001). Admissions decreased in the VMN group by 41% (JN 158, VMN 81). Return to the ED in 48 hours decreased in the VMN group by 42% (JN 29, VMN 15). ED LOS decreased by an average of 80 minutes.
Conclusions:
Use of the VMN in the pediatric ED setting significantly decreased the total amount of albuterol and number of treatments administered compared to large volume JN. Admission rates, 48-hour readmission rates and ED LOS were lower in the VMN group compared to the JN group. Randomized controlled trials are needed to support these findings. Disclosures: Authors have no commercial relationships.
Meeting report
Restricted accessMeeting reportFirst published October, 2019pp. 3238890-3238890
Lean Six Sigma processes are gaining ground in health systems worldwide. The concepts of huddles have been used to increase patient safety and facilitate efficiency in problem-solving. Daily huddles can help promote optimal patient outcomes and reduce poor communication between leaders and staff.1 Our Respiratory Care Department (RCD) implemented twice-daily shift huddle in 2015 and became proficient in the process in 2018. This study evaluated the number of issues that our huddle process resolved annually and its impact on employee engagement.
Methods:
This study was performed at a 200-bed pediatric hospital (Level 1 Trauma Center, Level 4 NICU). The RCD leadership team and staff were trained in the utilization of a lean huddle process to resolve issues and identify process improvement opportunities. Huddles were performed at the beginning of each shift before the RTs were dispatched to their assigned clinical areas. Issues were raised by the RCD bedside staff and leadership using the following categories: Safety and Service, Methods, Equipment, Supplies, and Associates. Opportunities were placed within three categories; quick hits (1-3 day resolution), complex problems (3-7 day resolution), and projects (> 7-day resolution). All opportunities included a problem statement, immediate countermeasure, problem leader, and due date on a dry erase board for transparency. Items requiring interdisciplinary support were escalated to the organizational patient care services huddle. Once the opportunities were resolved, they were placed in an excel spreadsheet that was emailed to all RCD employees. Feedback about the process was obtained via the Press Ganey Employee Engagement Survey performed in October 2018. The number of opportunities resolved was tracked from January 1st through December 31st, 2018.
Results:
The RT department has 112 employees, including management and support associates. Average daily census 143. A total of 366 opportunities for improvement were identified and resolved. Average of 30.5 (± 7.68) issues were resolved monthly. All feedback from the engagement survey was positive.
Conclusions:
By utilizing huddles, RCDs can handle both quick and complex problems in a more timely fashion. This process allows for direct and timely communication to staff and transparency that can aid in increasing employee satisfaction. Reference: Di Vincenzo P. Team huddles: a winning strategy for safety. Nursing 2019;47(7):59-60.
This graph displays the 366 opportunities for improvment surfaced in the Respiratory Care Department huddle in 2018 broken down by month.
Meeting report
Restricted accessMeeting reportFirst published October, 2019pp. 3238905-3238905
The importance of safe medication delivery is paramount. Although medication lateness is mentioned in medical literature, there is no standard available for benchmarking. In addition, benchmark data for Respiratory Care (RC) is non-existent. In recent years, the focus has been on information technology systems to avoid medication errors (ME). Safeguards like dose-error-reduction systems, barcode scanners, and independent double checks help to reduce some avoidable ME, but errors still exist when the medications are not delivered timely. According to recent data, a third of all ME causing patient harm, occur in the medication preparation and administration phases.1 We aimed to develop a baseline for medication lateness (ML) in our RC department and develop a plan for continued monitoring and improvement.
Methods:
IRB approval was obtained, and medication administration data was obtained for 2017 (baseline data) in our pediatric hospital system. All aerosolized medications on inpatient units were included. ML was defined as a medication administered more than 60 minutes after the scheduled time. Data was analyzed and reported to the RC staff for all months of 2018. Throughout the year, education on appropriate re-timing of medications, expected timeliness of delivery, and a trial of certain twice-daily medications on units was performed. Feedback from Respiratory Therapists (RTs) and pharmacy staff were solicited, and an and-on tracker was utilized to document barriers to timely medication delivery at twice-daily department huddles.
Results:
The baseline ML for 2017 was 4.04%, and the mean for 2018 was 3.34%. Increases in ML were associated with twice-daily administration times and with pentamidine delivery. No correlations between RT staffing, assignments, or medication type were substantiated. Adding twice-daily medications to automated dispensing cabinets for availability directly at the point of care did not improve medication lateness.
Conclusions:
Timeliness of medication delivery is an essential metric for RC departments to monitor that directly impacts patient safety and satisfaction. By utilizing a model of open communication, awareness, and soliciting feedback, we were able to improve overall ML in our department by over 20%. Further research must be done to establish benchmarks and implications for the field of RC. Reference: Smeulers M et al. Quality indicators for safe medication preparation and administration. PLos One 2015;10(4):e0122695. doi: 10.1371/journal.pone.0122695.
Thsi graph displays the total number of medications given by RTs in 2018 with a breakdown of the timeliness of delivery.
Meeting report
Restricted accessMeeting reportFirst published October, 2019pp. 3238923-3238923
Kristina D Ramirez, Victoria D Soucy, Hassan Alghareeb , [...]
View All
Abstract
Background:
Ventilator alarm selection in the ICU that has been poorly studied; which raises a concern for patient safety. We have previously reported that alarms are set very loosely probably due too the high number of false alarms and the fatigue they generate on the clinician. The results have been shared with clinicians and RT students who work/rotate at the institution where the study has been conducted. The goal of this study was to evaluate if selection of ventilator alarm parameters has changed over the last couple of years.
Methods:
A retrospective review of medical records of patients admitted to a medical-surgical ICU between May of 2013 and 2018 was conducted. The alarm settings selected for analysis were high respiratory rate (HI RR), high peak inspiratory pressure (HI PIP), and high and low minute volume (HI MV, LO MV), as they represent the most frequently documented alarms. SPSS 25.0 was used for data analysis. Means and standard deviations were calculated. A t-test was used to compare groups and statistically significant difference was set at a P < .05.
Results:
Recorded ventilator parameters and alarm settings of mechanically ventilated patients admitted to six ICUs at a university-affiliated, 496-bed hospital, in San Antonio, Texas. A total of 201ventilator checks were recorded. Patients monitored parameters were not significantly different between 2013 and 2014-2018 [19.6 vs. 19.8 ± 6.1 breaths/min); MV 10.3 vs. 8.1 ± 3.9 L/min); PIP 22.7 vs. 20.6 ± 7.3 cm H2O); P = .12]. The selected alarm settings deviated from patient parameters in a range similar to the previous year (67% to 155% in 2013 vs. 61% to 159% ± 46.6% 2014-2018). In the 2014-2018 period, there was a significantly higher difference between the alarm and the patient setting for the HI PIP (P < .001), the HI MV (P = .009), and RR (P = .03) while no significant changes in selection occurred for LO MV (P = .29)]. Only 9 out of the 201 alarms (6.1%) were consistent with recommended limits.
Conclusions:
Our results suggest that there is an “alarming” need to review the practice of ventilator alarm selection among RTs who routinely manage patients on the ventilator. This practice appears to be poorly individualized to patient clinical parameters.
Meeting report
Restricted accessMeeting reportFirst published October, 2019pp. 3238926-3238926
Automated Dispensing Cabinets (ADC) are a pharmacy adjunct that assists hospital pharmacies in ensuring medication is safely stored and delivered at the point of care. One of the functions of ADC is the ability for users to override medications. The Joint Commission recommends that medication overrides only occur in emergent situations. When medications are removed via override, the risk for adverse events increases. We aimed to establish a benchmark for ADC overrides for aerosolized medications at a children’s health care system.
Methods:
IRB approval was obtained to conduct this retrospective single-center study. This study was performed at a 200-bed pediatric hospital (Level 1 Trauma Center, Level 4 NICU) and was part of a performance improvement project. The observation time of this trial was from January 1st to March 31st, 2019. All medications were maintained and dispensed via Pyxis ADC using standard medication procurement procedures. The override function allows for the clinician to obtain medications independent of a physician’s order if approved by the institution. A standard dispense is any medication dispensed with the patient’s name, medical record number, and physician’s order. An override dispense is any medication dispensed to a clinician without a physician order as required for a standard dispense. The pharmacy team downloaded all medication data from the Pyxis server to an Excel spreadsheet for review. The following data was collected: number of drugs dispensed, date and time of dispense, name and profession of the clinician requesting the medication, type of medication, and type of dispense (standard or override).
Results:
A total of 24,114 aerosolized medications were dispensed in the 3-month observation phase. 0.8% of the aerosolized medications were obtained via ADC override. See graph for additional information.
Conclusions:
This study can be used to develop and establish a benchmark for aerosolized ADC medication overrides. The total number of aerosolized medications that were overridden by the RT Team was minimal but accounted for 16.5% of total ADC medications for our institution. It is important to utilize the medication safety processes that are in place to protect our patients. Further studies should be completed to assess the impact of medication overrides in the field of Respiratory Care. Future research should also focus on the establishment of a similar benchmark for the adult patient population.
Graph displays the total number of aerosolized medications given and the total number of ADC overrides for the months of January-March of 2018.
Meeting report
Restricted accessMeeting reportFirst published October, 2019pp. 3238944-3238944
Spontaneous breathing trials (SBTs) have been shown to increase the success rate of extubations and to potentially decrease ventilator days (VD) and length of stay. Studies demonstrate that immediate extubation after successful trials of spontaneous breathing expedites weaning and reduces the duration of mechanical ventilation. It may be favorable to extubate patients off-hours and as soon as weaning parameters are met, since this could decrease complications and decrease VD. Conversely, overnight extubation (OE) could be deleterious, as staffing varies during this time. In our Pediatric Intensive Care Unit (PICU), we maintain a consistent staffing model for all shifts and disciplines. We hypothesize that our patients would have a comparable failed extubation (FE) rate from baseline, regardless of the time of day the patients were extubated. We also anticipated increased OE would have a positive impact on total VD.
Methods:
With a team of Physicians and Respiratory Therapists (RT), we developed criteria based upon literature for an RT-driven SBT trial to be performed on each qualifying intubated patient in the PICU twice daily. This was implemented in March 2017. Noticing an increase in OE (1900-0659) since the SBT started, we did an IRB approved retrospective data analysis of our safety metrics and audits collected for the SBTs. We analyzed the data to see if there were any changes in the percentage of FE (reintubated within 48 h) and, more significantly, if it reduced our total VD. We reviewed the time of extubation, number of FE, number of failed OE, and total VD for one year before and after initiation of an SBT in our PICU.
Results:
From 3/2016 to 3/2017, there were 323 extubations. 76 of these were OE (23.5%), and there were 31 FE (10.4%). Twelve of these FE were OE (38.7%). After initiation of an RT driven SBT, from 3/2017-3/2018, there were 353 extubations. 99 of these were OE (28%), and there were 32 FE (9.1%). Nine of these FE were OE (28.1%). With an increase in OE post initiation of SBT, we still saw a decrease in failed OE (38.7% to 28.1%). Total VD was 2897 compared to 2777 days from before and after SBT initiation (decrease of 9.6%).
Conclusions:
By utilizing an around the clock model for our RT driven SBT, our facility was able to improve outcome metrics (FE rate and total VD) for PICU patients. Further studies should be done to explore the relationship between OE, staffing, and mortality.
Meeting report
Restricted accessMeeting reportFirst published October, 2019pp. 3238954-3238954
Ventilator-associated pneumonia (VAP) is a major cause of hospital morbidity, mortality, and increased health care costs1. Since multiple factors contribute to the high risk of ventilator-associated pneumonia, a multi-strategy approach is required to prevent such infections2. VAP care bundle implementation with education prepared according to evidence-based guidelines has been shown to decrease VAP rates. The role of the Respiratory Therapist is integral to the success of any VAP prevention bundle. We aimed to evaluate a multidisciplinary intervention model to reduce our PICU VAP rate.
Methods:
We identified that VAP was a common problem in our 24-bed tertiary PICU. We then initiated a multifaceted approach to design a program to reduce VAP. Hospital management, infection prevention, respiratory therapy (RT), physicians, and nursing (RN) developed a core group to plan an approach to reduce VAP rates. A bundle of items that previously existed was edited and enhanced, and rigid audits were done to ensure compliance. We developed a twice-daily protocol-driven spontaneous breathing trial (SBT). The physician provided education and created an order set to use within the electronic medical record (EMR) to ensure all bundle elements were ordered. The RT group provided training and began the SBT process. EMR modifications ensured identification of VAP risks. A formal evaluation process was initiated for each VAP, including a multidisciplinary swarm of the event within 48 hours and distribution of findings. We also began a protocolized identification process by bedside RTs of high-risk patients and began having a pre-swarm" on these patients to highlight their risk and identify mitigation strategies.
Results:
Quarterly VAP rate per 1000 vent days decreased from 4.8 the quarter before the intervention to 0, 1.4, 0, 0, 0, 0 for the following quarters. The number of audits of bundle compliance increased as well as adherence.
Conclusions:
We instituted a multidisciplinary long-term bundled approach to reduce VAP in our PICU. Using this comprehensive program of interventions, education and ongoing evaluation, we were able to significantly reduce VAP and achieve a zero rate for the past year (2018). References: 1. Galal et al. VAP: incidence, risk factors and outcome in pediatric intensive care units. J Clin Diagn Res 2016;10(6):SC06-SC11. 2. Alsadat R et al. Use of VAP bundle and statistical process control chart to decrease VAP rate in Syria. Avicenna J Med 2012;2(4):79-83.
VAP Bundle Elements
VAP Bundle Elements
Role Responsible
Ventilator Circuits fully changed monthly or when visibly soiled.
RT
Head of Bed at/above 30°.
RT, RN, MD
Chlorhexidine ordered and oral wash/tooth brush Q12.
RN, MD
Antiseptic oral swabs Q4.
RT, RN
Separate and labeled suction tubing for oral and airway secretions.
RT, RN
Daily assessment to wean from Ventilator (SBT Trials at 0400 and 1600.
RT, MD
Meeting report
Restricted accessMeeting reportFirst published October, 2019pp. 3239000-3239000
Protocol driven care has been well documented to provide effective and efficient care for patient needs. There has been scarce data documenting the value of a noninvasive (NIV) weaning protocol with the goal of decreasing hours (h) patients are on NIV. In order to validate the hypothesis that patients with acute respiratory or cardiac decompensation an evidenced based RT driven weaning protocol would decrease total NIV h.
Methods:
An IRB approved Quality Improvement Project conducted in a Medical Intensive Care Unit. Data from a pre-intervention period of physician directed weaning was compared to prospective data obtained during post-intervention of RT protocol directed use. The Mann-Whitney U test was used to analyze the continuous variables of NIV hours (h) and ICU hours.
Results:
A total of 24 non-OSA diagnosed patients’ who experienced acute decompensation due to pulmonary or cardiac reasons NIV hours were compared. Review of 11 randomly selected patients in the pre-protocol physician directed NIV period was compared to 13 consecutive patients in the post-protocol period when placed on a three day RT directed NIV wean. Pre-intervention period median NIV h for the physician directed NIV wean: Day One 8.44 h, Day Two 4.34 h, and Day Three 0.0 h. Median overall ICU hours were 179.5 in the pre-intervention period. Post intervention Protocol managed median NIV hours; Day One 4.5 h, Day Two 0.0 h, and Day Three 0.0 h. Median overall ICU hours during the post period was 73.1. Mann-Whitney Test η1 = η2 vs η1 ≠ η2 was used for analysis of significance of change for both NIV and ICU hours. The decrease in NIV hours was statistically significant at 0.035. The decrease in ICU hours was not statistically significant at 0.271, No complications or adverse events occurred for any of the patients in the pre or post period.
Conclusions:
The statistically significantly decrease in NIV hours validates the hypothesis that use of a RT driven protocol is effective in decreasing time on NIV. Although ICU hours decreased for the RT protocol group, it was not statistically significant. In conclusion the RT Protocol directed NIV wean is safe and led to a statistically significant decrease in median hours of NIV with RT driven protocol use. Additionally, RT labor hours and ICU bed availability may be gained by implementation of a RT directed NIV weaning protocol.
Meeting report
Restricted accessMeeting reportFirst published October, 2019pp. 3239008-3239008
Esophageal balloon catheters can be used to estimate effort of breathing by measuring the change in pressure during inspiration (dPes) as well as estimating actual pleural pressure (Pes) for transpulmonary pressure calculations. The reliability depends on balloon filling volume. We evaluated the accuracy of pediatric and adult sized esophageal balloons over a range of balloon inflation volumes and surrounding pressures to measure dPes and Pes, and sought to derive an algorithm for inflation which would be accurate for both values.
Methods:
Esophageal catheters housed in a model esophagus (6Fr pediatric and 8Fr adult) were submerged to depths of 5, 10, and 15 cm of water within a sealed chamber. dPes was simulated by attaching a syringe to the top of the chamber to create cyclic negative pressure. Balloon inflation volume was adjusted for each catheter and the difference between dPes and delta chamber pressure was reported as total error (dPes) and the difference between Pes at baseline and the water depth was reported as total error (Pes). An algorithm was developed using Pes values and inflation volume to estimate the optimal filling volume, and error at this filling volume was reported.
Results:
Over or under-inflation of the balloon results in significant error for both dPes and Pes. The range of inflation volume with minimal error < 3cm H2O, is larger for the adult catheter (0.2-0.8ml) than it is for the pediatric catheter (0.2-0.4ml). When applying the filling volume derived from the algorithm, total error ranged from -2.8 to 1.0 cm H2O, for both dPes and Pes.
Conclusions:
Esophageal balloon inflation volume affects the accuracy of dPes and Pes, particularly with smaller pediatric balloons. However, a calibration algorithm which targets stability on the balloon elastance curve can be applied to ensure accuracy of both dPes and Pes, and should be used in-vivo.
Total error of dPes (white triangles) and Pes (black circles) as a function of esophageal balloon filling volume, stratified by simulated pleural pressure (water depth) and catheter size. Vertical black lines show the location of the optimal filling volume identified by the algorithm that seeks to identify the beginning of the flat part of the esophageal balloon elastance curve.
Meeting report
Restricted accessMeeting reportFirst published October, 2019pp. 3239056-3239056
Many patients experiencing respiratory failure requiring mechanical ventilation (MV) undergo tracheostomy due to difficulty weaning from MV. Varying devices are used to deliver humidified oxygen to these patients. There is currently no accepted standard of practice for which device to use. This medical center sought to compare the impact of use of a standard oxygen delivery High Humidity Trach Collar (HHTC) to a High Flow (HF) Oxygen Integrated Flow Generated delivery device.
Methods:
This IRB approved cross over study was conducted in the medical and surgical Intensive Care Units (ICU). The primary study aim was to determine if there was a difference in the duration of MV with the use of a HF Integrated Flow Generated Oxygen delivery device rather than a standard HHTC Oxygen delivery device. ICU DAYS were also assessed. The Study was a cross over design. Patients in one ICU began using a standard HHTC while the other unit began with use of a HF integrated flow generator device. After a period of 6 months the device used “crossed over” to the alternate model for each ICU. The Mann-Whitney U test was used to analyze the continuous variables of MV and ICU days.
Results:
44 patients were placed on either device based on ICU location following placement of new tracheostomy. Mean Apache scores were 15.48 for the HHTC group and 16.09 for the HF group. 21 patients were placed on standard HHTC and 23 on HF type. Findings were: median days for HHTC patients was 15.0 and for HF device 8.95. Median ICU days were 23.0 for HHTC and 18.0 for HF. Mann-Whitney Test η1 = η2 vs η1 ≠ η2 was used for analysis of significance of difference for both MV and ICU days. Patients placed on HF device did show a statistically significant improvement value of .0483 (adjusted for ties) when comparing days of MV. ICU days comparison had a value of .0567 (adjusted for ties) which closely approached statistical significance.
Conclusions:
The statistically significantly difference in MV hours indicates that use of a HF Integrated Flow Generated Oxygen delivery device may decrease newly tracheostomized patients’ time on MV yielding improved patient safety and decreased cost of care. Decreased ICU Days although not statistically significant may yield the benefit of increased availability of ICU beds.
Meeting report
Restricted accessMeeting reportFirst published October, 2019pp. 3239060-3239060
Maureen Lintner, Jose Morales, Rosario E. Domingues , [...]
View All
Abstract
Background:
According to the Worldwide Health Organization, worldwide, it is estimated hundreds of millions of people are affected by chronic respiratory diseases. COPD is a leading cause of death in the United States, and imposes an enormous financial burden on our nation’s health care system (COPD. NIH.GOV). COPD patients with severe exacerbations requiring emergency visits or hospitalizations per year are at higher risk for all- cause mortality (Soler-Cataluna JJ et al. Thorax 2005;60(11):925-931). A multidisciplinary Lung Health Outpatient Resource Center was established as a continuum of care to support our COPD population post discharge. Patients seen in the center showed successful outcomes, which have led to decreasing readmissions and improved cost savings. Therefore, the center expanded its services to include other chronic pulmonary diseases including pneumonia and pleurisy, asthma, bronchitis, and other respiratory infections.
Methods:
The multidisciplinary team was headed by the Respiratory Department in conjunction with the Outpatient clinic and included; nurse practitioners (ARNP), respiratory therapist (RT), registered nurses (RN), social worker (SW), pulmonologist and pharmacy. The center incorporates weekly follow up visits during the acute phase post discharge where symptom management, individualized action plans, interpersonal psychosocial and emotional support is provided and created with the patient and family. Pharmacological and non-pharmacological interventions are utilized to optimize the individual’s treatment goal.
Results:
The Lung Health Outpatient Resource Center was established in June 2017. Data was collected from June 2017 to March 2019. Total population referred was 304 patients. Patients seen in the center (150) had an 8% readmission rate, and those not seen (154) had a 12.9% readmission rate. The estimated average variable cost savings for patients seen was of $1,217,206.90 Conclusions: Through utilizing an outpatient resource center and adherence to plan of care, hospital readmission rates were decreased and variable cost savings improved. Sustainability by expanding our services to other chronic pulmonary diseases has been shown.
Meeting report
Restricted accessMeeting reportFirst published October, 2019pp. 3239062-3239062
Georgianna S Sergakis, Robyn Gordon, Amelia Harmon , [...]
View All
Abstract
Background:
E-cigarettes are fairly new, but are exponentially increasing in popularity. Subsequently, there is emerging evidence-based research on the topic. Patients are increasingly asking healthcare providers about e-cigarettes, especially as methods for cessation from combustible cigarettes. The advice patients receive from healthcare providers influences their perceptions and behaviors. Current and future healthcare providers should be prepared to provide advice to their patients regarding this emerging issue. The purpose of the study was to assess and compare the knowledge, perceptions, and self-efficacy of emerging healthcare professionals (students) regarding the use of e-cigarettes.
Methods:
This IRB approved, national survey of nursing and respiratory therapy (RT) students utilized a pre-test, post-test design following a brief educational intervention. The brief on-line video module was a 9.5 minute review of the National Academies of Science publication, “Public Consequences of E-Cigarettes.” Knowledge, attitudes, and self-efficacy for counseling about e-cigarettes were explored using an on-line survey instrument before and after viewing the video. Data analyses included descriptive statistics and t-tests.
Results:
A total of 308 students (54% RT; 57% associate’s degree) were recruited by an email sent to their program director and elected to participate. Most (77.3%) were not educated in their program about e-cigarettes, and received information largely from ads and social media. Baseline assessment of their knowledge and perceptions were not congruent with the current levels of scientific evidence, but this improved following the educational intervention. In addition, student reported self-efficacy in counseling also improved (P < .001) after viewing the e-cigarette module.
Conclusions:
Emerging RT and nursing professionals are not receiving adequate education on e-cigarettes in their curriculum which may impact their ability to properly discuss the topic with patients. A brief education module was shown to be effective in improving perceptions and increasing students’ knowledge and confidence. The module can be easily embedded into program curricula and can also be updated continuously as the scientific evidence about e-cigarettes emerges. Further exploration of the use of this brief online e-cigarettes module tailored to a variety of audiences including healthcare providers, patients, parents, and teens is recommended.
Meeting report
Restricted accessMeeting reportFirst published October, 2019pp. 3239101-3239101
Kimberly Buschmeier, Stanley Hendricks, Danielle Kimmet , [...]
View All
Abstract
Background:
Postoperative pulmonary complications (PPC) can affect patient outcomes, mortality rates, length of hospital stay, readmission rates, and healthcare costs. Incentive spirometry (IS) and positive expiratory pressure (PEP) are often prescribed postoperatively for lung expansion and secretion clearance, respectively, and may reduce PPCs. The incentive positive expiratory pressure (iPEP) device combines the functions of both IS and PEP. The purpose of this study was to explore the beliefs and perceived effectiveness of the iPEP device versus the combination of a traditional IS device and PEP device among respiratory therapists (RT) who provide postoperative care to patients.
Methods:
Each participant attended an in-service on the use of the iPEP conducted by the researchers. The in-service utilized educational resources available from the iPEP device manufacturer. Following the in-service, RTs completed a survey regarding perceived effectiveness, ease of use and patient adherence for the iPEP as compared to IS and PEP devices. Descriptive statistics were used to answer the research questions.
Results:
The study was reviewed and approved by the Institutional Review Board. Following the in-service, 43 completed surveys were returned. RTs preferred iPEP over traditional IS and PEP with 77.5% recommending iPEP for use in postoperative patients. RTs rated the iPEP highly (mean >3.8) in all seven categories surveyed on a 5-point Likert scale. Participants commented that the use of one device to complete two therapies may increase patient adherence and decrease treatment time, but had concerns with the inability to change resistance of PEP oscillation, the increased number of steps to use iPEP, and the need for patients to have strong breath control for proper use of therapy.
Conclusions:
RTs believe the iPEP may be beneficial to address PPCs, which suggests that evaluating patient preference for postoperative devices and determining clinical benefit of the iPEP are important next steps. Disclosures: None.
Meeting report
Restricted accessMeeting reportFirst published October, 2019pp. 3239105-3239105
Patients have expressed that they could feel a difference in the effectiveness of breathing treatments given in the hospital from a flow meter versus those at home with a compressor. This made us question if there was a difference in respirable dose (RD) between compressors and flow meters. The purpose of this study was to determine if compressors could produce a nebulizer efficiency for Budesonide (B) and Dornase Alpha (DA) that had previously been determined. The research question was, is there a correlation between nebulizer/flow meter flow and pressure, and RD and what was nebulizer efficiency? Methods: A breath-enhanced nebulizer with either a unit dose of B or DA connected to either an air-flow meter or a compressor, was operated until sputter. Spontaneous breathing was simulated by a test lung connected to a breath simulation module, to produce a VT of 155 mL, f of 25 breaths/min, and a TI of 0.5 s, consistent with a pediatric breathing pattern. During nebulization, the flow and pressure of the compressor or flow meter was measured by bourdon gauge and liter meter. The RD was calculated by weighing a filter before and after the treatment. The nebulizer efficiency was calculated by dividing the RD by the nominal dose. Pearson’s r was used to determine the correlation between flow/nebulizer RD and pressure/nebulizer RD for each drug. Significant correlations = P < .05.
Results:
For DA (40 trials), the nebulizer efficiency was 9.16%-18.24%, while the nebulizer efficiency for B (42 trials) was 1.15% – 21.45%. There was a significant correlation between the flows produced by the compressors and/or the air-flow meter for both DA (r = 0.1414, P = .02) and B (r = 0.1163, P = .03) and RD. However, there was no correlation between the compressor/flow meter pressure and the RDs for both drugs. Certain compressors had greater efficiency.
Conclusions:
Clinicians may need to know the efficiency of the compressor/nebulizer combination they are using, since there is a relationship between flow and RD. Since others have shown that the Parineb can achieve > 50% efficiency, the burden falls to the gas supply. None of the compressors we tested provided a nebulizer efficiency of 50% or more. These were all compressors that were off the shelf, common practice in the respiratory therapy department. Perhaps the RT department should have means of verifying compressor efficiency when high efficiency aerosol delivery is desired.
Meeting report
Restricted accessMeeting reportFirst published October, 2019pp. 3239158-3239158
Evaluation of diaphragm thickness by ultrasound imaging is currently being used in the clinical setting. These uses include evaluating diaphragm dysfunction during management of mechanical ventilation and as an important criteria for weaning patients from mechanical ventilation. However, the education for the method of using ultrasound imaging for co-medical staff is not common. Furthermore, there is no published research describing the reliability of ultrasound evaluation by co-medical staff, who are not radiologists or sonographers. Therefore, the purpose of this research is to investigate the reliability of diaphragm thickness measurement with ultrasound imaging by co-medical staff after training in the use of the device.
Methods:
This study was approved by the IRB at Yokosuka General Hospital UWAMACHI. Three co-medical staff (RRT/RPT, RPT, Medical technologist) were trained in the use of ultrasound imaging for two months. The data were gathered from December 2018 – May 2019. The diaphragm thickness was evaluated in twenty healthy male subjects under resting conditions. A device (TUS-X200S, TOSHIBA) was used in all measurements. As per previously published research, the subjects were supine, with the right shoulder in 30 - 40 degree abduction. The measurement point was marked at 8th to 10th intercostal margin on the right anterior axillary line, allowing the diaphragm to be visualized at FRC and at TLC. A linear probe in the B mode was used. A printout of the graphic image of the ultrasound display was used for the measurement. The thickness of the diaphragm, 5 mm and 10 mm from the edge of the graphic display of the ultrasound image at FRC was evaluated, as well as the point where the pleura and peritoneum could be identified, in parallel, at TLC. Three examiners evaluated diaphragm thickness twice at FRC and TLC. Intraclass Correlation Coefficients (ICC (2, 1)) were analyzed by R (ver. 3.4.1).
Results:
Each ICC (2, 1) for the first and second measurements were: FRC 5 mm, 0.92 and 0.93, respectively; FRC 10 mm, 0.89 and 0.93, respectively; TLC, 0.86 and 0.85, respectively.
Conclusions:
The findings suggest that measuring diaphragm thickness at FRC and TLC, by well-trained co-medical staff, is reliable and effective. A limitation of this study is that the thickness of the diaphragm may be different, if the measurement point on the body surface for each evaluation is not marked and used consistently among different examiners. Disclosures: None.
Meeting report
Restricted accessMeeting reportFirst published October, 2019pp. 3239163-3239163
In a healthcare delivery system, labor costs typically represent over 50 percent of a hospital's total operating expenses. For the typical respiratory therapy (RT) department, work is performed in a cyclical pattern throughout the shift, have seasonal variations, and labor is not necessarily matched to work. A reduction in labor metric swings is an opportunity from a labor management perspective.
Methods:
The Respiratory Therapy Department at Hershey Medical Center, the flagship hospital for the Penn State Health System, began using a web based scheduling system in 2013. The initial rollout allowed staff to view work schedules, submit requests for time off, and pick up extra shifts on any internet enabled device. In July of 2016, the department developed an RT activity volumes feed, based off of orders from our electronic health record to our scheduling and predictive analytics partner. The volume feed interfaced 5 times per day, with orders placed in to four categories; medications, ventilators/noninvasive devices, high flow oxygen therapy, and non-medication secretion management and hyperinflation therapy. The time associated with each activity is a hybrid of internal time studies and the American Association for Respiratory Care’s (AARC) Uniform Reporting Manual (URM). The weighted time of RT activity are converted into work hours and indicates the number of staff required for each area of the hospital in four hour blocks of time. The volume feed of orders translated into work hours and integrated into our staff scheduling system captures three things: a seamless snapshot of ordered RT activity throughout the organization, a more granular view of activity ordered by unit/floor for resource deployment, and historical data to predict low and high demands for RT resources, adjusting RT staffing needs based off the data. Results: For 12 months prior to July 2016, month to month average percent variance in worked hours/total primary units (WHPU) = 11.27 ± 9.09. For 30 months after the implementation of the volume feed, the variance = 7.51 ± 6.36; P = .184. For the first 10 months of our 2018-2019 fiscal year, the department was under budget on the WHPU metric by 1%. In both FY 2016/2017 and in 2017/2018 we experienced a 5% unfavorable variance.
Conclusions:
Aligning RT staffing to cyclical patterns of work is a challenge for any department. The use of technology and predictive analytics shows promise in closely aligning staff to when the work happens.
Meeting report
Restricted accessMeeting reportFirst published October, 2019pp. 3239167-3239167
Jeremy Preston, Kellye Smith, Gabriel Rodriguez , [...]
View All
Abstract
Background:
To provide a consistent clinical practice and timely interventions in the management of our cardiothoracic surgical patients who require mechanical ventilation post operatively. We updated our policy regarding the care of this specialized patient population with a focus on improving the timeliness of the weaning and extubation process. Utilizing our “Cardiac Fast Track Weaning” pathway, we proposed that the Respiratory Therapist would perform a ventilator check at least every 30 minutes for the first two hours to assess readiness for extubation.
Methods:
Cardiac Fast Track Weaning order was placed in the EMR as a part of the post-operative order set by the surgeons. Patients were identified as a Fast Track candidate during ECHO report immediately upon arrival to the ICU. The Respiratory Therapist utilized the CVICU Fast Track Weaning Flowchart as a guide to assess patient for readiness, with a goal to extubate the patient safely within four hours upon arrival to the ICU. The Respiratory Therapist assessed the patient and monitored the ventilator immediately after initiating mechanical ventilation, at least every 30 minutes for the first 2 hours, and then at 2 hour intervals thereafter. Once patient met the eligibility requirements the patient was placed on pressure support, with a goal of tidal volume at least 6-8cc/kg IBW. If the patient met the extubation criteria as determined by the pathway, the Respiratory therapist would notify the physician the patient was ready for extubation.
Results:
Data collected from January 2018 to December 2018 showed a decrease in extubation time. Patients identified as Fast Track had an average of 144 minutes, compared to 284 minutes with patients who did not receive the Q30 minute assessment.
Conclusions:
When the pathway was followed with patient and ventilator assessments every 30 minutes, time spent on the ventilator was significantly lower.
Meeting report
Restricted accessMeeting reportFirst published October, 2019pp. 3239177-3239177
Krystal Craddock, Brian Smith, Chelsie Gilbeau , [...]
View All
Abstract
Background:
Procedural and equipment competencies are a requirement for many respiratory care practitioners (RCP’s). Simulation based training may be used to improve knowledge and safety in areas of high risk and high-stress environments. Previous annual skills days in the RT department at UC Davis Health utilized lecture and hands on equipment training. We set out to see if including the use of high simulation mannequins with real life scenarios in skills day education would improve RCP satisfaction of education, relevance, and if the RCP felt there was an investment in their clinical knowledge.
Methods:
Two RCP clinical educators, five RCP’s, and two simulation specialists at UC Davis Health created and facilitated two high simulation scenarios utilizing mannequins at each of the 10 skills day in 2018. The high simulation mannequins spoke, had breath sounds, pulses, vital signs, and the ability to be ventilated on mechanical ventilators. Asthma and Acute Respiratory Distress Syndrome (ARDS) scenarios were created to educate the RCP clinical staff on assessment, treatments, and ventilation modalities of these disease processes. These scenarios were an hour long each, broken into three segments that accommodated three RCP’s to assess and treat the mannequin patients, while six of their RCP colleagues viewed and listened from a separate room. The entire group would then congregate for debriefing after each segment of the scenario.
Results:
36 of the 123 (29%) RCP’s who attended the 2018 annual skills day responded to the anonyms online survey. 35 (97%) RCP’s felt that the topics were relevant to their daily practice. 34 (94%) RCP’s felt there was an overall improvement in skills day compared to previous years. All respondents (100%) felt the RT department was committed to furthering their knowledge and education.
Conclusions:
It is well understood that simulation is a safe and effective method of education for clinicians. These survey results show that RCP’s are satisfied with the case scenario and high simulation style of learning and feel it relevant to their everyday practice. Instituting this type of education may also contribute to the satisfaction that RT departments are dedicated to fostering their RCP staff's clinical knowledge.
Meeting report
Restricted accessMeeting reportFirst published October, 2019pp. 3239188-3239188
In a 500 bed academic medical center comprised of multiple medical specialties that provide tracheostomy and laryngectomy services to the adult patient population. It was observed that there was a limited standard and quality of care. A team was created to develop standards and improve the quality of care for this patient population, their families and staff to ensure the highest standards in patient safety and experience.
Methods:
In November 2017 a Multidisciplinary Neck Airway Team consisting of a Team Coordinator (respiratory therapist), attending physician, speech pathologist and a wound care nurse was created to round weekly on all adult neck airway patients. The Multidisciplinary Neck Airway Team rounds include assessment of the airway device, skin integrity, emergency supplies, weaning needs such as (initial or routine trach changes, downsizing, speaking valves, swallow studies, capping trials and decannulation). The Multidisciplinary Neck Airway team coordinator is available throughout the week to provide help and resources for questions, concerns, order placement needs and supplies and evaluates patients that have been intubated with an endotracheal tube greater than 96 hours for possible early tracheostomy in collaboration with the patient’s provider. Working closely with social services, care coordination, clinical staff and the adult rehabilitation team, the Multidisciplinary team aids in the implementation of education for patients and family members to encourage independence and knowledge for discharge.
Results:
Based on our data provided to Vizient, baseline average length of stay (LOS) for this patient population for one year was 26 days; average direct cost of care was $76,000 per patient encounter. Post official launch of the team in April 2018, we analyzed the first 30 patients seen as part of the program. The LOS dropped to 25 days and the direct cost of care decreased to $64,000 per encounter. While these improvements are not statistically significant, the data set is small and are considered preliminary findings in this body of work, the team feels confident in the worthiness of this program.
Conclusions:
The implementation of this Multidisciplinary Neck Airway Team created institutional awareness and standardization, improving patient safety and quality. This in turn may decrease LOS, cost, related pressure injuries, length of mechanical ventilation, and possibly readmissions.
Meeting report
Restricted accessMeeting reportFirst published October, 2019pp. 3239197-3239197
Oxygen therapy in the premature neonatal population is associated with negative outcomes and neonatal intensive care units (NICU) use continuous pulse oximetry to limit its use in these vulnerable subjects. The NICU at a large university hospital has a 4-pronged Target Oxygen Protocol 1) Set correct SpO2 alarm limits 2) Use Nellcor OxiMax N-600x pulse oximeter (Covidien, Mansfield, Massachusetts) to display histogram of percent time in each SpO2 quintile per 24h period 3) Display correct postmenstrual age oxygen target saturation card 4) Set oxygen blender FIO2 < 10% above current support. We hypothesized that performing daily audits would not increase compliance with oxygen management strategies compared to random audits.
Methods:
Before fall 2018, random audits of target oxygen protocol parameters were performed by NICU staff. Analysis of audit data identified drift from NICU strategies. A multidisciplinary team consisting of physicians, respiratory (RT), and nurses, met to identify possible solutions. RT trialed adding the audit to their workflow for one week and based on feedback, the form was modified to allow tracking of one week of data for each 12-hour shift. RT also noted varying levels of knowledge about oxygen strategies and need for continued education. Education was given and RT began daily data collection in September 2018.
Results:
Audit data before, January-March 2018 (n = 120), and after, October-December 2018 (n = 135), daily audit implementation was compared. Chi square analysis showed that three of the four parameters saw clinically significant improvement: Nellcor use increased from 91-98% (P = .02), gestational oxygen saturation card use increased from 87-96% (P = .007) and setting the oxygen blender10% above current respiratory support increased from 79-95% (P = <0.001).
Conclusions:
Results suggest that daily audits increase compliance with the target oxygen management strategies. Continued surveillance may identify barriers and strategies to improve compliance with target oxygen protocol strategies.
Pre/Post Target Oxygen Strategy Compliance
Oxygen Strategy
Random Audits(n=120 subjects)
Daily Audits (n=135subjects)
P
Correct SpO2 alarm limits
99/115 (86%)
103/135 (76%)
0.05
Nellcor use
109/120 (91%)
133/135 (98%)
0.02*
Display PMA oxygen target saturation card
101/116 (87%)
130/135 96%
0.007*
above respiratory support FIO2
92/116 (79%)
128/134 (95%)
<0.001*
* Significant
Meeting report
Restricted accessMeeting reportFirst published October, 2019pp. 3239199-3239199
Jeremy Gibbs, Katie McLaughlin, Joie Burns , [...]
View All
Abstract
Background:
Exercising patients in the ICU receiving mechanical ventilation has shown to have positive outcomes; however, there is limited evidence as to which mode of ventilation to use during exercise. The purpose of this study was to evaluate the change in diaphragm thickness between expiration and inspiration (ΔDTE-I) during exercise in four modes of ventilation in normal subjects, to determine which mode had the smallest ΔDTE-I, indicating the lowest WOB.
Methods:
Following IRB approval, 16 subjects (8 male, 8 female) were ventilated with the PB 980 in VC A/C, VC + A/C, PC A/C and CPAP with PSV. Ventilator settings: PEEP 0 cm H2O in all modes, VT 8 mL/kg in VC A/C and VC + A/C, PSV 5 cm H2O in CPAP, PIP 5 cm H2O in PC A/C. While sitting on an exercise bike, subjects breathed on one of the 4 randomly assigned modes of ventilation for 2 minutes. At the end of two minutes, the diaphragm thickness was measured at end-expiration (DTE) and end-inspiration (DTI) on 3 breaths, when possible, by an experienced sonographer using a 9L3 linear transducer at 8 MHz. Heart rate (HR), SpO2, PEEP and Borg rating were recorded. Subjects remained in the same mode and started to pedal 50 RPM. At two minutes, subjects stopped pedaling, but continued to breathe on that mode while data were gathered. After the subject’s HR and SpO2 returned to baseline, the next randomly assigned mode was selected and the process was repeated until the subject breathed on all four modes.
Results:
VC A/C had the highest, and CPAP with PSV had the lowest, Borg rating during exercise, 6.25 and 1.94, respectively. During exercise, VC A/C had the most negative PEEP (-15.5 cm H2O), while PEEP in CPAP with PSV was least affected (-0.28 cm H2O). There was no statistically significant difference in DTI, DTE or ΔDTE-I when comparing VC A/C, VC + A/C and PC A/C to CPAP with PSV during exercise.
Conclusions:
VC A/C was shown to have the highest work of breathing via the Borg rating, the decrease in SpO2 and the decrease in PEEP. It is very difficult to measure the change in diaphragm thickness in a normal subject while exercising because of the chest movement and variation in VT causing the excursion of the diaphragm to move out of the range of the ultrasound transducer. There was no significant difference between DTI, DTE, ΔDTE-I between modes, during rest or exercise. Factors such as negative PEEP, SpO2 changes and the patient’s perceived WOB should be used to evaluate WOB during early mobility.
Meeting report
Restricted accessMeeting reportFirst published October, 2019pp. 3239209-3239209
More and more researchers have recommended critically ill patients to start mobilization as early as possible. However, the implementation of ICU early mobilization is not ideal, mainly due to insufficient staff and rehabilitation equipment in ICU, and the lack of exercise intention of patients. Our multidisciplinary research team including academic researcher, ICU head nurses and respiratory therapists and this team have developed a virtual reality system for ICU early mobilization (VREM system) to increase patients’ compliance of early mobilization. This study aimed to evaluate ICU nurses and patients' acceptance of VREM system.
Methods:
A cross-sectional survey was conducted in RICU nurses (n = 36) and patients (n = 55). The questionnaire was designed by our research team based on Technology Acceptance Model, consisting of seven dimensions: perceived usefulness, perceived ease of use, perceived ease of learning, perceived applicability, perceived security, perceived satisfaction and intention to use. The score of each item was ranged from 1 (strongly disagree) to 5 (strongly agree). After ICU nurses and patients fully used VREM system at least once, they filled out the acceptance questionnaire.
Results:
As shown in Figure 1, RICU nurses showed high acceptance of VREM system, the average score for each dimension is higher than 4 points. RICU patients showed also high acceptance of this system and the lowest average score was 3.7. Among the seven dimensions, perceived usefulness was the highest rated domain for nurses and patients' acceptance.
Conclusions:
The nurses and patients had good acceptance with VREM system. It also needs to further promote the function of VREM system based on nurses and patients’ suggestion.
Figure 1-Respiratory ICU nurses and patients' acceptance of the virtual reality system for ICU early mobilization
Meeting report
Restricted accessMeeting reportFirst published October, 2019pp. 3239222-3239222
Megan Anne West, Camille Atkinson, Morgan McEwan , [...]
View All
Abstract
Background:
Airway pressure release ventilation (APRV) is a pressure controlled mode of ventilation that ventilates the patient with a long Time High (Thigh) and short Time Low (Tlow) to intentionally create auto-PEEP. APRV may improve oxygenation and increase alveolar lung recruitment. The purpose of this bench study was to evaluate APRV on the Carefusion Avea (Avea) in APRV/BiLevel, Drager V500 (V500) in PC-APRV, Medtronics PB 980 (PB 980) in BiLevel, and Maquet Servo-I (Servo-i) in BiVent using the IngMar Medical ASL 5000 (ASL) electronic lung simulator set at three levels of static compliance (Cst) to simulate three severities of ARDS.
Methods:
An extended self-test was performed on each ventilator using oxygen and air. ASL settings: Cst 40 mL/cm H2O (mild), 30 mL/cm H2O (moderate), and 20 mL/cm H2O (severe); inspiratory resistance 12 cm H2O/L/s, expiratory resistance 14 cm H2O/L/s, and Pmus 0 cm H2O (apneic). The ASL was connected directly to the ventilator y-piece with a 22 mm adapter. Ventilator settings: Pressure High (Phigh) 17 and 22 cm H2O, Thigh 6 seconds, Pressure Low (Plow) 0 cm H2O, Tlow was adjusted to achieve a release point at 75% of Peak Expiratory Flow Rate (PEFR), Pressure Support 0 cm H2O, and Tube Compensation off. PEFR was measured directly from the ventilator flow waveforms. The ASL was ventilated for one minute to stabilize and one minute for data collection, first ventilating at Phigh 17 then 22 cm H2O. Data were recorded directly by the ASL and the parameters evaluated include: PEFR, peak inspiratory pressure (Ppeak), mean airway pressure (Pmean), total PEEP (PEEPtot), and expiratory tidal volume (exp VT).
Results:
Phigh 22 cm H2O resulted in an increase of all evaluated parameters. As Cst decreased, exp VT decreased. In severe ARDS, the Avea and the V500 exhibited the greatest exp VT . In severe ARDS the V500 and the Servo-I exhibited the greatest PEFR. Overall pressures (Ppeak and Pmean) were highest on the Avea. The Avea exhibited the highest level of PEEPtot while the V500 exhibited the lowest.
Conclusions:
This study demonstrated that all ventilators provided an increase in PEEPtot, exp VT, Pmean, PEFR, and Ppeak at Phigh of 22 cm H2O. The ventilators provided a different level of PEFR and PEEPtot at 75% PEFR. Further research is needed to compare APRV in patients to determine the amount of Auto-PEEP remaining in the lung at 75% PEFR in order to prevent derecruitment of the lung.
Meeting report
Restricted accessMeeting reportFirst published October, 2019pp. 3239227-3239227
Kathleen A Davis, Heather P Peterson, Alex R Sanders , [...]
View All
Abstract
Background:
The purpose of this study was to evaluate the occurrence of Auto-PEEP in VC A/C when ventilating normal, ARDS and COPD lung models on the Servo-i, Drager V500, PB 980 and Avea.
Methods:
This study was completed using an IngMar Medical ASL 5000 electronic lung simulator (ASL 5000) setup to simulate normal, ARDS and COPD conditions. Normal lung: Cst 54 mL/cm H2O, inspiratory resistance (Rin) 13 cm H2O/L/s, expiratory resistance (Rout) 12 cm H2O/L/s; ARDS: Cst 39 mL/cm H2O, Rin 12 cm H2O/L/s, Rout 14 cm H2O/L/s; COPD: Cst 59 mL/cm H2O, Rin 22 cm H2O/L/s, Rout 18 cm H2OL/s. VC A/C parameters were set using 70 kg PBW and a tidal volume of 6 mL/kg. Respiratory rates of 15, 20 and 25 breaths/min with a tidal volume of 420 mL were chosen to achieve a minute ventilation of 90 mL/min/kg, 120 mL/min/kg, and 150 mL/min/kg. PEEP was set at 5 cm H2O throughout the study. Peak flow and I-time were adjusted to maintain an I:E ratio of 1:3 for normal and ARDS conditions. An I:E ratio of 1:4 was used for COPD conditions. A decelerating flow waveform was used, when available. The same circuit was used for each ventilator. The y-piece of the ventilator circuit was attached to the ASL 5000 using a 7023 Hans Rudolph 22 mm adapter. With each change in minute ventilation, the conditions were stabilized for one minute before data collection. Data were collected on each ventilator for each minute ventilation and lung condition for two minutes.
Results:
As respiratory rate increased, an increase mean pressure, Auto-PEEP and total PEEP were observed in each ventilator.
Conclusions:
A reduction in expiratory time causes an increase in mean pressure, Auto-PEEP, and total PEEP in all conditions with all ventilators. The Servo-i showed the lowest amount of Auto-PEEP with the Avea yielding the highest amount of Auto-PEEP in all patient conditions. Due to the possible physiological consequences of Auto-PEEP in critically ill patients, further research is needed to evaluate the presence of Auto-PEEP in the clinical setting with mechanically ventilated patients.
Meeting report
Restricted accessMeeting reportFirst published October, 2019pp. 3239229-3239229
Gastric aspiration is of particular concern in critically ill patients, which is characterized as acute diffuse, inflammatory lung injury. This article aimed to develop and validate a multivariable gastric aspiration risk prediction rule in Neurosurgery ICU patients with artificial airways.
Methods:
We conducted a prospective cohort study collecting 270 patients with artificial airways in two Neurosurgery ICU of two university-affiliated hospital in Beijing from August 2016 to February 2018. Patients were excluded with admitted to ICU or extubated less than one day, without the consent of the surgeons, unwilling to participate in research or without informed consent and unable to take airway secretion specimens. Gastric aspiration be defined as the concentration of pepsin A in airway secretion specimens is not less than 25 ng/mL. Multivariable logistic regressions was used to explore the predictors of gastric aspiration. Ethical approval was obtained from the ethics committee of our university.
Results:
Overall, we included 148 patients to develop prediction rule and 122 patients to validate prediction rule. 50% of the patients appeared gastric aspiration in the development cohort and 44.3% in the validation cohort. A multivariable gastric aspiration risk prediction model based on logistic regression analysis showed that gastric residual volumes [GRVs]>40ml (OR 4.809; 95% CI 2.049-11.284), head-of-bed [HOB] elevation <30° (OR 3.134; 95% CI 1.148-8.553), repeated intubation (OR 3.344; 95% CI 1.394-8.021), Glasgow Coma Scale [GCS] score<9 (OR 5.054; 95% CI 2.005-13.223), cuff pressure<20cm H2O (OR 3.253; 95%CI 1.306-8.103) are independent risk factors. The area under the curve (AUC) is 0.832. Using bootstrapping for internal validation the AUC is 0.842. To facilitate the use of the model for clinical practice, the model was converted to a prediction rule with three risk categories: low-risk group (0-1 score), moderate-risk group (2-5 score), and high-risk group (6-7 score). After that, we evaluate the discrimination and calibration of prediction rule in new samples. The external validation showed that the AUC for discrimination was 0.710 and the calibration slope for calibration was 0.788.
Conclusions:
Gastric residual volumes, repeated intubation, head-of-bed elevation, GCS score, cuff pressure are independent predictive factors of gastric aspiration in Neurosurgery ICU patients with artificial airways.
Figure 1 The ROC of prediction rule in development cohort (A) and validation cohort (B)
Meeting report
Restricted accessMeeting reportFirst published October, 2019pp. 3239239-3239239
One in five COPD patients will require rehospitalization within 30 days. COPD is a common disease with significant morbidity and incurs heavy utilization of healthcare resources. In the United States, COPD is part of Medicare’s Hospital Readmissions Reduction Program, which penalizes hospitals for readmissions within 30-days. Does inpatient COPD education by respiratory therapists (RT) decrease readmission rates? We hypothesized that inpatient RT driven COPD education has a significant effect on COPD specific readmission rates.
Methods:
This study was approved by the Institutional Review Board at Wentworth Douglass Hospital. Data was collected from April 1, 2018 to April 1, 2019. Patients with an admitting diagnosis of COPD were offered education within 24 hours of admission. These COPD patients were assigned a number and a retrospective chart review was performed to determine readmission dates. All RTs were in-serviced and used the same method while performing the patient education. Patient comprehension was determined using the teach back method. Nominal data was analyzed in SPSS v24 with Crosstabs and the Chi-Square Fishers Exact test.
Results:
227 patients were enrolled in the study, 1 was excluded due to discharge prior to education. There was a small statistically insignificant improvement in the 30-day readmission rate in the educated group when compared to the group not receiving COPD education, (P = .696). There was no statistically significant association between education and no education for COPD 30-day readmissions as assessed by Fishers exact test, P = .696.
Conclusions:
Inpatient COPD education by respiratory therapists had no effect on the number of 30-day readmissions for the large cohort of 227 COPD patients. More research is needed to confirm this study finding. Sponsored Research: None. Conflict of Interest: None.
30-Day Readmissions
30-Day Readmissions
No
Yes
Total
Received Education n (%)
95 (88.0%)
13 (12.0%)
108 (100%)
Refused Education n (%)
101 (85.6%)
17 (14.4%)
118 (100%)
Total n (%)
196 (86.7%)
30 (13.3%)
226 (100%)
Meeting report
Restricted accessMeeting reportFirst published October, 2019pp. 3239251-3239251
Noninvasive ventilation (NIV) is a commonly used mode of ventilation to provide respiratory support after planned extubation of the neonate. Further investigation of the various interfaces and ventilators utilized to administer NIV is needed in order to optimize the support delivered to the infant. Some centers use the NeoTech RAM Cannula as the interface for delivery of NIV in conjunction with several different ventilators. This ex vivo experimental design evaluated the PIP, PEEP, and MAP delivered during NIV with the Vyasis Avea (Avea) ventilator in conjunction with three sizes of RAM Cannula using the IngMar Medical ASL 5000 electronic lung simulator (ASL 5000).
Methods:
The simulator was programmed to model a neonate (1-3kg body weight) with normal to moderately affected lungs. ASL 5000 settings: Cst 1.5 mL/cm H2O, Raw 70 cm H2O/L/s, Pmus Maximum, f zero (passive model). A 3D printed interface was created for each size RAM cannula (outer prong sizes: 3.5, 3.0 and 3.0 mm) with openings approximately 20% larger than the outer dimensions of the RAM prongs; the interface connected directly to the neonatal adapter on the ASL 5000. Simulated nares sizes were: Micro Preemie 3.6 cm, Preemie 3.6 cm, Neonate 4.2 cm. The EST was completed on the Avea, and the interface calibration was completed for each size RAM prior to testing. Each size cannula was then evaluated in Nasal CPAP/IMV mode at the following settings: 1) rate 20 breaths/min, 2) inspiratory time 0.25, 0.30 and 0.35 seconds, 3) PIP 10, 20 and 30 cm H2O, 4) rise of 9, 5) PEEP 5, 8 and 10 cm H2O, 6) FIO2 at 0.21. The ASL 5000 recorded data, including the delivered PIP, PEEP and MAP, for one minute at each combination of settings, and each size RAM Cannula.
Results:
The delivered PIP, as measured by the ASL 5000, approximated the set value on the ventilator only when the set PIP was 10 cm H2O. The data show that the PEEP recorded from the ASL 5000 was consistently lower than the PEEP level set on the Avea. With an increase in inspiratory time, there was a slight increase in both delivered PIP and PEEP. The delivered PIP and PEEP decreased as the RAM Cannula was sized down.
Conclusions:
When properly sized to the nasal diameter, the NeoTech RAM Cannula interface results in the delivery of lower pressures than set on the Avea. Based on the results of this bench study, pressure attenuation to lower than set pressure is likely when utilizing the RAM Cannula for NIV with the Avea.
Meeting report
Restricted accessMeeting reportFirst published October, 2019pp. 3239266-3239266
Occupational exposure to paint chemicals and welding fumes have received little attention despite the broad use of these paint chemicals and welding fumes. Objective: The study aimed at identifying the risk of painters and welders to develop some respiratory symptoms as a result of long-term exposures to the chemicals and gas fumes present in these occupations respectively.
Methods:
The study group comprised of 396 participants that included 150 painters, 150 welders and 96 non-exposed groups. A questionnaire adopted from St. George’s respiratory questionnaire was used to assess the respiratory symptoms and pulmonary function test (kg/m2, FVC and PEFR) was done using a spirometer. The data was analyzed using the statistical package for social sciences (SPSS) [version 23.0 Chicago, 11, USA]. Inferential statistics of one-way ANOVA was used to test hypothesis. Alpha level was set at P < .05.
Results:
The results showed that there was a significant difference in the respiratory symptoms of painters and welders, F (4.70, 700.89) = 55.86, P < 0.05. There was also a significant difference in the pulmonary functions of painters and welders, F (1.06, 158.18) = 4.66, P < 0.05.
Conclusions:
The study concluded that both painters and welders are at risk of developing respiratory challenges as a result of long term exposures to both paint chemicals and welding fumes respectively. Key Words: Pulmonary function, Respiratory Symptoms, Painters, Welders. Clinical Implications and Recommendations: Routine monitoring of the pulmonary state of both painters and welders should be included in the health management policy and implementation of safety practices by both employers and employees as regards the use of personal protective equipment (PPE) in order to reduce the risk of developing respiratory and other health challenges. Disclosures: Self-Funded Ethical Approval: Health Research Ethical Committee, University of Nigeria Teaching Hospital.
Meeting report
Restricted accessMeeting reportFirst published October, 2019pp. 3239271-3239271
Diabetes results to multi-organ damage most especially highly vascularized organs. It has been shown in various studies that type II diabetic patients have significantly lower pulmonary functions. This study was conducted to find the relationship between the various correlates (age, BMI, WHR, % body fat, duration of diabetes mellitus, fasting blood glucose level, waist-circumference and hip circumference) and pulmonary function in type II diabetic patients.
Methods:
The study was conducted in the out-patient diabetic clinic in Enugu State University of Technology Teaching Hospital (ESUTH). A total of 122 type II diabetic patients comprises 90 females (73.8%) and 32 males (26.2%) were recruited after meeting the inclusion and exclusion criteria. Pulmonary function test was performed using Comrec60 spirometer in accordance with the “National Health and Nutrition Examination Survey (NHANES)” Spirometry procedure (2008) while the bioelectrical impedance device was used to estimate body fat. Statistical test tools employed in this study included: descriptive statistics, Pearson correlation and multiple regression analysis.
Results:
The mean age of the participants was 60.09 ± 10.13. Correlation was statistically significant between age, BMI, WC, HC, WHR and pulmonary function. Predictor of Forced Vital Capacity (FVC) was age, forced expiratory volume in one second (kg/m2) and Peak Expiratory Flow (PEF) were predicted by age and BMI, and kg/m2 /FVC was predicted by waist-circumference.
Conclusions:
Diabetes mellitus is a metabolic disorder that affects the lungs causing restrictive ventilation. Age is a predictor for kg/m2, FVC, PEF but kg/m2/FVC. The reduction in pulmonary function is evident as age increases in type II diabetic patients. Routine monitoring of the pulmonary function of type II diabetic patients should be included in the health management policy and the consistently lowered spirometric values shows restrictive ventilation. Hence, regular breathing exercises should be strongly encouraged for Type II diabetic patients. Disclosures: Self-Funded Ethical Approval: Health Research Ethical Committee, University of Nigeria Teaching Hospital.
Meeting report
Restricted accessMeeting reportFirst published October, 2019pp. 3239311-3239311
Vibrating mesh systems are more efficient than pneumatic jet nebulizers. Vibrating mesh nebulizers (VMNs) are designed for repeated use by a single patient for up to 28 days. We assessed the reliability of a VMN in terms of delivered drug dose and particle size distribution.
Methods:
The Aerogen Solo VMN (Aerogen, Galway, Ireland) was selected for testing. The VMN was connected to a valve mask and a reservoir (Aerogen Ultra) placed on an adult mannequin. The VMN was filled with a unit dose of salbutamol (5.0 mg/2.5 mL, GlaxoSmithKline Inc., Victoria, Australia) and nebulized until no aerosol was visible. The VMN was repeatedly tested every 6 h, 84 times in total, with an assumed prescription of t.i.d. for 28 days, without cleaning between tests. The delivered drug dose distal to the bronchi was collected in a collecting filter, and the particle size distribution was measured using an Anderson Cascade Impactor (ThermoFisher Scientific, Waltham, MA, USA). The collected drug was analyzed using ultraviolet spectrophotometry and the mass median aerodynamic diameter (MMAD) was calculated. Ten other nebulizers were repeatedly tested according to the protocol.
Results:
The average inhaled drug dose percent, residual dose percent, MMAD, and nebulization time were deviated to five sections and the results are illustrated in the table below (expressed as the mean ± standard deviation). No significant differences were found among the parameters and measurement time points.
Conclusions:
The performance of the VMN in terms of inhaled drug dose, residual dose, particle size, and nebulization time was similar across the 28 days of use.
Comparisons among measurement time points
Meeting report
Restricted accessMeeting reportFirst published October, 2019pp. 3239340-3239340
Maintaining a busy assignment can make it difficult for RTs to attend patient rounds and provide feedback, administer and evaluate treatment response, and still be able to maintain a safe clinical environment for patients. Historically, RTs perform ventilator and noninvasive device checks every 2-4 hours in most children’s hospitals. Reducing the amount of time RTs spend charting device checks may allow more focused bedside care. The specific aim of this project was to determine whether improvements in workflow could allow RTs more time to attend rounds and to provide other value-added work without sacrificing patient safety.
Methods:
A committee of RTs reviewed the published literature, current RT workflow, and developed a survey to assess reasons why they were unable to attend rounds, and preferred device check/patient assessment frequency. Based on survey data, a policy was developed to determine frequency for device checks and patient assessments based on RT preference. We tracked NICU safety events (e.g. unplanned extubations, nasal pressure injuries, etc) as well as RTs’ ability to attend NICU rounds prior to and following RT workflow changes.
Results:
The majority of RTs preferred twice per shift (46%), followed by Q4 (33%), and Q shift (31%) device checks. Device checks were changed from Q4 to twice per shift with patient assessments in between. The total number of NICU RT treatments increased by 148% after implementing these workflow changes (P < .001, Table 1). However, RTs’ ability to attend daily patient rounds increased from 65.5% (6 months) to 81% (30 days) between the pre to post workflow periods, respectively. There were no observed differences in unplanned extubations, or pressure injury rates related to the increased workload (Txs and HFV, Table 1) or changes in workflow.
Conclusions:
Currently, there is no national guideline that suggests optimal frequency for device checks in NICUs. The AARC suggests that patient-ventilator assessment intervals be institution-specific. We demonstrated a short-term increase in the NICU RTs’ ability to attend patient rounds by following a process that allowed RTs to establish their own workflow. We did not anticipate the large combined increases in workload based on NICU treatments or ventilator/NIV days. We believe that workflow changes allowed RTs the ability to spend less time charting and more time contributing to value-added care without increasing risk for complications.
Meeting report
Restricted accessMeeting reportFirst published October, 2019pp. 3239354-3239354
Volume guarantee modes (VG) are used with increasing frequency for the neonatal population in an attempt to minimize lung injury and hypocarbia due to unintentional hyperventilation. Ventilator manufacturers utilize different proximal flow sensor technology and software to achieve VG, and investigation of the behavior of each ventilator is useful. This ex vivo experimental design evaluated the Vti, Vte, and PIP delivered during VG modes with the Vyasis Avea (Avea) and Drager VN500 Babylog (VN500) using the IngMar Medical ASL 5000 electronic lung simulator (ASL 5000).
Methods:
The ASL 5000 was programmed to model a 1-3 kg body weight neonate with normal to moderately affected lungs. ASL 5000 settings: Cst 1.5 mL/cm H2O, Raw 70 cm H2O/L/s, Pmus 0 cm H2O (passive), f zero. The EST on the Avea, and circuit check on the VN500, were completed prior to testing; the proximal flow sensors were zeroed on each ventilator. Trials were conducted at ambient temperature and humidity. Constant settings on the Avea: 30 breaths/min, PEEP 6 cm H2O, flow trigger 0.5 L/min, FIO2 0.21, Rise 5. Constant settings on the VN500: 30 breaths/min, PEEP 6 cm H2O, FIO2 0.21, slope 0.20 seconds, Pmax 50 cm H2O. Variable settings on each ventilator were: inspiratory time 0.25, 0.30 and 0.35 seconds and tidal volume to simulate an 800 g, 1 kg, 2 kg and 3 kg infant at 5 mL/kg (4, 5, 10 and 15 mL). Each ventilator was tested with each variable setting for a total of two minutes using the ASL 5000. After a stabilization period of 15 breaths, delivered Vti, Vte, and PIP were recorded continuously by the ASL 5000. The results for each parameter were then averaged over a 1-min period, and the standard deviation was calculated for each measurement.
Results:
The Avea and VN500 delivered similar volumes and pressures as recorded by the ASL 5000 with less than ± 0.02 standard deviation for each parameter. The Avea demonstrated wider standard deviation due to periodic spikes in Vti and PIP. The VN500 consistently delivered lower tidal volumes as measured by the ASL 5000 compared to the Avea, usually at lower measured PIP. This delta varied with each breath.
Conclusions:
The VN500 and Avea deliver consistent Vti, Vte, and PIP in a passive model. Measured values higher than set VG on both ventilators, and lower Vti and Vte on the VN500, may be due to variances in how each ventilator deals with the compressible volume of the breathing circuit and temperature and saturation of the inspired gas.
Meeting report
Restricted accessMeeting reportFirst published October, 2019pp. 3239373-3239373
Electronic cigarettes (e-cigarettes), which deliver nicotine by vaporizing nicotine-containing fluid, is readable available in a variety of products (pipes, tanks, disposable, rechargeable) which resembles pens, USB sticks, and other recognizable commonplace items. Few studies have examined the prevalence of e-cigarettes use among smokers, former smokers, and those who have never smoked who have depression or anxiety. The main goal of the current study is to examine the relationship between smoking status, depression, and anxiety to e-cigarette use among adults.
Methods:
A cross-sectional analysis of the Health Information National Trend Survey (HINTS), Cycle 2, 2018, served as the dataset. HINTS consisted of 3,504 respondents, age 18 years of age and older and lived in the United States during the period of January 26, 2018, to May 2, 2018. SPSSv24 was used for descriptive tests and PROCESS MACRO (Hayes 2018) performed a regression analysis.
Results:
Logistic regression showed that the model (smoking status, depression/anxiety) predicts e-cigarette use better than chance; F(6, 2980) = 120.1, P < .001, R2 = .195. Smoking status was associated with increased odds of e-cigarette use (OR 1.44; 95% CI 1.34 – 1.55). Current smokers with depression or anxiety, use e-cigarettes more than former smokers with depression or anxiety. Depression/anxiety were also associated with increased odds of e-cigarette use (OR 1.31; 95% CI 1.18 – 1.44). The interaction between smoking status and depression or anxiety was significant (b = -.081, t(2980) = -3.85, P = 0.0001).
Conclusions:
This study showed that smoking status can predict the use of e-cigarettes in those who have depression or anxiety. This study will help in designing theory-based interventions
Meeting report
Restricted accessMeeting reportFirst published October, 2019pp. 3239375-3239375
Elizabeth Rohrs, Marlena Ornowska, Thiago Bassi , [...]
View All
Abstract
Background:
Ventilator-induced lung injury is precipitated by the non-physiological distribution of tidal volume in the lungs, increasing the pressure exerted on alveoli that receive greater volume, and causing the eventual collapse of alveoli that do not receive enough tidal volume. Electrophrenic transvenous neurostimulation respiration (ETNR) stimulates a diaphragm contraction, in synchrony with the ventilator, and may address this problem by re-distributing tidal volume in a more physiological pattern and keeping the lungs open. More alveoli are thus available to receive tidal volume, improving dynamic compliance and reducing ventilation pressures.
Methods:
A pilot study was conducted using a large animal model (50 kg pigs) mechanically ventilated in a mock intensive care unit. Subjects were deeply sedated and subjected to lung-protective ventilation at 8 mL/kg in volume control. ENTR, selectively adjusted to reduce ventilator pressure-time-product by 15-20%, was delivered every second breath, in synchrony with the inspiratory phase of ventilator-triggered breaths. Peak inspiratory pressure (PIP) and dynamic compliance (Cdyn) were recorded at the start of study and values for MV breaths (no diaphragm contraction) were compared to MVP breaths (ETNR diaphragm contraction) within 5 minutes of each other. Means were compared by paired t-test with a significance level of alpha of 0.5 and beta of 0.80. Institutional Review Board permission was granted for this study.
Results:
PIP significantly dropped 21%, from 31.6 cm H2O in MV breaths to 24.8 cm H2O in MVP breaths with the addition of ETNR diaphragm contraction during inspiration (P = .021). Cdyn significantly improved 59%, from 32.8 mL/cm H2O in MV breaths to 52.2 mL/cm H2O in MVP breaths with the addition of ETNR diaphragm contraction (P = .007).
Conclusions:
ETNR diaphragm contraction used as an adjunct to mechanical ventilation significantly decreased PIP and improved Cdyn at the selected intensity. This is an important finding, as a reduction in inspiratory pressure translates into less ventilator-induced lung injury and better outcomes in the ICU. This technology has the potential to provide a novel method of lung-protective ventilation in sedated, ventilated patients. Disclosures: Study sponsorship, technical support and equipment provided by Lungpacer Medical. PhD student salary funding provided by a grant from Lungpacer Medical and Mitacs. Dr. Reynolds is a paid consultant with Lungpacer Medical.
Meeting report
Restricted accessMeeting reportFirst published October, 2019pp. 3239378-3239378
Intrapulmonary percussive ventilation (IPV) is an airway clearance modality designed to assist in mucus removal and lung recruitment. Frequency, CPAP and flow are adjusted to target small and large airways. The IPV 2C incorporates demand CPAP flow controls, and a variable I:E ratio. The purpose of this study is to evaluate the effects of Demand CPAP, flow and frequency changes on FIO2.
Methods:
An IPV 2C and Phasitron 5, (Percussionaire, Sandpoint, ID) were connected to a calibrated Maxtec O2ME oxygen monitor (Maxtec, Salt Lake City, UT) and an Airlife 1L Baby Safe flow-inflating resuscitation bag (Vyaire, Mettawa, IL). Using a constant inspiratory time, FIO2 was measured after stabilization at frequency <350 and > 350, and D-CPAP and flow at 3 setting changes. Mean airway pressures (MAP) and frequency was derived from the multimeter on the IPV 2C. Descriptive statistics, Mean and Standard Deviations for frequency, flow and D-CPAP were calculated and a paired t-test was performed with a statistical significance level set at P < .05 for each test.
Results:
There was no statistically significant difference in measured FIO2 with changes in frequency (P = .74), nor with demand CPAP (P = .61) independently but a significant difference in FIO2 as flow (P = .006) was added and MAP (P = .02).
Conclusions:
Despite differences in delivered FIO2 during IPV, within the acceptable margin of error for an oxygen monitor, IPV delivers a stable and consistent FIO2 for patients requiring <80% regardless of setting changes.
Parameter
Ranges/Mean and (StDev) None
Ranges/Mean and (StDev) Lo
Ranges/Mean and (StDev) High
Flow
79.17 (2.28)
74.36 (2.28)
74.70 (6.18)
D-CPAP
75.20 (3.77)
76.81 (4.39)
76.92 (4.07)
Frequency (cpm)
250-35076.85 (4.38)
>35076.01 (3.74)
Resultant MAP
4 to 7 cmH2O78.01 (2.56)
8 to 18 cmH2074.48 (4.42)
Meeting report
Restricted accessMeeting reportFirst published October, 2019pp. 3239393-3239393
Patients undergoing hyperbaric oxygen therapy (HBOT) breathe 100% oxygen at a higher atmospheric pressure level (ATA) resulting in having O2 molecules to dissolve into the plasma almost 15 times higher than normal. Thus patients should experience some degree of biochemical toxicity resulting in airway inflammation (AI) and having nitric oxide (NO) levels to be regarded as an indirect marker for up-regulation of AI. Previous studies assessed Fraction of Exhaled Nitric Oxide Levels (FENO) pre and post HBOT in either animal or healthy human studies. The purpose of this study is to assess the changes and trend values in FENO values among unhealthy patients undergoing HBOT in the clinical setting noninvasively.
Methods:
This study is approved by Loma Linda University Health Institutional Review Board. Inclusion criteria were any patients referred to HBOT for any indication, conscious and able to perform FENO test, and 18 years or older. Critically ill patients were excluded. Subjects who are referred to receive HBOT were recruited to the study. FENO levels were measured pre and post HBOT at baseline and every 5 treatment sessions (i.e. 1, 5, 10). HBOT total ordered sessions varied based on the indication. FENO was measured using NIOX VERO device by Circassia.
Results:
A total of 7 subjects were recruited into the study, 2 were excluded due to the inability to perform the FENO test. Mean age was 54.2 ± 18.8, 3, (60%) female. The mean ATA level was 2.3 ± 0.27 with 90 minutes of total treatment time. HBOT indications were soft tissue radiation necrosis (n = 2), hearing loss (n = 1), necrotizing soft tissue (n = 1), and osteomyelitis (n = 1). A total of 43 data points were collected. The mean and standard deviation (SD) of all FENO levels at baseline was (Pre = 23.6 ± 8.9; Post = 21.3 ± 14.5), table1. Significance were found in two subjects at treatment 15, and 25 (P < .001), between baseline to treatment 15 (n = 3; P = .058), between baseline to treatment 25 (n = 2; P < .001). Overall, no significant changes were seen in FENO levels pre and post HBOT sessions (P > .05) in all subjects from baseline to their last session.
Conclusions:
The results in this ongoing study shows that HBOT causes no significant changes in FENO level trends in real-world patients. Significant changes were only seen in some patients midway between baseline and treatment 15 and 25. More research having a higher sample size and data points should help us understand the trends in FENO levels more clearly.
Fraction of Exhaled Nitric Oxide Measurements Pre and Post Hyperbaric Sessions
HBOT Treatment Sessions
Treatment 1
Treatment 5
Treatment 10
Treatment 15
Treatment 20
Treatment 25
Treatment 30
Treatment 35
Pre
23.6±8.8
24.5±11.7
26±0
23.5±19
25±5
26.5±10
22.5±5
29*
Post
21±14
26±17
15.6±6
23±16.6
17±4
26.5±9
27
22*
*Only one subject was due for their 35th treatment.
Meeting report
Restricted accessMeeting reportFirst published October, 2019pp. 3239395-3239395
Ryan M Sharkey, Daniel D Rowley, Thomas P Malinowski
Abstract
Background:
Lung expansion therapy (LET) in post-operative upper abdominal surgery patients is not well described beyond global indicators for patient improvement. Electrical impedance tomography (EIT) reveals changes in lung volume and is an objective measurement tool for lung expansion in patients undergoing LET. The primary purpose of this study is to describe the distribution of ventilation during incentive spirometry (I.S.) and EzPAP comparing breath cycles during LET and post LET period.
Methods:
This is a secondary analysis of an IRB approved randomized control trial on dorsal redistribution of ventilation comparing IS to EzPAP LET after upper abdominal surgery. Subjects were allocated to receive LET with IS (n = 56) targeting predicted inspiratory capacity or EzPAP (n = 56) targeting 15 cm H2O TID on postoperative days (POD) 1-5. An EIT device (Pulmovista 500; Dräger) was connected to subjects for a single LET session on POD 1, 3, and 5 to measure changes in during breath cycles of LET end-expiratory lung impedance (ΔEELI%) and post LET ΔEELI%. LET sessions with EIT included 2-min normal breathing, 3 breath cycles x 10 breaths, and 2-min normal breathing after breath cycle 3. The EIT device was removed after monitoring sessions. LET cycle ΔEELI% was compared individually to the post LET ΔEELI% measurement with a paired samples T-test. Data are reported as mean (SD). Effect size is described by eta squared (η2). Alpha (2-tail) is .05. A Bonferroni Correction was applied due to the multiple comparisons in each group (P < .008) Results: Dorsal LET cycle 1 of I.S. on POD 3 had a significant ΔEELI increase of 9.5% (P >.01; see Figure) to post LET. In the EzPAP group, on POD 1 dorsal post LET had a significant decrease from LET cycles 1 and 3 (P < .01; P < .01). Ventral distribution of ventilation during EzPAP significantly decreased post LET from all cycles on all PODs (P < .01) except LET2 on POD 3 (P = .01). Eta-squared showed a large effect size (η2 > 0.14) between all comparisons in the EzPAP group, excluding dorsal LET2 on POD1 (η2 = 0.12), and Dorsal LET1, LET2, and LET3 (η2 < 0.01; η2 = 0.02; η2 = 0.05) on POD 3.
Conclusions:
Increases in distribution of ventilation seen during EzPAP in dorsal and ventral regions were not sustained and decreased immediately following termination of therapy. Dorsal distribution of ventilation during I.S. increased with successive LET cycles and was maintained post LET, but the increases seen in the ventral regions were not maintained.
Meeting report
Restricted accessMeeting reportFirst published October, 2019pp. 3239404-3239404
A tertiary hospital in central Taiwan began to implement VAP Bundle Care in 2011, initially with 1. maintaining head of bed at 30-45 degrees, 2. daily extubation assessment, 3. whether using antacids, 4. daily oral care using 0.12%-0.2% chlorhexidine, 5. Cuff pressure 20-25 cm H2O five items for implementation, from July 2015, the Infection Control Society of Taiwan requested to change to 1. Ventilator liberation evaluation, 2. daily interruption of sedatives, 3. daily oral care using 0.12%-0.2% chlorhexidine 4 maintaining head of bed at 30-45 degrees 5. draining of ventilator circuit, so this study discusses the impact of such changes on clinical infection control.
Methods:
This study retrospectively collected the number of cases of pneumonia infected and the infection rate (thousands of people) in seven intensive care units collected by the hospital's infection control team from 2013 to 2017, and divided the collected data into 30 months each. Comparing the two groups, the experimental group was from July 2015 to December 2017, and the control group was from January 2013 to June 2015, with narrative statistics, F-test and t-test for statistical analysis.
Results:
According to the results of the study, daily extubation assessment, whether using antacids and Cuff pressure 20-25 cm H2O were changed to the ventilator liberation evaluation, daily interruption of sedatives and draining of ventilator circuit will be stopped. The number of patients infected with pneumonia and the infection rate (thousands of days) were not significant in the surgical intensive care unit (SCU1 and NSCU) and the intensive care unit (RICU and CCU) (P >0.05), in the surgical intensive care unit (SCU2 and SNCU) and Internal Medicine Intensive Care Unit (MICU) were significantly (P < .05) (see table).
Conclusions:
Changing the implementation items of VAP Bundle Care, the number of cases of pneumonia infected by patients using ventilators and the infection rate were not significant in the four intensive care units, indicating that such changes would not affect the clinical infection, but there were 3 intensive care units in the implementation of the project after the change, the ward infection rate also decreased, and its possible influencing factors deserve further management discussion.
Meeting report
Restricted accessMeeting reportFirst published October, 2019pp. 3239423-3239423
Phill Jensen, Steve Mannebach, Ryan Aramaki , [...]
View All
Abstract
Background:
Pneumatic tube transport of blood gas samples is a common method of delivery to a blood gas laboratory. Prior studies have shown acceptable performance for pH and PCO2, but results for PO2 vary based on the study, with the consensus being latent air bubbles or non-pressure sealed pneumatic tube carriers as the culprit. What is typically unaccounted for in these studies are the other analytes often measured by blood gas laboratories (e.g. electrolytes, metabolites and oximetry) even though studies exist highlighting a potential for hemolysis in samples sent via tube to core laboratories. Many other studies also only include a single pathway through the pneumatic tube system, for example, from the emergency department or OR to the blood gas lab. This study evaluates blood gas values and the concomitant analytes generally reported through the full scope of a 500 + bed academic medical center across multiple pneumatic tube stations. The aim of the study was to determine the effect of pneumatic tube transport (SwissLog) on all reported values from our blood gas analyzers (Radiometer 835).
Methods:
The study was conducted by the blood gas laboratory at the University of Utah Hospital. Blood samples were received through normal care processes. A split sample comparison was performed on left over blood after patient results were reported. IRB approval is not required for this QA project. In eight cases the remaining sample size was large enough to split immediately. In forty-six cases the samples were pooled, tonometered for 20 minutes, then split. Once a sample was split into two separate syringes both were walked to a pneumatic tube station where one sample was tubed and the other was re-walked back to blood gas lab. After both samples had returned to the blood gas lab they were analyzed serially on the same blood gas analyzer. Two samples were sent from each of 27 different pneumatic tube stations throughout the hospital. Results were graphed on a difference plot with upper and lower control limits set to conform to acceptable CLIA tolerances.
Results:
Average bias for each analyte is neither clinically or statistically significant. Two data points for tHb fell outside defined tolerance. Each outlier is surrounded by similar data points that were in-range and the difference isn’t clinically significant.
Conclusions:
Pneumatic tube transport of blood gas specimens is acceptable for blood gas parameters and supplementary analytes.
Average Bias (Walked - Tubed)
pH
PO2
PCO2
tHb
O2Hb
COHb
MetHb
K+
Na+
iCa
Glu
Lac
tBili
Average Bias
0.000
0.100
-0.531
0.043
-0.178
-0.004
-0.011
0.033
-0.185
-0.002
0.352
0.109
0.022
Meeting report
Restricted accessMeeting reportFirst published October, 2019pp. 3239427-3239427
Earl Fulcher, Michael Sanders, Cinthea Beebe , [...]
View All
Abstract
Background:
At our institution, we have received multiple reports of failure of a vibrating mesh nebulizer during inhaled epoprostenol delivery. There have also been recent published and anecdotal reports of nebulization stoppages using this nebulizer (Aerogen Solo, Aerogen, Galway Ireland). We conducted this experiment to determine if we could repeat the intermittent failures previously reported.
Methods:
In the first phase of the study, 10 different nebulizers of the same lot were run 3 times each alternating with 2 new, previously unused electronic controllers. A total of 30 runs were completed while varying the order in which the nebulizers were tested. Each nebulizer was filled with 3 mL of normal saline and run for a total of 10 minutes. The time was recorded when the nebulizer was visualized to stop producing an aerosol. At the end of the 10-minute run time, residual volume was measured using a slip tip syringe. Failure was defined as a residual volume greater than 10% of the filling volume or 0.3 mL. The manufacturer reports the residual volume should be <0.1 mL for a 3 mL dose. The second phase of the study used the same controllers and nebulizers to mimic continuous nebulization. A syringe pump was used to infuse normal saline into the nebulizer at two rates: 4.2 and 7.0 mL/h. Each nebulizer had a total of 4 runs receiving both infusion rates with a different controller. The syringe pump was turned off at 1 hour and residual volume was again measured.
Results:
In the first phase of the study there were 7/30 runs which had a residual volume greater than 0.3ml or a failure rate of 23.3%. During the second phase of the study, one of the 40 continuous runs failed with a total residual volume of 5.75 mL. As expected intermittent nebulization was noted throughout phase 2 due to the nebulizer output of 0.3 mL/min exceeding the syringe pump flow of 0.07 and 0.12 mL/min respectively. There appeared to be no correlation between the controller used and the nebulizer failures.
Conclusions:
In phase one of this trial the Aerogen Solo nebulizer failed at a rate of 23.3% using a failure threshold 3 times greater than the manufacturer’s specifications. Further study is needed to determine the impact of this finding on therapeutic outcomes during medication nebulization. Disclosures: None
Meeting report
Restricted accessMeeting reportFirst published October, 2019pp. 3239433-3239433
Chris Blakeman, Dario Rodriquez,Jr., Richard Branson
Abstract
Background:
Military transport of critically ill/injured patients requires judicious use of resources. Maintaining oxygen (O2) supplies for mechanically ventilated is crucial. O2 cylinders are difficult to transport and add the risk of fire in an aircraft. The proposed solution is the use of a portable oxygen concentrator (POC) to supply O2 for mechanical ventilation. As long as power is available, a POC can provide a continuous supply of O2. Evidence suggests that 3 L/min of O2 could manage 2/3 of the mechanically ventilated aeromedical transport patients.
Methods:
We evaluated two each of the AutoMedx SAVe II, Hamilton T1, Zoll 731,and one Ventec VOCSN portable ventilator over a range of settings paired with two Caire SAROS POCs. The VOCSN operates from an internal O2 concentrator using pulsed dose delivery equivalent to 6 L/min continuous flow O2. Each ventilator was attached to one chamber of a Michigan Instruments Training Test Lung (TTL). Output from the POC was bled-in to each ventilator via the mechanism provided. A Fleisch pneumotach was placed between the ventilator circuit and the TTL to measure delivered tidal volume (VT) and a fast response O2 analyzer (Oxigraf) sampled gas from the TTL to measure FIO2. Deadspace was added between the ventilator circuit and TTL for pulsed dose delivery. Ventilator parameters and FIO2 were continuously measured and recorded for later analysis. One-way ANOVA was used to determine statistically significant differences (P < .05) in FIO2 at each ventilator/POC setting.
Results:
Delivered FIO2 varied widely between ventilator models and between devices of the Hamilton T1 ventilators. Differences in FIO2 at each ventilator/POC setting was statistically significant (P < .05) but not all were clinically important. The SAVe II delivered the highest FIO2 at all conditions using a VT of 700 mL owing to limited VE capabilities. The highest delivered FIO2 was 84.6% ± 0.5 at the 250 mL VT settings using 2 POCs (P < .001). The Zoll 731 delivered the highest FIO2 at each ventilator setting using both POCs. Calculated FIO2 displayed on the VOCSN in pulsed dose mode was within ± 2% absolute of measured FIO2.
Conclusions:
Oxygen delivery utilizing POCs is dependent upon multiple factors including ventilator operating characteristics, ventilator settings, and the use of pulsed dose or continuous flow O2. Careful patient selection would be paramount to provide safe mechanical ventilation using this method of O2 delivery.
Ventilator Settings
731
SAVe II
T1
VOCSN
*VOCSN Int
RR30/VT250/PEEP5/CL80/1POC
51.0 ± 0.7
49.7 ± 0.6
43.0 ± 2.3
35.5 ± 0.1
34.0 ± 0.4
RR30/VT250/PEEP5/CL80/2POC
84.7 ± 0.5
72.7 ± 0.2
65.8 ± 7.2
51.2 ± 0.3
45.3 ± 0.5
RR30/VT250/PEEP20/CL20/1POC
50.7 ± 0.5
45.5 ± 0.3
43.1 ± 3.7
35.9 ± 0.1
32.0 ± 0.1
RR30/VT250/PEEP20/CL20/2POC
84.4 ± 0.5
72.7 ± 0.3
64.2 ± 10.3
52.3 ± 0.1
43.2 ± 0.1
Measured FIO2 for the 250 mL VT settings at all conditions. *VOCSN internal oxygen concentrator with pulse dose settings equivalent to 1 and 2 SAROs POCs.
Meeting report
Restricted accessMeeting reportFirst published October, 2019pp. 3239438-3239438
The Procedural Oxygen Mask (POM) is a multiport mask that is designed to allow scopes, probes, and tubes through the mask and into the mouth or nose while claiming to deliver high levels of oxygen. The goal of this study was to determine the actual O2 delivery at the carina while wearing the POM mask at different flows, breathing patterns, and integrity of the masks oral access membrane. Our hypothesis is that there will be no difference in O2 delivery at the carina from the POM based on breathing pattern, flow, or status of the POM masks oral membrane.
Methods:
A bench model was created by adapting an adult intubation manikin (Armstrong Medical Industries, Lincolnshire, IL) to an Ingmar Medical ASL 5000 (Pittsburgh, PA) breathing simulator. Tygon tubing and appropriate adapters connected the manikin’s trachea with the breathing simulator’s outlet so that as the simulator operates, air flows in and out through the manikin’s mouth and nares. A TED 60T O2 analyzer was connected to the simulated carina of a mannequin. The POM was secured to the face of the mannequin with manufacturer provided equipment and connected to an O2 flow meter. The lung simulator was set at respiratory rates of 6, 12 and 25 breaths/min, and tidal volumes were set at 300 mL, 600 mL, and 925 mL, respectively. The flow meter was set to a flow of 10, 12, or 15 L/min with the manufacturer provided high flow adapter. The FIO2 was measured by the analyzer for each breathing pattern. First with the membrane of the mask completely intact, then with a bronchoscope inserted with the aid of 0.045 oz PDI lubricating jelly, and lastly post mock bronchoscopy with membrane no longer intact. The O2 analyzer was calibrated between each reading.
Results:
Statistical difference was found in the mean delivered FIO2 between breathing patterns, flow meter settings, and if the masks membrane was intact. However, after the membrane is perforated the patients breathing pattern and O2 flow are the primary factors that impact FIO2 delivery. Average range of delivered FIO2 across all runs was 38-84%.
Conclusions:
Delivered FIO2 varied from 38-84% using the POM mask. The FIO2 delivered by the POM mask is impacted by breathing pattern, flow of oxygen and intactness of membrane. During clinical use providers should be aware of this range and how these factors will impact the delivered FIO2.
Meeting report
Restricted accessMeeting reportFirst published October, 2019pp. 3239444-3239444
Christina Marie Romo, Patrik Malone, Tim Fang , [...]
View All
Abstract
Background:
HFJV is used in tandem with a conventional ventilator and PEEP is adjusted to titrate mean airway pressure. Ventilator sigh breaths superimposed on HFJV to recruit alveoli and improve gas exchange. Studies in-vivo have shown a 2-3 fold increase lung injury/inflammation with sighs than without sighs (Musk, 2012, 2011). Clinicians may set PIPvent>PIPjet in order to provide chest rise with sigh breaths. We hypothesized that there would be no differences in pressure and volume delivery to a test lung between sigh/no sigh conditions during simulated HFJV.
Methods:
The Ingmar ASL 5000 was configured with restrictive and obstructive neonatal lung disorders. The Bunnell Life Pulse HFJV was connected to conventional ventilator with common HFJV settings for RDS:HFJV PIP:25, RR:420, PEEP: 8 (Sigh Rate:6, TI :0.3s, Sigh PIP:27) and MAS: HFJV PIP:35, RR:300, PEEP: 14 (Sigh Rate: 6 Sigh, TI :0.4s PIP:37). VT and pressures (PIP, PEEP, MAP) were measured (n = 5) during simulated HFJV with/without sigh breaths.
Results:
When RDS and MAS lung models were supported with HFJV, volumes and pressures were greater with sigh breaths than without sigh breaths during HFJV (P < .05; see Figure).
Conclusions:
The major finding from this study was that application of sigh breaths during HFJV resulted in excessive VT (∼15 mL/kg) and intrinsic PEEP levels (∼11 cm H2O). These data corroborate findings from previous studies that show increased pulmonary injury/inflammation when applying sighs during HFJV. Based on these findings, we do not support using sigh breaths at any time during the course of HFJV. Instead, clinicians should adjust the ventilator PEEP during HFJV for optimization of end-expiratory lung volumes and gas exchange.
Meeting report
Restricted accessMeeting reportFirst published October, 2019pp. 3239448-3239448
Amber Lee Hall, Ron Cragun, Leslie Williams , [...]
View All
Abstract
Background:
Hospitalized patients may present with risk factors for sleep disordered breathing (SDB) which has not been previously diagnosed or treated. Untreated SDB has been associated with increased readmission rates, poor outcomes in post ischemic stroke, and an increased risk for atrial fibrillation. In October 2015 the Respiratory Therapy and Sleep Wake Center departments collaborated with a sleep medicine physician to establish an inpatient sleep medicine program. The goal of the program was to diagnose and treat SDB during hospitalization thereby reducing the delay to treatment. Unattended sleep testing was utilized with a goal to maintain an error rate of approximately 7% which is the same rate present in our unattended home studies.
Methods:
Portable home sleep test (HST) devices were utilized to diagnose patients for SDB. Initially all night shift respiratory therapists were trained by sleep technologists to set up and place the HST equipment. After set up the therapists were instructed to check on the patient once during the night, then remove the device in the morning and deliver the device to the department. The sleep technologist would retrieve the equipment and score the study. Errors occurred when the study was unable to be scored correctly due to absence of oximetry signals, lack of detected airflow, or a poor signal from the thoracic belt. After 3 months a high error rate was noted and the process was changed in that a select team of 21 therapists and supervisors were retrained on use of the HST devices. This new training process included the use of simulated testing on coworkers. Nursing staff were also reeducated on the testing process and specific instructions were communicated via a revised order set.
Results:
An error rate of 37.9% was present after the initial 95 studies were completed. The revised training methods were then implemented and the therapists performing studies were reduced to a core team. These changes produced an error rate of 5.5% in the subsequent 756 studies. The reduced error rate led to fewer studies that had to be repeated. As of July 2018, the total error rate was 9.2% (78/851 studies).
Conclusions:
The incidence of errors during inpatient sleep testing can be reduced through focused training, use of a core group of therapists, and improved communication. This reduction can increase the likelihood that SDB can be diagnosed and treated prior to hospital discharge. Disclosures: None
Meeting report
Restricted accessMeeting reportFirst published October, 2019pp. 3239453-3239453
A person is considered overweight when their body mass index (BMI) is >25 kg/m2 and obese when >30 kg/m2. Noninvasive ventilation (NIV) by mask has become a popular method of treating respiratory distress and acute respiratory failure. Similar to what is being seen in mechanical ventilation with an increased need for positive end expiratory pressure (PEEP), patients with increased BMI may need additional inspiratory positive airway pressure (IPAP) and expiratory positive airway pressure (EPAP). This study aimed to answer the question: What is the role of BMI when setting EPAP and IPAP? It was hypothesized that BMI does not significantly impact starting level of EPAP and IPAP.
Methods:
This study utilized a retrospective review of the electronic medical record of patients who underwent treatment with NIV between 2/17/19 and 3/31/19. IRB approval was obtained, and patient identifiers were removed after data collection was completed. The respiratory therapists’ assessment of respiratory rate in breaths/min as well as vital signs for SpO2 and arterial blood gas values were assessed. The final IPAP and EPAP settings were recorded once the patient condition improved.
Results:
136 patients were provided NIV treatment. 129 were placed on Bi-Level Positive Airway Pressure and 7 on continuous positive airway pressure. There were 27 patients with a BMI <25 kg/m2 and 109 had BMI >25 kg/m2. All data was placed into IBM SPSS software v25 (IBM, Armonk, New York) and an unpaired t-test was used to compare final IPAP and EPAP settings of the two groups. There was a statistically significant difference in final EPAP settings (P = 0.02) between patients that have a recorded BMI of >25 kg/m2 and those that are <25 kg/m2. There was no significance in setting of IPAP levels (P = 0.25) between the two groups. Patients with a BMI <25 kg/m2 required a mean EPAP of 8.30 ± 1.66 cm H2O and an IPAP of 16.23 ± 2.916 cm H2O when IPAP was used. Patients with BMI >25 kg/m2 required a mean EPAP of 8.78 ± 1.96 cm H2O and an IPAP of 16.50 ± 3.46 cm H2O.
Conclusions:
This study shows that patients with an increased BMI (>25 kg/m2) may require increased EPAP when undergoing NIV treatment to improve clinical outcomes. This study also suggests that starting levels of EPAP should be considered based on a patient’s BMI. Disclosures: None
Meeting report
Restricted accessMeeting reportFirst published October, 2019pp. 3239455-3239455
Clinical alarms play an important part in monitoring patient’s vital signs in the hospital intensive care environment. However, when non-actionable alarms go off too frequently, the opposite may occur and patients can be placed at increased risk of harm due to alarm fatigue. Delays in staff response to alarms are well documented as healthcare givers become desensitized to increased rates of nuisance alarms. Current literature suggests alarms originating from ventilators contribute significantly to the total number of non-actionable alarms. A greater understanding of which specific ventilator alarms are most common and the rates at which they occur is fundamental to improved management of ventilator alarms.
Methods:
A retrospective review was performed on ventilator alarm occurrences for two common types of ventilators used in the pediatric intensive care (PICU) and pediatric cardio-thoracic intensive care (CTICU) units between June 1, 2017 and November 31, 2017, at a major metropolitan children’s hospital. Data collected included alarm data for the Avea and Servo-I ventilators. Descriptive data analysis was performed using Matlab to identify characteristics such as prevalence, proportionality and cause.
Results:
Eleven types of medium and high priority ventilator alarms were identified as common in the PICU and CTICU during 2,091 days of mechanical ventilation. The Inspiratory Flow Overrange (36.6%) on the Servo-I ventilator was the most common cause for ventilator alarms. Medium priority alarms comprised more than 54% of all alarms activated. The combined PICU and CTICU incidence rate of ventilator alarms was 0.94 alarms per ventilator-hour.
Conclusions:
Ventilator alarms occur frequently in the pediatric ICUs and rates vary considerably between the different types of alarms. More than half of all the alarms generated were due to two types of medium priority alarms. Alarm reduction strategies must target the most common types of alarms.
Meeting report
Restricted accessMeeting reportFirst published October, 2019pp. 3239461-3239461
Clinical alarms are critical in the early recognition and timely intervention to changes in the patient’s vital signs. However, frequent occurrences of non-actionable alarms place patients at increased risk of harm due to alarm fatigue. Earlier studies suggest ventilator alarms contribute significantly to the total number of non-actionable alarm events in the intensive care setting. Ventilator alarms and their positive predictive value (PPV) are not well studied. Understanding this is fundamental to effective management of ventilator alarms.
Methods:
A retrospective review was performed on ventilator alarm occurrences for two common types of ventilators used in the pediatric intensive care (PICU) and pediatric cardio-thoracic intensive care (CTICU) units between June 1, 2017 and November 31, 2017, at a major metropolitan children’s hospital. Data collected included vital signs associated with alarm data for the Carefusion Avea and Maquet Servo-I ventilators. Analysis was performed using Matlab to identify the PPV of ventilator alarms related to changes in ETCO2, SpO2 and interventions by increasing FIO2 levels.
Results:
The PPV of eleven unique types of ventilator alarms were identified in the PICU and CTICU during 2,091 days of mechanical ventilation. Overall PPV of ventilator alarms was 27% when using oxygenation intervention indices. The PPV was greatest for High Ve and Apnea alarms at 60% and 62% respectively. Overall, ventilator alarm PPV based on ETCO2 changes was 34%. PPVs varied significantly between the different types of alarms. High Ve, high VT and apnea alarms were most predictive of ETCO2 change at 55%, 43% and 40% PPVs respectively.
Conclusions:
The PPV of ventilator alarms vary significantly between different types of alarms. The PPV for most types of ventilator alarms is statistically significant despite little clinical change in ETCO2 or SpO2. Some alarms are two to three times more effective in predicting physiological change.
Meeting report
Restricted accessMeeting reportFirst published October, 2019pp. 3239472-3239472
Patrik Malone, Richard Mitchell, Matt MacNally , [...]
View All
Abstract
Background:
Nearly 50% of infants supported with bubble CPAP (B-CPAP) fail and require (re)intubation. Endotracheal tubes are known to impose high resistance, which may add to causal respiratory failure but only modest consideration is given to the resistance of neonatal nasal airway interfaces. We hypothesized that resistance and pressure are similar between e a novel prong interface prototype and F&P, RAM, and Hudson Prongs.
Methods:
We measured resistance between ET tubes and interfaces as pressure drop within an ANSI test lung at different flows. We then attached nasal airway interfaces (no ET tube) to a 3D printed 28 week preemie nasal airway model/ASL 5000 lung model. All interfaces were used occlusively and pressure was measured during spontaneous breathing. Mean resistances and lung model pressures were compared using ANOVA.
Results:
Resistance values were all within acceptable ISO standards among all Hudson, F&P, Prototype Prongs and ET tube (3.0 and 3.5 mm), and RAM (blue and orange). Prototype, Hudson, and F&P prongs’ resistance was lower than corresponding ET tubes and RAM cannulae sizes (P < .05; see Figure). Noninvasive interfaces provided greater lung model pressure (within 0.5 cm H2O) than RAM cannula (P < .05) which was always at least 1 cm H2O less than preset B-CPAP levels.
Conclusions:
Our studies indicate that novel prototype provides similar support and at similar resistance values as Hudson and F&P bi-nasal short prongs. A low resistance occlusive prong interface that provides adequate support and does not rely upon a complicated fixation is needed to support the large fraction of newborns that otherwise fail noninvasive support.
Meeting report
Restricted accessMeeting reportFirst published October, 2019pp. 3239477-3239477
Brian M. Daniel, Andrew Arevalo, Rebecca Campos , [...]
View All
Abstract
Background:
Endotracheal tube (ETT) intubation is the single largest risk factor for the development of a ventilator-associated pneumonia (VAP) in the ICU. ETT intubation compromises the cough reflex, mucocilliary clearance, injures the tracheal epithelial surface, provides a direct conduit for rapid access of bacteria, and provides a surface for the formation of biofilms. The use of single suction port subglottic suction endotracheal tubes (SSETT) for the prevention of VAP has been endorsed by many professional medical societies. Numerous random controlled trials demonstrate that SSETTs reduce the duration of mechanical ventilation, length of ICU stay, antibiotic treatment, and delays the onset of VAP. There are several industry approved single port SSETTs used clinically with reports of variable performance outcomes. We aim to evaluate the performance of two brands of single port SSETTs in a trachea model over a clinically relevant period, under manufacturer recommended guidelines.
Methods:
Five porcine tracheas which were set up in simulate a 30-degree semi-recumbent position. The study apparatus was designed to mimic a realistic clinical setting to observe the functionality of various subglottic endotracheal tubes over a period of at least 48 hours. The porcine tracheas mimic anatomic structures in a patient and tissues provide a more realistic model when compared to clear acrylic tubes. Positioning each ETT such that the subglottic region above the cuff balloon came into direct contact with the posterior tracheal wall simulates real clinical positioning of the tube. This helps to also simulate the phenomenon that as fluid is aspirated the mucosa would be drawn closer to the suction lumen and would likely increase the risk of occlusion.
Results:
A control model using a tapered polyurethane cuffed tube without subglottic suction was established and demonstrated 95% of solution leaked pass the cuff and was recovered over 51.5 hours.
Conclusions:
The findings in the four other models involving two brands of SSETTs, revealed that both brands experienced suction failure due to herniation of tissue into the single suction port. This was observed at manufacturer recommended intermittent and continuous suction pressure settings and both single suction port SSETTs were unable to prevent fluid accumulation above their respective cuffs.
Meeting report
Restricted accessMeeting reportFirst published October, 2019pp. 3239484-3239484
Volume-targeted ventilation modes are used in NICU and neonatal transports to provide consistent and accurate tidal volume (VT) delivery so that gas exchange and lung protection can be optimized. We hypothesized there would be no differences in VT delivery in infant lung models between an ICU (Draeger VN500, Lubeck, Germany) and Transport (Hamilton T1, Reno, NV).
Methods:
The Hamilton T1 and VN500 were configured in AC-VG using standard 6 mL/kg settings for ELBW and term newborn. The Ingmar ASL 5000 ventilator was configured using a customized compliance and resistance for each model. The displayed VT on the ventilator and VT delivery to ASL were recorded both from Standby to ON for 8 breaths and following 1 minute after VT was stabilized. Mean differences between % error and bias between the ventilators were compared using T-test with significance established as P < .05.
Results:
When Hamilton T100 was set to deliver VT 6 mL/kg in the ELBW model, excessive VT (∼16 mL/kg) was observed for 8-10 breaths; whereas Draeger VN remained stable with 6-7 mL/kg. The Draeger had greater accuracy than Hamilton with ELBW (P < .05) testing but was lower when compared to Hamilton with term newborn testing (P < .05). The % error was within 10% for term newborns with each ventilator. The Hamilton reported lower VT (∼2 mL) than what was delivered to the lung model, whereas Draeger VN was within 1 mL for both ELBW and term newborn.
Conclusions:
There may be important differences in VT accuracy and reported values between ICU and transport ventilators to considering when proving lung protection to infants.
Meeting report
Restricted accessMeeting reportFirst published October, 2019pp. 3239521-3239521
MI-E improves secretion clearance in neuromuscular weakness. To date MI-E has required a second, stand-alone device. We compared flows and airway pressures with the T-70 (Philips, Murrysville, PA) and VOCSN (Ventec, Bothell, WA).
Methods:
Each device was connected to an ISO rigid lung model with CLset at 50 or 80 mL/cm H2O and Raw of 10 cm H2O/L/s via standard circuits (passive and active). Devices were set at 3 different inspiratory/expiratory pressure settings (+ 30/-30, + 50/+ 50, and + 30/-50 cm H2O) and 2 inspiratory rise times (fast and slow). Insp and exp times were fixed at 3.0 s with no pause time. Artificial mucus (1 mL) was placed in an 8 mm ID tube over a 2-4 cm distance. Photographs were taken before and after 3 cough cycles and video was recorded for each of 3 trials using a 12 mp camera. Photos were imported to a PC and the distance mucus moved antegrade and retrograde was determined. Net mucus movement was determined as the difference between antegrade and retrograde distance measured at the most proximal and distal edge of the mucus. We measured airway pressures, volumes and flows using a Citrex H5 Analyzer (IMT Analytics, SZ) at 500 Hz and calculated peak PIF and PEF the duration of time PEF is > 90% (T90), IP, EP and delivered VT. Median and ranges were calculated and compared between the T70 and the VOCSN with a passive (Vp) and active (Va) circuit. Mucus movement was compared using Wilcoxson rank sum test, a P < .05 was significant. Airway pressure and flows were expressed as median (range) and compared using Kruskal-Wallis test. Regression analysis was used to evaluate factors impacting net mucus movement.
Results:
Table 1 displays the data for + 30/-30 at the slow and fast rise time at a CLof 50 mL/cm H2O. VOCSN resulted in statistically significant (P = .049) increases in mucus movement. Factors impacting mucus movement included PIF, PIF-PEF, and VT Changes were NSS. Absolute PIF and PEF were higher with T-70 but were not statistically different (P = .121). T90% was longer with VOCSNa, but not statistically significant (P = .121).
Conclusions:
Net artificial mucus movement was greater with VOCSN in 9 of 16 conditions. Our data confirms that faster rise times reduced net mucus movement and that PEF alone is not the primary determinant of MI-E success. Flow and pressure values were comparable between devices. The clinical importance of these findings requires patient testing.
Mucus Movement and Flows, Time
Device
Rise Time
Net mucus movement(cm)
PIF*(LPM)
PEF*(LPM)
T90%*(Secs)
T70
F
1.1 (0.4,2.1)
150 (148, 153)
168 (167,172)
0.205 (0.175, 0.215)
VOCSNp
F
2.7 (2.55, 3.0)#
126 (125, 131)
156 (154, 158)
0.161 (0.155, 0.162)
VOCSNa
F
1.7 (1.1, 1.85)
134 (133,136)
146 (145,147)
0.372 (0.369, 0.372)
T70
S
3.0 (2.90, 3.33)
84 (84,85)
163 (162, 164)
0.215 (0.205, 0.235)
VOCSNp
S
3.42 (2.85,4.05)
110 (107, 113)
156 (154, 158)
0.220 (0.219, 0.233)
VOCSNa
S
2.2 (1.25, 2.4)
109 (107,109)
146 (143, 146)
0.340 (0.310, 0.364)
*Comparisons of PIF, PEF,and T90% between devices were not significant by Kruskal-Wallis test p =0.121 # Mucus movement at fast rise time was greater with VOCSNp (p=0.049) compared to T-70