
Abstract
Functional hyperemia is the regional increase in cerebral blood flow upon increases in neuronal activity which ensures that the metabolic demands of the neurons are met. Hypertension is known to impair the hyperemic response; however, the neurovascular coupling mechanisms by which this cerebrovascular dysfunction occurs have yet to be fully elucidated. To determine whether altered cortical parenchymal arteriole function or astrocyte signaling contribute to blunted neurovascular coupling in hypertension, we measured parenchymal arteriole reactivity and vascular smooth muscle cell Ca2+ dynamics in cortical brain slices from normotensive Wistar Kyoto (WKY) and spontaneously hypertensive (SHR) rats. We found that vasoconstriction in response to the thromboxane A2 receptor agonist U46619 and basal vascular smooth muscle cell Ca2+ oscillation frequency were significantly increased in parenchymal arterioles from SHR. In perfused and pressurized parenchymal arterioles, myogenic tone was significantly increased in SHR. Although K+-induced parenchymal arteriole dilations were similar in WKY and SHR, metabotropic glutamate receptor activation-induced parenchymal arteriole dilations were enhanced in SHR. Further, neuronal stimulation-evoked parenchymal arteriole dilations were similar in SHR and WKY. Our data indicate that neurovascular coupling is not impaired in SHR, at least at the level of the parenchymal arterioles.
Keywords
INTRODUCTION
Functional hyperemia (FH), the process in which neuronal activation triggers local increases in cerebral blood flow (CBF), is of particular importance for cerebral homeostasis as it ensures that neuronal metabolic demands are met. 1 Despite recent controversy,2,3 numerous in vitro and in vivo studies suggest that astrocytes act as intermediaries in the neurovascular coupling (NVC)-mediated vascular responses that govern the hyperemic response. Although NVC-mediated signaling can elicit both vasodilation and vasoconstriction, the focus of this study is to address NVC-mediated vasodilatory responses. During the orche-strated signaling among neurons, astrocytes, and the cerebral vasculature that occurs during NVC-mediated vasodilation, synaptically released glutamate binds to astrocytic metabotropic glutamate receptors (mGluR) increasing intracellular Ca2+,1,4 which, in turn, results in the release of vasoactive signals such as arachidonic acid (AA) metabolites 4 and K+. 5
Although FH is impaired in hypertensive patients and animal models of hypertension,6–9 the mechanisms by which hypertension disrupts NVC among cells in the neurovascular unit is not fully understood. A few elegantly designed studies, primarily evaluating pial arteriole function, have used regional CBF measurements to deliver valuable insight into the vascular mechanisms underlying NVC disruptions during acute, short-term Angiotensin II-induced hypertension6,9 and chronic hypertension. 8 However, the effects of hypertension on NVC-mediated vasodilations have yet to be investigated solely in the distinct subpopulation of cerebral microvessels penetrating the brain parenchyma, the parenchymal arterioles (PAs). Given that artery size is an important determinant of cerebral myogenic responses 10 and that myogenic tone is mediated by different mechanisms in pial arterioles versus PAs,11,12 the importance of studying hypertension-induced brain pathologies in discrete vascular beds should not be underestimated.
In the current study, we used the spontaneously hypertensive rat (SHR) and its normotensive control, the Wistar Kyoto rat (WKY) to test the hypothesis that both PA and perivascular astrocyte dysfunction impair NVC-mediated vasodilations in an optimized in vitro brain slice model. We found that the thromboxane A2 receptor agonist U46619 elicited higher tone in SHR PAs as compared with WKY. Further, basal PA vascular smooth muscle cell (VSMC) Ca2+ oscillation frequency was increased in SHR. In perfused and pressurized PAs from SHR, myogenic tone, wall-to-lumen ratio, and wall thickness were increased indicating an increase in vascular resistance. In contrast, K+-induced PA dilations were similar in WKY and SHR, and mGluR activation-induced PA dilations were enhanced in SHR. Finally, neuronal stimulation-induced PA dilations were similar in WKY and SHR. Contrary to our hypothesis, these data indicate that NVC-mediated vasodilations are not impaired at the PA level in SHR.
MATERIALS AND METHODS
Animals
All animal procedures were approved by the Institutional Animal Care and Use Committee at Georgia Regents University and conducted in accordance with the Public Health Service Policy on Humane Care and Use of Laboratory Animals. Thirteen- to 16- and 24- to 27-week-old male WKY (n = 58 and 4, respectively) and SHR (n = 52 and 4, respectively; Harlan Laboratories, Indianapolis, IN, USA) were housed in institutional facilities with a 12 hour light/dark cycle and ad libitum access to food and water. As blood pressure plateaus after 12 weeks in SHR, 13 animals in the selected age ranges have established hypertension. Mean systolic blood pressure was 123.4±1.0 mm Hg for WKY and 177.9±1.3 mm Hg for SHR (P < 0.0001) in the 13- to 16-week group, and 159.8±3.7 mm Hg for WKY and 190.0±6.2 mm Hg for SHR (P = 0.006) in the 24- to 27-week age group.
Brain Slice Preparation
After anesthesia with sodium pentobarbital, the brain was removed, and coronal cortical slices (250 to 270 μm) cut using a Leica VT 1200S vibratome (Leica Microsystems, Wetzlar, Germany) in ice-cold artificial cerebrospinal fluid (aCSF) comprising (in mmol/L) KCl 3, NaCl 120, MgCl2 1, NaHCO3 26, NaH2PO4 1.25, glucose 10, CaCl2 2, and L-ascorbic acid 0.4, with osmolarity 300 to 305 mOsm, equilibrated with 95% O2−5% CO2 (pH 7.4). Slices were incubated in equilibrated room temperature aCSF until needed.
Pharmacological Induction of Tone
Once a PA was located, baseline diameter was recorded for approximately 5 minutes. The slice was then perfused with aCSF containing the thromboxane A2 receptor agonist U46619 (100 to 250 nmol/L) to induce tone as previously demonstrated.5,14–17 We then assessed arteriole responses to 10 mmol/L K+ (5 to 10 minutes exposure) in the continued presence of U46619. For comparisons of percent tone and K+-induced dilations between SHR and WKY (Figures 1B and 1C, and Figures 3B and 3C), arterioles that did not develop at least 10% tone in response to U46619 (150 nmol/L) were excluded from analysis.
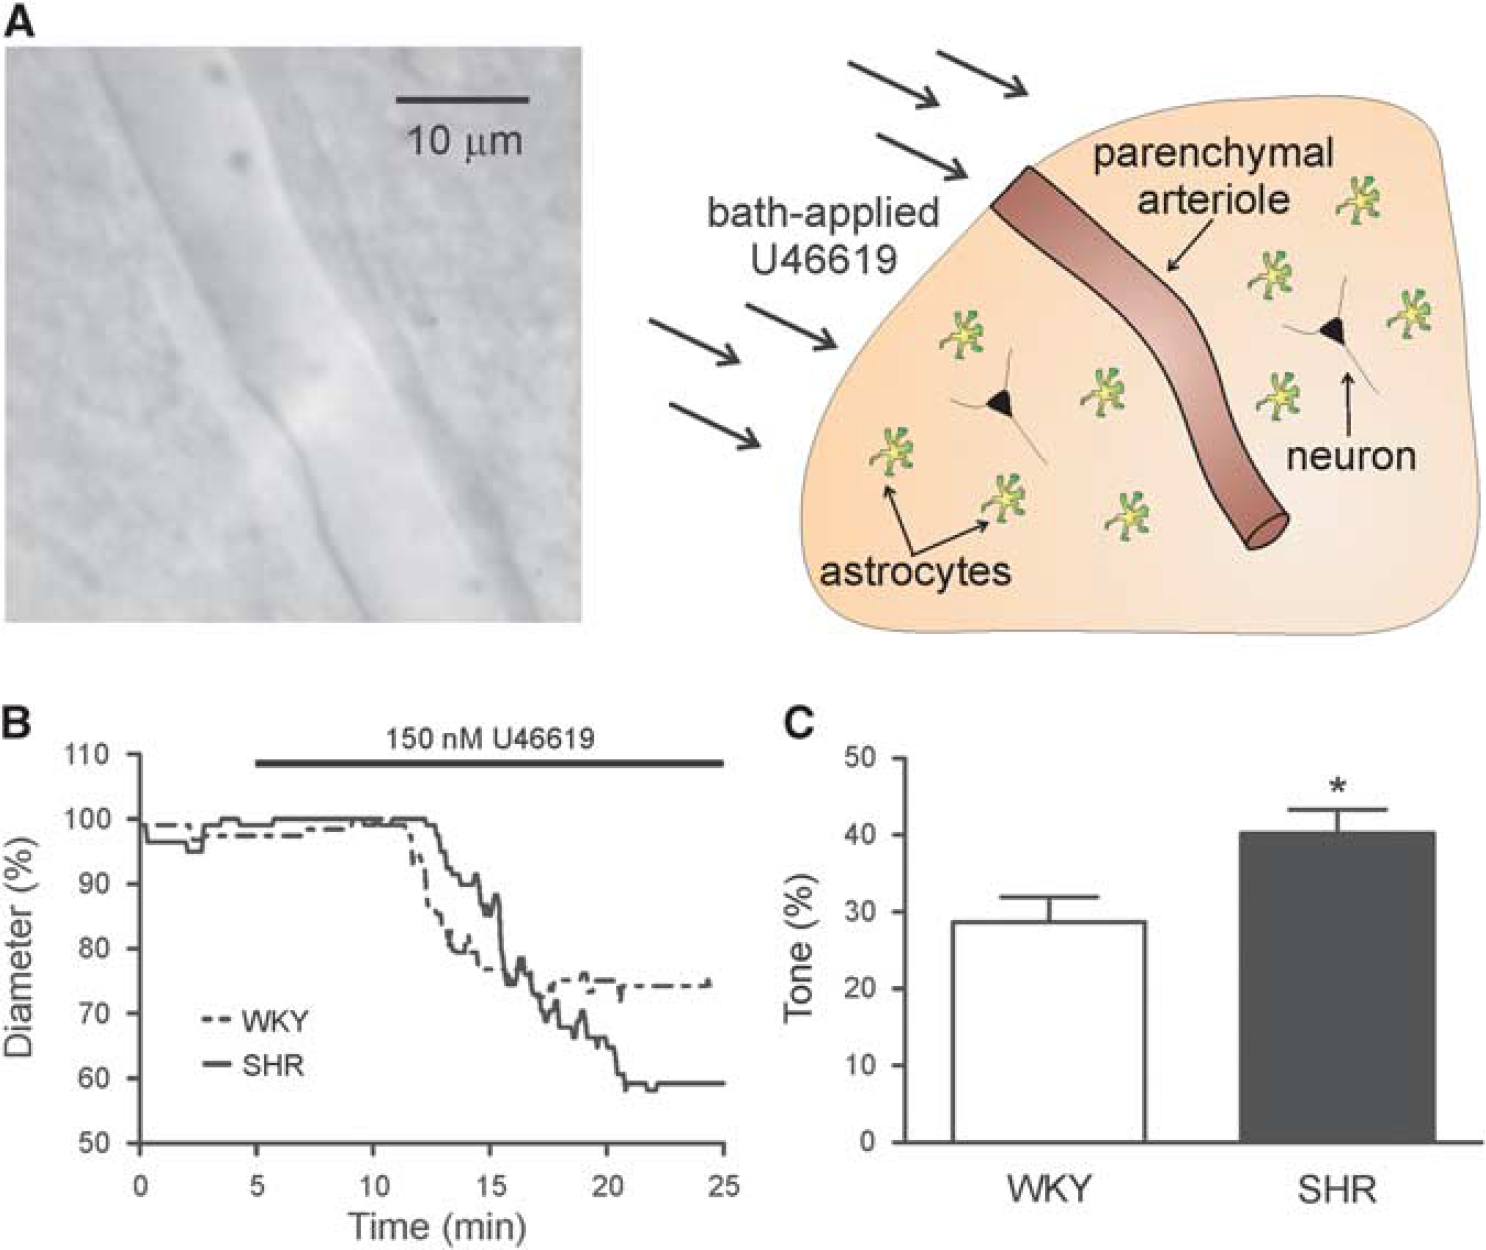
SHR parenchymal arterioles (PA) show increased reactivity to the thromboxane A2 agonist, U46619. (
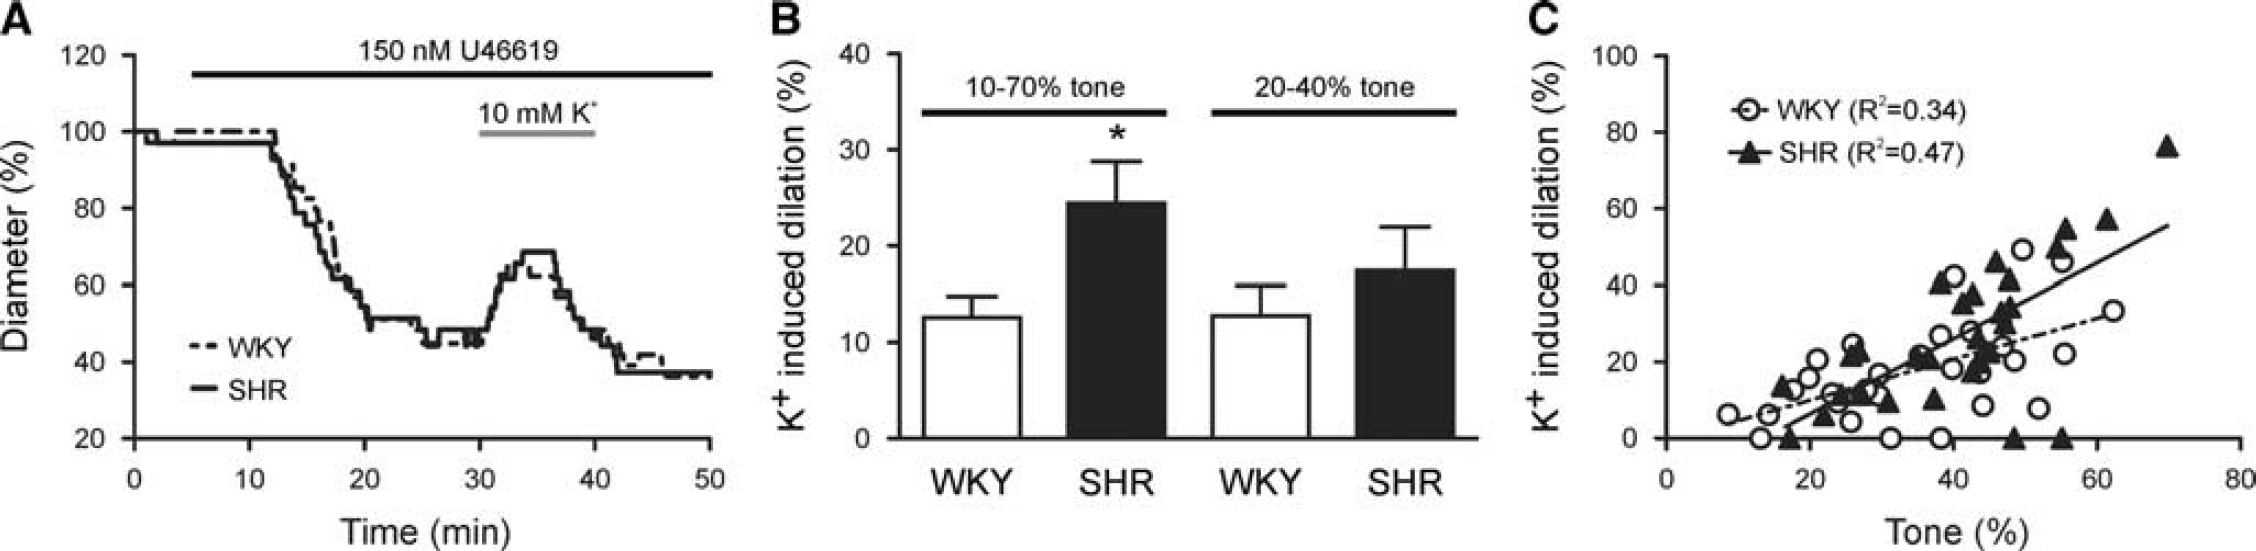
Increased tone mediates enhanced K+-induced parenchymal arteriole (PA) dilations in SHR. (
Calcium Imaging
Cortical slices were incubated in oxygenated, room temperature aCSF containing Fluo-4 AM (10 μmol/L) and pluronic acid (2.5 μg/mL) for 1V to 2 hours and then transferred to room temperature aCSF until needed. After a PA was visualized, VSMC Ca2+ activity was measured for 40 to 60 seconds every 5 minutes during a 25-minute U46619 (150 nmol/L) exposure. Ca2+ imaging was performed using the Andor Technology Revolution System (iXON camera connected to Yokogawa confocal scanning unit; Andor Technology, Belfast, UK). Fluorescence images were acquired at ~ 2 frames/second using a krypton/argon laser (488 nmol excitation; >495 nmol emission). Vascular smooth muscle cell Ca2+ oscillation frequency (Hz) and amplitude (fractional fluorescence—F/F0) were measured within a ROI (8 × 8 pixels or 2.64 × 2.64 μm) placed over an active cell using custom software created by Dr Adrian D Bonev (University of Vermont). The F/F0 was calculated by dividing the fluorescence intensity (F) by a baseline fluorescence value (F0) determined from 20 images showing no activity. Ca2+ oscillation peaks were detected using a threshold of 0.20F/F0. Slices that did not respond to U46619 with an increase in VSMC Ca2+ were considered unhealthy and excluded from analysis.
Arteriole Cannulation
Details of the cannulation procedure can be found in Kim and Filosa. 18 Briefly, cannulas (1.5 mm OD and 1.17 mm ID; Warner Instruments, Hamden, CT, USA) were created using the P-97 micropipette puller (Sutter Instruments, Novato, CA, USA), filled with internal solution, and mounted onto a MP-225 motorized micromanipulator (Sutter Instruments). Cannula internal solution was comprised of (in mmol/L) KCl 3, NaCl 135, MgCl2 1, CaCl2 2, glucose 10, HEPES 10, and 1% albumin with osmolarity 300 to 305 mOsm and pH 7.4. Luminal flow was controlled with a PHD 2000 syringe pump (Harvard Apparatus, Holliston, MA, USA). System pressure was continuously monitored using a pressure transducer placed before the cannula and connected to a PS-200 pressure servo controller (Living Systems Instrumentation, St Albans, VT, USA). Arteriole luminal pressure was calculated as previously described 18 using a derivation of Ohm's law (resistance = Δpressure/flow).
Once a PA with a visible opening was located, a cannula with minimal outflow was advanced into the arteriole lumen. 18 Flow rate (0.05 to 1.0 μL/minute) was set according to PA size, and the arteriole was allowed to equilibrate until stable myogenic tone was achieved (~30 minutes). Shear stress (SS) values were calculated as previously described 18 using the equation t = 4nQ/πr 3 in which t represents SS, η represents viscosity, Q represents flow rate, and r represents radius. The slice was then perfused with 10 mmol/L K+ or 100 μmol/L t-ACPD for 5 to 10 minutes. In a subset of t-ACPD experiments, slices were perfused with the gliotoxin DL-2-aminoadipic acid (DL-AAA; 2 mmol/L) for 20 to 30 minutes before t-ACPD exposure to inactivate astrocytes.19,20 Although our DL-AAA treatment protocol is well below the dose and incubation time (> 3 mmol/L and 2 hours) that has previously been shown to induce neuronal toxicity, 20 we cannot rule out the potential for neuronal toxicity in our experiments. However, we believe these data do not confound the conclusions of the study as (1) DL-AAA was used in t-ACPD experiments, which were designed to test the effect of hypertension on astrocytes and other downstream mGluR expressing cells (see schematic Supplementary Figure S1) and (2) although neurons also express mGluR, t-ACPD has been shown to suppress neuronal activity,21,22 therefore, we would not expect neuronal toxicity to have an adverse effect on t-ACPD-induced dilations.
At the end of the experimental protocol, maximum diameter was obtained by perfusing slices with zero Ca2+ aCSF containing papaverine (100 μmol/L). Arterioles with SS values > 200 dynes/cm2 were excluded from percent tone and diameter at peak tone comparisons (Figure 4). Lumen diameter (inner diameter), wall thickness ((outer diameter – inner diameter)/2), and wall-to-lumen ratios ((outer diameter – inner diameter)/inner diameter) were calculated using maximally dilated arterioles.
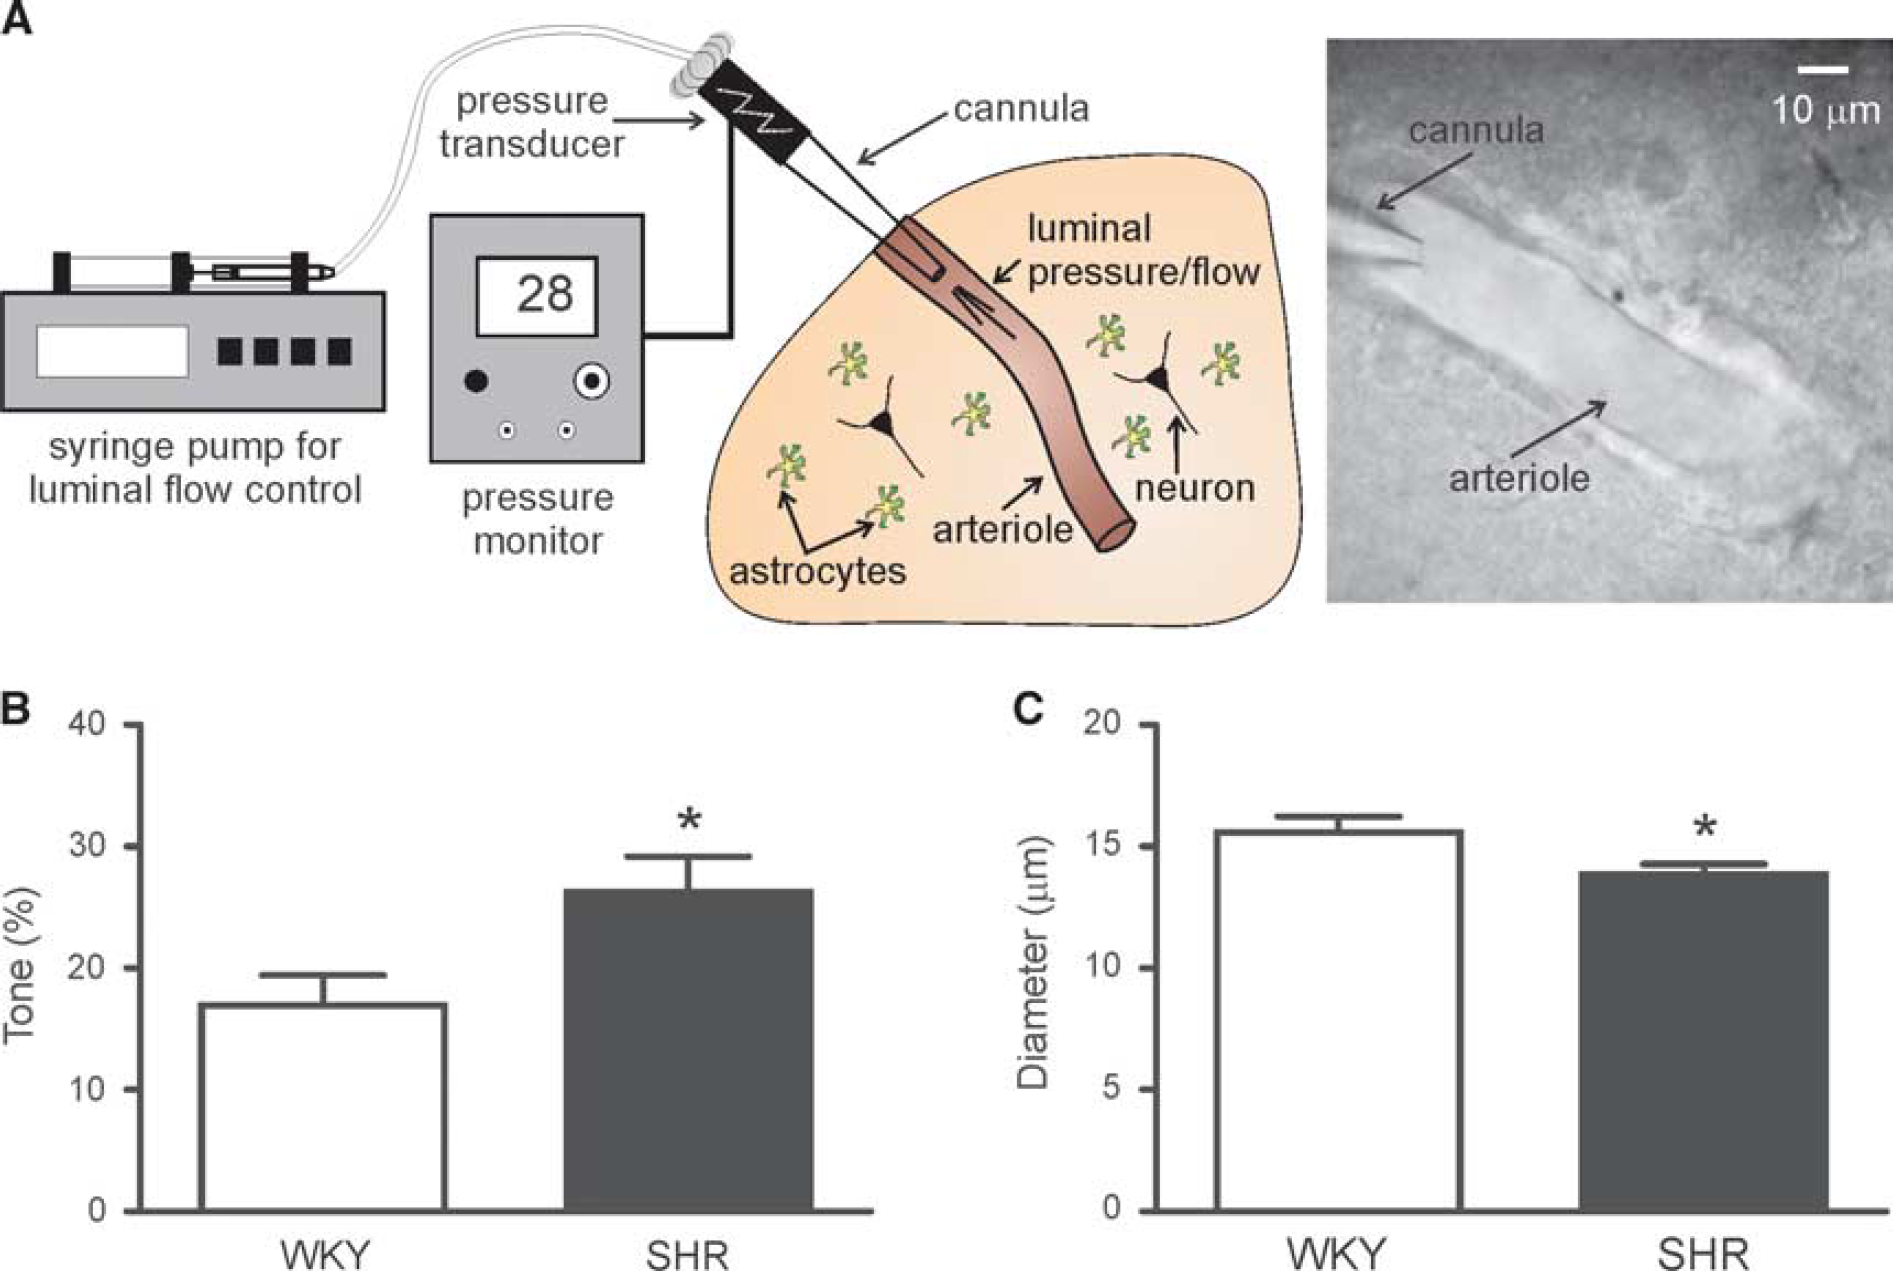
Parenchymal arteriole (PA) myogenic tone is increased in SHR. (
Electrical Field Stimulation
In a separate set of cannulation experiments, vascular responses were measured after neuronal activation evoked via electrical field stimulation (EFS) as previously shown. 5 Dual platinum wires placed on either side of the brain slice were used to apply 200-millisecond trains of 100 Hz at a rate of 0.2 Hz and an amplitude of 3 to 4 V for ~ 30 seconds, a protocol eliciting repeatable dilations. To facilitate the maintenance of tone throughout the duration of the experiment, the bath solution was supplemented with U46619 (100 nmol/L). EFS-evoked vascular responses were also corroborated in aCSF gassed with 20% O2.
Video Microscopy and Parenchymal Arteriole Diameter Analysis
For imaging, a slice was transferred to a microscope chamber continuously perfused with equilibrated aCSF using a miniplus 3 peristaltic pump (Gilson, Middleton, WI, USA) and held with a nylon grid. Chamber temperature was maintained at 35±2 °C using a single-line solution heater (Warner Instruments) connected to a DC power supply (BK Precision, Yorba Linda, CA, USA). Cortical PAs were visualized using an iXON camera (Andor Technology) attached to either an Axioskop 2FS microscope (Carl Zeiss Microscopy, Thornwood, NY, USA) equipped with a × 40 or × 60 Achroplan objective (Carl Zeiss Microscopy) or a Nikon Eclipse FN 1 microscope (Nikon, Tokyo, Japan) equipped with a × 60 NIR Apo objective (Nikon). Images were acquired at 1 to 2 frames/second using Andor IQ software (Andor Technology). Arteriole luminal diameter was measured using custom software created by Dr Adrian D. Bonev (University of Vermont). Before bath application of U46619 or PA cannulation, the luminal diameter of all PAs used was < 20 μm. Given that PAs dilated uniformly to all stimuli, diameter was measured at a single point in the PA where the focus remained most stable during the experimental protocol.
Parenchymal arteriole luminal diameters were converted to percent (%) diameter for analysis. In cannulation experiments, diameter is expressed as % change from maximum diameter obtained with zero Ca2+ aCSF containing papaverine (100 μmol/L). However, in experiments in which tone was induced with U46619, arterioles did not dilate maximally despite prolonged exposure (> 30 minutes) to zero Ca2+ aCSF containing papaverine likely due to the lack of flow within the vessel. Consequently, diameter is expressed as % change from baseline diameter before U46619 exposure in these experiments. The % tone and % dilation were calculated as follows: % tone = (% baseline or maximum diameter - % steady state tone diameter)/% baseline or maximum × 100; % dilation = (% diameter @ peak dilation - % diameter @ steady state tone)/% diameter @ steady state tone × 100.
Statistical Analysis
Data are expressed as mean ± s.e.m. and ‘n’ represents the number of slices in which each experiment was completed. Differences between means from each group (WKY versus SHR) were evaluated using a two-tailed, unpaired Student's t-test. Single within-group comparisons with control (baseline) were evaluated using a paired Student's t-test, and multiple within-group comparisons with control were evaluated using repeated measures one-way analysis of variance with Dunnet's multiple comparison post test (Figure 2). Pearson's Correlation test was used to calculate the R 2 for XY plots, and a linear regression analysis was used to test for differences between the slopes of two lines. P < 0.05 was considered significant for all analyses.

Basal vascular smooth muscle cell Ca2+ oscillation frequency is increased in SHR. (
RESULTS
U46619-Induced Parenchymal Arteriole Constriction is Enhanced in the Spontaneously Hypertensive Rat
To determine whether PA function is altered in SHR, arteriole diameter was measured in response to bath application of the thromboxane A2 receptor agonist U46619, an established approach to induce vascular tone in non-perfused arterioles.5,14–17 Figure 1B shows representative traces of U46619-induced PA constrictions. In response to 150 nmol/L U46619, PAs from SHR (n = 21) developed significantly higher percent tone when compared with WKY (n = 14;40.24±3.05% versus 28.64±3.24%; P = 0.02; Figure 1C). The time to peak tone (from onset of U46619 exposure to constriction plateau) was not different between groups (20.08±0.86 minutes (WKY) versus 20.34±0.80 minutes (SHR);P = 0.83). These data support increased PA reactivity in SHR.
Baseline Parenchymal Arteriole Vascular Smooth Muscle Cell Ca2+ Oscillation Frequency is Increased in the Spontaneously Hypertensive Rat
To test whether the enhanced U46619-induced PA tone in SHR was correlated with increased VSMC Ca2+, PA VSMC Ca2+ activity was recorded at 5-minute intervals for a total of 25 minutes in response to U46619 (150 nmol/L). Figure 2A shows a representative confocal image of PA VSMCs loaded with the Ca2+ indicator dye Fluo-4 AM and corresponding traces of VSMC Ca2+ activity. Parenchymal arteriole VSMC Ca2+ oscillation frequency was significantly higher in SHR (n = 23) as compared with WKY (n = 28) at baseline (before U46619 exposure) and at the onset of U46619 exposure (0 minutes;0.17±0.02Hz versus 0.10±0.02 Hz, P = 0.04 and 0.17±0.02Hz versus 0.11±0.02 Hz; P = 0.04, respectively; Figure 2B). Consistent with PA constriction, U46619 elicited a significant increase in VSMC Ca2+ oscillation frequency in both WKY (P < 0.001, 5 to 25 minutes) and SHR (P < 0.05, 10 to 15 minutes; Figure 2B). Parenchymal arteriole VSMC Ca2+ oscillation amplitude was not different between WKY and SHR at any time point nor was it increased by U46619 (P = 0.15 and P = 0.35; Figure 2C). These data suggest that increased baseline VSMC Ca2+ oscillation frequency in SHR may be a factor contributing to the increased PA tone observed in these animals.
Increased Tone Mediates Enhanced K+-Induced Parenchymal Arteriole Dilations in the Spontaneously Hypertensive Rat
During NVC-mediated vasodilations, increased extracellular K+ (< 20 mmol/L) activates VSMC inward rectifier potassium (Kir) channels thus eliciting VSMC hyperpolarization. 1 Consequently, we next measured PA responses to bath applied 10 mmol/L K+ after induction of tone with U46619 (150 nmol/L, see model depicting the experimental paradigm used to activate different components of the neurovascular unit, Supplementary Figure S1). Figure 3A shows representative traces of extracellular K+-induced PA dilations. Although the time to peak dilation was not different between groups (5.21±1.09 minutes (WKY; n = 14) versus 3.90±0.48 minutes (SHR; n = 21); P = 0.23), PAs from SHR exhibited significantly greater dilations to K+ than WKY (24.44±4.36% versus 12.61±2.18%; P = 0.04; Figure 3B).
Our group previously demonstrated a positive correlation between the magnitude of extracellular K+-induced dilations and the level of PA tone before dilation 14 —PAs with higher tone respond to vasodilatory stimuli with greater dilations. Given that SHR PAs constricted more in response to U46619, the enhanced K+-induced dilations in SHR could be because of enhanced tone. Accordingly, K+-induced dilations were similar in WKY (n = 8) and SHR (n = 7) (12.80±3.11% versus 17.45±4.52%; P = 0.40; Figure 3B) when responses were compared among PAs with similar percent tone (20 to 40%). Moreover, we measured K+-induced dilations in PAs with different levels of tone induced by graded doses of U46619 (100 to 250 nmol/L); both WKY (n = 30; R 2 = 0.34, P =0.001) and SHR (n = 29; R 2 = 0.47, P < 0.0001) showed a positive correlation between tone and K+-induced dilation (Figure 3C). Further, the slopes of the linear regression lines were not different between groups (0.54±0.14 versus 0.99±0.20; P = 0.07) demonstrating that K+-induced dilations are similar in WKY and SHR when the arterioles have comparable levels of tone. Altogether, these data suggest that the mechanism mediating K+-induced PA dilation is not impaired in SHR, but rather enhanced because of higher tone.
Parenchymal Arteriole Myogenic Tone is Increased in the Spontaneously Hypertensive Rat
To measure vascular reactivity under conditions that more closely mimic normal physiology, we next used a modified in vitro brain slice preparation in which PAs are perfused and pressurized, an approach characterized and validated in a recent publication by our group. 18 Figure 4A shows a representative schematic of the cannulation setup. Luminal flow and pressure enables the development of myogenic tone, thus providing a more physiologic setting to address the effects of hypertension on PA biomechanics. When cannulated arterioles were perfused at a rate of 0.2 to 0.3 μL/minute, PAs from SHR (n = 13) exhibited significantly higher tone than WKY (n =17, 26.25±2.945 versus 16.93±2.48%; P = 0.02; Figure 4B). In accordance with higher PA tone, luminal diameter was significantly lower in SHR versus WKY (13.84±0.43 μm versus 15.60±0.64 μm; P = 0.04; Figure 4C). Although the increase in vascular resistance was associated with an increase in PA luminal pressure and SS in SHR versus WKY (16.00±4.38 mm Hg, n = 8 versus 7.91±1.64 mm Hg, n = 10; and 114.0±12.02 dynes/cm2, n = 13 versus 87.72±8.86 dynes/cm2, n = 17, respectively), these values did not reach statistical significance (P = 0.08 for both). Increased myogenic tone coupled with enhanced U46619-induced vasoconstriction suggests that PA reactivity is increased in SHR.
Spontaneously Hypertensive Rat Parenchymal Arterioles Display Vascular Remodeling
In an effort to correlate the observed alterations in PA function (namely enhanced myogenic tone) with alterations in PA structure, we also measured wall-to-lumen ratio, lumen diameter, and wall thickness in maximally dilated cannulated PAs. The wall-to-lumen ratio was significantly higher in SHR (n = 39) than WKY (n = 47, 0.29±0.01 versus 0.25±0.01; P = 0.02; Supplementary Figure S2A). Although the lumen diameter was similar in SHR (n = 39) and WKY (n = 47, 17.71±0.51 μm versus 18.25±0.48 μm; P = 0.44; Supplementary Figure S2B), the wall thickness was significantly higher in SHR versus WKY (2.49±0.08 μm versus 2.20±0.08 μm; P = 0.01; Supplementary Figure S2C). Given that PAs are comprised of a single VSMC layer, these data suggest that PA VSMC hypertrophy contributes to increased wall-to-lumen ratios in SHR PAs.
K+-Induced Parenchymal Arteriole Dilations are Similar in the Wistar Kyoto Rat and Spontaneously Hypertensive Rat
Given the importance of the tone-dilation correlation in determining the magnitude of PA responses to vasodilatory stimuli in WKY and SHR, to determine whether this correlation persisted in PAs with myogenic tone, we next measured extracellular K+-induced dilations in cannulated arterioles (Supplementary Figure S1). Figure 5A shows representative traces of K+-induced dilations. In agreement with the U46619 experiments, the tone-K+-induced dilation correlation was similar in WKY (n = 23; R 2 = 0.76, P < 0.0001) and SHR (n = 17; R 2 = 0.67, P < 0.0001) as the slopes of the linear regression lines were not different between the two groups (1.30±0.16 versus 1.41±0.26; P = 0.71; Figure 5B). In support of the linear regression data, the mean K+-induced dilation for all PAs was not different between WKY and SHR (24.72±4.372% versus 19.70±4.88%; P = 0.45; Figure 5C). Further, the time to peak K+-induced dilation was not different between groups (4.06±0.36 minutes (WKY) versus 4.38±0.42 minutes (SHr); P = 0.57). These data suggest that K+-induced PA dilations are not impaired in 13-to-16-week old SHR.
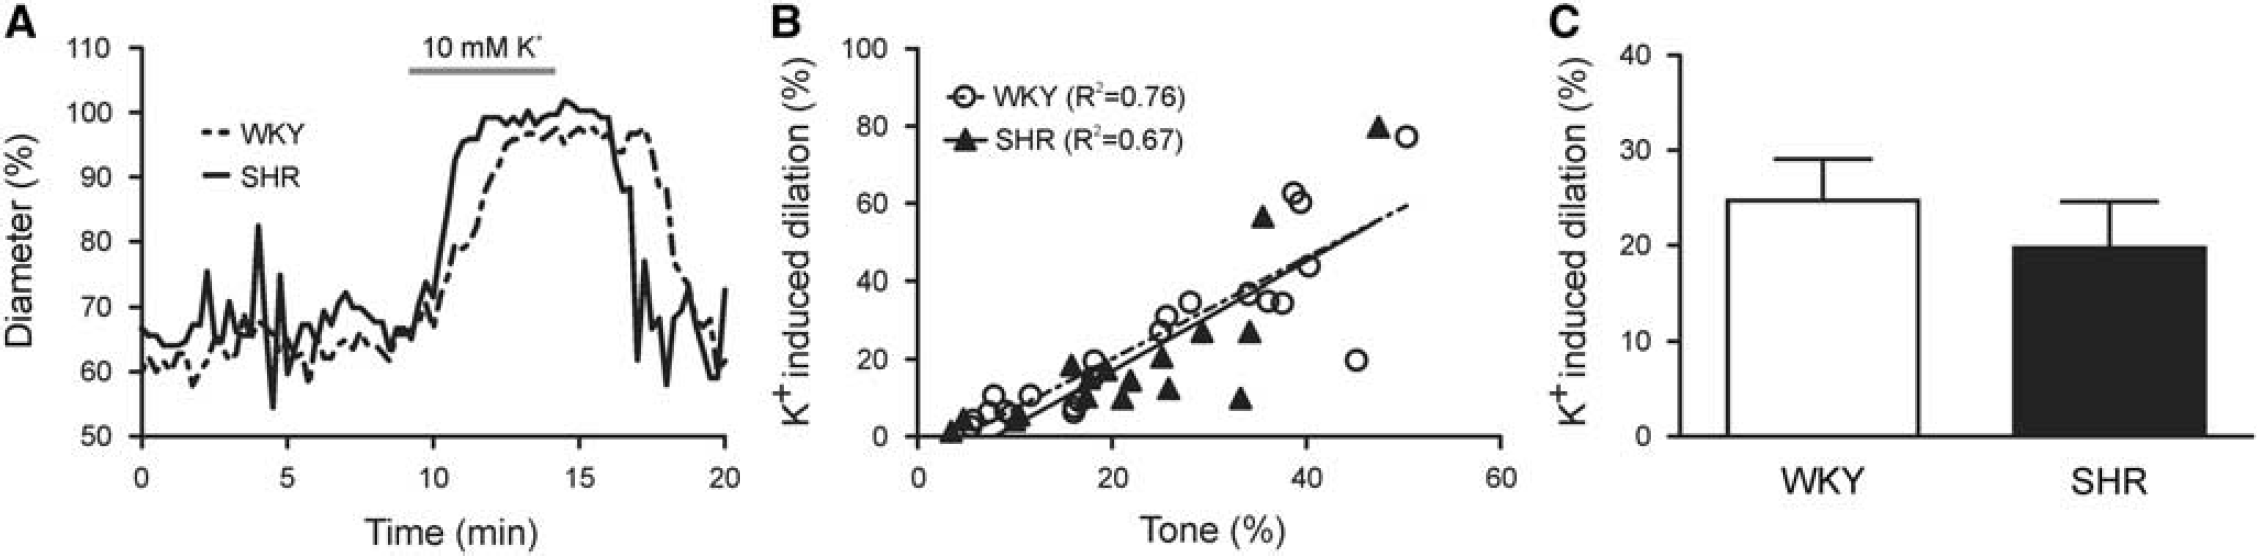
K+-induced parenchymal arteriole (PA) dilations are similar in WKY and SHR. (
Metabotropic Glutamate Receptor-Induced Parenchymal Arteriole Dilations are Enhanced in the Spontaneously Hypertensive Rat
Because vascular responses to direct stimulation with extracellular K+ were not impaired, we next moved upstream in the NVC signaling pathway and stimulated the mGluR pathway (Supplementary Figure S1). In response to synaptically released glutamate, mGluR activation, putatively in astrocytes, mediates NVC via release of vasodilatory compounds.1,4 Thus, as an indirect measure of astrocytic contributions to NVC,14,15 we measured PA luminal diameter changes after mGluR activation with the agonist t-ACPD (100 μmol/L). Figure 6A shows representative traces of t-ACPD-induced dilations. Both WKY (n =15) and SHR (n =12) exhibited a positive correlation between tone and t-ACPD-induced dilation (R 2 = 0.51, P = 0.003 and R 2 = 0.76, P = 0.0002, respectively; Figure 6B). To our surprise, t-ACPD-induced dilations were enhanced in SHR when compared with WKY as demonstrated by a steeper slope of the linear regression line (1.76±0.31 versus 0.46±0.12; P = 0.0004). In agreement, the mean t-ACPD-induced dilation for all PAs was significantly higher in SHR as compared with WKY (28.19±5.75 versus 13.45±2.99; P = 0.02; Figure 6C). The time to peak t-ACPD-induced dilation was not different between groups (9.79±1.77 minutes (WKY) versus 11.13±1.64 minutes (SHR); P = 0.59). The enhanced tone-t-ACPD-induced dilation correlation in SHR suggests that glutamate-mediated vasodilatory NVC signaling pathways may be enhanced in SHR.
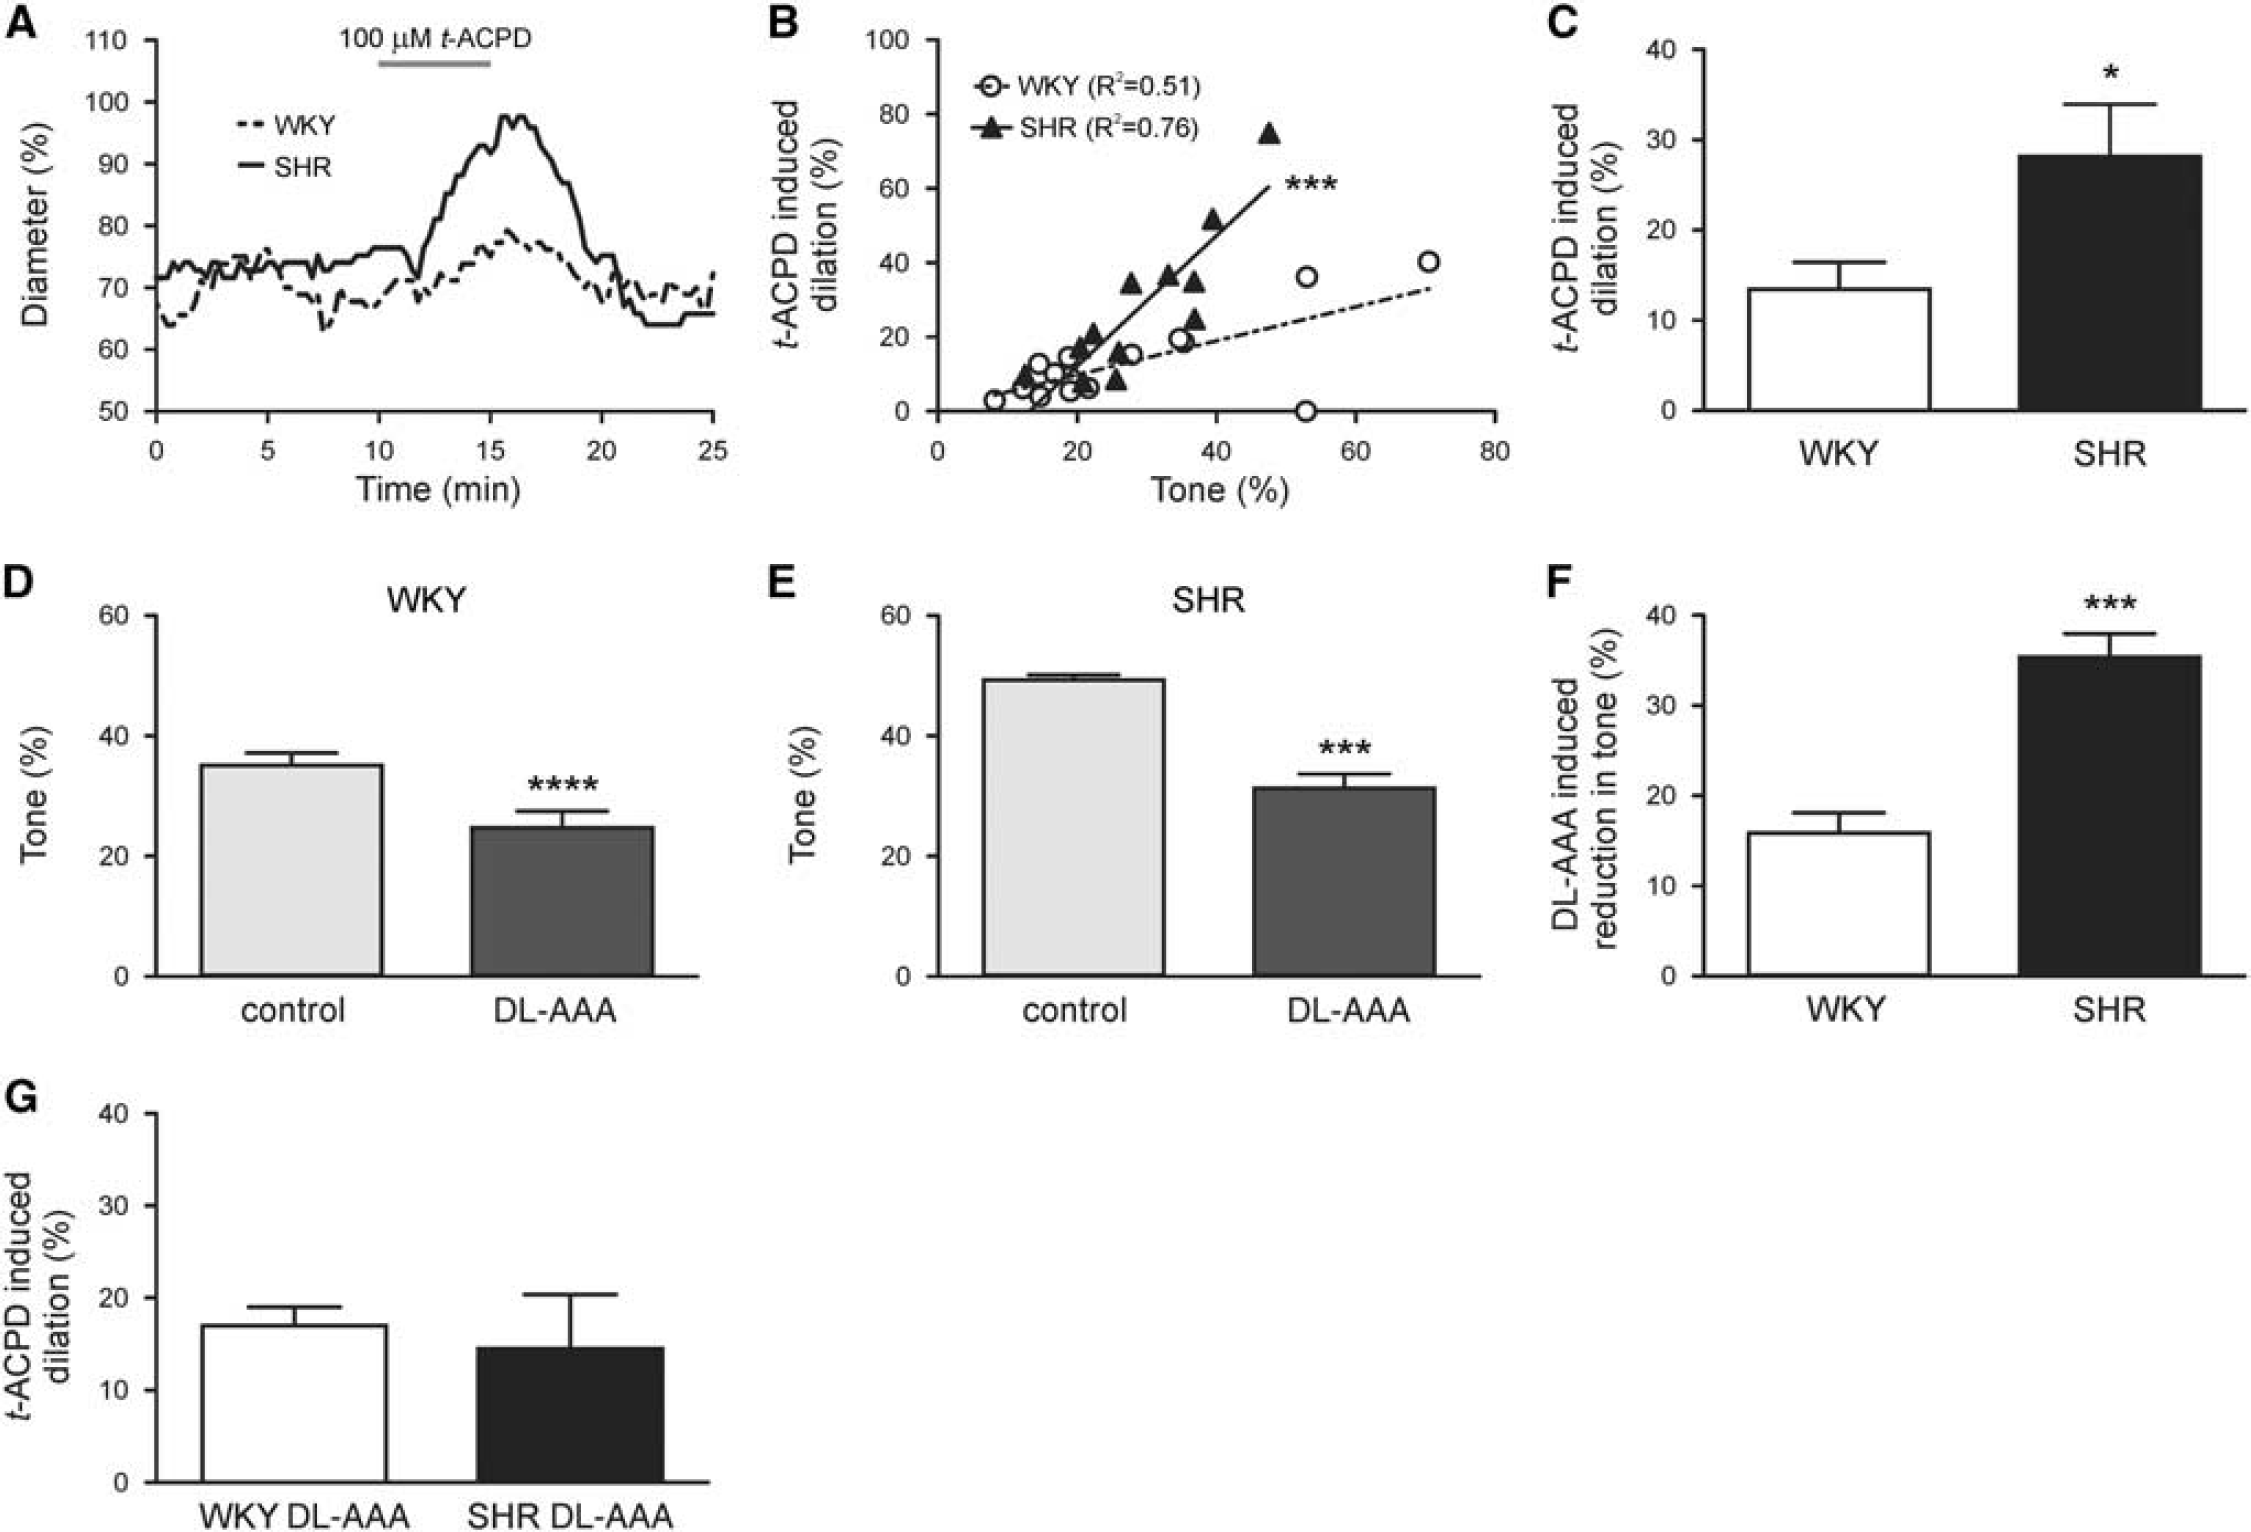
Astrocyte-induced parenchymal arteriole (PA) dilations are enhanced in SHR. (
Astrocyte activation engages two primary NVC mechanisms: K+ release and arachidonic acid metabolism. 4 In an effort to delineate whether increased astrocytic K+ release, via activation of endfoot BK channels, 23 enhanced astrocyte-induced dilations in SHR, we measured changes in astrocyte whole cell currents induced by t-ACPD (100 μmol/L). At +80 mV, t-ACPD-induced outward currents were significantly increased in WKY (P = 0.0006, n = 8) and SHR (P = 0.02, n = 8); however, the subtracted current was not different between groups (273.8±63.94 pA/pF versus 780.0±324.9 pA/pF; P = 0.15; Supplementary Figure S3B). Consistent with K+ channel opening, the reversal potential for this current was − 85.01±4 mV in WKY and − 89.30±2.8 mV in SHR. These data suggest that alterations in K+ efflux from astrocytic endfeet are not responsible for the enhanced t-ACPD-induced dilations in SHR.
Given a previous study suggesting that mGluR1 and mGluR5 (the primary targets of t-ACPD) are not expressed in adult mice, 24 we determined if this was the case in adult WKY and SHR. Supplementary Figures S4 and S5 show representative immunofluorescence images of mGluR1 and mGluR5 expression and their corresponding colocalization with three astrocyte markers: AQP4 (endfeet), s100β (soma), and GFAP (primary processes). Although prominent colocalization was observed primarily with mGluR1/5 and GFAP and AQP4, little, if any, colocalization was observed with s100β. Moreover, we did not observe mGluR1/5 colocalization with the endothelial marker RECA-1 (Supplementary Figures S4 and S5). These data suggest that, contrary to what is observed in mice, 24 mGluR1/5 expression is not developmentally regulated in WKY and SHR.
Because other components of the neurovascular unit, including the microvasculature, 25 also express mGluRs, we repeated t-ACPD experiments in the presence of the gliotoxin DL-aminoadipic acid (DL-AAA;2 mmol/L)19,20 to elucidate the contribution of astrocytes to mGluR-mediated vasodilations. After PA cannulation, DL-AAA was bath applied for 20 to 30 minutes, at which point the slice was exposed to t-ACPD in the continued presence of DL-AAA. Treatment with DL-AAA significantly reduced tone in both WKY (24.75±2.79% versus 35.09±2.08%; P < 0.0001, n = 10) and SHR (31.28±2.42% versus 49.28±0.89%; P = 0.0004, n = 5; Figures 6D and 6E); the reduction in tone was significantly greater in SHR than WKY (35.35±2.62% versus 15.90±2.23%; P = 0.0001; Figure 6F). In the presence of DL-AAA, t-ACPD-induced dilations were no longer enhanced in SHR compared with WKY (14.51±5.89% versus 16.98±2.05, respectively; P = 0.63; Figure 6G); however, dilations were not completely abolished. Together, these data support enhanced astrocyte activation as a mediator of the increased PA tone and t-ACPD-induced dilations observed in SHR.
Neuronal Activation-Induced Parenchymal Arteriole Dilations are Similar in the Wistar Kyoto Rat and Spontaneously Hypertensive Rat
Enhanced t-ACPD-induced dilations in SHR PAs are suggestive of a compensatory mechanism at the glutamate signaling level in 13-to 16-week SHR. Therefore, to determine whether differences in neuronally evoked responses occurred in SHR, we next activated the entire NVC cascade (Supplementary Figure S1). After PA cannulation and the development of myogenic tone, EFS was used to stimulate the cortical neuronal/synaptic network and evoke NVC responses as previously described.5,15 Figure 7A shows representative traces of EFS-induced dilations. Both WKY (n = 8) and SHR (n = 12) exhibited a positive correlation between tone and EFS-induced dilation (R 2 = 0.86, P= 0.0009 and R 2 = 0.54, P = 0.006, respectively; Figure 7B). Electrical field stimulation-induced dilations were similar in WKY and SHR as the slopes of the linear regression lines were not different between groups (2.05±0.34 versus 1.19±0.35; P = 0.10; Figure 7B). In agreement with the linear regression data, the mean EFS-induced dilation for all PAs was not different between WKY and SHR (40.52±10.16 versus 27.33±5.32; P = 0.22; Figure 7C). Further, the time to peak EFS-induced dilation was not different between groups (1.21±0.19 minutes (WKY) versus 1.36±0.20 minutes (SHR); P = 0.60). Together, these data suggest that, at least at the PA level, NVC is not impaired in 13- to 16-week SHR.
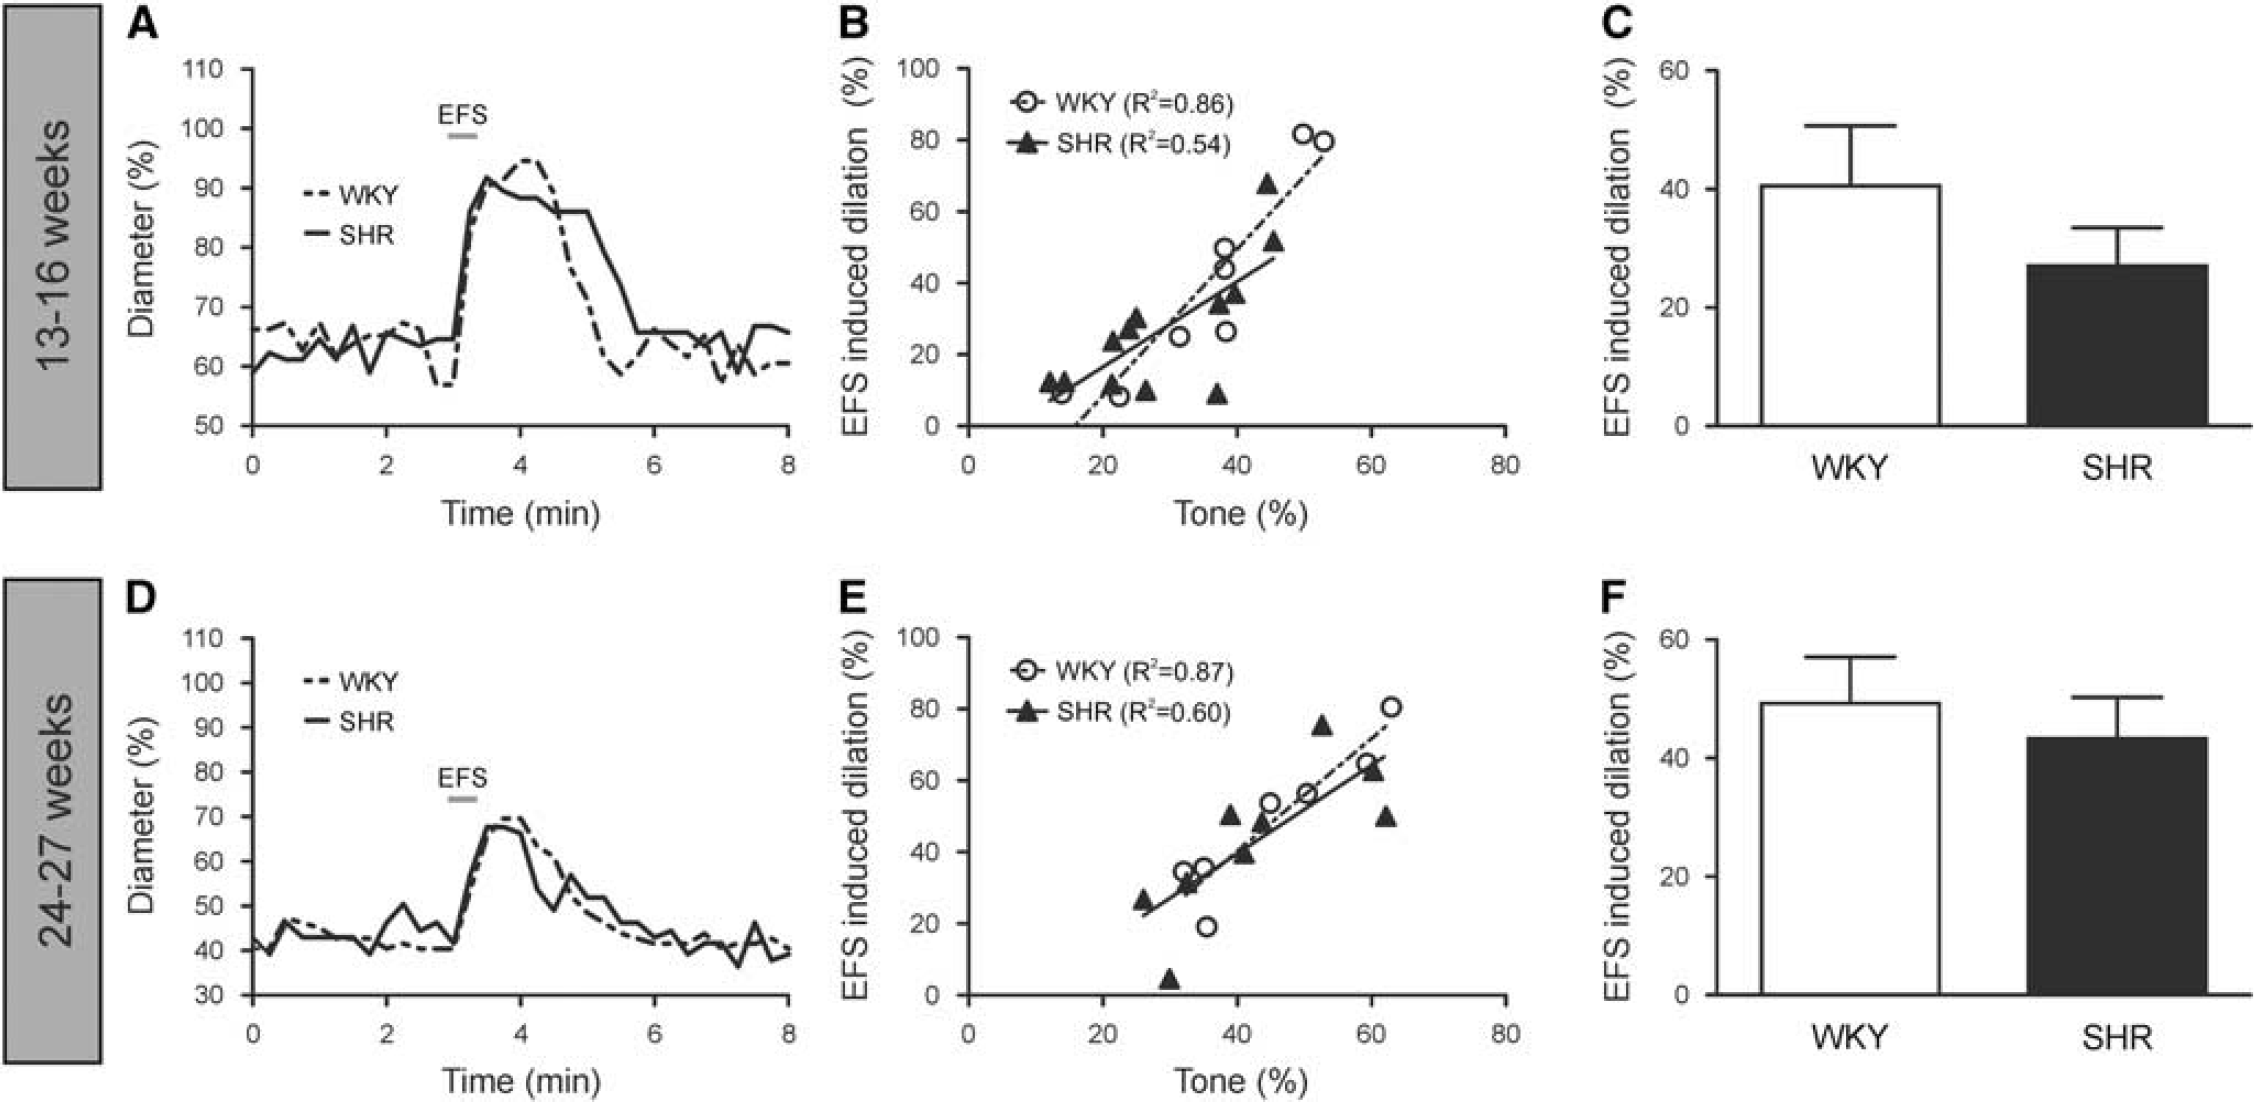
Neuronally mediated parenchymal arteriole (PA) dilations are similar in WKY and SHR at 13 to 16 weeks and 24 to 27 weeks. Representative traces of dilations elicited by EFS in 13- to 16-week (
Because the polarity of the vascular response can be modulated by tissue O2 levels, 26 EFS-induced vascular responses (13- to 16- week age group) were corroborated in slices perfused with 20% O2. As with 95% O2, both WKY (n = 6) and SHR (n = 6) exhibited a positive correlation between tone and EFS-induced dilation (R 2 = 0.77, P = 0.02 and R 2 = 0.85, P = 0.009, respectively; Supplementary Figure S6) in the presence of 20% O2. Further, EFS-induced dilations in 20% were similar to those observed in 95% O2 as the slopes of the linear regression lines were not different in either WKY or SHR (2.44±0.66 versus 2.05±0.34, P = 0.62 in WKY; 1.07±0.22 versus 1.19 ± .35, P = 0.84 in SHR; Supplementary Figure S6). These data suggest that EFS-induced responses are not dependent on O2 concentration in WKY and SHR.
To determine whether the stage of hypertension could account for normal NVC responses in 13- to 16-week SHR, EFS experiments were performed in 24- to 27-week-old WKY and SHR, an age group in which hypertension-induced pathologies are expected to be more advanced. Figure 7D shows representative traces of EFS-induced dilations in this older age group. The 24- to 27-week WKY (n = 7) and SHR (n = 9) exhibited a positive correlation between tone and EFS-induced dilation (R 2 = 0.87, P = 0.002 and R 2 = 0.60, P = 0.01 respectively; Figure 7E) that did not differ from the tone-response correlation observed in 13- to 16-week animals (P = 0.32 for WKY and P = 0.93 for SHR; Supplementary Figure S7). Further, EFS-induced dilations were similar in WKY and SHR as the slopes of the linear regression lines were not different between groups (1.58±0.27 versus 1.24±0.38; P = 0.53; Figure 7E). In agreement with the linear regression data, the mean EFS-induced dilation was not different between WKY and SHR (49.23±7.87 versus 43.33±6.94; P= 0.58; Figure 7F). In combination with the 13- to 16-week data, these data suggest that hypertension-induced impairments in NVC mechanisms are not observed when PAs are studied in isolation from the upstream cerebral circulation network.
DISCUSSION
Although hypertension has been shown to impair FH,6-9 the NVC mechanisms underlying this cerebrovascular dysfunction have yet to be fully elucidated. To our knowledge, no study has addressed the effects of hypertension on NVC mechanisms solely in PAs. Given that myogenic responses are dependent upon arteriole size 10 and mediated by different mechanisms in pial arterioles versus PAs,11,12 understanding hypertension-induced brain pathologies in discrete cerebrovascular beds is essential. In the present study, we demonstrated that in SHR PAs: (1) U46619-induced tone and basal VSMC Ca2+ oscillation frequency were higher, (2) myogenic tone was enhanced, (3) wall-to-lumen ratio and wall thickness were increased, (4) K+-induced dilations were not impaired, (5) t-ACPD-induced dilations were enhanced, and (6) neuronal activation-induced dilations were not impaired. These data indicate that although hypertension alters PA and mGluR signaling properties, the overall contribution of PAs to the NVC response was not impaired. Instead, we propose that increased PA reactivity and mGluR signaling comprise adaptive mechanisms which compensate for upstream impairments in NVC (i.e., at the level of pial arterioles).
Contrary to a study using the stroke-prone SHR, 27 we found that SHR PAs developed significantly higher tone in response to the vasoconstrictor U46619 (Figure 1B). Dissimilarities between the vascular bed studied (PAs versus pial arterioles) or the model used (in vitro brain slice as compared with an in vivo preparation in which hemodynamic factors are present) may account for these differential U46619 responses. Higher myogenic tone (Figure 4A) was also observed when arterioles were perfused and pressurized. While increased luminal pressure10,28 and SS 29 have both been shown to contribute to myogenic constriction, these parameters were elevated but did not reach significance suggesting that they likely act in concert to increase myogenic constriction in SHR.
Although VSMC Ca2+ oscillation frequency was significantly higher in SHR compared with WKY at baseline and at the onset of U46619 exposure, no differences between groups were observed in the continued presence of U46619 (Figure 2B). These data are in agreement with a study by Ungvari and Koller 30 in which myogenic constriction is enhanced in SHR as compared with WKY despite there being no differences in VSMC Ca2+ between the two groups. Similarities in VSMC Ca2+ between WKY and SHR despite the increased tone in SHR during U46619 exposure suggest that, in response to contractile stimuli, Ca2+ sensitivity is enhanced in SHR. 30 Further, increased VSMC Ca2+ oscillation frequency in SHR before U46619 exposure may serve to ‘prime’ the contractile apparatus, thus enhancing the U46619-induced contraction. As for the source of enhanced basal Ca2+ in SHR, both voltage-dependent Ca2+ channels 12 and TRP (transient receptor potential) channels, specifically TRPM431 and TRPC, 32 are important regulators of cerebral artery VSMC Ca2+. Therefore, in SHR, enhanced basal Ca2+ could be attributed to increased expression/activity of these channels, a factor that could also contribute to increased myogenic constriction. In support of this theory, voltage-dependent Ca2+ channel expression 33 and activity 34 are increased in SHR cerebral arteries and TRPM4 channels are increased in SHR cardiomyocytes. 35
Our group previously demonstrated that the magnitude and polarity of PA responses to astrocyte-derived AA metabolites and extracellular K+ are dependent upon the level of arteriole tone. 14 Here, we demonstrated, for the first time, that PAs with myogenic tone also exhibited positive tone-dilation correlations (Figure 5A), responses that were maintained in SHR. Previously reported36,37 enhanced PA K+-induced dilations in SHR were likely because of unaccounted increases in PA tone. This conclusion is supported by similar K+-induced dilations between WKY and SHR in PAs with comparable levels of tone (Figures 3B and 3C).
Despite recently published data indicating a lack of astrocytic mGluR5 expression and function, a primary target of t-ACPD, in adult mice, 24 t-ACPD-induced PA dilations were enhanced in SHR (Figure 6B). Moreover, we observed robust mGluR5 and mGluR1 expression in astrocytic processes and endfeet (Supplementary Figure S4). These data suggest that species specificity may account for the developmental regulation of mGluR5 expression in mice versus rats. Importantly, experiments conducted in the presence of the gliotoxin DL-AAA yielded two major observations: (1) astrocytic contributions to baseline PA tone are greater in SHR and (2) enhanced t-ACPD-mediated vasodilations in SHR are astrocyte dependent (Figure 6I). The persistence of t-ACPD-mediated vasodilations in the presence of DL-AAA also suggest the presence of an alternative signaling pathway. Although mGluRs are expressed in the cerebral microvasculature, 25 we did not observe mGluR1/5 expression in the endothelium (Supplementary Figure S4). Given that pericytes have been shown to express mGluR 38 and induce dilations in response to glutamate, 39 these vascular cells may constitute an alternative pathway underlying mGluR-mediated vasodilations. Further studies are needed to determine the additional mechanisms by which t-ACPD-induced PA dilations occur.
Although astrocytes have been implicated as important participants in NVC,4,40 recent studies have questioned astrocytic contributions to FH in vivo.2,3 These studies demonstrate that cerebral vasodilation precedes elevations in astrocytic Ca2+ when NVC is elicited. Further, hyperemic responses remain intact in the absence of inositol triphosphate receptor-mediated Ca2+ signaling in astrocytes. Although intriguing, these studies do not rule out the potential for astrocytes to contribute to resting CBF or enhanced NVC responses. With the continual advancement of brain imaging methodologies, these findings call for additional research investigating the role of astrocytes in regulating CBF.
In vivo, NVC-evoked vasodilations result from signal integration among two discrete vascular beds—pial arterioles and PAs. When the NVC cascade was activated using EFS in brain slices (a preparation in which PAs are separated from the upstream pial arteriole network), PA dilations were similar in both 13- to 16- and 24- to 27-week WKY and SHR (Figure 7). These data suggest that, in SHR, increased PA tone and mGluR signaling develop as adaptive mechanisms to preserve NVC responses at the PA level thus protecting local parenchymal cells. Further, although multiple physiologic parameters have been shown to affect the magnitude and polarity of vascular responses, including O2, 26 our data argues against an O2-dependent mechanism as no differences were observed in EFS-induced dilations between experiments conducted in 20% and 95% O2 (Supplementary Figure S6).
Although our results indicate that the response to hypertension is adaptive rather than deleterious in the brain parenchyma, overall dysfunction of the entire cerebrovascular network—a phenomenon that may not be detected when a discrete vascular bed is studied—cannot be ruled out. A recent publication demonstrating that neuronal activation-induced regional CBF increases become impaired during the continued presence of hypertension in SHR 8 supports this conclusion. Global disruptions in cerebrovascular function during hypertension could be because of impaired dilatory mechanisms in pial arterioles, or impaired upstream conduction of NVC signals along the vascular network41,42 (from PAs to the pial vasculature), or the astrocytic syncytium 43 (from perivascular astrocytes to the glia limitans). Compromised upstream conduction of NVC signals from PAs to the pial vasculature is an attractive potential mediator of the NVC deficits observed in hypertensive animals as conduction of vasodilation is impaired in SHR mesenteric arteries. 44 In addition, pericytes have been shown to be active regulators of capillary diameter45,46 and contributors to NVC mechanisms 39 suggesting that impairments at the capillary level could also contribute to hypertension-induced cerebrovascular dysfunction.
Although the use of luminal pressure and flow to induce PA myogenic tone represents improvement over traditional brain slice methodologies (which use pharmacological agents to induce PA tone), a few limitations must be acknowledged when using this technique. First, flow rate must be varied across experiments because of variability in PA diameter. As a general rule, larger diameter PAs require higher flow rates to develop myogenic tone whereas smaller diameter PAs need minimal flow to develop myogenic tone. Further, high flow rates are needed to attain luminal pressures in the physiologic range (27 to 34 mm Hg 47 ) resulting in high SS. Because lower flow rates are favored to maintain low SS values, the PA pressures reported in our study are below previously reported in vivo pressures for arterioles of similar magnitude. 47 Despite these limitations, cannulated PAs developed a wide range of myogenic tone that allowed vascular responses to be studied as a function of tone (tone-dilation correlation). Therefore, we believe that this methodology represents an advance over the use of pharmacological stimuli to induce PA tone, which unless the drug elicits similar tone across all groups, may yield confounding results and/or data interpretation.
Special consideration should be given to the model used when studying hypertension-induced cerebral pathologies as these may provide different insights into the factors underlying NVC impairments. The angiotensin II (ANG II) model of hypertension shows impaired NVC at subthreshold ANG II doses before the onset of hypertension, 9 suggesting that Ang II rather than hypertension per se impairs neurovascular function; further, animals with phenylephrine-induced hypertension do not display NVC impairments.6,9 Thus, across-model comparisons may not be appropriate, highlighting the need for additional research.
The data presented in this study suggest that enhanced PA resistance and perivascular astrocyte signaling are adaptive consequences of hypertension. Since the tone-dilation correlation is maintained in SHR, the increased vascular resistance in SHR PAs likely serves to enhance local vasodilatory responses to neuronal/glial-derived vasoactive compounds during NVC. Increased PA resistance in SHR may also serve to protect the downstream microvasculature (i.e., capillaries) from increased systemic pressures thus preventing blood-brain barrier breakdown and edema. Further, enhanced t-ACPD-induced responses in SHR indicate that the production and release of astrocyte-derived vasodilators may also be enhanced. Given that we observed no EFS-induced NVC impairments at the level of the PAs in SHR, we propose that hypertension triggers adaptive responses in the brain parenchyma. In the absence of these adaptive responses, it is likely that FH impairments observed during hypertension6–9 would be much more pronounced resulting in more profound consequences such as parenchymal ischemia. In light of these findings, future work should be directed towards determining whether global impairments in NVC responses are caused by inherent pial arteriole dysfunction, impaired upstream conduction of NVC signals, or a combination of both.
DISCLOSURE/CONFLICT OF INTEREST
The authors declare no conflict of interest.
Footnotes
References
Supplementary Material
Please find the following supplemental material available below.
For Open Access articles published under a Creative Commons License, all supplemental material carries the same license as the article it is associated with.
For non-Open Access articles published, all supplemental material carries a non-exclusive license, and permission requests for re-use of supplemental material or any part of supplemental material shall be sent directly to the copyright owner as specified in the copyright notice associated with the article.