
Abstract
Abstract
In this work, the focus is on optimizing the process parameters of fused deposition modeling manufactured parts, to improve the tensile mechanical properties of manufactured samples and to investigate the impact of the process on the rheological and thermal properties. Particular attention is devoted to the printing order of three-dimensional (3D) samples (printed in a batch or individually). A comparison is made with samples prepared by injection molding. The optimization results show that the raster angle and build orientation (horizontal or vertical) affect the mechanical properties of printed parts. The most significant parameter for the mechanical properties is the printing order; a significant improvement is observed for samples printed individually. The results also show that polylactic acid samples prepared by injection molding undergo thermomechanical degradation, while 3D-printed samples are not affected by the high temperature of the process.
Introduction
Three-dimensional (3D) printing is an additive manufacturing process,1,2 as opposed to a subtractive manufacturing process that involves the milling or cutting of parts to build the required shape. In additive manufacturing, the material is added in layers until it takes the form of the desired product without the need for a forming tool. Furthermore, it produces less waste in the manufacturing process, thereby causing less damage to the environment. 3
One of these additive manufacturing technologies is fused deposition modeling (FDM).4–7 It is one of the most widely used technologies in rapid prototyping, suitable for producing parts with complex geometries.8,9 The principle of layered manufacturing is that a melted polymer filament is extruded through a heated nozzle in a prescribed pattern onto a platform.10–13 As the material is deposited, it cools, solidifies, and bonds with the adjoining material. When one whole layer is deposited, the base plate moves downward by an increment equal to the thickness of the filament and the next layer is deposited; the cycle is repeated until the complete model is built up.14,15
This technology began as a process for creating prototype parts; recently, with continuing advances in materials and technology, it has found new applications in the production of manufacturing tools and as a manufacturing process for end-use parts. There is a wide range of applications where this technique can be used, such as aeronautics, defense, the automotive and electronic industries, the medical sector, as well as architecture and consumer products.16–22 However, a number of improvements are still necessary in order for FDM to fully evolve into a manufacturing tool rather than just a prototyping tool. One of the main improvements is related to the limited mechanical properties of the 3D-printed parts compared to injected material.23–25 Regarding this issue, recent years have seen several research efforts to determine the effects of processing parameters on the mechanical properties of 3D-printed parts. Many parameters have been taken into consideration, including the influence of filament orientation or raster angle, raster width, raster to raster air gap, or infill degree and layer thickness.24–30 Some of these parameters do not have a significant effect on the mechanical properties, and some others, such as raster angle and infill degree, affect considerably the performance of printed materials. In another research study, 31 the entire process is performed in a closed chamber to maintain a constant heat environment to improve interlayer bonding 32 and reduce shrinking, warping, and internal stresses. 33 Meanwhile, in the case of printing an object several times, there is a lack of information about the effect of printing order; the properties could differ, depending on whether the objects are printed individually or in a simultaneous batch.
Concerning the 3D printing materials, polylactic acid (PLA) is one of the most commonly used 3D printing filaments. PLA is a linear aliphatic thermoplastic polyester, produced from renewable resources34–36 ; it is widely used in medical applications37–39 and as packaging.40,41 PLA is recyclable and compostable, which represents a positive impact on the environment.42–44
Generally, PLA is made into useful items using thermal processes such as injection molding and extrusion. Its rheological properties, especially its shear viscosity, have significant effects on thermal processes. At the same time, PLA has low thermal stability, 45 which limits its large-scale application. Paradoxically, the manufacturer-recommended temperature setting for PLA filaments in FDM technology is high (∼200–230°C), and there is a limited amount of information concerning the effects of the thermomechanical processing involved in FDM.
The purpose of this article is to investigate the thermal degradation of PLA, in injection molding and FDM processes, and to optimize the manufacturing parameters for FDM, particularly taking into consideration the printing order, with a view to improving the mechanical properties of the 3D-printed parts.
Materials and Methods
Materials
The PLA filament used in this work for FDM and injection molding processes is a commercial PLA provided by Esun with a diameter of 3 mm and of gray color. The filament was partially pelletized for injection molding.
Thermal behavior
Thermogravimetric analysis (TGA) was performed using a PerkinElmer TGA 4000, at a heating rate of 10°C/min under N2 atmosphere from 30°C to 600°C.
The calorimetric analysis was carried out on samples using a differential scanning calorimetry (Mettler DSC-822), calibrated with high-purity standards. A mass ranging between 10 and 18 mg was used for analysis. The measurement was performed under inert atmosphere (N2 flow), at a heating rate of 10°C/min in the temperature range from 25°C to 190°C. The samples were heated to 190°C and the glass transition temperature (Tg), cold crystallization, melting temperature, and melting enthalpy (ΔHcc and ΔHm) were measured. The degree of crystallinity (χc) was determined from the heating scan. The crystalline phase amount can be estimated by dividing the measured melting enthalpy by the enthalpy of theoretical 100% crystalline PLA:
Since the ΔHm is usually related to the whole polymer mass, in the case of PLA filament with gray colorant in which the weight fraction of PLA in a sample is equal to w, the previous equation is modified to the following:
In this work, χc was determined by subtracting ΔHcc from ΔHm and by considering a melting enthalpy of 93 J/g for 100% crystalline PLA. 46
Sample preparation for tensile test
To perform a comparison between FDM and injection molding, two sets of samples were prepared.
Injection molding
The tensile test specimens were produced using a Ray-Ran Test Sample Injection Molding Press (RR/TSMA). The apparatus is pneumatically operated with inlet air pressures up to 10 bar (150 psi), which is adequate for molding most materials. The tool inserts comply with international standards.
In this work, PLA samples prepared by injection molding were abbreviated to Inj-PLA.
FDM (3D printing)
FDM samples were produced using an Ultimaker 2 3D printing machine. The influence of the raster angle (the direction of raster with respect to the loading stress direction), build orientation (horizontal or vertical), and printing order on the mechanical properties of PLA were investigated.
Default FDM parts in Ultimaker 2 were made with a crisscross raster in which the orientation of the beads alternated from +45° to −45° from layer to layer. As the FDM software defaults to this raster, this orientation could be considered a [0°/90°] orientation if the part were rotated through 45°.
Figure 1a shows the raster orientation and printing mode for different types of samples with their abbreviations.
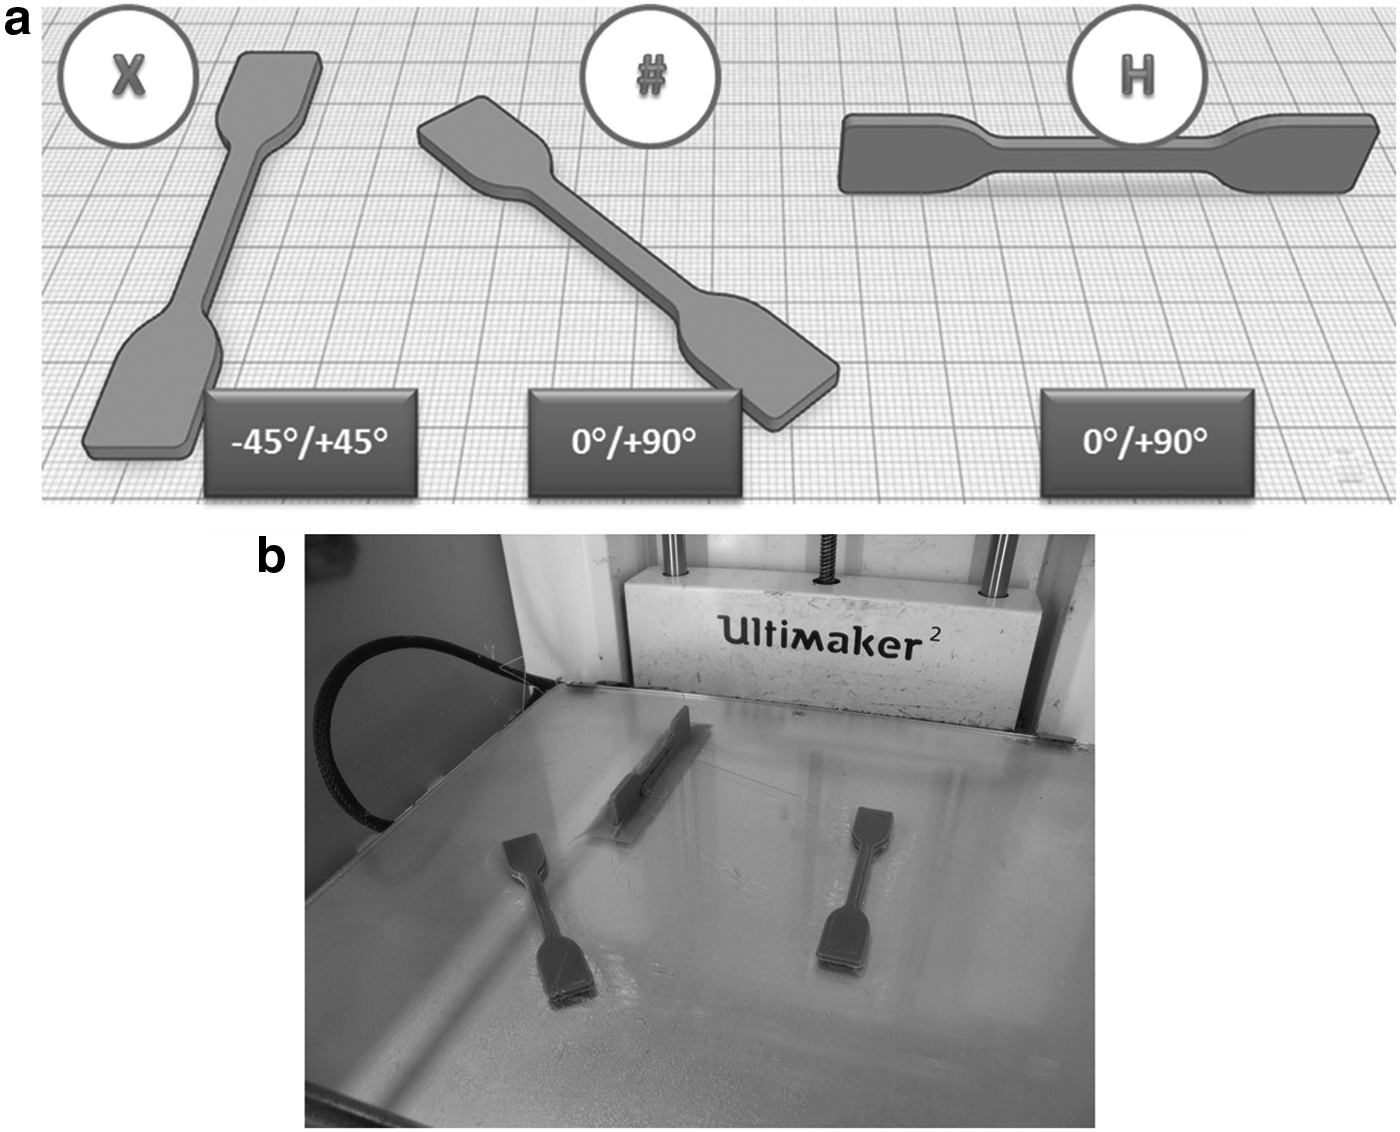
As schematically represented in Figure 1a, dumbbell specimens were built up along three different orientations. X samples were constructed horizontally with a raster orientation of 45°/+45°, # samples were built horizontally with a raster orientation of 0°/+90°, and H samples were manufactured vertically with a raster orientation of 0°/+90°.
Five specimens for each type were built with two different printing orders; the first set of samples was produced simultaneously (15 samples in this study), which means that the printing of the second layer for any sample did not occur until the first layer had been printed for all 15 samples. By contrast, the second set of samples was manufactured on a one-by-one basis.
The PLA filament is denoted in this work F-PLA; the 3D-printed samples from F-PLA are denoted, depending on raster orientation and the printing mode, as follows: X-PLA, #-PLA, and H-PLA for the samples printed simultaneously. X0-PLA, #0-PLA, and H0-PLA for the samples printed individually.
The samples (Fig. 1b) were printed according to the parameters given in Table 1.
Fused Deposition Modeling Parameters
Rheological measurements
An ARES Rheometric Scientific rotational rheometer manufactured by TA instruments, working in oscillatory shear mode, was used for shear dynamic measurements. Parallel plate geometry with a diameter of 8 mm was used for frequency sweeps. The range of frequency sweeps was from 0.1 to 100 rad/s. In all cases, strain amplitude values were verified to ensure that all measurements were conducted within the linear viscoelastic region. The shear dynamic measurements were carried out at a constant temperature of 190°C and a gap height of 1 mm. From the data, the storage modulus (G′), loss modulus (G″), and complex shear viscosity were calculated as a function of the frequencies. The complex dynamic modulus (G*) was determined using complex notation:
where G′ describes the elastic behavior and G″ represents the viscous dissipation in the sample. Their ratio (tanδ = G″(ω)/G′ (ω)) describes the balance between the viscous (loss) and elastic (storage) components in a polymer melt.
Newtonian zero shear viscosity η0 can be determined from the complex viscosity η*(ω):
The curve representing the real component of the complex viscosity (η′ = G″/ω) versus the imaginary component (η″ = G′/ω) is described by the Cole–Cole plot47–49
; the convex downward semicircle profile at the intercept η″, which tends to 0 and corresponds to zero-shear viscosity η0 at ω = 0, which depends on the molecular weight (MW), obeying a power law
50
:
Tensile tests
The tensile properties were evaluated according to ASTM D63, using a Lloyd EZ50 mechanical test machine at a crosshead speed of 10 mm/min. Specimen dimensions were 25 mm length, 4 mm width, and 2 mm thickness. Tests were carried out at room temperature; at least five specimens were tested for each sample, and the results were averaged to obtain a mean value.
Results and Discussions
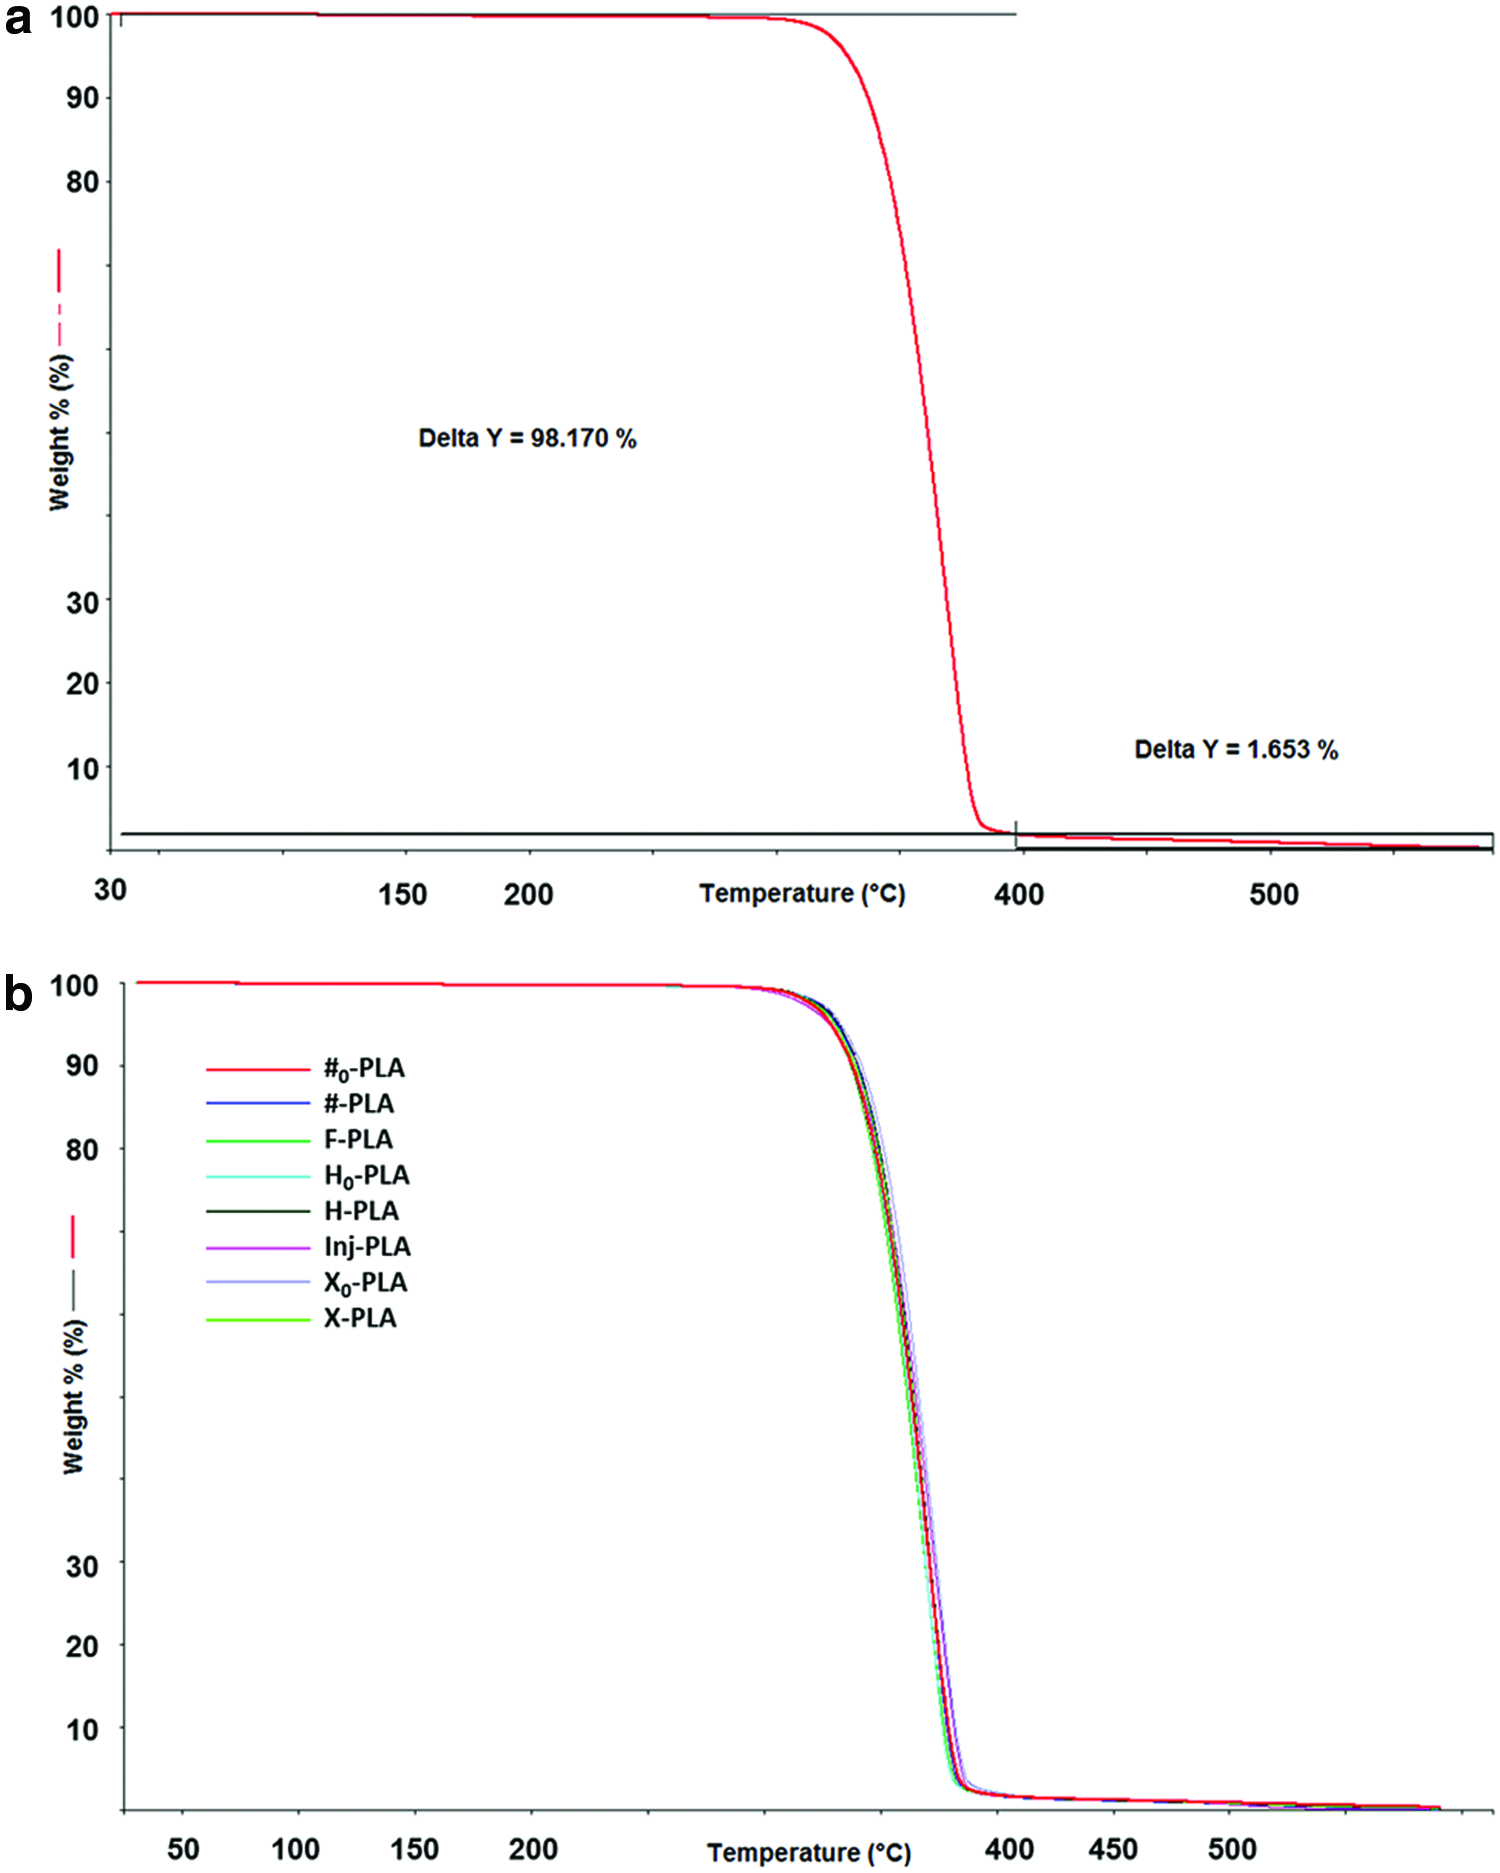
Initial characterization of PLA filament (F-PLA) was carried out by means of TGA. The TGA weight loss curve for the F-PLA filament is presented in Figure 2a as a function of temperature under N2 atmosphere. As can be seen, the decomposition of PLA started at 300°C; at 400°C the mass loss of PLA was around 98%. A second stage of mass loss, around 2%, was observed between 420°C and 490°C, which can be attributed to the gray organic colorant inside the PLA filament.
TGA curves for
Thermal degradation of the samples manufactured by FDM and by injection molding evinces practically the same values for decomposition rates and temperature, indicating that the manufacturing process does not seem to affect the thermal stability of PLA (Fig. 2b).
Rheological tests were carried out to evaluate the effect of the sample preparation process on the viscoelastic properties of PLA.
The preparation process may induce thermomechanical degradation, characteristic of melt processing, which involves competition of chain scissions and recombination reactions occurring through degradation. The linear viscoelastic properties in dynamic experiments are sensitive both to chain scission and to 3D network formation. Melt rheology therefore provides a convenient tool to assess processes accompanying thermomechanical degradation.51,52
Figure 3 shows the evolution of tan (δ) for F-PLA, Inj-PLA, and the specimens built up by FDM with different orientations and different printing orders as mentioned before, with a frequency sweep at 190°C. As observed, the tan (δ) curves for the samples were prepared by 3D printing overlap, and there is almost no modification with respect to F-PLA. Only a slight increase was observed for low frequencies. On the contrary, a significant modification of the curve profile for the injected sample was observed; tan (δ) increases significantly, indicating higher mobility for the macromolecular chains due to the thermomechanical degradation of PLA. Such behavior is in agreement with the chain scission mechanism. 53 As the solid elastic behavior decreases significantly, the sensitivity range of the rheometer was achieved, leading to instability of tan (δ) values in the range of low frequencies.

Tan δ curves for F-PLA, X-PLA, #-PLA, H-PLA, X0-PLA, #0-PLA, H0-PLA, and Inj-PLA at 190°C. Color images available online at www.liebertpub.com/3dp
The variation in complex viscosity η* for all samples is shown in Figure 4. A considerable decrease in complex viscosity was observed for Inj-PLA compared with F-PLA, indicating that the mass average molecular weight of the Inj-PLA sample had decreased, while the samples prepared by FDM did not show any significant variation compared with F-PLA, and complex viscosity curves for X-PLA, #-PLA, H-PLA, X0-PLA, #0-PLA, and H0-PLA almost overlap with F-PLA. Therefore, the chain scission mechanism occurs during the injection molding of PLA samples at 210°C.
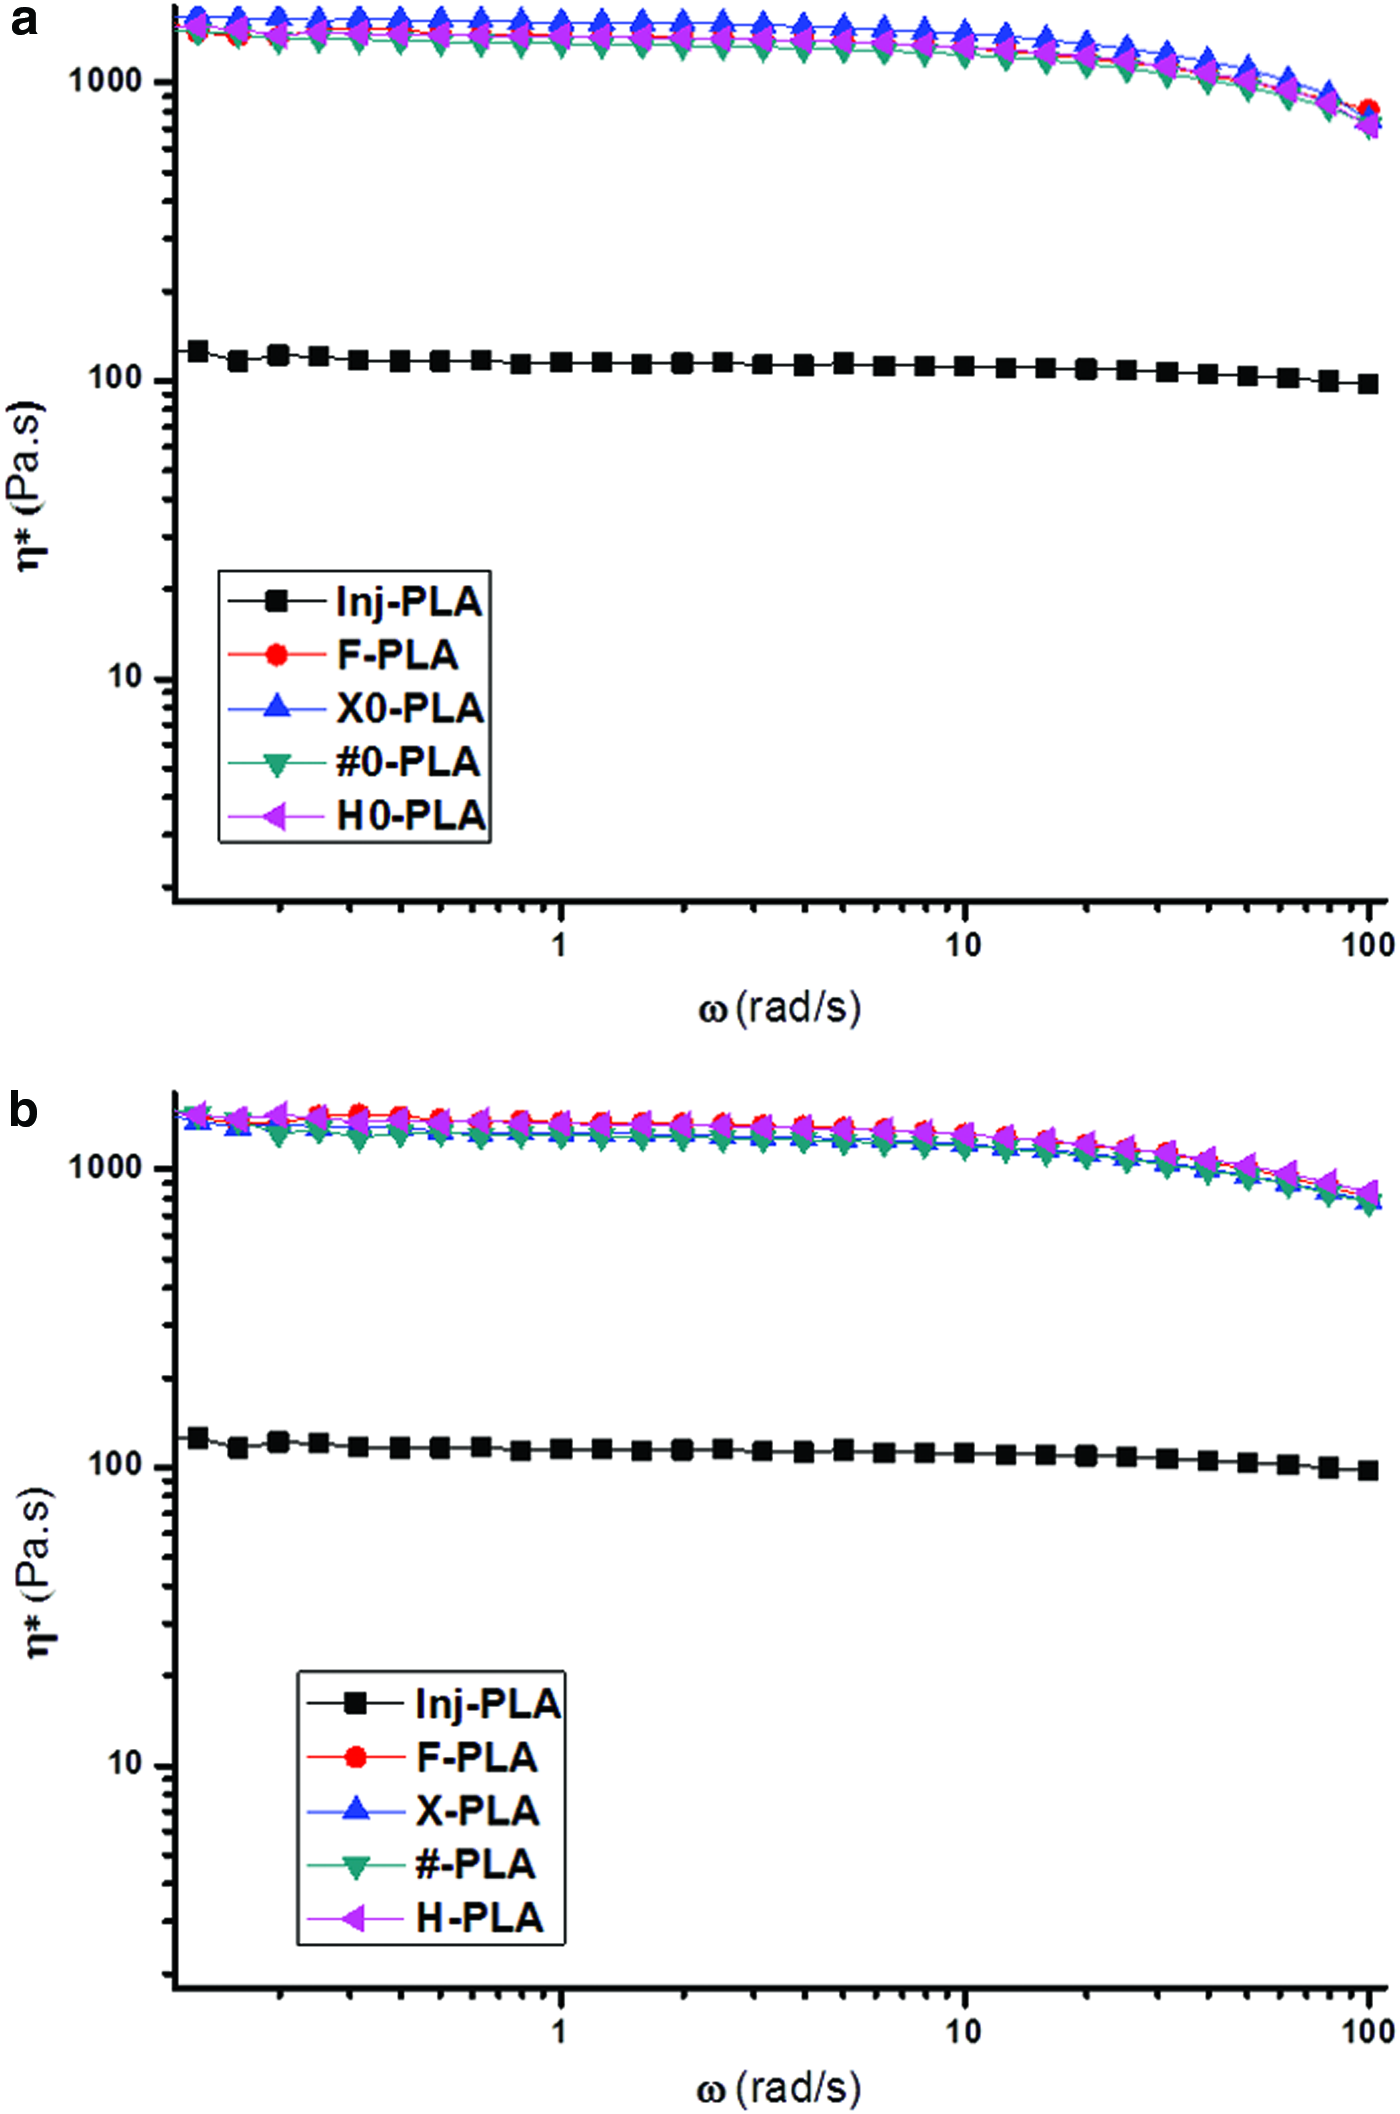
Complex viscosity η* curves for
To verify the reproducibility of the rheological results, several analyses on the same kind of samples were carried out. There was perfect coherence in the results obtained for FDM samples (results not shown), while the samples produced by injection molding displayed different behaviors. Figure 5 shows the Cole–Cole plots (η″ versus η′) of Inj-PLA for three different samples in comparison with F-PLA. As can be seen, the three samples display different values of zero shear viscosity, indicating that the residence time of the PLA in the injection nozzle at 210°C has a major effect on its thermal degradation. In all cases, the zero shear viscosity (η0) decreases with respect to F-PLA, due to thermomechanical degradation through the chain scission mechanism. 54
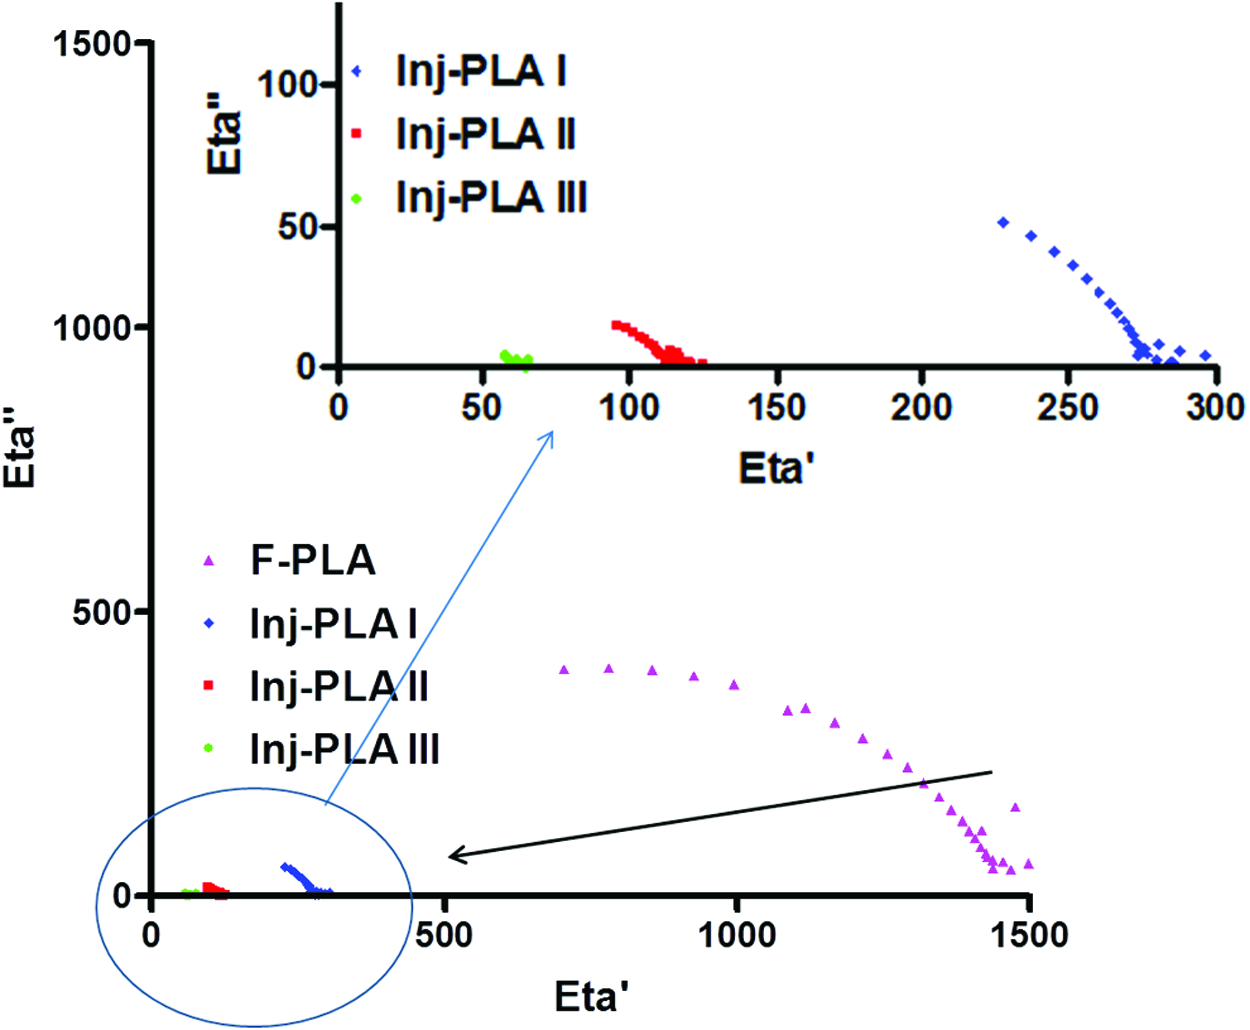
Cole–Cole plots for three different samples of Inj-PLA compared with F-PLA. The viscoelastic properties were measured at 190°C. Color images available online at www.liebertpub.com/3dp
PLA samples prepared by FDM are not affected by the temperature, as the residence time inside the nozzle is short enough to avoid thermal degradation, while samples prepared by injection molding are extremely influenced by the process and suffer heterogeneous thermomechanical degradation.
Regarding differential scanning calorimetry analysis, the evaluated parameters are summarized in Table 2. All samples are characterized by exothermic cold crystallization, indicating a low crystalline starting structure. The glass transition temperature (
Thermal Properties of Different Polylactic Acid samples
Finally, the mechanical properties of the samples built by FDM and by injection molding were characterized. Before performing the mechanical tests, each sample was weighed and the results were averaged to a mean value. There were three different weight values; the specimens produced by injection molding demonstrated a higher weight compared with specimens made by FDM (1.5 g). The FDM specimens printed simultaneously demonstrated the lowest weight value (1.41 and 1.38 g) and the FDM specimens printed individually demonstrated a moderate weight value (1.44 and 1.42 g). This difference in weight between 3D specimens may be explained by intermolecular diffusion at the interface of filament layers. The temperature history of the filament is a critical parameter influencing part strength. This temperature history depends on the rate at which the filament cools on leaving the extrusion head. Therefore, it is expected that the printing order (simultaneous or individual) would have an important effect on the cooling rate between layers. This, in turn, should affect the bond strength between adjacent filaments. When 3D parts are being built simultaneously (15 specimens), after deposing the first layer for the 15 specimens and during the deposition of the second layer, the first layer can be totally solidified, resulting in insufficient bond strength between filaments due to the excessive air gap between layers. When 3D parts are being built individually, the cooling rate is different, and solidification is not attained for a deposited layer before the next layer is deposited. Molecular diffusion at the interface between filaments is greater and the risk of microvoids between layers is lower. The different sample weights observed may be due to the rate of coalescence occurring between layers.
Since the weight of the specimens varied, the mechanical properties should also be impacted. Table 3 shows the tensile modulus, the stress, and elongation at break for both injection-molded and FDM samples in the various conditions under consideration. Inj-PLA was subjected to chain scission degradation, which detracts from its mechanical properties. It can be noted that injection-molded samples have highest tensile modulus (1580 MPa), with a large standard deviation (±130) because of the heterogeneous thermal degradation between the different samples. Simultaneously printed samples reach a maximum of 1110 MPa for #-PLA, while a minimum of 984 MPa was recorded for X-PLA. This can be related to the fact that for samples printed at raster angles of 0°/90°, the filaments were oriented parallel to the load direction, producing the strongest samples. In samples printed at −45°/+45°, there was a finite angle between the printed microstructural elements and the load direction. The filaments were thus subjected to both tensile and shear stresses, leading to failure at low tensile strengths. A significant improvement was observed for the samples printed individually. Better results were always obtained for #0-PLA (1506 MPa) than for H0-PLA (1455 MPa) and X0-PLA (1200 MPa). The stress at break follows the same order: #-PLA > H-PLA > X-PLA.
Mechanical Properties of Polylactic Acid Samples
Accordingly, Inj-PLA demonstrates an elongation at break at around 18% with a high standard deviation (±27); 3D-printed samples demonstrate weak elongation at break (between 6% and 9%), due to their inner structure's brittle behavior and therefore lower elongations.
Conclusions
PLA has low thermal stability; during injection molding, the samples were submitted to major thermal degradation, while the samples manufactured by 3D printing did not appear to be affected by thermal degradation due to the short residence time of the filament inside the nozzle. 3D printing order is a very important parameter that affects the properties of manufactured samples; printing samples individually gives better results compared with samples printed simultaneously. In the same time, samples with a raster angle of 0°/90° demonstrated better properties than samples produced with a raster angle of −45°/+45°. Vertically printed samples with a raster angle of 0°/90° demonstrate interesting results, but these samples need a support during manufacturing and then require postprocessing due to the burr generated.
Finally, it is possible to improve the properties of 3D-printed materials by optimizing the raster angle and paying attention to the printing order.
Footnotes
Acknowledgments
The authors thank Clement Weigel and Nicolas Blanchard for their assistance in conducting the 3D printing experiments.
Author Disclosure Statement
No competing financial interests exist.