
Abstract
Abstract
Metal organic framework materials (MOFs) have been primarily recognized for their ability to promote selective storage of gas molecules. In their as-synthesized (powdered) form, MOFs are not easily processed for use in end-devices where their properties might be exploited. Composites have been produced in which either zeolite imidazolate framework-8 (ZIF-8) or HKUST-1 (also known as MOF-199 and Cu-BTC) has been incorporated into acrylonitrile butadiene styrene (ABS). These composites were then 3D printed using a conventional, commercially available 3D printer. Although many MOFs suffer from instability in humid environments, each of the MOFs in our study maintains its structure within the ABS composite even on soaking in water. Moreover, the MOFs maintain their nitrogen adsorption capacities within the composites. The retention of MOF gas adsorption properties within the composite is promising in that these materials can be optimized (MOF, polymer, and 3D-printed geometry) for a number of applications, including gas storage, filtering, sensing, and catalysis.
Introduction
3
Our approach to 3D printing is to imbue active chemical reactivity and functionality within the 3D-printed material. That is, whereas most 3D-printed objects are, necessarily, inert, we aim to 3D print materials that play an active role in supporting and facilitating chemical processes. 11 We have focused on incorporating inorganic nanoparticles within standard 3D printing thermoplastics. 11 One of our goals is to create 3D printing filaments that can be used in standard, commercial thermoplastic printers that typically use either acrylonitrile butadiene styrene (ABS) or polylactic acid (PLA). In our first trial of this approach, we incorporated nanoparticulate TiO2 into ABS. 11 We found that the TiO2 retained its ability to photocatalyze the degradation of organic compounds while in the 3D-printed composite.
We have translated these techniques to the incorporation of metal organic framework materials (MOFs) into 3D-printed polymers. MOFs have a repeating 3D structure whose coordination-driven arrangement of metal ions and ligating organic molecules leads to the formation of repeated vacancies within the bulk material.12–14 Development of novel methods that enable the use of these geometries for gas storage (within the MOF vacancies) and chemical catalysis (at the structured metal sites) is an active area of research.12–15 The great potential of MOFs, however, is somewhat tempered by their lack of immediate processability. During synthesis, MOF particles precipitate as fine powders that do not easily lend themselves to being incorporated into larger devices or structures where they might be better utilized.
We have melt-blended MOFs within ABS, creating a filament for 3D printing and printing different geometries using a commercially available 3D printer (Fig. 1). We used two MOFs for this study, HKUST-1 and zeolite imidazolate framework-8 (ZIF-8). We tested several physical properties of the composite materials as well as the stability of the MOFs within the composite when exposed to water. We also tested the nitrogen adsorption properties of our composite materials by measuring isotherms at 77 K and adsorption/desorption kinetics at room temperature. In total, the 3D-printed ABS-MOF composites that we have produced show that the material blends the most attractive qualities of each component, processability and selective gas adsorption. Our approach opens the door for further optimization to match the needs of emerging applications, including gas storage, gas filtration, and real-time chemical sensing.

3D printed MOF-ABS composites. The image on the left shows the designed print geometry and dimensions. The image in the middle shows the full printed ABS-ZIF-8 composite (top) and magnified (bottom). The image on the right shows the full printed ABS-HKUST-1 composite (top) and magnified (bottom). ABS, acrylonitrile butadiene styrene; ZIF-8, zeolite imidazolate framework-8.
Materials and Methods
1,3,5-Benzenetricarboxylic acid was purchased from TCI. Cupric acetate was purchased from Mallinckrodt. 16 Zinc acetate was purchased from J.T. Baker. 2-methylimidazole and chloroform (HPLC grade, 99.8%) were purchased from Acros Organics. N,N-dimethylformamide (DMF) and triethylamine (TEA) were purchased from EMD Milipore. Ethanol 200 proof (EtOH) was purchased from KOPTEC. Dichloromethane was purchased from EMD Millipore. ABS pellets (resin: GPA 100, color No.: NC010; color: natural; Lot No.: C14-0702 K) were acquired from LTL Color Compounders, Inc.
HKUST-1 and ZIF-8 synthesis
HKUST-1 was prepared using a modified literature protocol in which the solid was collected and washed in centrifugation steps rather than through filtration. 17 ZIF-8 was prepared according to literature procedure. 18
ABS-10% MOF filament production
The initial material compounding was performed using a DSM Xplore Micro 15cc Twin Screw Compounder. The compounding temperature was set to 195°C and the screws turned at 80 revolutions per minute. The system was purged with N2 throughout the compounding process. The composite materials were made in 12 g batches.
To produce a composite filament with a proper diameter for the 3D printer, the compounded composites were first cut into smaller pieces and extruded through a Filabot Wee extruder set to 195°C with a 1.75 mm extrusion nozzle.
Scanning electron microscope and energy dispersive X-ray spectroscopy
Sample images and energy dispersive X-ray spectroscopy (EDS) analysis of the ABS-MOF composite materials were acquired with an FEI Helios NanoLab 660 Dual Beam Scanning Electron Microscope (SEM). EDS was used to evaluate the presence and location of carbon, zinc, and copper in the samples.
Powder X-ray diffraction
X-ray diffraction (XRD) patterns were recorded using a Rigaku MiniFlex II Desktop X-ray diffractometer equipped with an NaI scintillation counter detector, a 450 W Cu K α (λ = 1.540562 Å) X-ray source, and a diffracted beam monochromator. The instrument was operated at 30 kV and 15 mA with a scan speed of 5 s/step and a step size of 0.02°. Discs of the ABS-MOF composite materials were prepared using a Carver hydraulic press. The press was heated to 195°C. 1.05 g of the composite was placed in a 2 mm thick, 23 mm diameter circular stainless steel mold. The filled mold, between two pieces of Kapton film, was placed into the press and the press was engaged with a force of 5 Gg (1 Gg = 1000 metric tons). The disc was left under pressure for 30 min after which the heating element was turned off and water-cooled. To test the stability of the MOF within the composite left open to atmosphere, several XRD measurements were taken between 1 and 28 days after compounding. In addition, the samples were also submerged in water for 1 week after which they were dried and XRD spectra were recorded.
Fourier transform infrared spectroscopy
Fourier transform infrared (FTIR) spectra were recorded using a Bruker ALPHA FTIR with a diamond head platinum ATR accessory. FTIR spectra were collected as transmission spectra as an average of 24 scans at a resolution of 4 cm−1. ABS-MOF samples were prepared for FTIR spectroscopy using the hydraulic press. A small sample of ABS-MOF was placed between two pieces of Kapton film (no molds were used) and pressed using the same protocol as above. These samples were removed from the Kapton and resulted in films that were roughly 0.1 mm thick.
Differential scanning calorimetry
Differential scanning calorimetry (DSC) measurements were performed using a TA DSC Q2000 differential scanning calorimeter. Heat flow was recorded over the following temperature cycling. The sample was equilibrated at 20.0°C for 2 min followed by a temperature increase to 245.0°C at a rate of 10.0°C/min. The temperature was lowered to 20.0°C at a rate of 10.0°C/min. This procedure was repeated two extra times for each sample. Samples were prepared by weighing roughly 3 mg into a T-zero aluminum pan (TA Instruments) with no lid.
Thermogravimetric analysis
Thermogravimetric analysis (TGA) measurements were performed using a TA Q500 thermal analysis system with the sample (roughly 5 mg) held in a platinum pan. Samples were recorded in a nitrogen atmosphere. For the measurements, the temperature was increased to 110.0°C at 10.0°C/min on which the temperature was held for 30 min. The temperature was then increased to 800.0°C at 10.0°C/min.
3D printing
A FlashForge Creator 3D printer was used to print objects. The printing platform was covered with Kapton film. A 15% (w/v) slurry of ABS suspended in acetone was poured onto this surface, and the acetone was allowed to evaporate during the preheating process. The open faces of the printer were covered with plexiglass (sides), while the top was capped with a box to help maintain a constant internal temperature. With no filament loaded, a 30-min preheat period (platform temperature = 115°C, nozzle temperature = 220°C) was performed to minimize internal temperature gradients.
The printed geometries (Fig. 1) were designed using OpenSCAD software. The program used to generate the geometry is given in the Supplementary Data (Supplementary Data are available online at www.liebertpub.com/3dp). The print speed used was 10 mm/s in the x, y, and z directions.
To keep the printer extrusion head as clean as possible, we have found it is best to remove the filament after each print job and floss the extruder opening with piano wire. Failure to do this results in accumulation of inorganic material within the extruder over time and eventual blockage.
Gas adsorption: isotherm at 77 K
Isotherm measurements were performed on a Micrometrics ASAP 2020 Plus accelerated surface area and porosimetry system. Data analysis was performed using Micromeritics Microactive interactive data reduction software. Analyses were performed at 77 K using N2 (99.999%). Before all adsorption experiments, the samples were degassed for 16 h under vacuum (1.33 Pa) and at a temperature of 353 K. Sample masses used for these measurements were around 200 mg. Powder samples were used as synthesized. We found that the printed pieces were too thick to allow full gas uptake on the time scales allowed by the instrument parameters. Therefore, polymer and composite samples were prepared as films in the same manner as in the preparation of FTIR samples.
Gas adsorption and desorption kinetics at room temperature
All measurements for gas adsorption and desorption were recorded using a previously reported, custom-built apparatus, as described in the Supplementary Data. For comparison, the authors previously determined gas adsorption kinetics for 3D-printed pure ABS. 19
Adsorption measurements were carried out as follows. The sample was placed in the sample chamber and degassed by heating to 373 K for 5 days under vacuum. The nominal mass for the printed ABS-ZIF-8 composite (Fig. 1) was 1.1349 g. The nominal mass for the printed ABS-HKUST-1 composite (Fig. 1) was 1.1080 g. The sample chamber and reference chamber were initially filled to the same N2 pressure (roughly 62 kPa). The two chambers were isolated from one another by closing the valve between them, and the pressure difference between these chambers was measured using a differential capacitance diaphragm gauge.
Desorption measurements were carried out using the same apparatus. The sample was placed in the sample chamber and degassed at 373 K for 5 days under vacuum. The sample was loaded with N2 gas at a pressure of roughly 62 kPa for 3 to 5 days. The sample chamber was isolated from the reference chamber by shutting the valve connecting them. While the reference chamber was continuously evacuated, the pressure rise in the sample chamber was measured using a differential capacitance diaphragm gauge.
Results and Discussion
One of the primary challenges to realizing the potential of MOFs is their processability. The powdered forms that most MOFs are synthesized as are difficult to work with. To address these issues, materials scientists have adopted several approaches that include compressing the MOF powders into pellets, 20 developing methodologies for growing ever larger MOF crystals, 21 and fabrication of MOF films on pristine surfaces using atomic layer deposition techniques.22–24
There has also been a concerted effort to incorporate MOFs into polymers.25–27 These composite materials include examples where an MOF is incorporated into a polymer,28,29 coupled synthesis of polymer and MOF, 30 MOF is synthesized using polymeric materials,31,32 and MOFs being grown off of existing polymeric structures. 33
We modeled our approach for generating ABS-MOF composites on the industrial practice of melt-blend compounding. In this way, the composites we describe can be manufactured on a much larger scale to meet any need for these high-performance materials. We chose ABS as it has been easier than PLA to compound and form into properly sized filaments for printing.
We have produced ABS-MOF composites that are printable using standard, commercial, thermoplastic 3D printers. Because of the modular nature of our approach, we should be able to optimize our system (polymer, MOF, and printed geometry) as required for different applications.
Different sample preparation procedures were used for the analyses in this study. All composite samples were printed; each composite sample for analysis underwent the same compounding, extrusion, and printing steps. However, some samples required further processing to facilitate analysis. The FTIR, XRD, and low-temperature gas adsorption measurements were performed on samples that had been printed and then compacted in a hydraulic press. For the low-temperature gas measurements, specifically, pressed samples allowed for gas diffusion on a reasonable timescale. The room temperature gas adsorption and desorption measurements were performed on samples with the geometries shown in Figure 1.
Structural properties of ABS-MOF composites
Figure 2 shows SEM images with EDS mapping of Cu, Zn, and C for the ABS-MOF composite materials. The crystalline MOF particles are seen within the amorphous polymer for each composite. The Zn and Cu maps overlay with these crystals for ZIF-8 and HKUST-1.
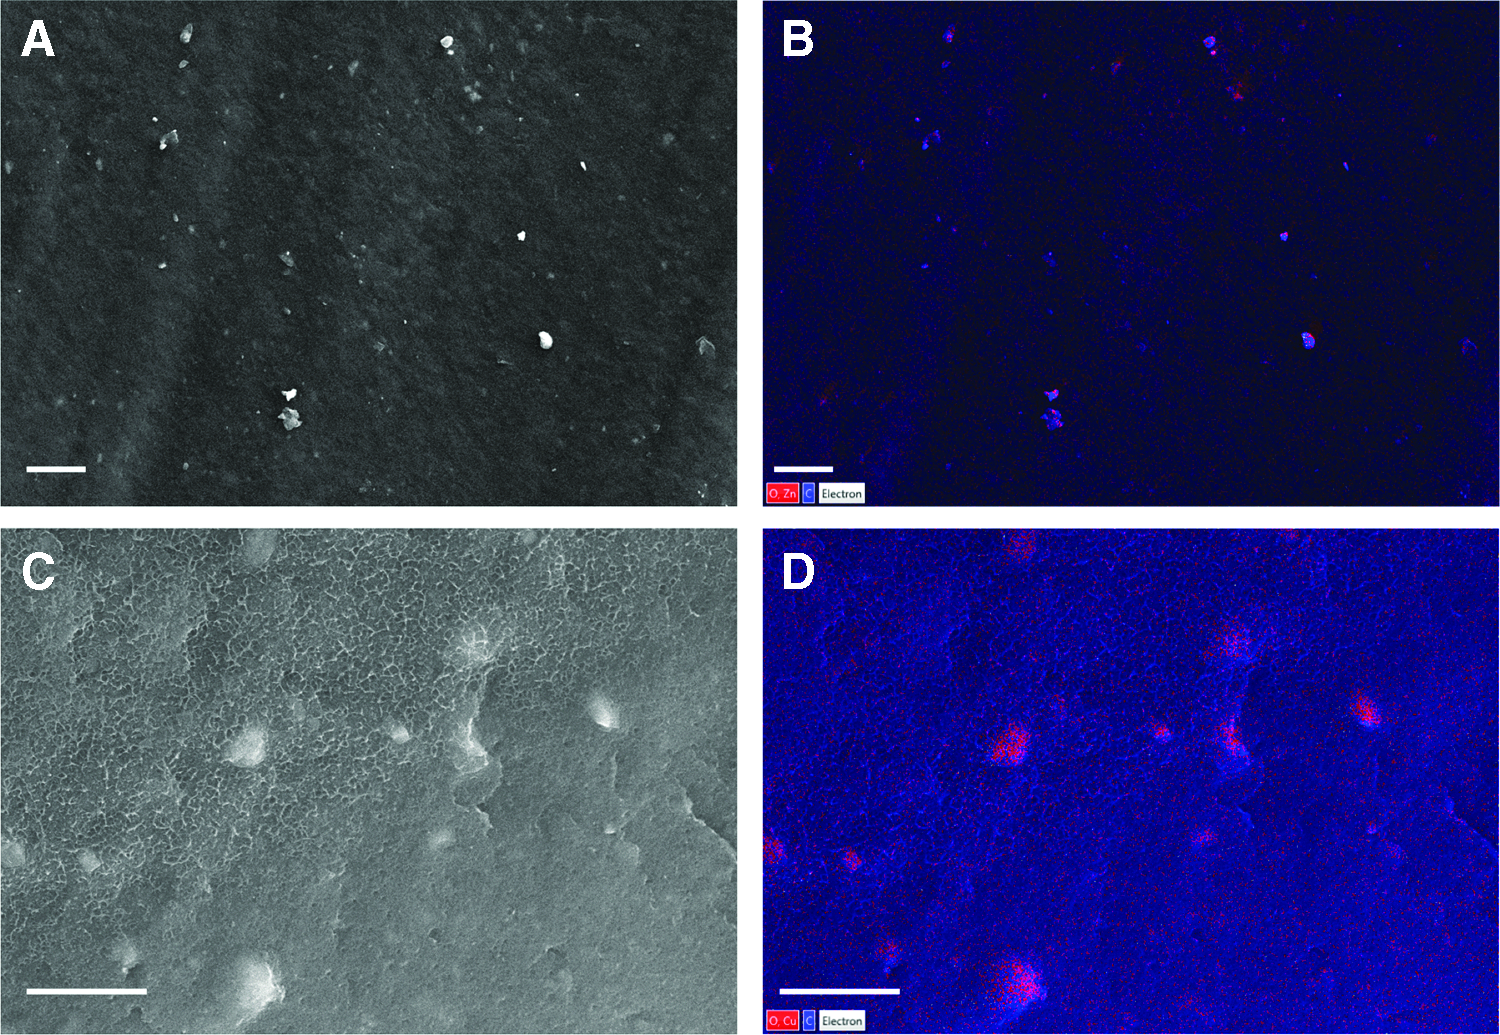
SEM images with EDS maps for ABS-MOF composites.
We tested for several structural and physical properties of our ABS-MOF composites. Figure 3 shows the powder XRD scattering patterns for each of the MOFs, ABS, and the ABS-MOF composites when exposed to humid environments. Of particular note, in this regard, are the samples that were immersed in water for 7 days. For each recorded sample, the scattering pattern and intensities reflect the composition: ABS shows a broad scattering that ranges over the full measurement range and the MOF-specific scattering peaks do not change from the powder to the composite.

X-ray diffraction scattering patterns and FTIR spectra. The top two panels show the X-ray scattering patterns for ZIF-8 and its composites (upper) and for HKUST-1 and its composites (lower) exposed to ambient humidity for 7 and 28 days immersed in water for 7 days. The bottom two panels show the FTIR spectra of the ABS-MOF composite materials and a theoretical prediction for these spectra calculated from a linear combination of 0.9 (ABS spectrum) and 0.1 (MOF spectrum). FTIR, Fourier transform infrared.
Powdered HKUST-1 is prone to degradation in humid environments. A previous study has shown that incorporating this MOF into a polymer can increase its stability to water. 29 We have observed a similar effect in our composites. After exposure for 7 and 28 days, the XRD patterns for these samples are not noticeably altered from the linear combination of the HKUST-1 and ABS patterns. Taking this measurement to an extreme, we immersed the composite samples in water for a week. There is no noticeable change to the scattering pattern of either MOF within ABS.
ZIF-8 is known to undergo phase and morphology changes at high shear pressures.34,35 We do not observe these morphological changes in our printed and pressed samples. We expect that this is on account of our samples experiencing static pressure, as opposed to shear forces. Were these processing steps able to alter the MOF particles, we would expect that the crystallites would decrease in size. These changes would be reflected in the peak widths of the XRD spectra (Fig. 3). The Scherrer relationship states that the diffraction line widths will broaden and the crystallite size decreases. 36 We do not observe any significant peak broadening when comparing the MOF powder spectra to the ABS-MOF composite spectra. The presence of the polymer may also dampen any effect of force on the ZIF-8 crystals in these systems.
The FTIR spectra are shown in Figure 3 (the raw data can be found in the Supplementary Data). Both sets of composite spectra reproduce the features and general intensities expected from a combination of the particular MOF and ABS. This is another indication that the compounding and printing process does not noticeably alter the chemical structure or composition of the polymer or the MOF. In comparing the MOF powder spectra to the composite spectra (Supplementary Fig. S5), it is clear that the powdered MOF adsorbs some atmospheric water (FTIR feature ∼3300 cm−1), while it does not appear that the composite materials do adsorb water. In the 3D-printed MOF composite samples, the relative humidity is much lower than the atmospheric relative humidity. 19 There may also be some water in the MOF crystals within the composite, but the signal from the water may not be detectable as it is a low-intensity feature.
The MOF inserts, however, do have an effect on some of the physical and chemical properties of ABS. TGA measurements (Fig. 4) show that both MOFs change the pyrolysis of ABS in similar ways (the raw data can be found in the Supplementary Data). The ZIF-8 decomposition begins at around 550°C with the sharpest loss in mass occurring at around 625°C. HKUST-1 displays broad loss of mass starting near 200°C with the primary decomposition occurring near 375°C. When in the composite, both MOFs decrease the temperature at which the polymer decomposes. Within the composite, HKUST-1 shows some decomposition near 300°C.
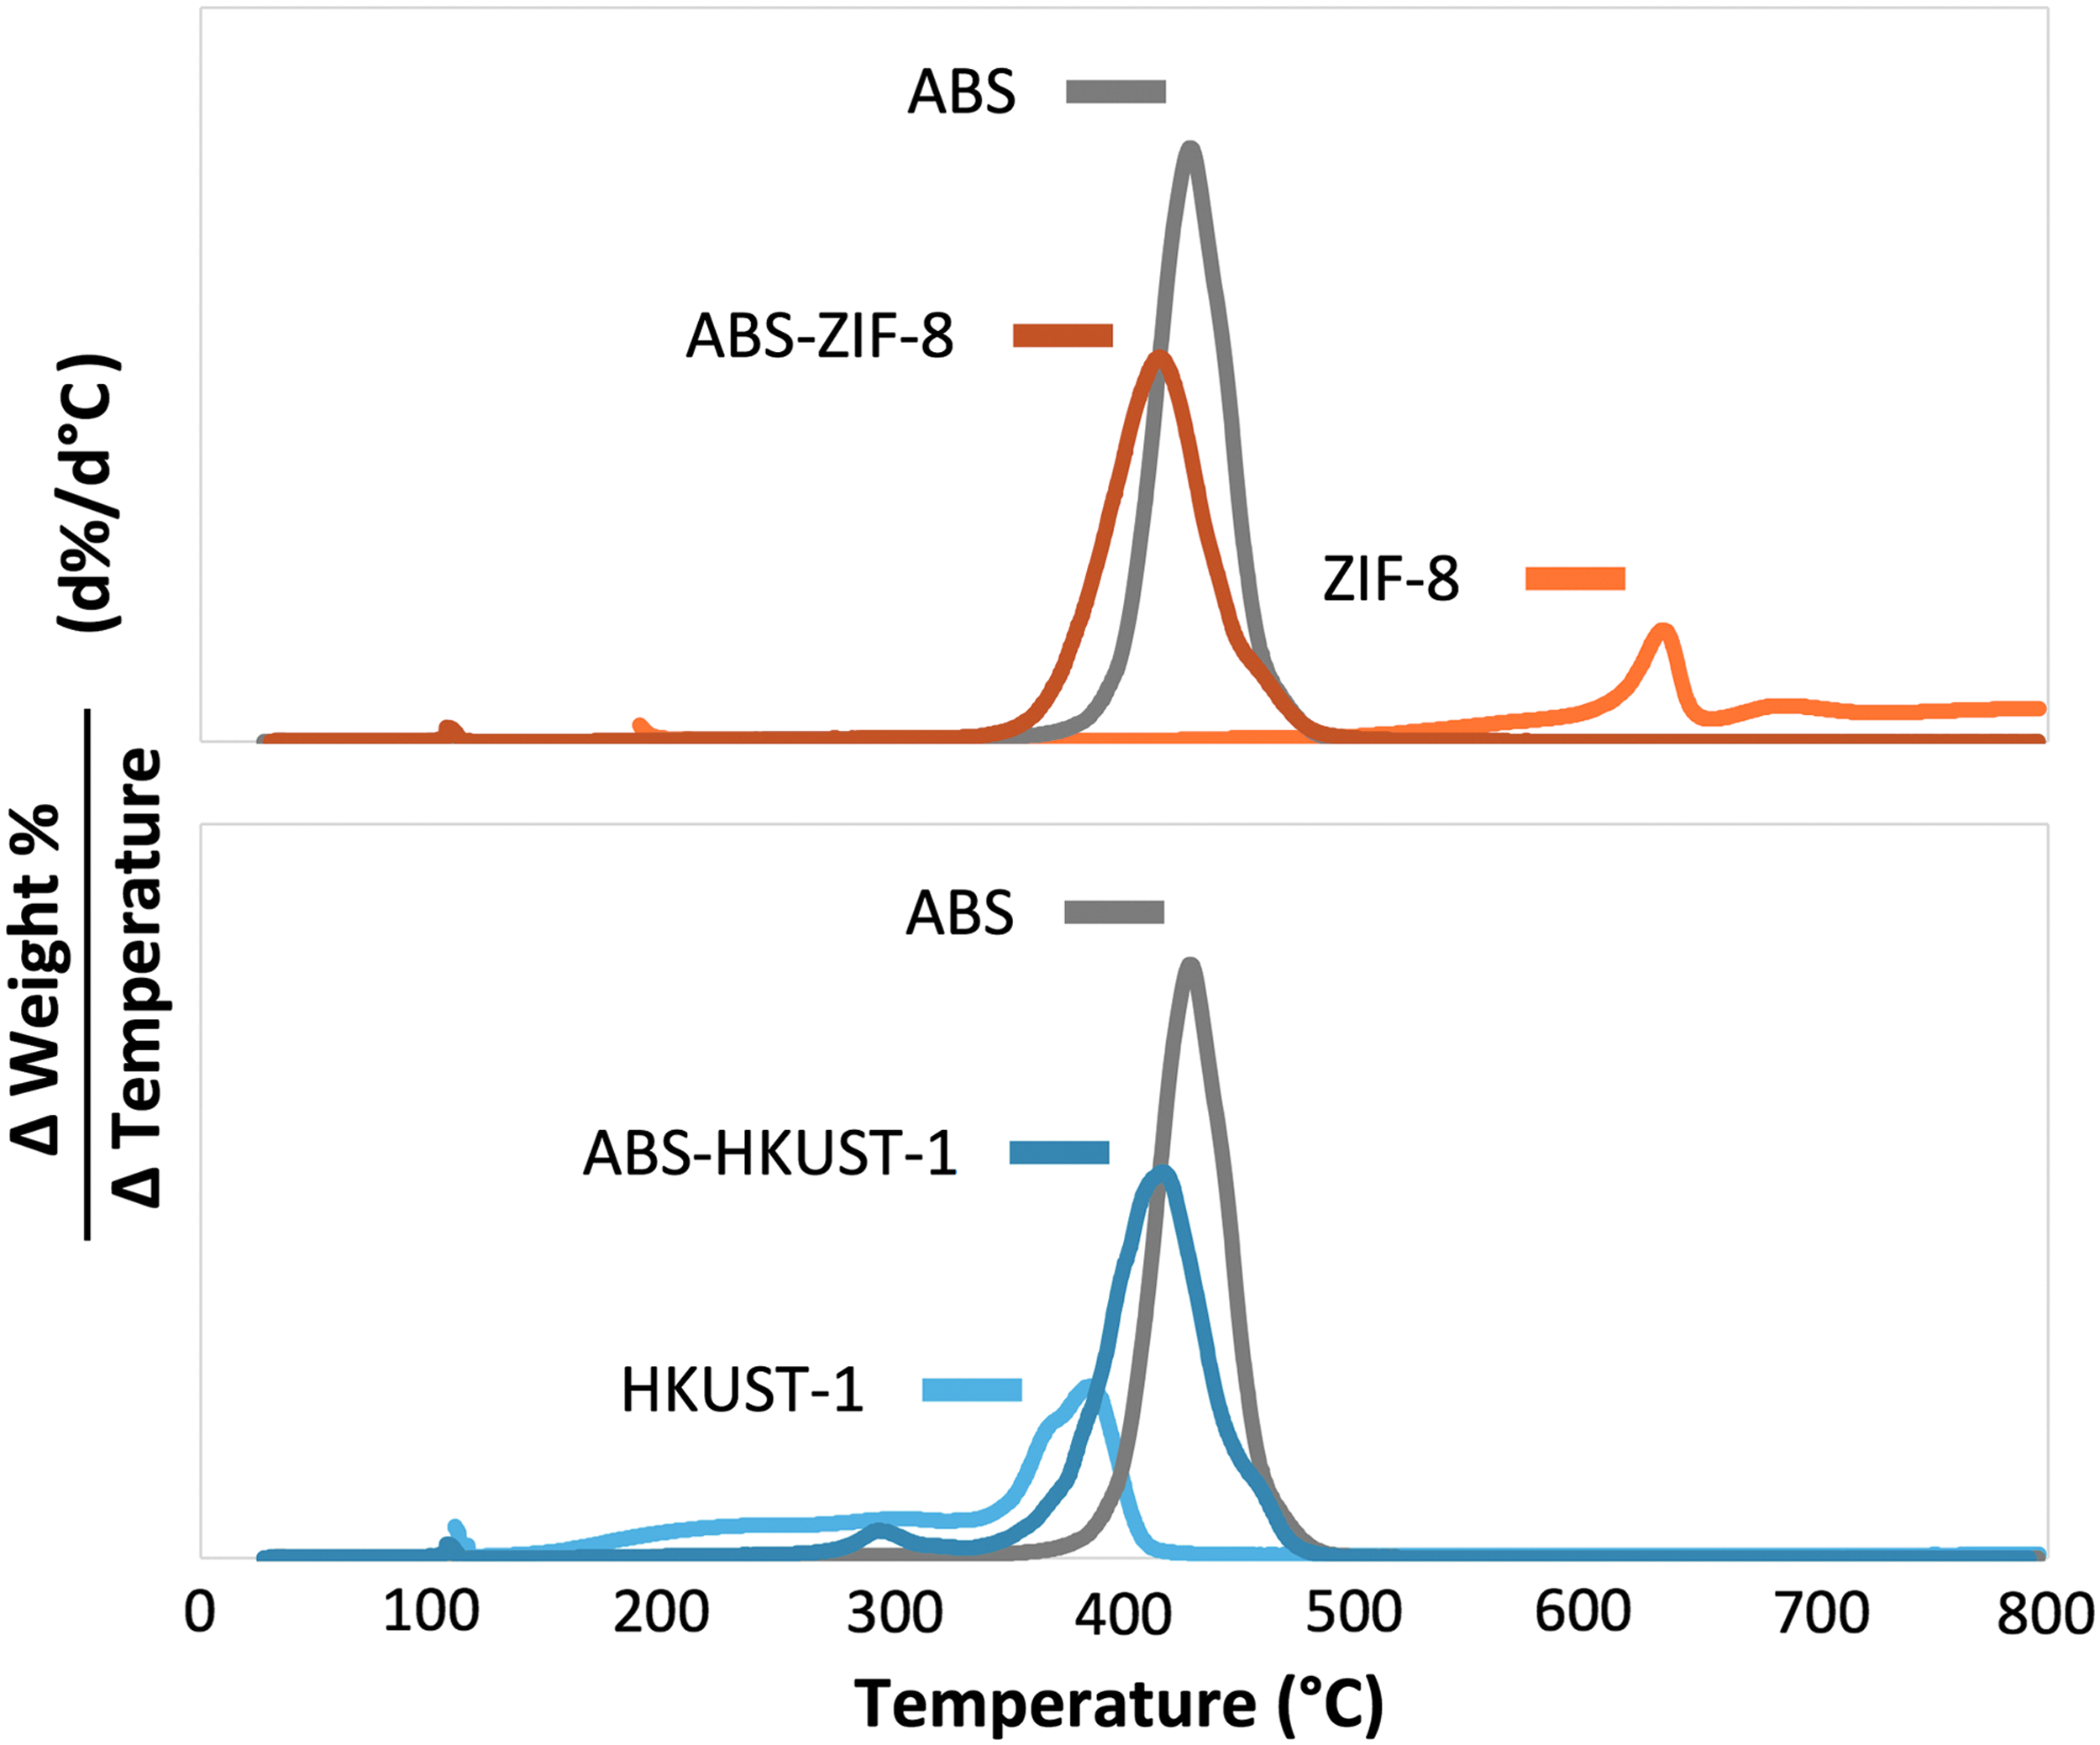
TGA of the ABS-MOF composites. Both graphs show the first derivative of weight percentage as a function of temperature for all materials under an N2 atmosphere. The raw data are shown in the Supplementary Data. The top panel shows the data for ABS, ZIF-8, and the ABS-ZIF-8 composite. The bottom panel shows the data for ABS, HKUST-1, and the ABS-HKUST-1 composite. TGA, thermogravimetric analysis.
Importantly, for our studies, the decompositions observed in the composite materials occur at temperatures well above where the materials are 3D printed (220°C). In processing the materials to make the composites, they are heated to 195°C for 5 min (during melt compounding). When 3D printed, the composites are only exposed to the elevated temperature (220°C) of the print nozzle for a very short period of time (seconds, at most) as the filament is being drawn through the printer head. The TGA data show that the temperatures needed for decomposition exceed the requirements for processing and printing. The XRD (Fig. 3) and FTIR (Fig. 3) do not show any significant evidence of HKUST-1 decomposition. In general, these data agree with the analysis of the TGA results in that there is no observed degradation of the MOF materials during the compounding and printing procedures.
DSC measurements (Table 1—averaged over multiple scans and samples) were also performed to determine how the added MOF affects the properties of the polymer. As expected, the MOFs, on their own, show no thermal transitions within the temperature range studied (20–245°C). The glass transition temperature (Tg) of the ABS-ZIF-8 composite is similar to that of pure ABS. The Tg of the ABS-HKUST-1 shows a significant increase over the same transition for pure ABS. While the absolute increase of Tg will not affect the way in which the composite is printed (at 220°C), the relative increase over the ABS Tg indicates that the individual polymer molecules have stronger interactions with one another. While the polymers themselves, in this case, do not form crystalline structures, HKUST-1 does perturb the polymer structure such that its brittle glassy phase gains stability over its viscous, fluid-like phase. These physical changes have a measured impact on gas adsorption capacity and adsorption and desorption kinetics as shown below.
The uncertainties represent a 67% confidence interval (k = 1).
ABS, acrylonitrile butadiene styrene; ZIF-8, zeolite imidazolate framework-8.
Gas adsorption and adsorption properties of ABS-MOF composites
We measured the 77 K gas adsorption isotherms (Fig. 5) for the MOFs, ABS, and the ABS-MOF composites. The pure MOFs show higher gas adsorption properties than either ABS or the ABS-MOF composites. This is to be expected as the MOFs only make up 10% of the composite material. The ABS-HKUST-1 composite shows a similar adsorption profile to ABS. The ABS-ZIF-8 sample adsorbs significantly more than either of the other two polymer samples.

N2 adsorption isotherms at 77 K. The top panel shows the adsorption data for the pure MOF compounds, ZIF-8 and HKUST-1. The bottom panel shows the adsorption data for ABS and the two composites, ABS-ZIF-8 and ABS-HKUST-1.
Of particular note in the N2-adsorption curves for the ABS materials is the absence of a dramatic increase in N2 adsorbed at low relative pressures. For the pure MOF materials, this rise indicates a microporous structure within the bulk material. We do not observe any microporous structure in the ABS-MOF composites. There are several possibilities for this observation. The microporous structure may be destroyed as a result of the compounding process. This seems unlikely as the X-ray and FTIR data (Figs. 2 and 3) correspond to the presence of HKUST-1 and ZIF-8 after compounding. Another possibility includes the prospect that the ABS blocks entry of the gas and prevents it from accessing the interior of the MOF. It does not appear that blocking occurs for the ABS-ZIF-8 sample at higher pressures, though. A final possibility, and one that we find more convincing, is that the slow diffusion through ABS at these low pressures prevents N2 from accessing all of the microporous states on the timescale of the instrumental measurements. As the pressure increases, there is a larger driving force for the gas to diffuse through the solid, leading to faster access by the gas to the MOF.
We analyzed several adsorption properties (Brunauer–Emmett–Teller [BET] surface area, Horvath–Kawazoe (H-K) maximum pore volume, and quantity adsorbed at P/P0 = 0.92) calculated from these isotherms. These quantities are shown in Table 2. Along with listing the values, we have performed an analysis of the data for the composite material. Specifically, using the data for the pure materials (ABS, ZIF-8, and HKUST-1), we have made estimates of the theoretical predictions for the BET surface area and quantity adsorbed for the composite materials. That is, for example, the ABS-ZIF-8 composite material is composed of 10% ZIF-8 and 90% ABS. The BET surface area and quantity adsorbed for the composite material should be a simple linear combination of 10% of these values for ZIF-8 and 90% of these values for the ABS.
ABS-MOF, acrylonitrile butadiene styrene-metal organic framework materials; BET, Brunauer–Emmett–Teller; H-K, Horvath–Kawazoe.
Several observations can be made from this analysis. The first is that the ABS-ZIF-8 data are clearly reproduced by their representative components (10% ZIF-8 and 90% ABS). This finding corresponds with our analysis that the microporous structure is missing from these isotherms due to slow diffusion times and not from the absence of the porous MOF structure. This is certainly not the case for the ABS-HKUST-1 data, whose adsorption properties are much lower than is theoretically predicted. From our XRD and FTIR studies, we can rule out degradation or loss of HKUST-1 as being the primary cause. The likely cause of lower gas adsorption in ABS-HKUST-1 composite is structural changes in the polymer that impact gas diffusion/adsorption properties of the composite material. This description is consistent with the DSC observations that indicate tighter polymer packing as evidenced by increased Tg (Table 1). We contend that this characterization of the ABS-HKUST-1 system is supported by the room temperature N2 uptake analysis presented below.
The N2 adsorption and desorption kinetics at room temperature (Fig. 6) supports the analysis of a decreased ABS gas binding capacity in the HKUST-1 composite. For these experiments, the adsorption properties of printed pieces (Fig. 1) were measured. For the isotherm data, the printed objects were too thick, presenting too large a barrier to diffusion for the data collection and resulting in gas adsorption capacity values and internal surface area values that were much lower than expected. Using a custom instrument, which measures the pressure differential between two chambers, we measured the N2 adsorption and desorption by the printed ABS-MOF composites. The mass of the printed pieces for ABS-ZIF-8 and ABS-HKUST-1 was within 0.02 g of one another (1.135 and 1.108 g, respectively). The printed ABS-HKUST-1 object adsorbs more N2 than does the ABS-ZIF-8. This result is consistent with crystallographic evidence that there are more specific gas binding sites within HKUST-1 than ZIF-8. 37

N2 adsorption and desorption kinetics of ABS-MOF composites at room temperature. The top panel shows the N2 adsorption of ABS-ZIF-8 and ABS-HKUST-1 as a function of time. The bottom panel shows the N2 desorption of ABS-ZIF-8 and ABS-HKUST-1 as a function of time. The noise in the adsorption data is higher as the background pressure, from which pressure changes are measured, is higher than is the case for the desorption data.
The gas adsorption and desorption rates are given in Table 3. The slower uptake and release of N2 by the ABS-HKUST-1 sample also indicate that diffusion through the composite is more hindered than in ABS-ZIF-8, in agreement with our description of altered polymer packing within the ABS-HKUST-1. For both samples, ABS-HKUST-1 and ABS-ZIF-8, the observation that the uptake is faster than the release indicates that there is some attractive interaction between the composite material and N2. That these rates are different between each composite (HKUST-1 vs. ZIF-8) indicates that this attraction is driven by an interaction between N2 and the MOF as opposed to the N2 and ABS. The possibility remains that the compounding process induces new vacancies within the bulk ABS, and these vacancies are what lead to differences in adsorption. However, we contend that the full data set (material analysis in conjunction with N2 adsorption) argues for the MOF playing an important role in gas uptake in the printed composites.
Conclusions
MOF-based materials have shown great promise for applications in gas storage, sensing, filtering, and catalysis, among others. One of the primary barriers to realizing their full potential has been processability. Using the 3D-printed ABS-MOF composites we have presented here as a framework, some of these issues can begin to be addressed. Certainly there are some shortcomings to our system as well. Some of these shortcomings can be tailored through material optimization based on the specific application the user wants to address. In our system, for example, the diffusion barrier resulting from the ABS matrix would be detrimental for use in a gas filtering scheme. Optimizing the system, through a choice of a different polymer, would help to remedy that. This is not to say that ABS may not be a useful polymer for any application. We can imagine applications where slow release of adsorbed gases is crucial. In addition, these slow release systems may be useful in controlled drug delivery devices. 38 As the number of different polymers being used in conventional thermoplastic printers continues to grow, so does the potential for adjustments to our system. Because of the modularity of 3D printing, we have the ability to alter the polymer, MOF, and printed geometry to suit a desired application.
Another shortcoming that we need to address is the low MOF loading percentage. As yet, we are only realizing 10% MOF within our composite. To maximize the ability of our 3D-printed objects to interact with gas molecules, it would be advantageous to maximize the content of MOF within the polymer. Our efforts to push past the 10% loading barrier have thus far resulted in filaments that are often too brittle to print. We contend that we will be able to push these boundaries by using plasticizers, functionalizing synthesized MOFs, or borrowing the approach of Cohen to synthesize MOFs using polymeric materials.29,31
As with other 3D printing applications, however, the most enabling aspect of the technology is the ability to achieve complex and functional geometries. We expect that the protocols described within this study will empower the use of material geometries for advanced MOF-based applications.
Footnotes
Acknowledgment
We thank Prof. Douglas Fox of American University for the use of his twin-screw compounder and hydraulic press.
Author Disclosure Statement
No competing financial interests exist.
References
Supplementary Material
Please find the following supplemental material available below.
For Open Access articles published under a Creative Commons License, all supplemental material carries the same license as the article it is associated with.
For non-Open Access articles published, all supplemental material carries a non-exclusive license, and permission requests for re-use of supplemental material or any part of supplemental material shall be sent directly to the copyright owner as specified in the copyright notice associated with the article.