
Abstract
Abstract
Additive manufacturing/3D printing (AM/3DP) has become a practical manufacturing modality in fabricating highly-complex/optimized parts, providing a form-free flexibility for the development of high-value/high-performance products. However, significant build-to-build variabilities in geometric tolerances and mechanical strength have often been reported as shortcomings. Currently, AM/3DP lacks a practical in situ/real-time quality monitoring utility. In fused filament fabrication, the quality of production in a uniform build depends on two fundamental parameters: the strength of each thread (an extruded line of filament material, created by the heated nozzle) and the nature/strength of thread-to-thread bonds in (in-plate) horizontal and (out-of-plane) vertical directions. In this study, we present an in situ/real-time monitoring approach, in which, instead of monitoring the actual build, the spectral characteristics of elastic wave propagation in a specially designed artifact having periodic internal structures are monitored. The design of an artifact is based on the geometric complexities of the actual build, and its internal structures amplify certain specified aspects of its AM/3DP process and materials. Furthermore, the artifact is substantially simpler and smaller than the actual build it represents, thus considerably easier to monitor. In this study, the artifact design consists of repeating biperiodic substructures of sparsely located threads. As a model problem, in this study we introduce and report a simple phononic crystal artifact design with varying thread-crossing angles and the effects of thread orientation and placement on the shifts of its pass and stop bands and/or the creation of stop bands. In current proof-of-concept study, an experimental setup and basic artifact designs are described, off-line monitoring data are presented, and the sensitivity of the approach is analyzed.

Introduction
At present, additive manufacturing/3D printing (AM/3DP) production modalities offer an unprecedented flexibility especially for on-site/local manufacturing of complex parts. However, in recent years, significant variability in build strength and quality has been reported and documented. 1 As noted by the National Institute of Standards and Technology (NIST), high-quality parts can be made, but ensuring consistency is difficult. 2 Integrated process controls could limit this type of inconsistencies; however, their effectiveness is often hindered by the lack of necessary process understanding, real-time process data, and robust quality monitoring techniques. Subsequently, current process control is often based on experimentation, operator experience, and heuristics, resulting in limited improvements in product quality. 3 Current approaches also lack in situ/real-time quality inspection capability, 1 which could limit the realization of its full potential in many high-performance product development applications.
In a typical AM/3DP modality, the root causes of fabrication issues are frequently traced to the mechanical/defect states of load-carrying thread-to-thread/layer-to-layer bonds at microscale.1,2 The on-site fabrication advantage of AM/3DP for a complex build is no longer attractive, if/when detailed off-line/postproduction quality inspections are required. Moreover, virtually all existing standard ultrasonic Nondestructive evaluation (NDE) techniques today are often developed for relatively regular geometry waveguides and components (e.g., plates, pipes, and so on); thus, boundaries created in complex AM-made builds (such as irregularly-shaped channels, holes, crevices, and so on) pose serious detection challenges. 4
In in-process AM/3DP monitoring, numerous vision, residual stress determination, and thermographic imaging technologies have been reported. In imaging studies, the typical working assumption is that, although most AM/3DP processes have a tendency to accumulate stresses and suffer from deformations, the nondeformed layers characterized by vision systems can yield sufficient data to assess whether defects of internal geometries are present. 5 While potential effects causing print errors during the build process and acquired images representing such errors are reported and categorized in Ref., 6 to our best knowledge, based solely on the analysis of imaging data, no conclusive method and experimental data have been published in the literature for structural evaluation.
Thermographic imaging is often proposed and utilized for process monitoring due to mainly its ease of use. However, its several limitations have also been reported as follows: (1) emissivity often being different for the metal melt pool, unconsolidated powder, and solidified surface in powder sintering/powder bed fusion processes, so a thermal image composed of all three components could result in deceptive/misleading temperature predictions 7 ; (2) only radiation sensor systems with narrow bandwidth may be used accurately 8 ; and (3) debris from the heat affected zone can block the viewport of a thermal sensor and affect thermal measurements by altering radiation transmission. 9 Residual stress measurements could shed light on the mechanical and defect state of a build as AM/3DP profoundly alters materials involved, but the equipment size and other physical attributes associated with the scanned region often prohibit the adoption of direct methods (e.g., neutron transmission/diffraction and X-ray diffraction).
Few indirect techniques for monitoring mechanical/physical attributes manifesting elastic strains and residual stresses, such as surface distortion 10 and strain gage-based measurements (off-line/in situ), have also been reported. 11 However, these techniques are often inapplicable for many practical applications, as they require sensors to be in direct physical contact with the build surface. Pulse-echo ultrasonic-based methods for monitoring deposition layers in actual build are reported by Refs.12–15 Their main weakness is that they are limited to simple builds as it is prone to suffer the same NDE limitations [e.g., mode conversions at interfaces (pressure to shear and vice versa), multiple reflections (reverberations), and geometric dispersion of propagating ultrasonic waves] imposed by build geometric complexities.
Elaborate off-line noninvasive/nondestructive ultrasonic wave inspection has already been utilized in manufacturing and in-service inspection applications for several decades. 16 The key disadvantage of the off-line monitoring approach is its inability to identify and intervene a defective manufacturing process in a timely manner (preferably, real-time), leading to prolonged production schedules and additional expenses.
Manufacturing an artifact and its postproduction examination offer a composite test for overall quality, since most of the imperfections present in its materials, fusion process(es), and production tool machinery parameters contribute to the errors in a final build. Nevertheless, the end goal of the test artifacts reported in previous works 2 (including NIST) is limited to evaluate the capacity of an AM/3DP tool in generating certain geometric feature complexities and dimensionality. The mechanical strength, integrity, and defect states of an artifact have rarely been taken into consideration. The main shortcoming of this approach is that quantitatively linking a set of predefined postproduction part print errors in geometry to specific machine/process fault sources is generally unavailable. 2
In current work, by utilizing the spectral (dispersive) characteristics of elastic wave propagation in a specially designed phononic crystal artifact (PCA) for assessing the thread-to-thread fusion quality, we describe and demonstrate a characterization mechanism that could be utilized in the development of an in-process ultrasonic monitoring approach.
Fused filament fabrication (FFF) is chosen for its simplicity, even though the proposed approach is generic and is thus applicable to other AM/3DP modalities, feedstock materials, and processes. In current context, the critical utilities of the PCA approach include: (1) a PCA is designed to mimic key geometric/mechanical and process complexities of a build while it is substantially simpler and smaller than the actual build geometry; (2) during production, a PCA could be printed periodically for ensuring the quality of the build and/or the state of its production tool over an operator-defined time interval; and (3) the effects of the thread orientation on the ultrasonic propagation properties in a layered build can be detected and utilized as the fusing quality indicator for the build.
Quality Issues in AM/3DP and Proposed Approach
Currently, quality in AM/3DP is a serious practical concern. Similar to other AM/3DP processes, the main shortcomings of FFF are often listed as follows: (1) the creation of rough surfaces; (2) compromised fusion quality and strength and layer delamination risks; (3) limitation in available material choices; (4) low print speeds; (5) significant residual stresses and resulting geometric inaccuracies; (6) inadequate dimensional tolerances and build warpage; (7) macro-/microscale internal material defects and uncontrolled porosity distributions; and (8) low process/production repeatability. 17 Many of these factors can be improved by an in-process monitoring system with closed-loop control algorithms. While traditional process control approaches could limit such quality variability and defects, their effectiveness is often impeded by a lack of adequate process measurement understanding and methods. 18
In our approach, instead of monitoring the actual part, we focus on the in-process monitoring of the spectral characteristics of elastic wave propagation in a specially designed PCA with periodic internal structures. A PCA represents the complexities of the build and amplifies certain specified characteristics of its AM process and materials. However, a PCA is considerably simpler and smaller than the actual build it represents and is thus substantially less demanding in real-time monitoring. Moreover, note that one of the key advantages of AM/3DP is that it provides an unprecedented form-free flexibility for the development of geometrically intricate components with complex interfaces, which are difficult to evaluate with waves due to diffraction and mode conversion.
A periodic structure can create pass/stop bands (PBs and SBs) depending on its geometric arrangement, interfacial properties, and/or mass distribution, as well as defects, even if materials involved do not necessarily include any imperfections/irregularities (due to deviations from periodicity) and/or dissipation mechanisms. 19 In addition, even small perturbation-level defects in a periodic structure can have significant effects on its spectral responses, thus can be observable from the wave properties. 20 As elastic waves travel significantly faster than typical AM/3DP deposition speeds, the presented PCA approach could potentially lead to rapid real-time monitoring with no interactions with its fusion process. Currently, at process control, monitoring, and inspection levels, probing knowledge required to implement such an approach is generally absent.
Our main hypothesis is that this mechanical integrity assessment challenge can be addressed with an in-process/in situ monitoring capability of elastic wave propagation in specially designed PCAs by continuously evaluating the mechanical and defect states of thread-to-thread/layer-to-layer bonds, thus real-time corrective action can be taken. One key factor in determining the quality of layer-to-layer bonds is how threads on subsequent layers cross each other when building these layers.
Specifically, the objectives of the current experimental study include: (1) to analyze the elastic wave propagation in a phononic crystal artifact design with varying thread orientations (θ) (Fig. 2); (2) to study effects of this process parameter [thread orientation (θ)] on its PBs/SBs; (3) to develop a mathematical model of the thread-to-thread fusion area, evaluating the effect of the thread orientations (θ) on the wave propagation properties of the PCA and relate this information to material/geometric quality; and (4) advance the mathematical model based on experimental data.

The optical microscope image (top views) of phononic crystal designs with specified thread orientation θ. Inset: photograph of sample 3D printed PCA designs (side views) with the specified thread orientation θ.
Instrumentation and Materials
An experimental setup based on an existing ultrasonic testing instrument (ATT2020; Pharmacoustics Technologies, LLC, Potsdam, NY) was developed and used. The ATT2020 instrument is a computer-controlled ultrasonic waveform acquisition and analysis system consisting of transducers, delay lines, axial load cells, and an apparatus for centering PCA sample, as well as a LabVIEW-based Graphical User Interface (GUI) (LabVIEW 15; National Instruments Corporation, Austin, TX) (Fig. 1). The setup can operate both in pulse-echo and pitch-catch ultrasonic modes for pressure and shear waves to characterize the mechanical properties of the millimeter-scale samples. The ATT2020 ultrasonic testing platform could also be configured to be utilized in the real-time monitoring of a build. 21 The spectral properties of acquired waveforms are related to material defect states (e.g., thread-to-thread bonding failure and individual thread defects), geometric quality (e.g., thread placement accuracy) of a PCA sample, as well as material properties, as waves interact with threads and bonds as they propagate the interior of the PCA sample.
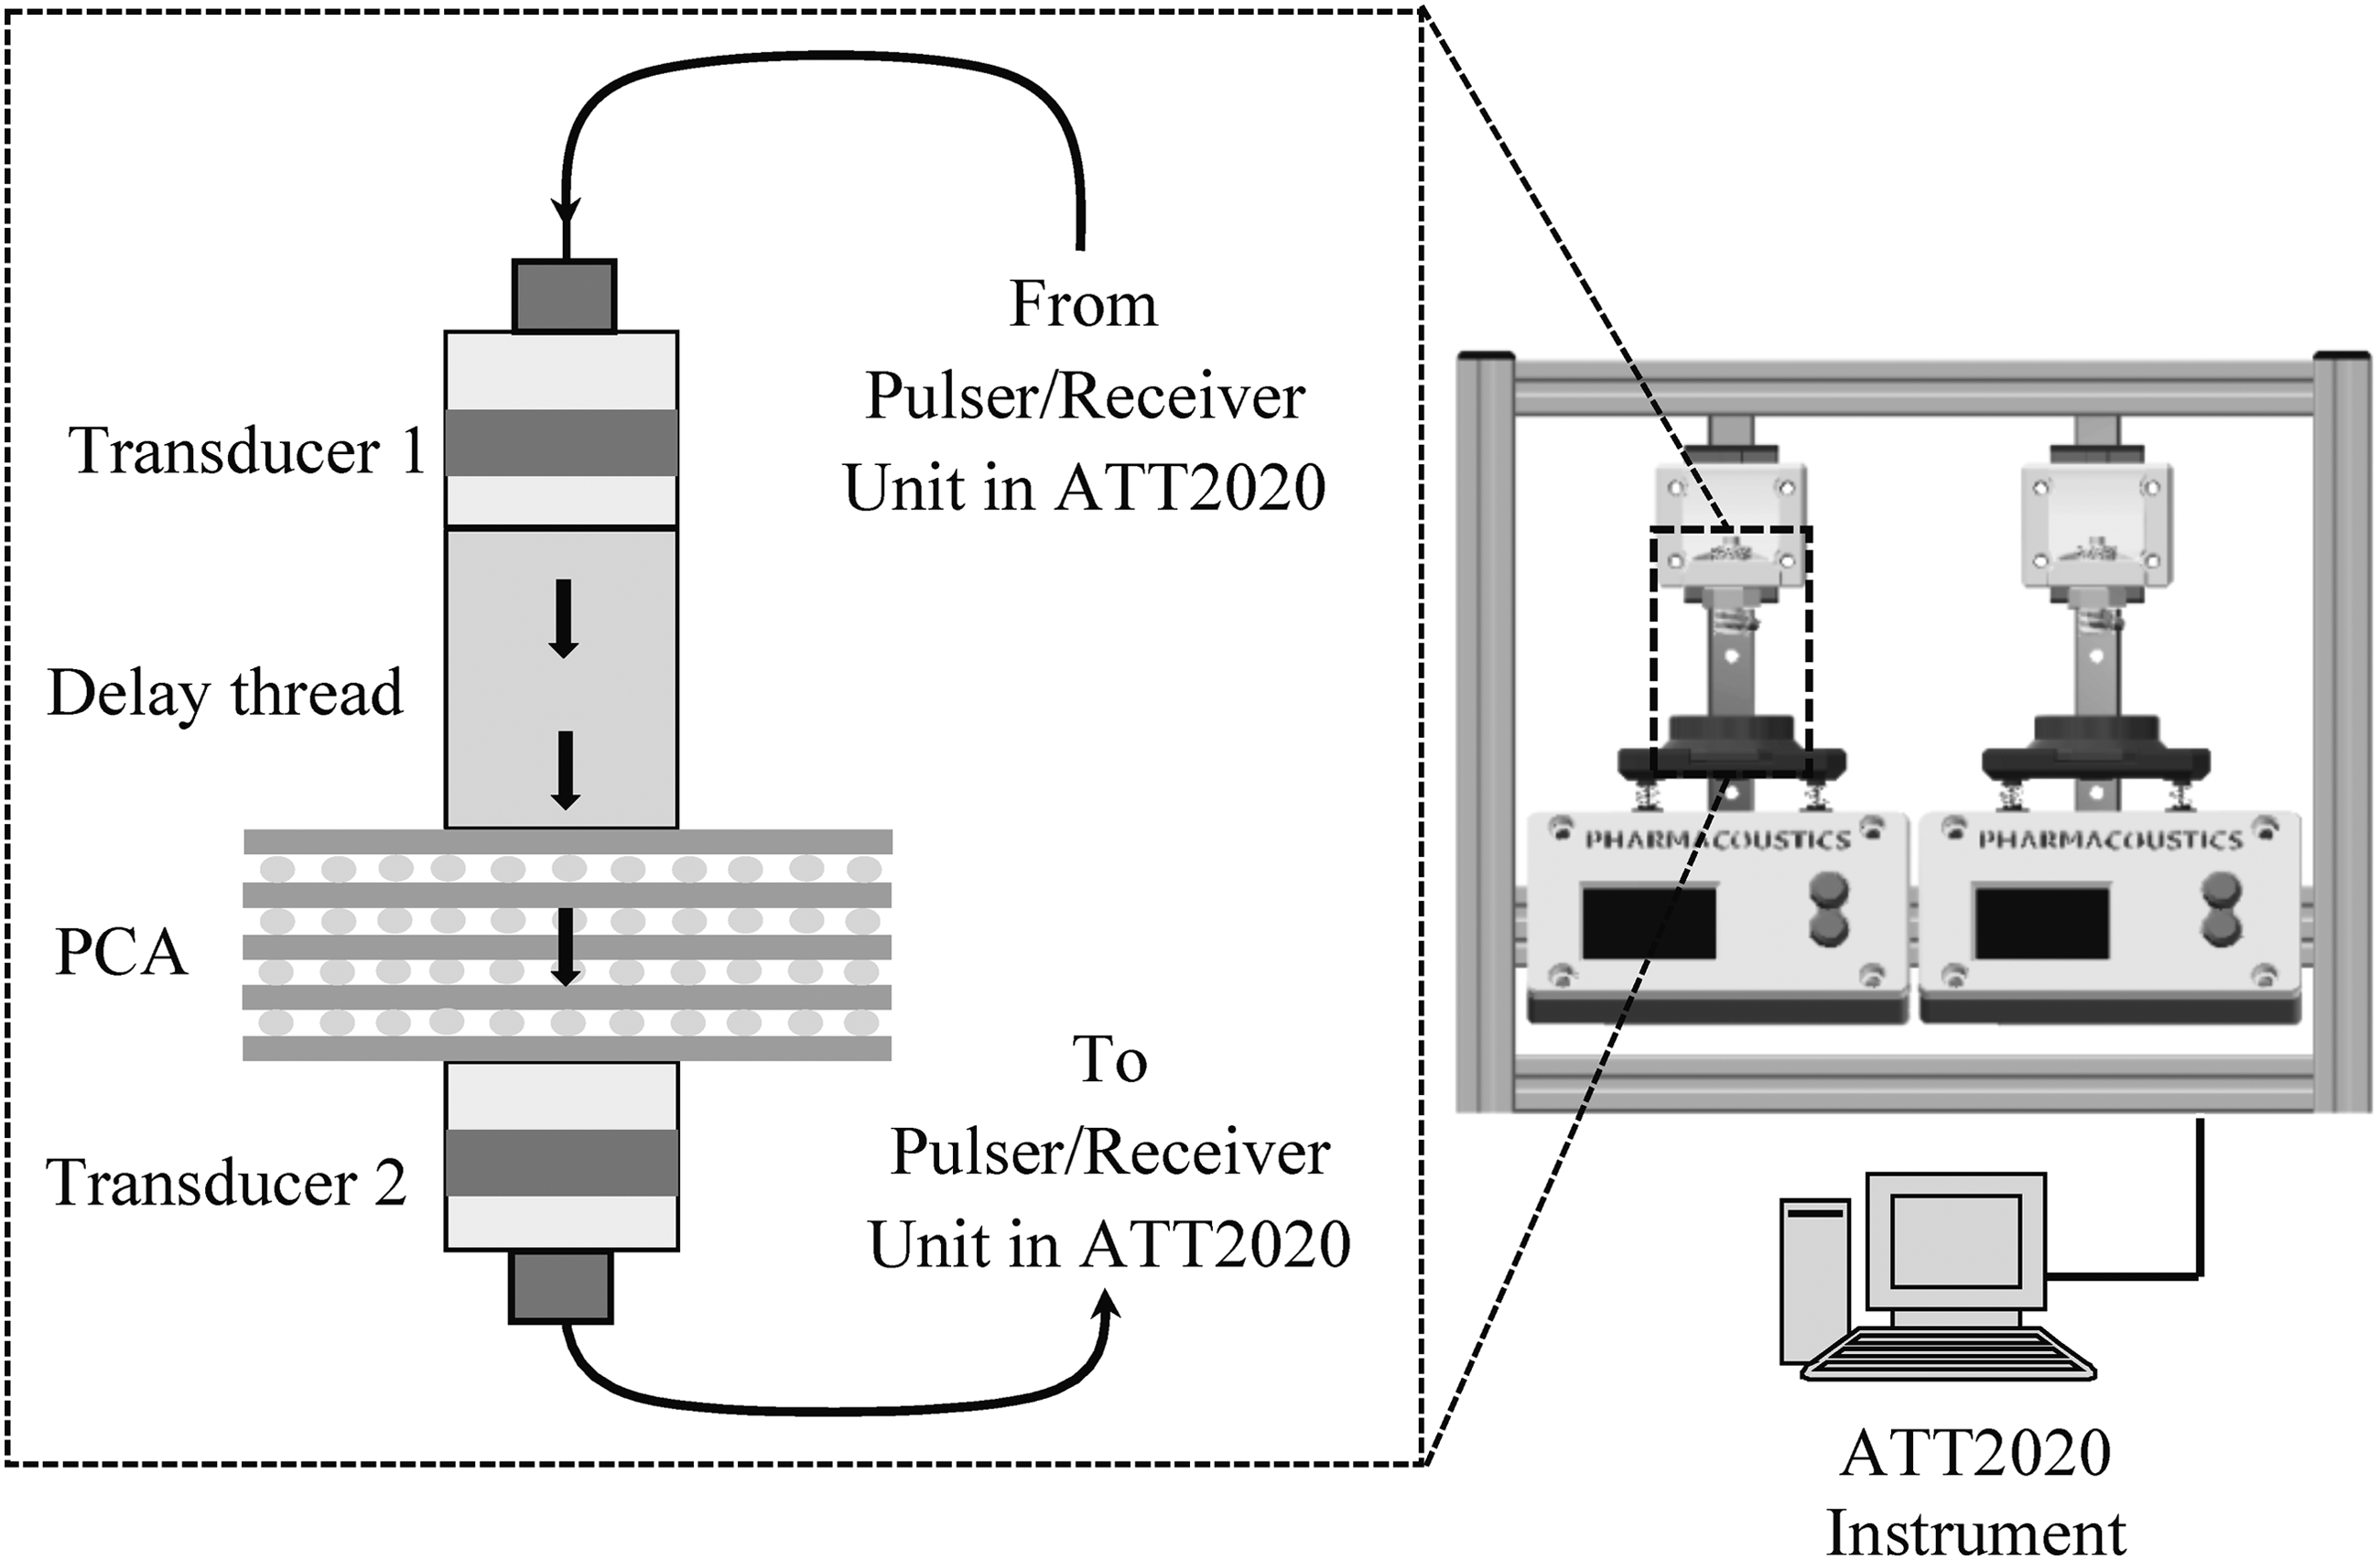
Close-up of the ATT2020 setup, and schematics of the experimental setup (instrumentation diagram) operating at the pitch-catch mode. PCA, phononic crystal artifact.
In current study, a commercially available 3D printer (MakerBot Replicator 2; MakerBot® Industries, Brooklyn, NY) based on FFF equipped with an extruder/nozzle diameter of 400 μm is used for printing test artifacts utilized in the reported experiments. FFF is a filament fusion AM/3DP technology, and it has become a widely-utilized method for modeling and prototyping applications. The specific model production method used in current study is FFF; however, the proposed monitoring/qualification approach is applicable to any class of AM/3DP technology. In fabricating the PCA samples utilized in the reported study, PLA (polylactic acid) filaments (3D PLA-1KG1.75-WHT; HATCHBOX®, Pomona, CA) with a diameter of 1.75 mm, a glass transition temperature of 60–65°C, and a melting temperature of 150–160°C are used.
For acquiring the X-ray computed tomography (CT) images of the phononic crystal artifacts, a CT-Scanner (Phoenix Nanotom® M; General Electric, Boston, MA) with a maximum voltage of 180 kV, a maximum power of 20W, and an image resolution of 3072 × 2400 pixels is used. These images were then saved and reconstructed using Phoenix datos|x CT software (General Electric) and were processed using VGStudio MAX (Volume Graphics, Charlotte, NC) to create cross-section images at arbitrary angles and orientations.
Design and Fabrication of Phononic Crystal Artifacts
The key mechanism exploited in current work for real-time quality monitoring is that, in a PCA, defects and/or irregularities break the periodicity and affect the geometric features of its structure, leading to detectable modulations in transmitted waveforms and their spectral dispersion properties. Based on this principle, we previously introduced and utilized the PCA approach as an evaluation modality for various AM monitoring objectives. 21 In current work, the PCA design is based on the biperiodic arrangement of threads with specified intervals and thread orientation angles θ (Fig. 2). The effects of thread orientation θ on the modulation of the elastic wave propagation in PCAs are quantified and studied.
The geometry of the PCA sample utilized in the current study was designed using SolidWorks (Dassault Systèmes SolidWorks Corporation, Waltham, MA) as a rectangular prism [30 mm (length) × 30 mm (width) × 8 mm (height)] (Fig. 2) and imported to a 3D printing slicing software (Simplify3D, Cincinnati, OH) for creating its representation and process parameters in G-code (Fig. 2). The process parameters (inputs) in the slicing software were specified for the extrusion speed (vp) as 42 mm/sec, the layer height (hs) of 400 μm, the extrusion width of 400 μm, the infill ratio of ri = 50%, and the extruder temperature (Te) of 240°C (Table 1). Additional details of fabrication process are found in Ref. 21 With the specified layer height (hs) and vertical geometric dimension of the rectangular prism, each bilayered PCA sample consists of 20 layers (10 repeating bilayer periodic sets) with sparse thread spacing (Fig. 2). The first layers of the set with five samples are printed at the orientation angles of θ = 90, 67, 56, 45, and 22°, respectively, on a second layer with the constant angle of 0° (Fig. 2). These PCAs are denoted as [(−90/0)10]T, [(−67/0)10]T, [(−56/0)10]T, [(−45/0)10]T, and [(−22/0)10]T.
Design Parameters of Each Sample (vp, r i , θ), Specified Microscale Features (ts, hs, and ss), Measured Microscale Features (tm, hm, and sm), Measured Overall Sample Dimensions (L, W, and H), Artifact Mass (mA) and Apparent Density Data (ρA), Acoustically Extract Time-of-Flight Values, the Speed of Pressure Waves (cL) Apparent Young's Modulus (EA), and the Dominant Wavelength (λ) at the Transducer Central Frequency (2.25 MHz) for the Sample Set
N/A, not applicable; ToF, time-of-flight.
Experimental Characterization Procedure
The experimental setup consisted of two pressure (longitudinal) wave transducers (AT024; Valpey Fisher, Hopkinton, MA) with a central frequency of 2.25 MHz, operating in pitch-catch mode (Fig. 1). In the reported experiments, the pulser/receiver parameters were set at a pulse width of 200 ns, pulser voltage of 200V, a sampling rate of 100 MHz, an amplification gain of 0 dB, and an averaging (oversampling) rate of 512.
In the pressure wave setup, Transducer 1 was coupled with the polymer delay line and screwed into the upper transducer holder. The function of the delay line is to separate the main bang (the initial ultrasonic pulse generated and sensed simultaneously by Transducer 1) from the interface reflections in a PCA sample. An ultrasonic pressure couplant gel (TheraSonic®; Compass Health, Middleburg Heights, OH) was used for increasing acoustic transmission between the PCA sample and the surfaces of the delay line and transducer. The load cells mounted at the bottom of the setup (Fig. 1) were used to measure and monitor the applied axial load during acoustic waveform acquisition. In reported experiments, the level of an applied axial load was maintained at 1500 ± 10 g for ensuring repeatable transmission contact between the sample and the surfaces of the delay line and transducer. The applied load levels were also acquired and saved in the ATT2020 instrument.
In the pitch-catch transmission experiments, a PCA sample was placed on the bottom sample/transducer holder in such a way that the bottom surface of the sample contacted with the Transducer 2 correctly. The PCA was centered and fixed by the sample centering apparatus during experiments. Transducer 1 assembled with a polymer delay line was vertically placed in contact with the top surface of the sample by manually lowering the upper transducer holder.
An electrical pulse tuned to the central frequency of Transducer 1 is generated by the ATT2020 and first excites this transducer (Fig. 1). An acoustic pulse transmitted through the delay line and the sample placed on the bare surface of Transducer 2 (Fig. 1) is received with a time delay [one-way time-of-flight (ToF) in the PCA sample]. The received pulse containing the ToF and spectral wave dispersion information was acquired, digitized, signal processed, and saved as a digital waveform data file through the ATT2020 GUI interface. These raw ultrasonic waveforms were then processed using MATLAB to analyze the temporal responses (waveforms) of a PCA sample set for evaluating their mechanical and spectral properties.
For the geometric characterization of PCA internal structures, the 3D-printed PCA samples (Fig. 2) were imaged using the CT scanner with a resolution of 3072 × 2400 pixels at an operating voltage of 120 kV and an operating power of 18W (Fig. 3a–e). A digital caliper (CD-6 in CS Absolute Digimatic Caliper; Mitutoyo, Inc., Aurora, IL) (error range = ± 5 × 10⁻⁶ m) and a digital scale (A120S-L; Mettler-Toledo, Inc., Columbus, OH) (error range = ± 50 × 10−6 g) were used to directly measure and verify the dimensions and masses of the samples, respectively. The printing process parameters and measured sample properties for the PCA sample set are reported in Table 1.

The X-ray CT cross-sectional (side views) images showing the actual fiber thickness (tm), the spacing between two adjacent print fibers (sm), and the print layer height (hm) with a superimposed stencil grid (white dashed lines and solid ovals) indicating the specified geometric dimensions (ts, ss, hs) (Table 1) of each PCA in the sample set with
In Figure 3a–e, the templates consisting dashed lines and circles/ovals indicate the specified dimensions of the PCA samples, in which the heights of the dashed circles/ovals and the vertical spacing between dashed lines are 400 μm for the sample set, while the widths of the dashed circles/ovals and the horizontal spacing between dashed lines are 400, 434, 482, 565, and 1068 μm for the same sample set, respectively (Table 1).
The effect of θ on the cross-section geometry is clearly observed, and the deposition process significantly distorts thread dimensions and placing. In the images of longitudinal cross-sections of sample set (Fig. 3a–e), it is visible how thread junctions were embedded into adjacent threads forming the print layers as they solidified and resulted in print errors and substructure-scale deformations. The average measured thread thickness (tm), the average measured thread-to-thread spacing (sm), and the average measured print layer height (hm) are evaluated and summarized in Table 1. It is observed that the average spacing of adjacent print threads (sm) increases with the decreasing thread orientation θ and the actual thread thickness (tm), and average actual print layer heights (hm) remain constant with the change in the thread orientation.
Experimental Data and Analysis
The acquired waveforms depicted in Figure 4 for the PCA sample set are processed. The ToF values (Δt) are extracted to determine the average longitudinal (pressure) wave velocity by cL = H/Δt where H is the thickness of a PCA sample (one-way travel distance). The apparent Young's modulus for each sample material (in the direction of wave propagation) is calculated by EA = cL 2 ρ where ρ is the average (apparent) mass density of a sample. The ToF values, measured sample dimensions, corresponding longitudinal pressure wave velocities (cL), and the artifact's apparent Young's modulus (EA) for the PCA sample set are summarized in Table 1.
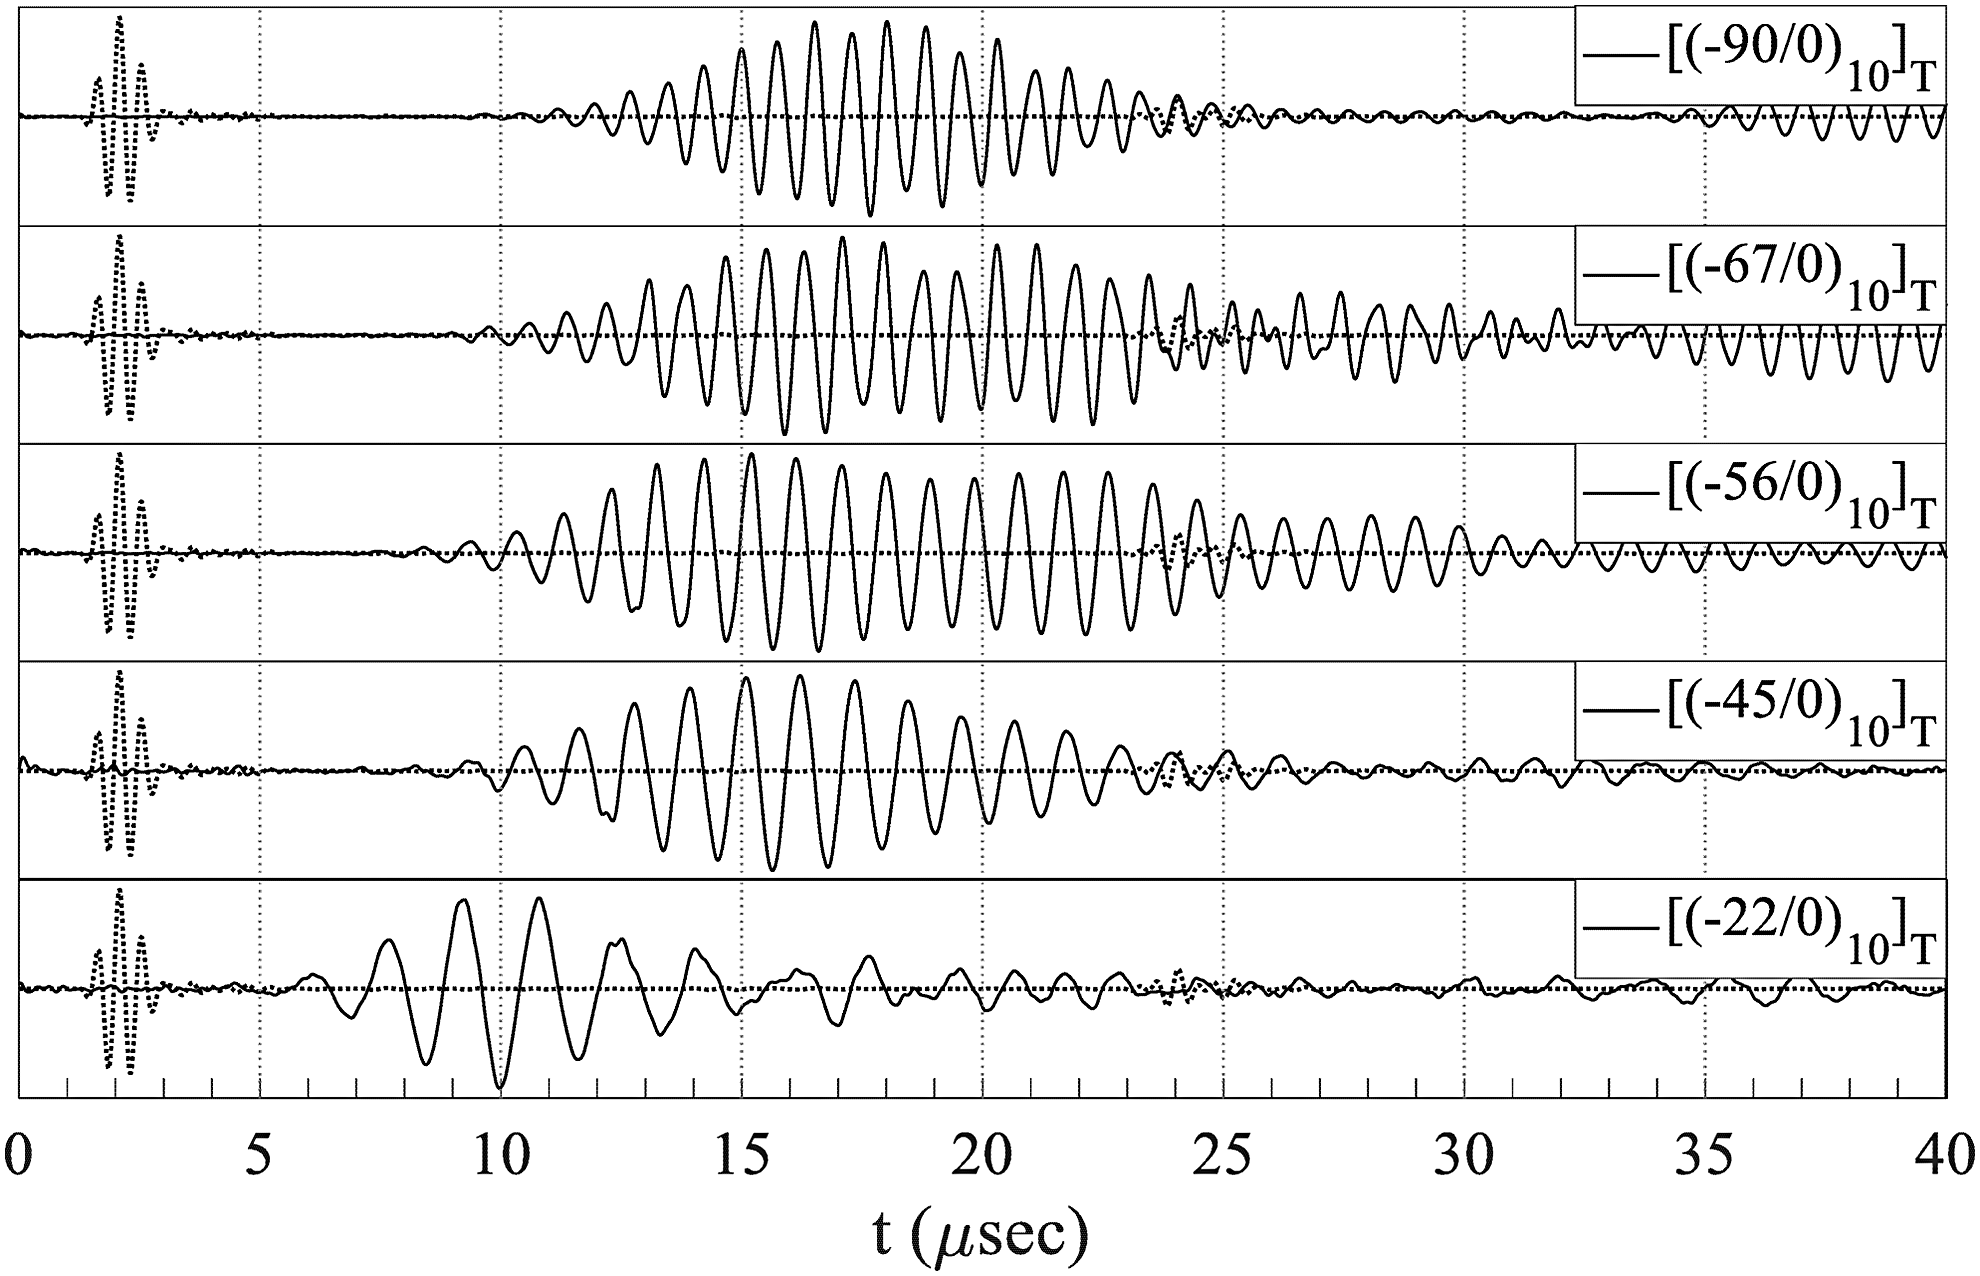
Delay-line (dashed lines) and sample (solid lines) waveforms acquired in the pitch-catch mode for each PCA in the sample set.
From the acquired waveforms of the PCA sample set with the extrusion speed of vP = 42 mm/sec, it was observed that the ToF decreases, that is, ToF = 9.33, 7.67, 7.47, 7.51, and 5.48 μsec for the samples [(−90/0)10]T, [(−67/0)10]T, [(−56/0)10]T, [(−45/0)10]T, and [(−22/0)10]T, respectively (Fig. 4). The data set clearly indicates that the ToF is sensitive to the changes in the thread orientation.
Each acquired waveform for a sample is transformed into its spectral domain using the fast Fourier transform routine and then normalized with respect to its maximum amplitude in frequency domain and compared to other samples as depicted in Figure 5. The pressure transducer bandwidth (1.2–3.1 MHz) is also visible from the spectral response of the delay line (Fig. 5). The PBs and SBs are observed in the frequency response plots. From the spectral responses of [(−90/0)10]T and [(−67/0)10]T, two distinctive PBs, namely PB I and PB II, are clearly observed in the transducer bandwidth (Fig. 5), and the formation of a distinctive SB is obviously noticeable between the two PBs. From the spectral responses of [(−56/0)10]T, [(−45/0)10]T, and [(−22/0)10]T, PB I was observed in the transducer bandwidth, and PB II with relatively lower amplitude is not noticeable due to substantial deformation in the internal structure. From the normalized spectral responses of each artifact design (Fig. 5), it is observed that the bounds of PB I shift to left with decrease in the thread orientation. Namely, the frequency ranges of PB I for [(−90/0)10]T, [(−67/0)10]T, [(−56/0)10]T, [(−45/0)10]T, and [(−22/0)10]T are 1.12–1.63, 1.02–1.54, 0.83–1.37, 0.67–1.13, and 0.38–1.1 MHz, respectively. Based on these observations, it is concluded that the bounds of the first pass band (PB I) are sensitive to the change in the thread orientation.
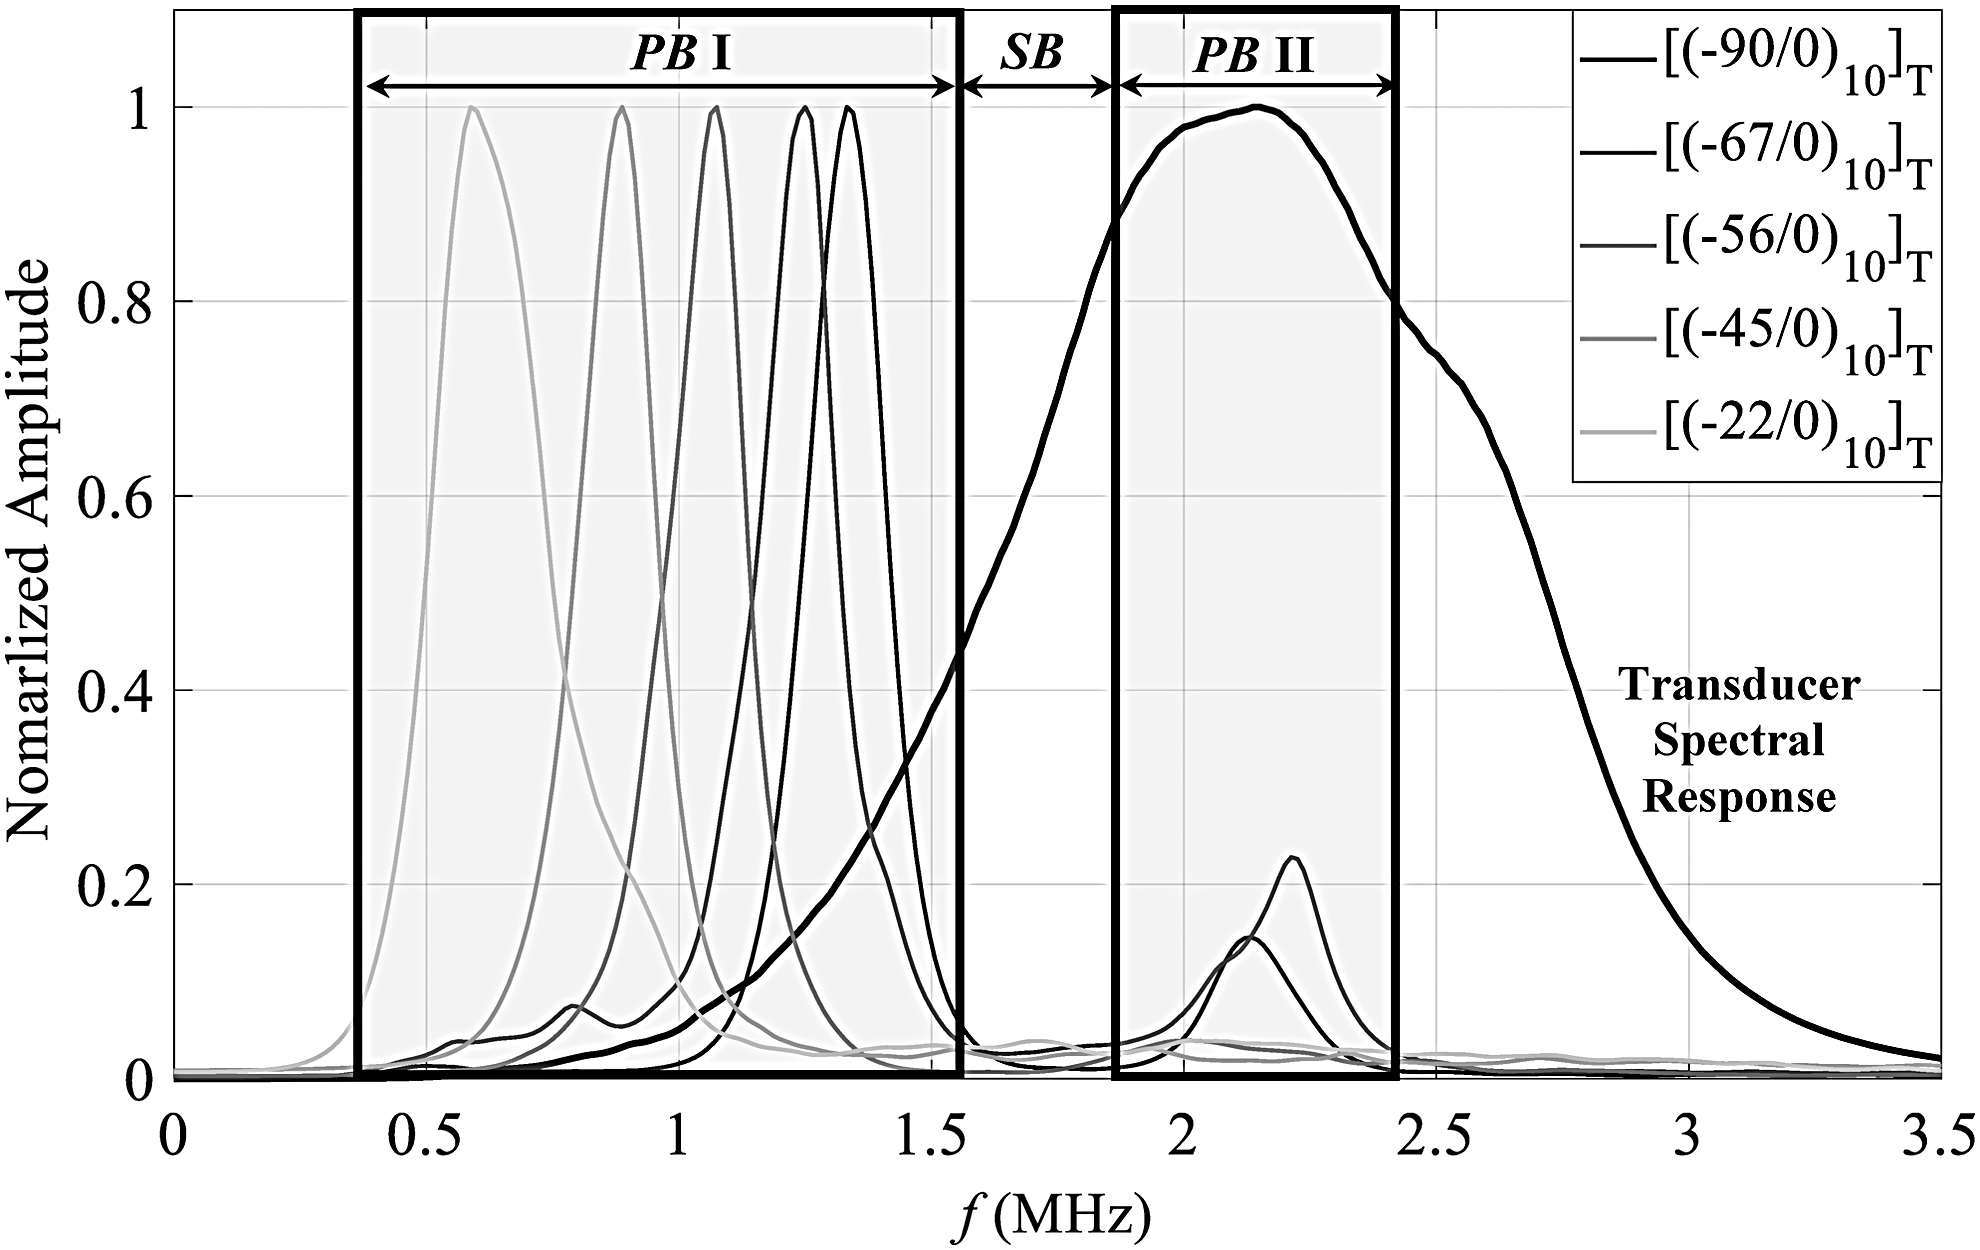
Normalized spectral responses acquired in the pitch-catch mode for the PCA sample set, indicating the boundaries of the stop (SB) and pass (PB I and PB II) bands in the transducer bandwidth (thick solid line).
Mathematical Model for Elastic Wave Propagation in a Phononic Crystal
For examining the sensitivity of the PB I bounds to a change in thread orientation θ and the formation of a new SB following PB I (Fig. 5) in the bandwidth of the transducer, a two-cuboid fusion model (Fig. 6a) is developed and utilized. The fusion zone is modeled as a cuboid (top, Cuboid B, Fig. 6a), while the bottom cuboid (Cuboid A) models the body of the thread material. The model was generated based on the cross-section image of a single thread-to-thread bonding zone (single periodic cell) (Fig. 3a–e). The observed print thread and the embedded thread junctions (fusion zones) (Fig. 3a–e) are modeled as two homogeneous, isotropic, and linear cuboids. The dimensions of the embedded thread junction (Cuboid B) are considerably smaller than the print thread (Cuboid A) (Fig. 6a); thus, in general the fusion zone is expected to be less rigid than thread materials.
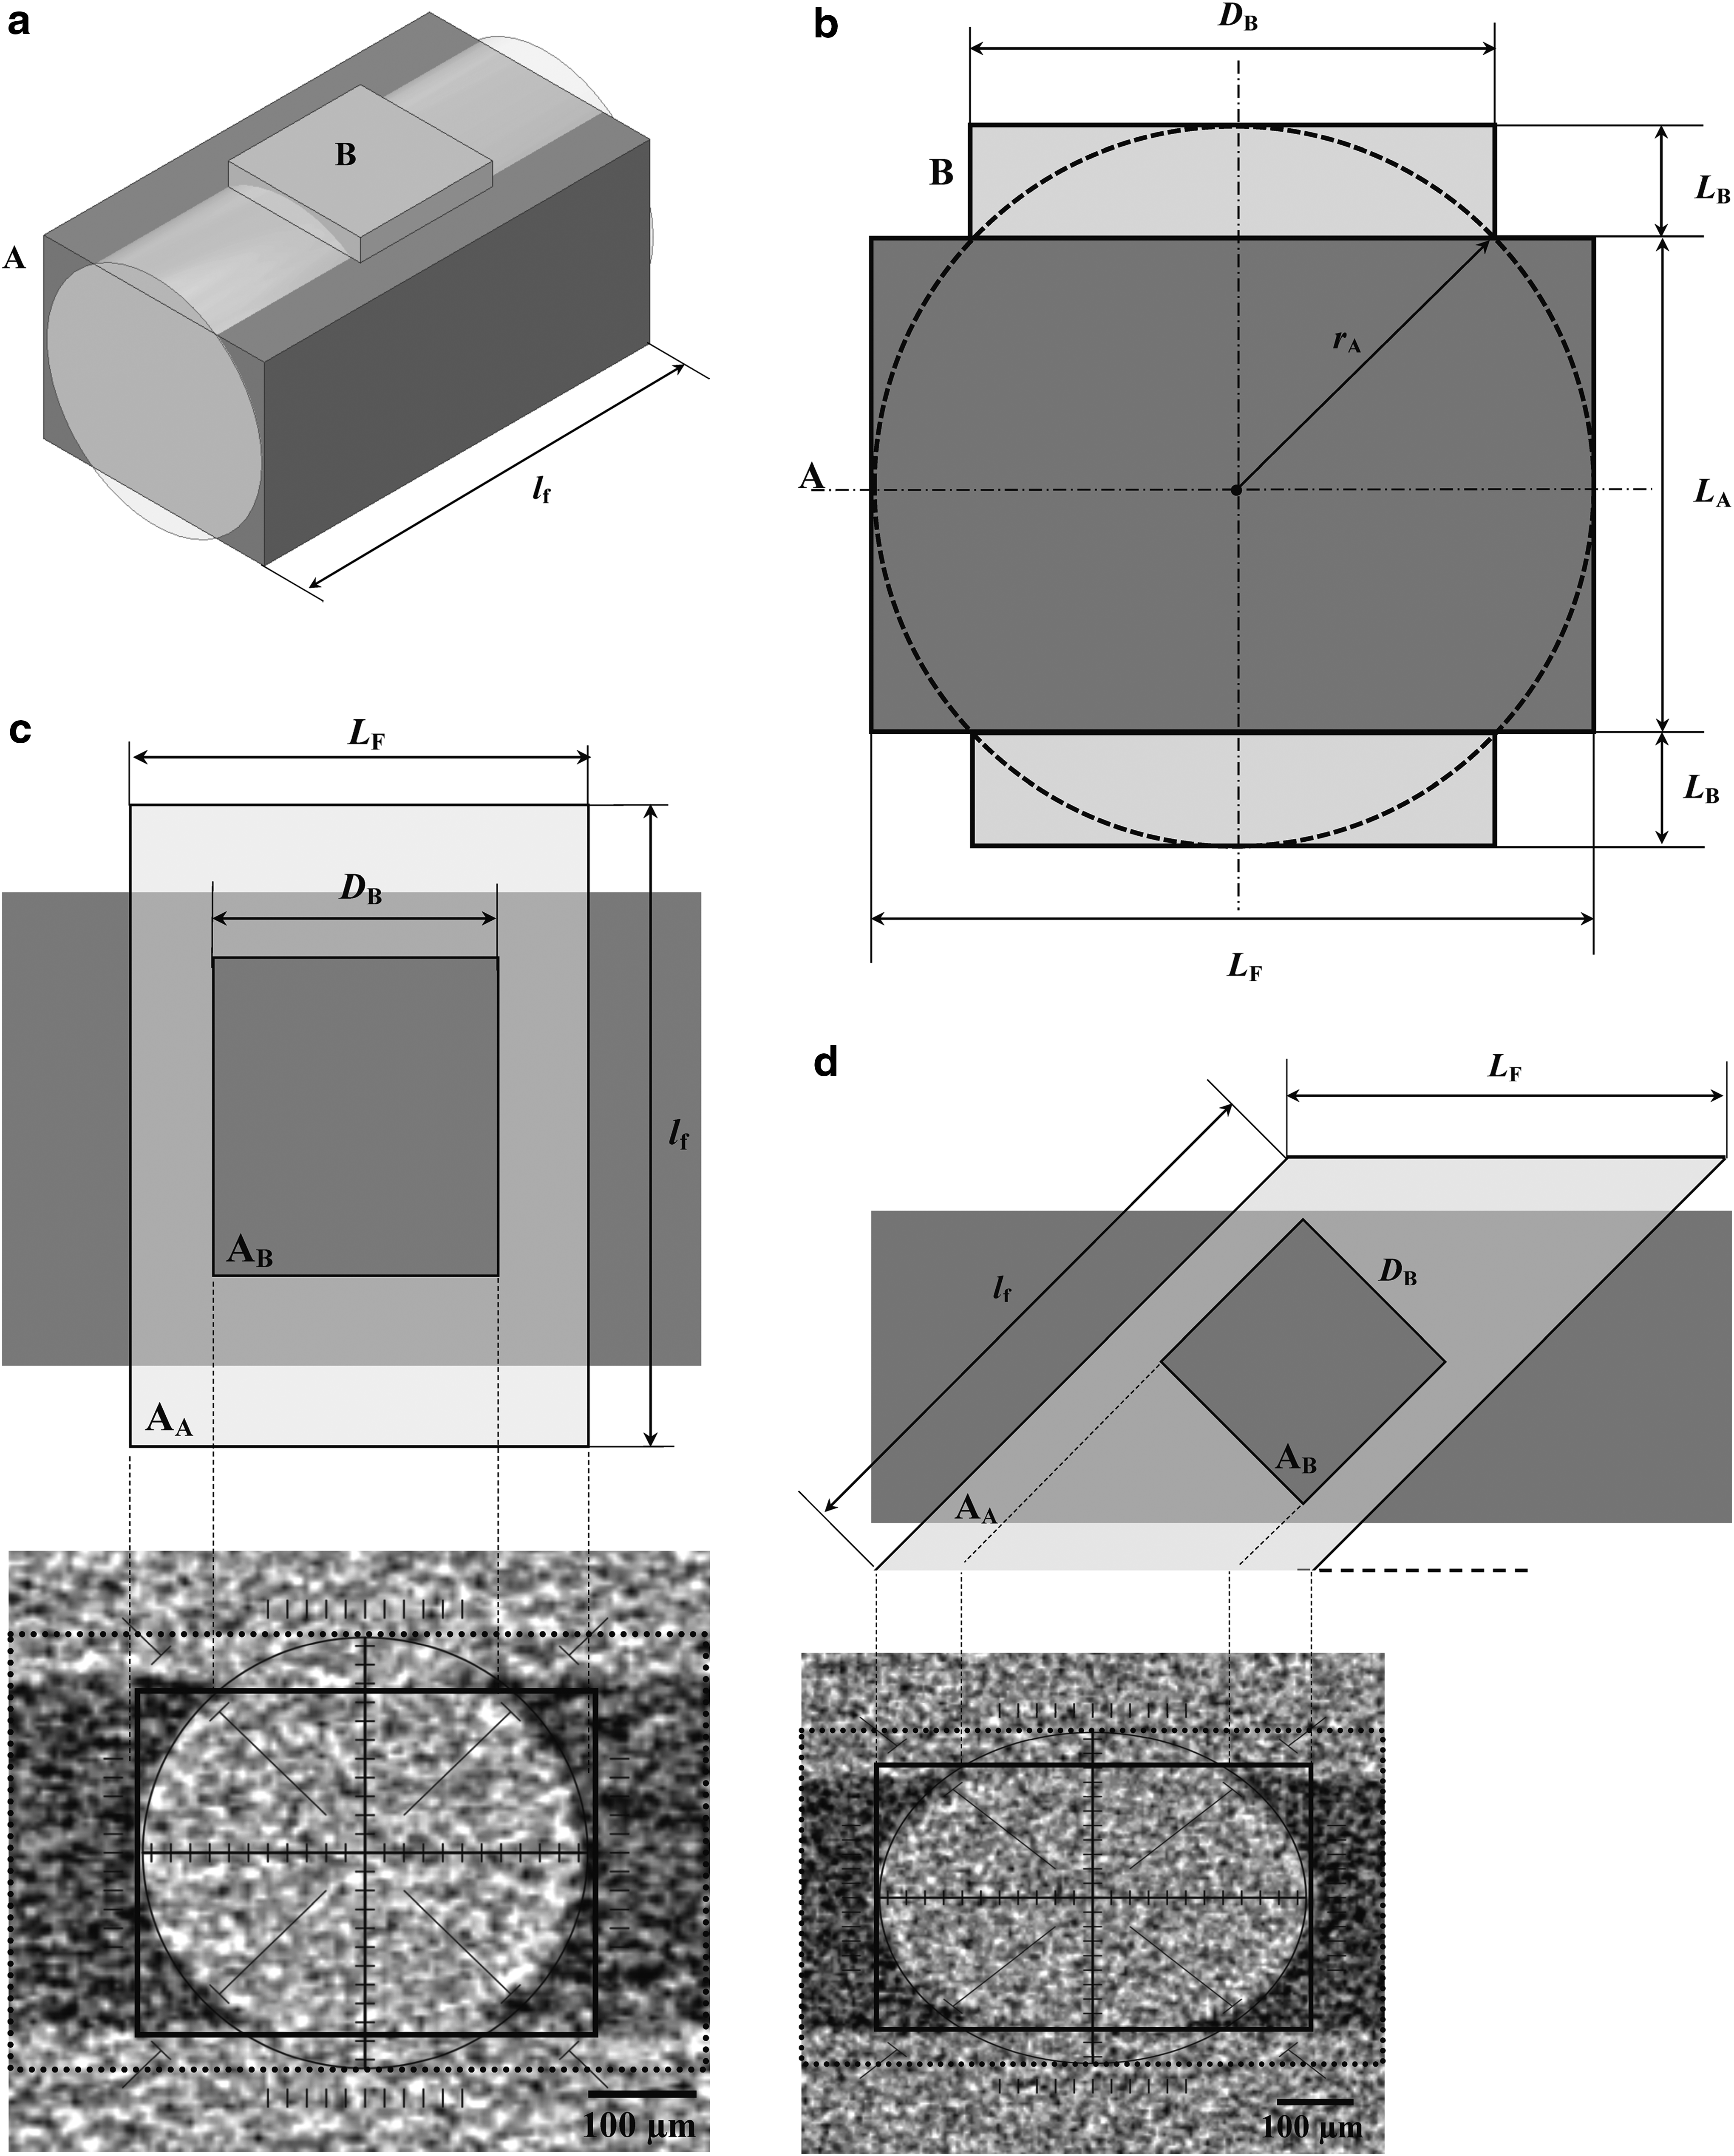
The schematics of the model (front view) (Fig. 6b) depict the relationship between various parameters. From Figure 6a and b, assuming the top and bottom faces of Cuboid B as squares, the transverse cross-section area of A (AA) and B (AB) is expressed as
where
In a previous study,
22
the scaled frequency Ω, and nondimensional structural parameters τ and υ are defined by
where
For a given periodic structure, if μ(Ω) is purely imaginary,
In current work, τ and υ were calculated from Equations (1) and (2) using the measured dimensions (sm, LA) of a periodic cell from the X-ray CT cross-section images (Fig. 3a–e; Table 1).
The propagation constant for the sample sets was evaluated with a scaled frequency Ω from Equation (3). The normalized
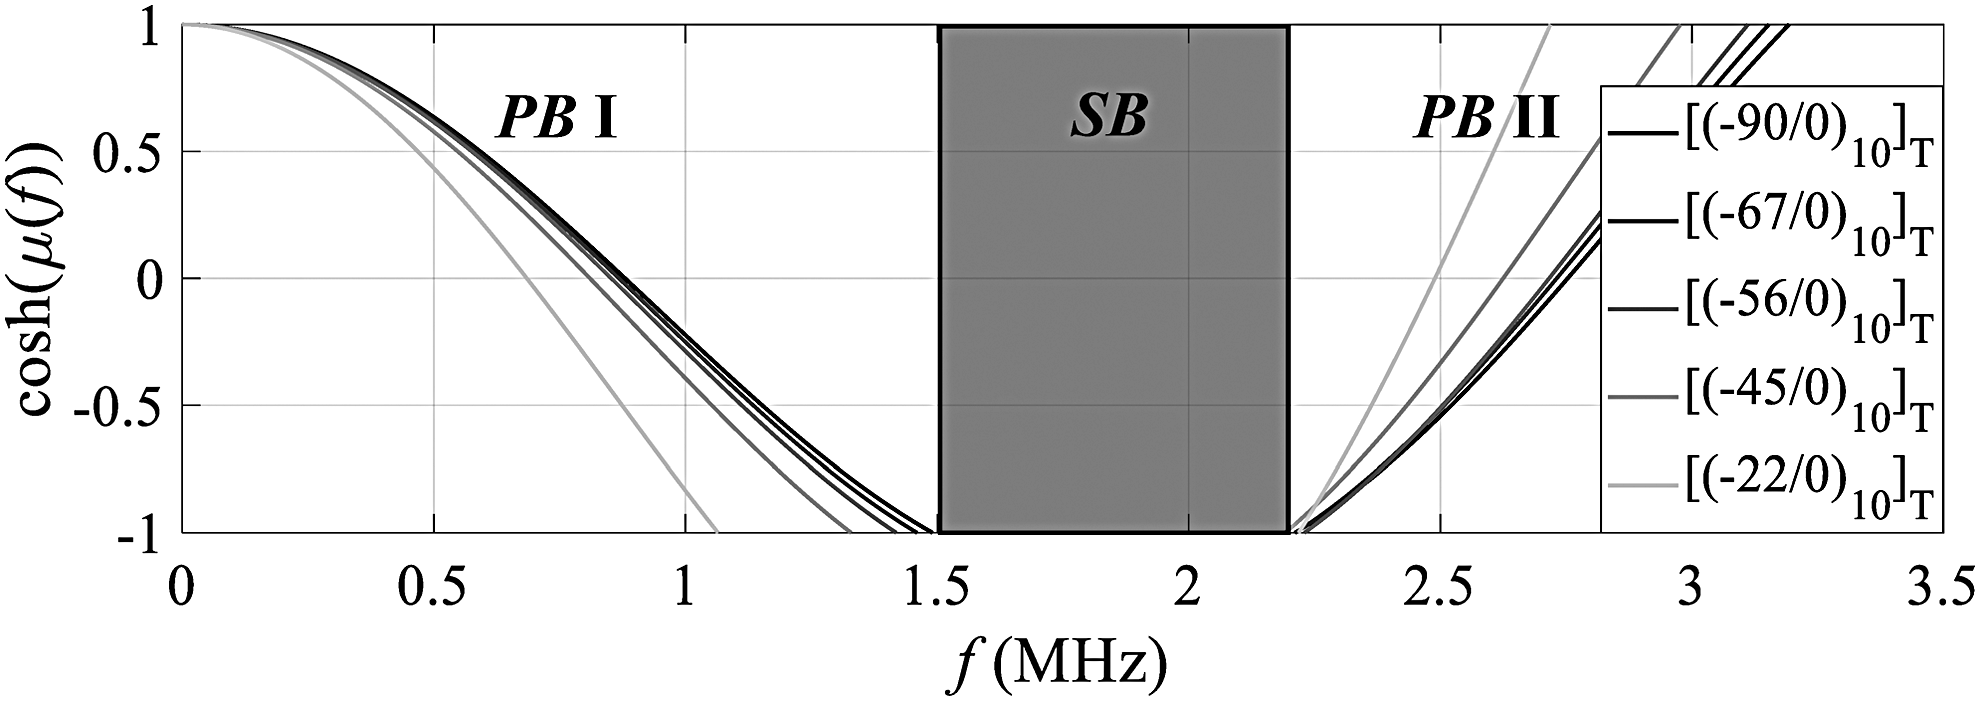
A plot of cosh(μ(f)) as a function of the frequency (f) based on the experimental extracted values of cL and EA in the range of 0–3.5 MHz indicating the formation of a stop band (SB) (gray box) between two pass bands (PB I and PB II) for the sample set.
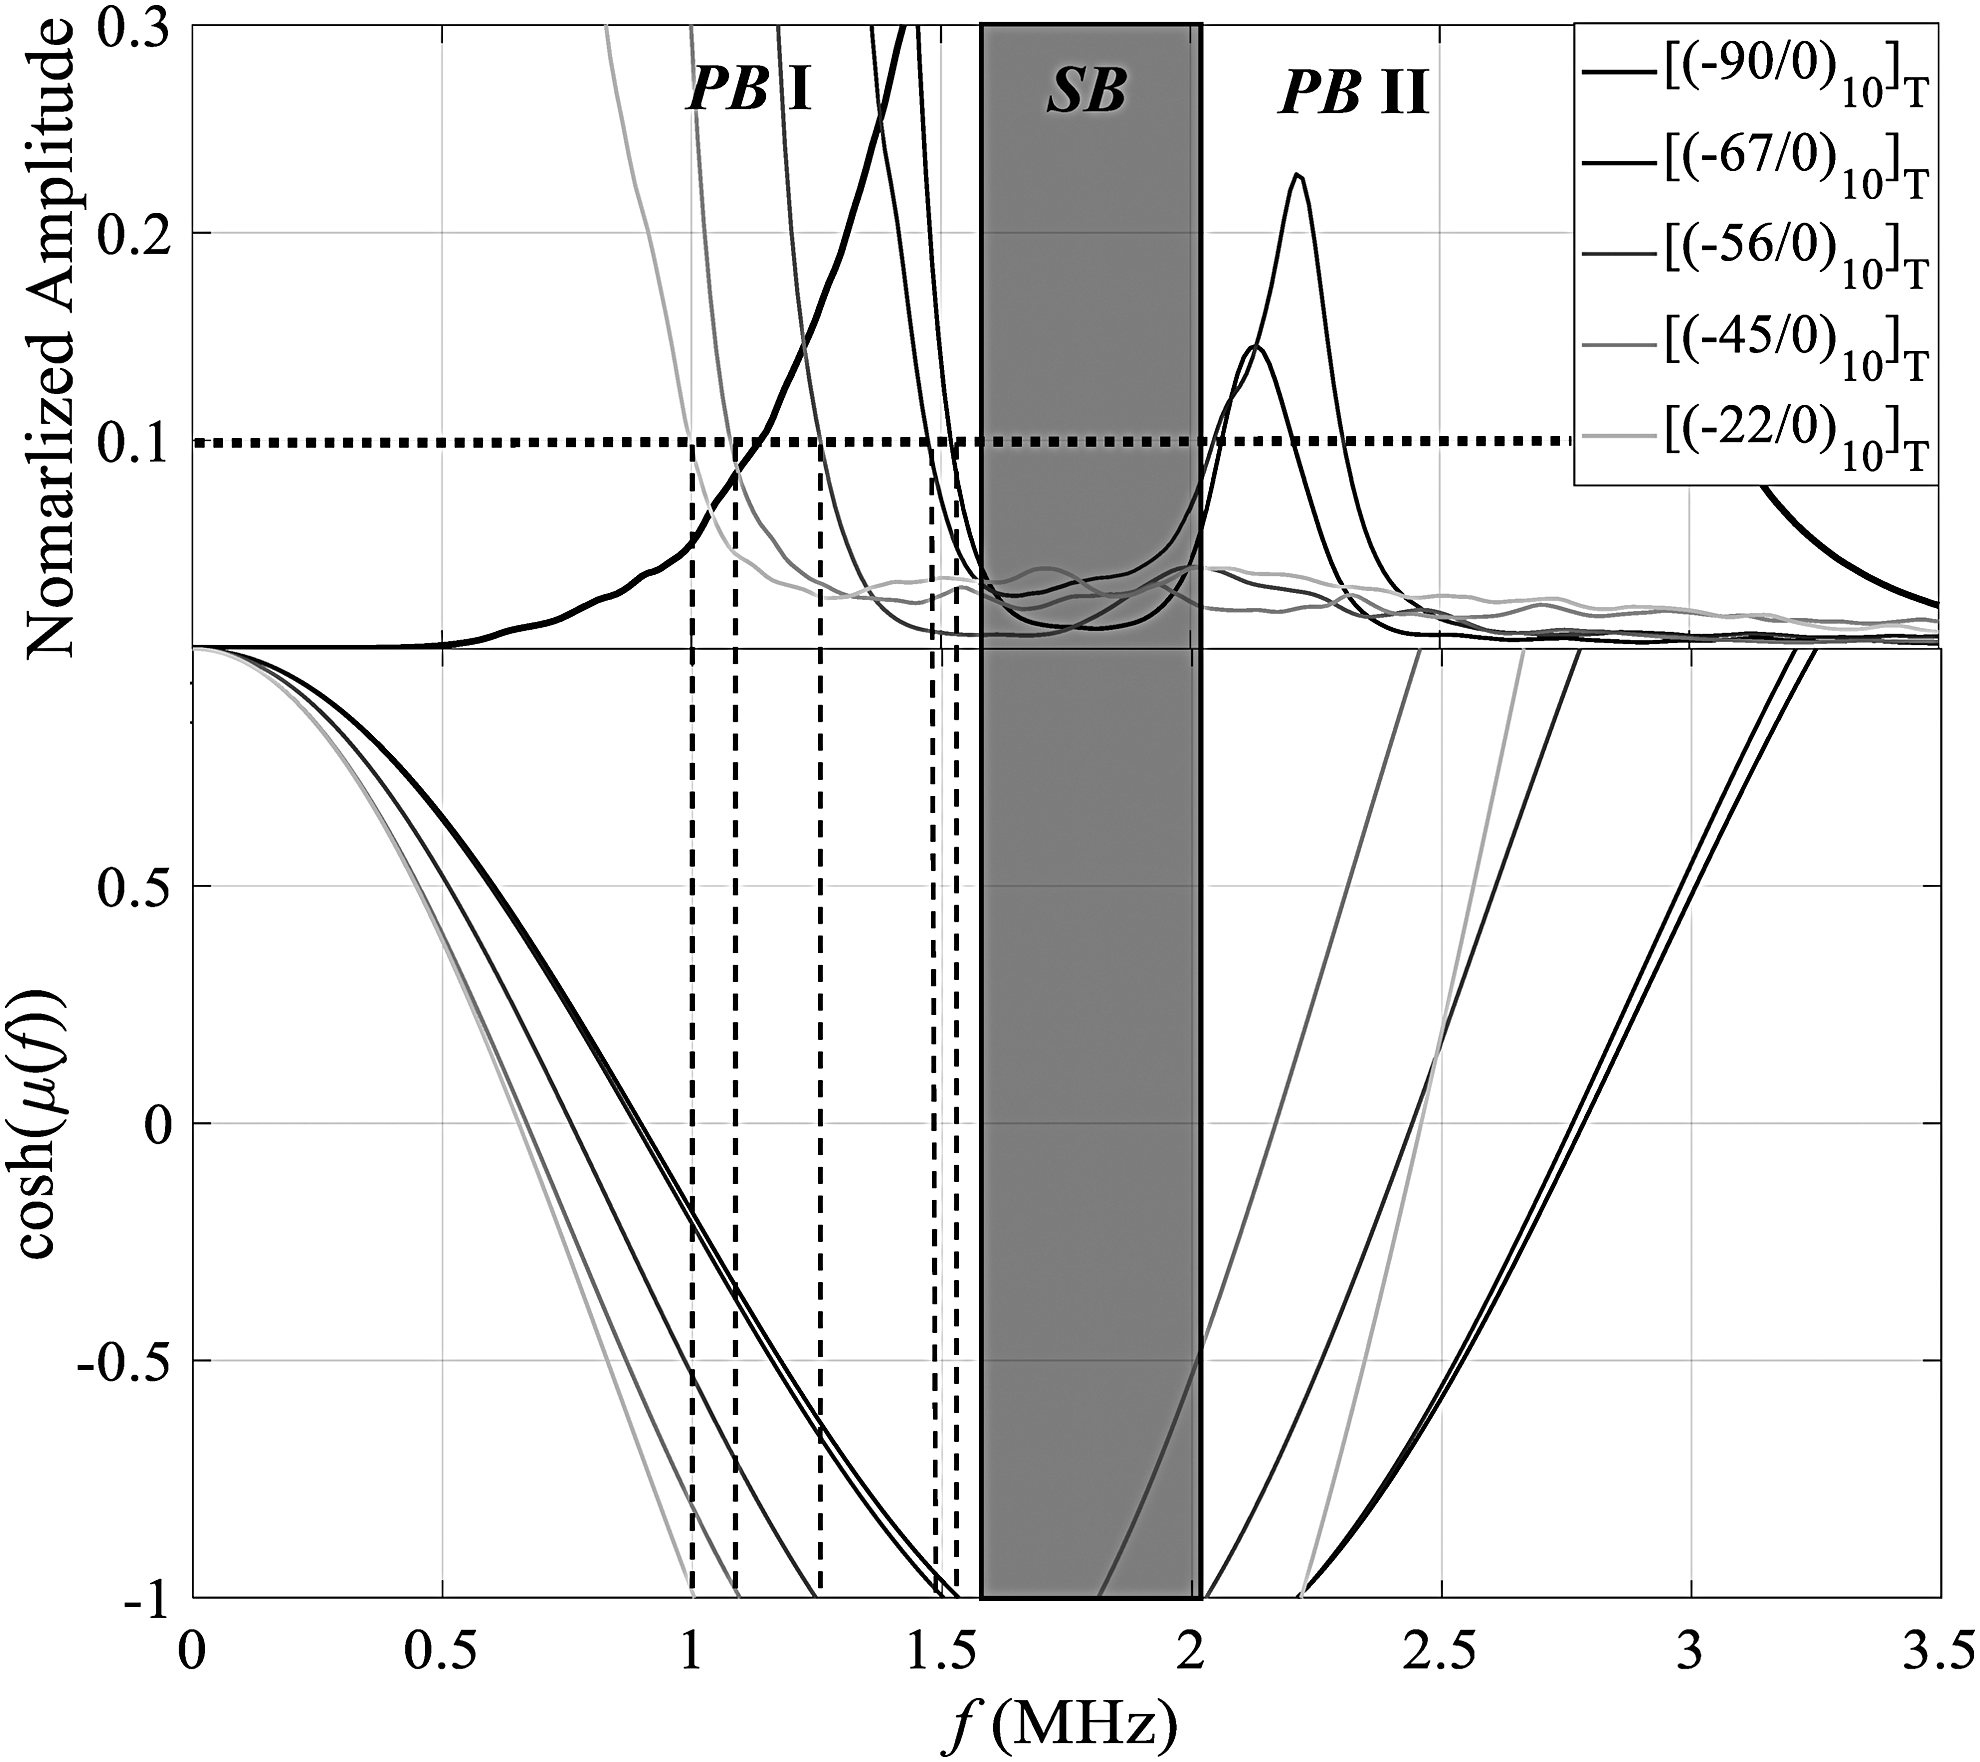
The experimentally obtained upper bounds of PB I and PB II (top plot) and a SB (gray box) at −20 dB (horizontal solid dotted line), compared with the perturbed cosh(μ(f)) term (bottom plot) based on the modified fusion model for the sample set. Vertical dashed lines linking the SB-PB I show close agreement between the experimental data and the model-based calculated upper bonds for PB I.
It is observed that the computationally obtained upper bonds of PB I (1.53, 1.47, 1.25, 1.10, and 1.01 MHz) are in close agreement to those identified in the experiments (1.52, 1.48, 1.26, 1.08, and 0.96 MHz at −20 dB for the samples [(−90/0)10]T, [(−67/0)10]T, [(−56/0)10]T, [(−45/0)10]T, and [(−22/0)10]T, respectively) (Fig. 8).
Conclusions and Remarks
Currently, print defects and scrap rates are rather common in AM/3DP, and the inconsistency of print quality has often been reported as one of the key shortcomings of AM/3DP. In current work, a monitoring mechanism based on the ultrasonic elastic wave propagation in a periodic (phononic crystal) structure and the effect of its structural periodicity and defects on the properties of wave dispersion is introduced. Instead of monitoring of the actual part, our methodology concentrates on the in-process monitoring of the spectral characteristics of elastic wave propagation in a specially designed PCA with periodic internal structures.
In addition to the quality of thread-to-thread bonding on a layer and the strength of each thread, one key factor determining the quality of layer-to-layer bonds is how threads on subsequent layers cross each other when building these layers. The focus of current work is on the effects of the thread orientation on the PB/SB boundaries in the sample frequency spectrum, as well as wave propagation speeds in the artifacts, indicating strong relationships between propagating pressure waves and thread orientations in PCA structures. It is observed that the basic PCA with a biperiodic grid structure is capable of detecting thread orientation changes from the PB/SB bound shifts, indicating that thread orientation modulates material properties and/or fusion quality in an observable manner. The frequency spectrum of the designed PCAs contains PB and/or SB within the transducer bandwidth range, and it is shown that the thread orientation strongly affects the bounds of PB I in this particular PCA configuration. This observation implies that ultrasonic waves interact with the materials at the thread and thread-to-thread fusion (microscale) levels.
It is determined that the boundaries of PB I are sensitive to the changes in thread orientation, that is, the frequency range of PB I for [(−90/0)10]T, [(−67/0)10]T, [(−56/0)10]T, [(−45/0)10]T, and [(−22/0)10]T is 1.12–1.63, 1.02–1.54, 0.83–1.37, 0.67–1.13, and 0.38–1.1 MHz, respectively. The sensitivity can be quantified as Δf/Δθ, the frequency changes in upper and lower bonds of PB I (Δfupper and Δflower) over the changes in thread orientation (Δθ), that is, for the comparisons between samples [(−90/0)10]T and [(−67/0)10]T, [(−67/0)10] and [(−56/0)10]T, [(−56/0)10]T and [(−45/0)10]T, [(−45/0)10]T and [(−22/0)10]T, Δfupper/Δθ = 5.2, 16.3, 15.4, and 3.9 kHz/deg., respectively, and Δflower/Δθ = 12.6, 14.5, 17.3, and 4.7 kHz/deg., respectively. Furthermore, the microscale substructures, mass, apparent density, ToF, pressure wave speed (cL), and apparent Young's modulus (EA) of the samples (in the direction of wave propagation) are affected by thread orientation (θ) (Table 1).
The key advantages of the presented approach include: (1) as elastic wave travels several orders of magnitude faster than typical AM/3DP deposition speeds, this mechanism can potentially be adopted in the development of a rapid real-time in situ monitoring technique allowing real-time corrective action; (2) in research and development efforts, the reported approach can assist in optimizing AM/3DP process parameters with minimal material waste and tool time; (3) real-time monitoring could further lower build quality inspection durations and efforts, as, in several industries (such as aerospace), postproduction testing and evaluations are often required; and (4) since, in several AM/3DP modalities, the quality-monitoring task could often be reduced to the mechanical integrity and strength examination of threads and bonding of threads, monitoring mechanisms for such substructures are essential in building an effective in situ real-time monitoring system.
Footnotes
Acknowledgments
The authors acknowledge funding from the Wallace H. Coulter Foundation for the acquisition of the experimental setup utilized in the reported work and student support, Incodema3D, LLC for guidance, and Pharmacoustics Technologies, LLC for equipment and technical support with the ATT2020 instrument.
Author Disclosure Statement
No competing financial interests exist.