




Abstract
With additive manufacturing increasingly being embraced in the area of sports technology, focus has shifted toward cellular structures for impact protection. Periodic lattice structures can be tailored for a specific response by modifying the geometry of individual cells, with the structure capable of being modified to conform around a given body. However, the effect of modifying specific design characteristics within a lattice and the interrelationships between them are not well understood. This study examines five geometric design variables: cell width, strut cross-sectional area (CSA), strut shape, cell orientation, and joint filleting, and their effect on the compressive behavior of a lattice structure. Truncated octahedron lattices were manufactured using nylon through the process of material extrusion and tested under compression at a constant strain rate of 1.0 s−1. Design of experiments was utilized to analyze the results by implementing a 2(5-1) factorial design. Results indicated that the strut CSA, cell width, and interaction between the two design characteristics had the largest effects on the plateau stress of the lattice and its energy capacity.
Introduction
Protective equipment in sport is used to reduce the risk of incurring injury while competing, with many of these items focused on reducing the impact forces and loading rates experienced by the wearer during blunt force trauma.1–4 Cellular materials such as foams are commonly used for these applications as their cellular nature produces a three-stage loading response. 5 The plateau regime of this response has a long strain range with a near-constant stress value, known as the plateau stress, which has a significantly higher energy absorption capacity compared with a homogeneous sample of the same base material at a similar stress level. 6 The energy absorption capacity is indicative of the impact energy that a cellular material can absorb, while plateau stress relates to the level of force that is transferred to the wearer during the impact. 7
While foams are effective at offering protection from impact, disadvantages of their use with respect to protective clothing include:
With increasing utilization of additive manufacturing (AM), attention has been paid to its potential application to personal protective equipment.12–15 Interest has also grown in the areas of additively manufactured cellular structures (AMCSs) and bespoke sports equipment,13,16 in particular the area of AM-based running shoe midsoles. Brands such as Adidas, 17 New Balance, 18 and Under Armour 19 have already released limited runs of AM-based running shoes, with Nike likely to follow having signed a partnership agreement with HP in 2016. 20
One significant advantage that AMCSs offer over traditional foaming techniques is the increased level of control that is achievable through the use of AM technologies with respect to the size and shape of pores.21,22 Foams exhibit random variation due to the nature of their manufacturing processes. 23 While it is possible to recreate this level of variation through AM using a stochastic model,21,24,25 it is resource intensive when compared with generation a uniform cell structure such as a periodic lattice. 26 While a regular lattice offers the advantage of uniform stiffness throughout its structure, manufacturing these through AM offers design freedom on a cell-by-cell basis with the possibility of realizing:
These applications can predominantly be achieved by editing specific design variables in each cell such as strut cross-sectional area (CSA), strut shape, and the level of filleting placed at each strut joint. When examining individual cells, the design variables of the complete periodic lattice, such as the cell size and orientation, must also be examined to fully understand any interaction effects that may exist between the two.
The aim of this study was to identify the key design variables that had a significant effect on the energy capacity of lattice structures manufactured by material extrusion (MEX) and the plateau stress of their response.
Materials and Methods
Specimen manufacture
The truncated octahedron has previously been identified as a suitable candidate for the manufacture of AM lattice scaffolds in tissue engineering.31,32 As this polyhedron is also the best single-cell solution to Kelvin's minimal surface conjecture, 33 the truncated octahedron was used as the base unit for all specimens used within this study.
The size of the test specimens was based on the ASTM D3574-11 Standard Test Methods for Flexible Cellular Materials, 34 which recommended that specimen dimensions should measure 50 × 50 × 25 mm, as depicted in Figure 1.
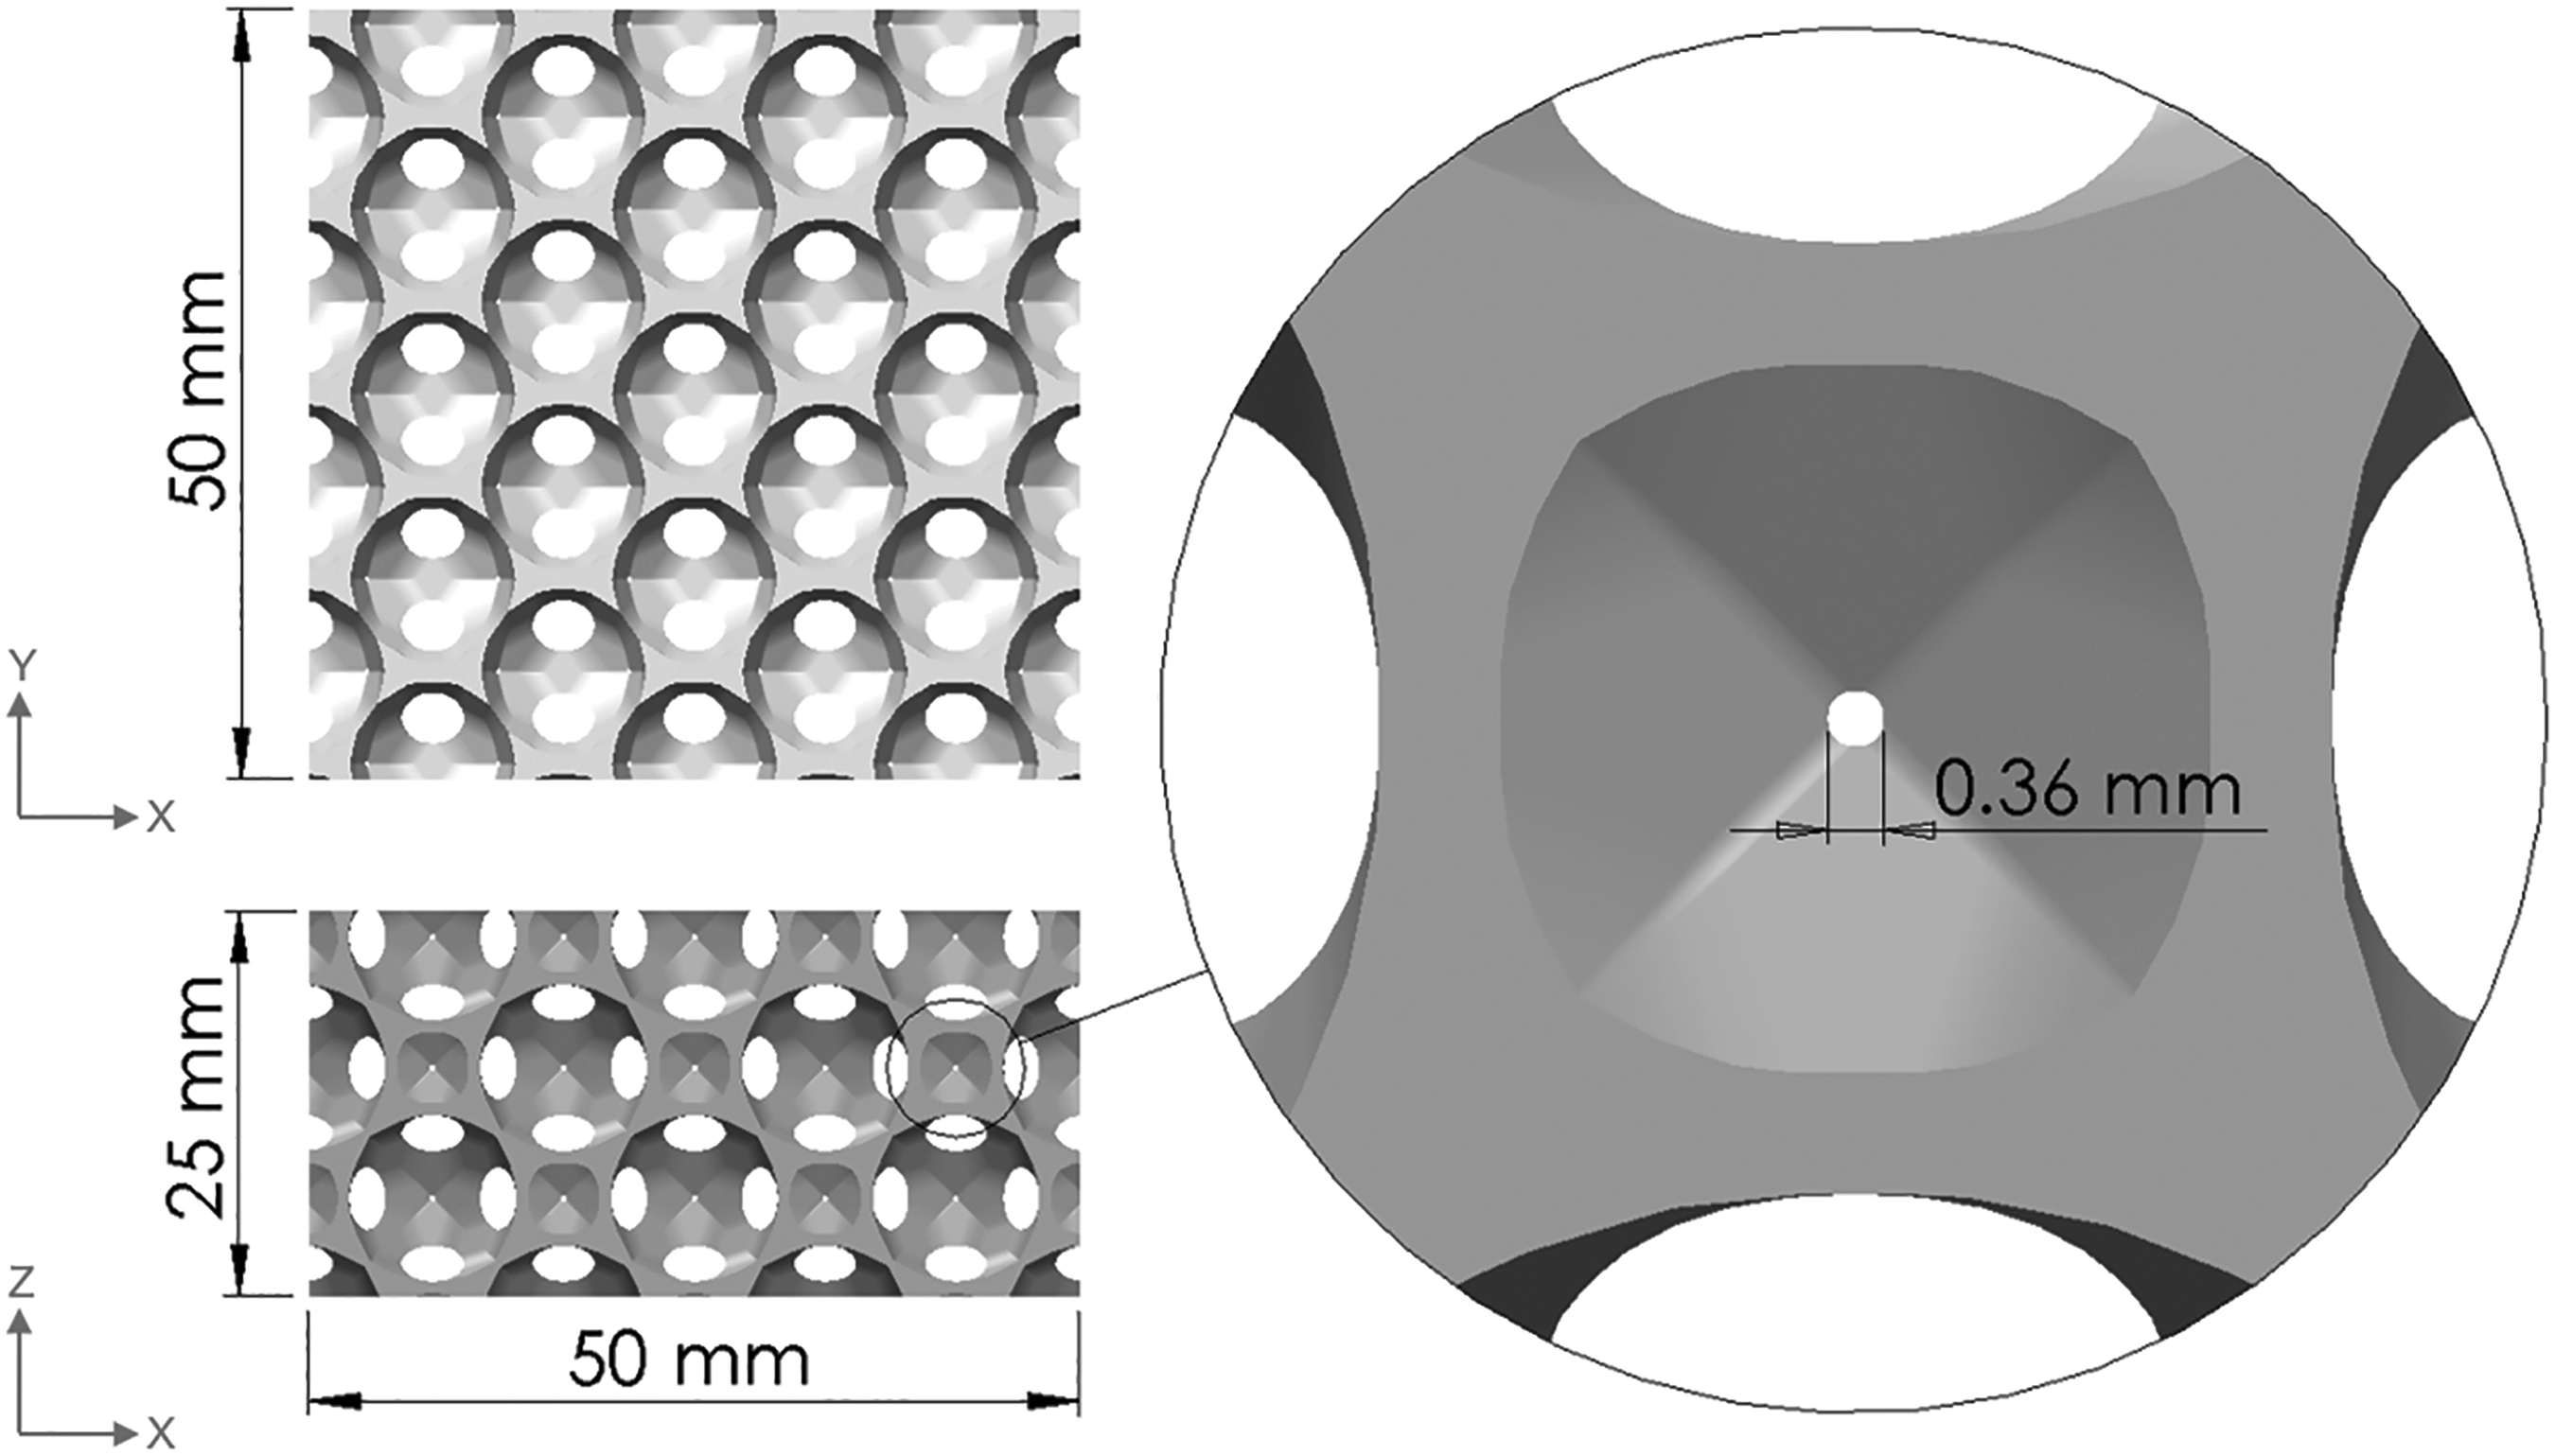
Lattice specimen dimensions featuring pore detailing.
Specimens were modeled using SolidWorks® 2015 and exported as .stl files for slicing in Cura 2.3.1 using the settings as outlined in Table 1. As these lattice structures were self-supporting, no additional support structures were required during their build.
Printer Settings in Cura 2.3.1
Test specimens were manufactured on Ultimaker 2+ (Ultimaker, Geldermalsen) MEX printers using a 0.4 mm diameter nozzle and printed using Ultimaker Nylon (Ultimaker). Specimens were printed with their z-axis, as shown in Figure 1, perpendicular to the build plate and tested in the same orientation to minimize delamination, which can occur at the interlayer boundary.35,36
A total set of 48 specimens were manufactured across three Ultimaker 2+ printers and had print times varying between 3 and 8 h per specimen depending on their specific design configuration. To account for possible interprinter variability, the specimens were split into 3 blocks to represent each of the 3 printers being used, with each block containing a full run of 16 variations, thus allowing the manufacturing phase to be screened for interprinter variation. The print order for each printer was randomized to negate the effect of environmental factors during manufacture.
Design of experiments
Five design variables were identified as having the potential to affect the energy capacity of lattice structures, therefore a design of experiments methodology was used for this study. These identified five design variables included:
strut CSA strut cross-sectional shape filleting between joints cell width cell orientation
Within this study, a 2(5-1) fractional design was chosen and implemented using Minitab 17 (Minitab, Pennsylvania) and involved a run of 16 variations with two levels. Three replications of each specimen were tested as stipulated by ASTM D3574-11 Standard Test Methods for Flexible Cellular Materials. 34
A half-fractional model was used, which enabled all of the main effects and two-way interactions between each of the variables to be analyzed and is not sensitive to interactions involving more than two factors. Higher order interaction effects are less common and tend to have significantly smaller effect sizes and, as such, their exclusion halves the total number of variations to be manufactured. It is also common practice to undertake a screening study before using a higher level design to minimize the total number of runs required. 37
When selecting levels for a factorial analysis, it was important that the differences between the levels were significantly different to evoke a response for each factor while staying within the bounds of the system being examined. It is important to note that within a screening study, the relative range between the chosen levels across factors is not relevant, as demonstrated in prior literature.38,39 In the case of this study, the aim when selecting the levels, as displayed in Table 2, was to maximize the difference between the high and low levels while avoiding level combinations that were incompatible for manufacture using MEX.
Levels for Factorial Analysis for Each Design Variable
The lower level for strut CSA was set at 2 mm2 as this was the smallest cross section that the triangular strut could be maintained on when specimens were printed on the Ultimaker 2+. Sixteen millimeters was chosen as the upper level for cell width as this was the largest cell size that could fit within a 25-mm-thick specimen with multiple layers of intact cells at 1.5 layers. The lower levels for both cell width and strut CSA were selected so that a pore still formed in the square face of the truncated octahedron. The combination of a 12-mm cell width, 4-mm2 strut CSA, and a triangular cross section produced a viable pore measuring 0.36 mm in diameter, as previously detailed within Figure 1.
The level of filleting was expressed as a percentage (%) of the straight edge length of each pore in which a fillet was applied. A clear comparison of the effect of applying the low level 10% and high level 90% fillet settings is shown in Figure 2.
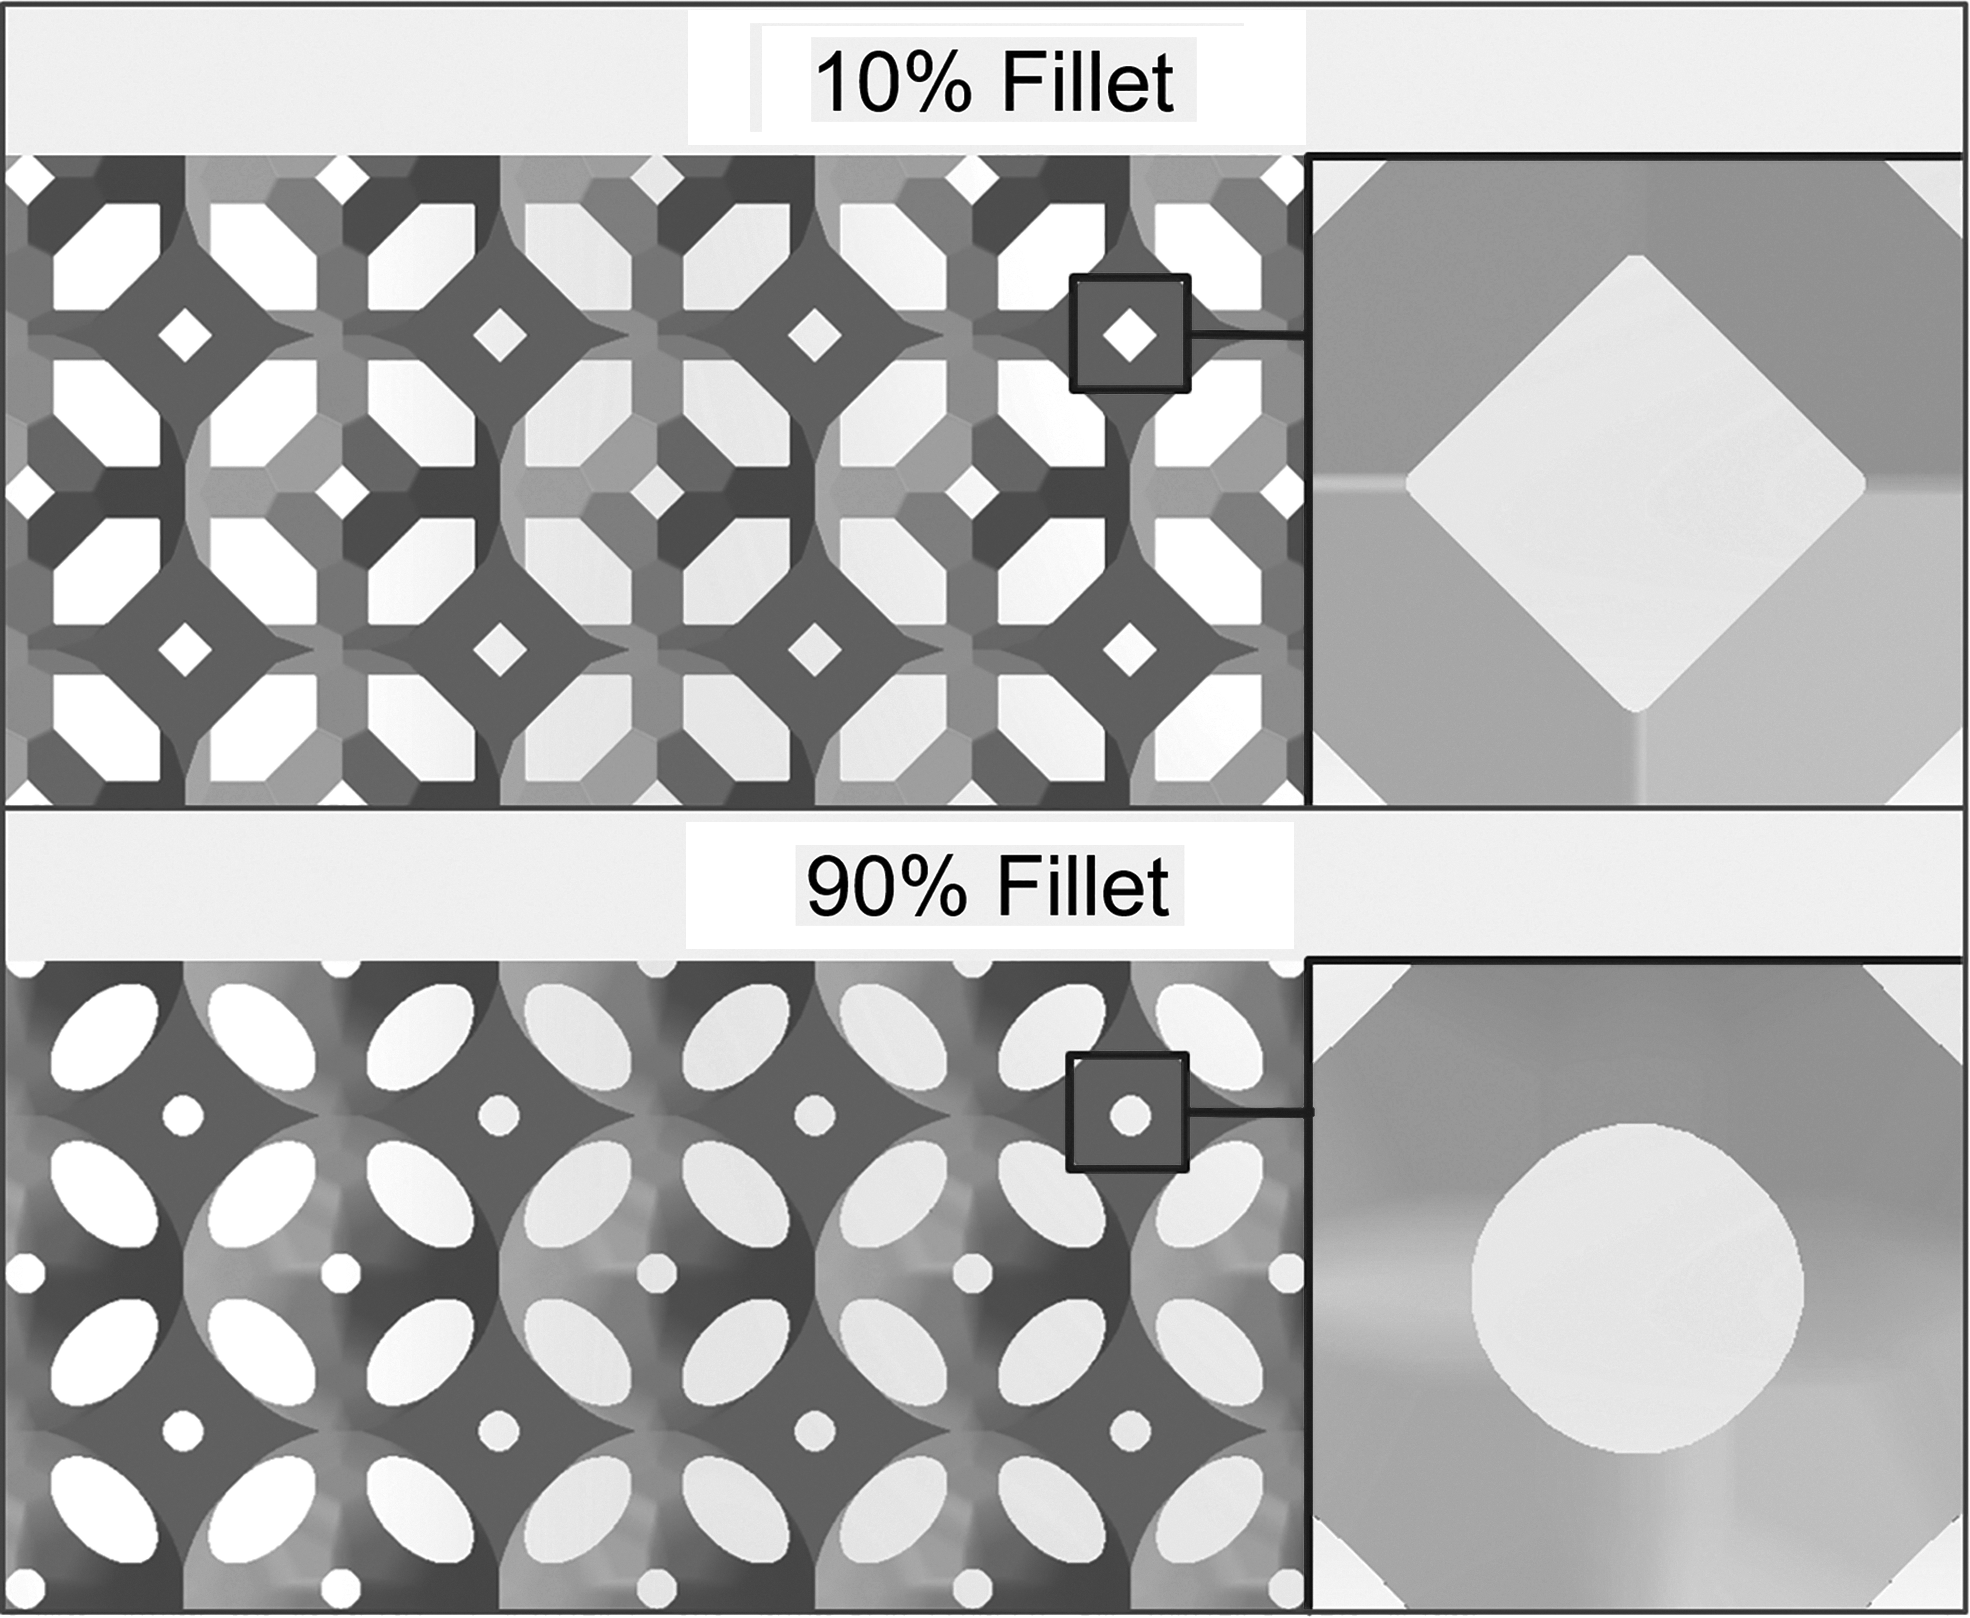
Examples featuring low (10%) and high (90%) levels of filleting.
Levels of 10% and 90% were selected to prevent excessive stress concentrations occurring at either the vertices if, for example, a 0% condition had been set or the strut midpoint if a 100% value had been set.
Two lattice orientations were used in this study, which are based on similar orientations used by Bates et al. while investigating honeycomb structures. 7 These were the ribbon and transverse orientations and are shown in Figure 3.
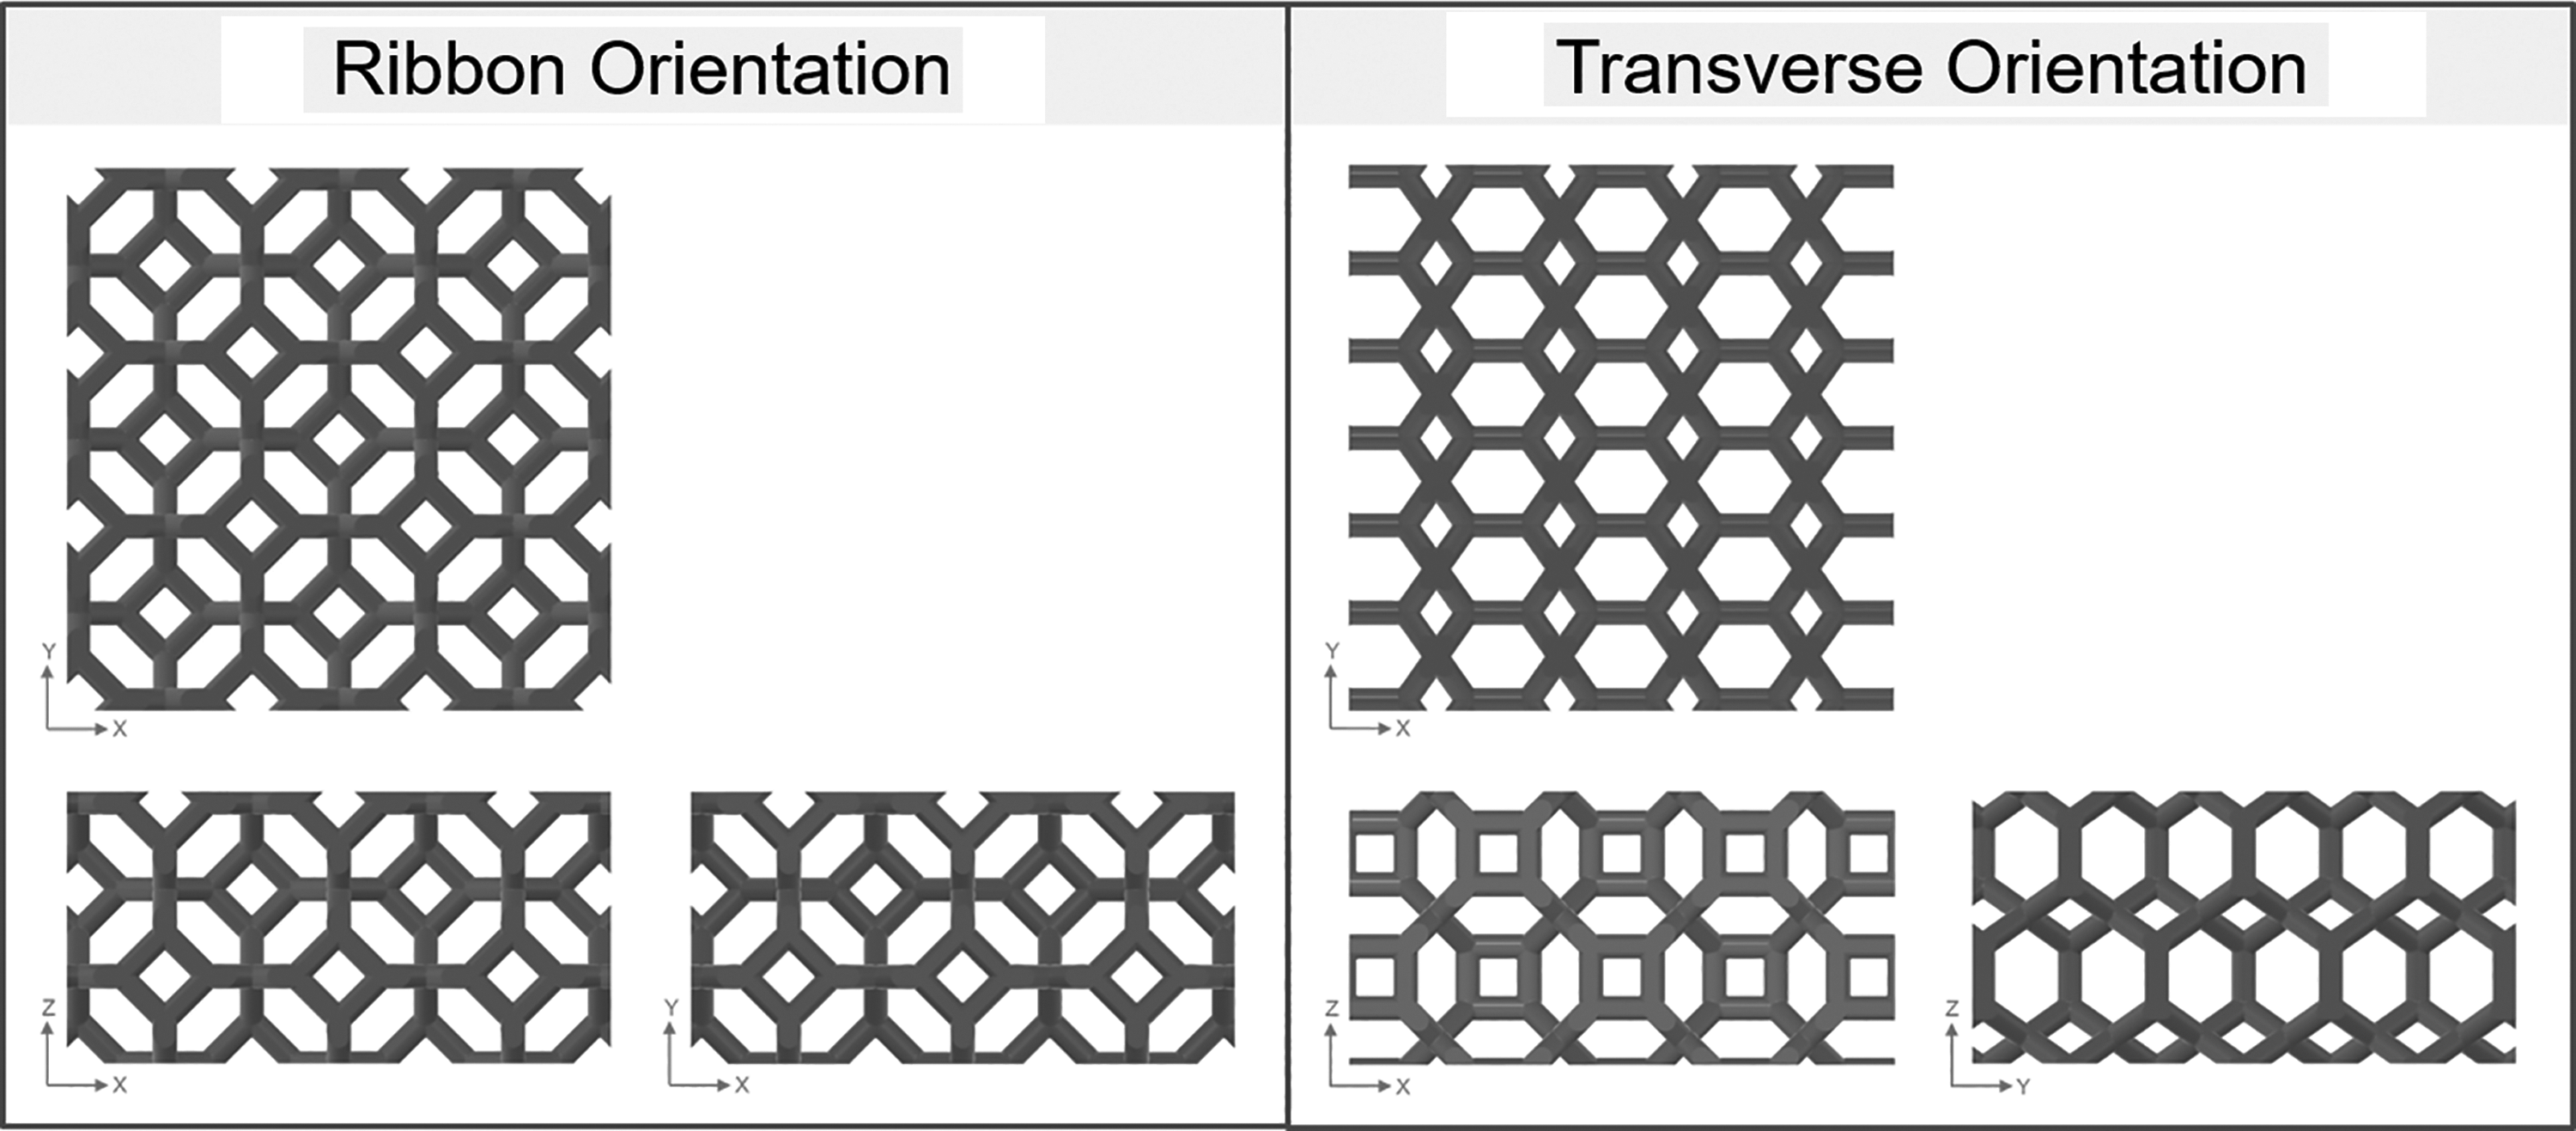
Example specimens featuring ribbon (left) and transverse (right)-orientated cell configurations.
A complete list of the specimen variations used within this study is listed in Table 3.
Cell Variations Used for Design of the Experiment
CSA, cross-sectional area.
Apparatus
All compression tests were performed using an Instron 3366 Dual Column Universal Testing System (Instron, Norwood) installed with a 10 kN load cell, with data captured using Instron's Bluehill 3 (Instron) software package. The compression protocol used was based on ASTM D3574-1134 with specimens tested in the same orientation as their manufacture, as shown in Figure 4.
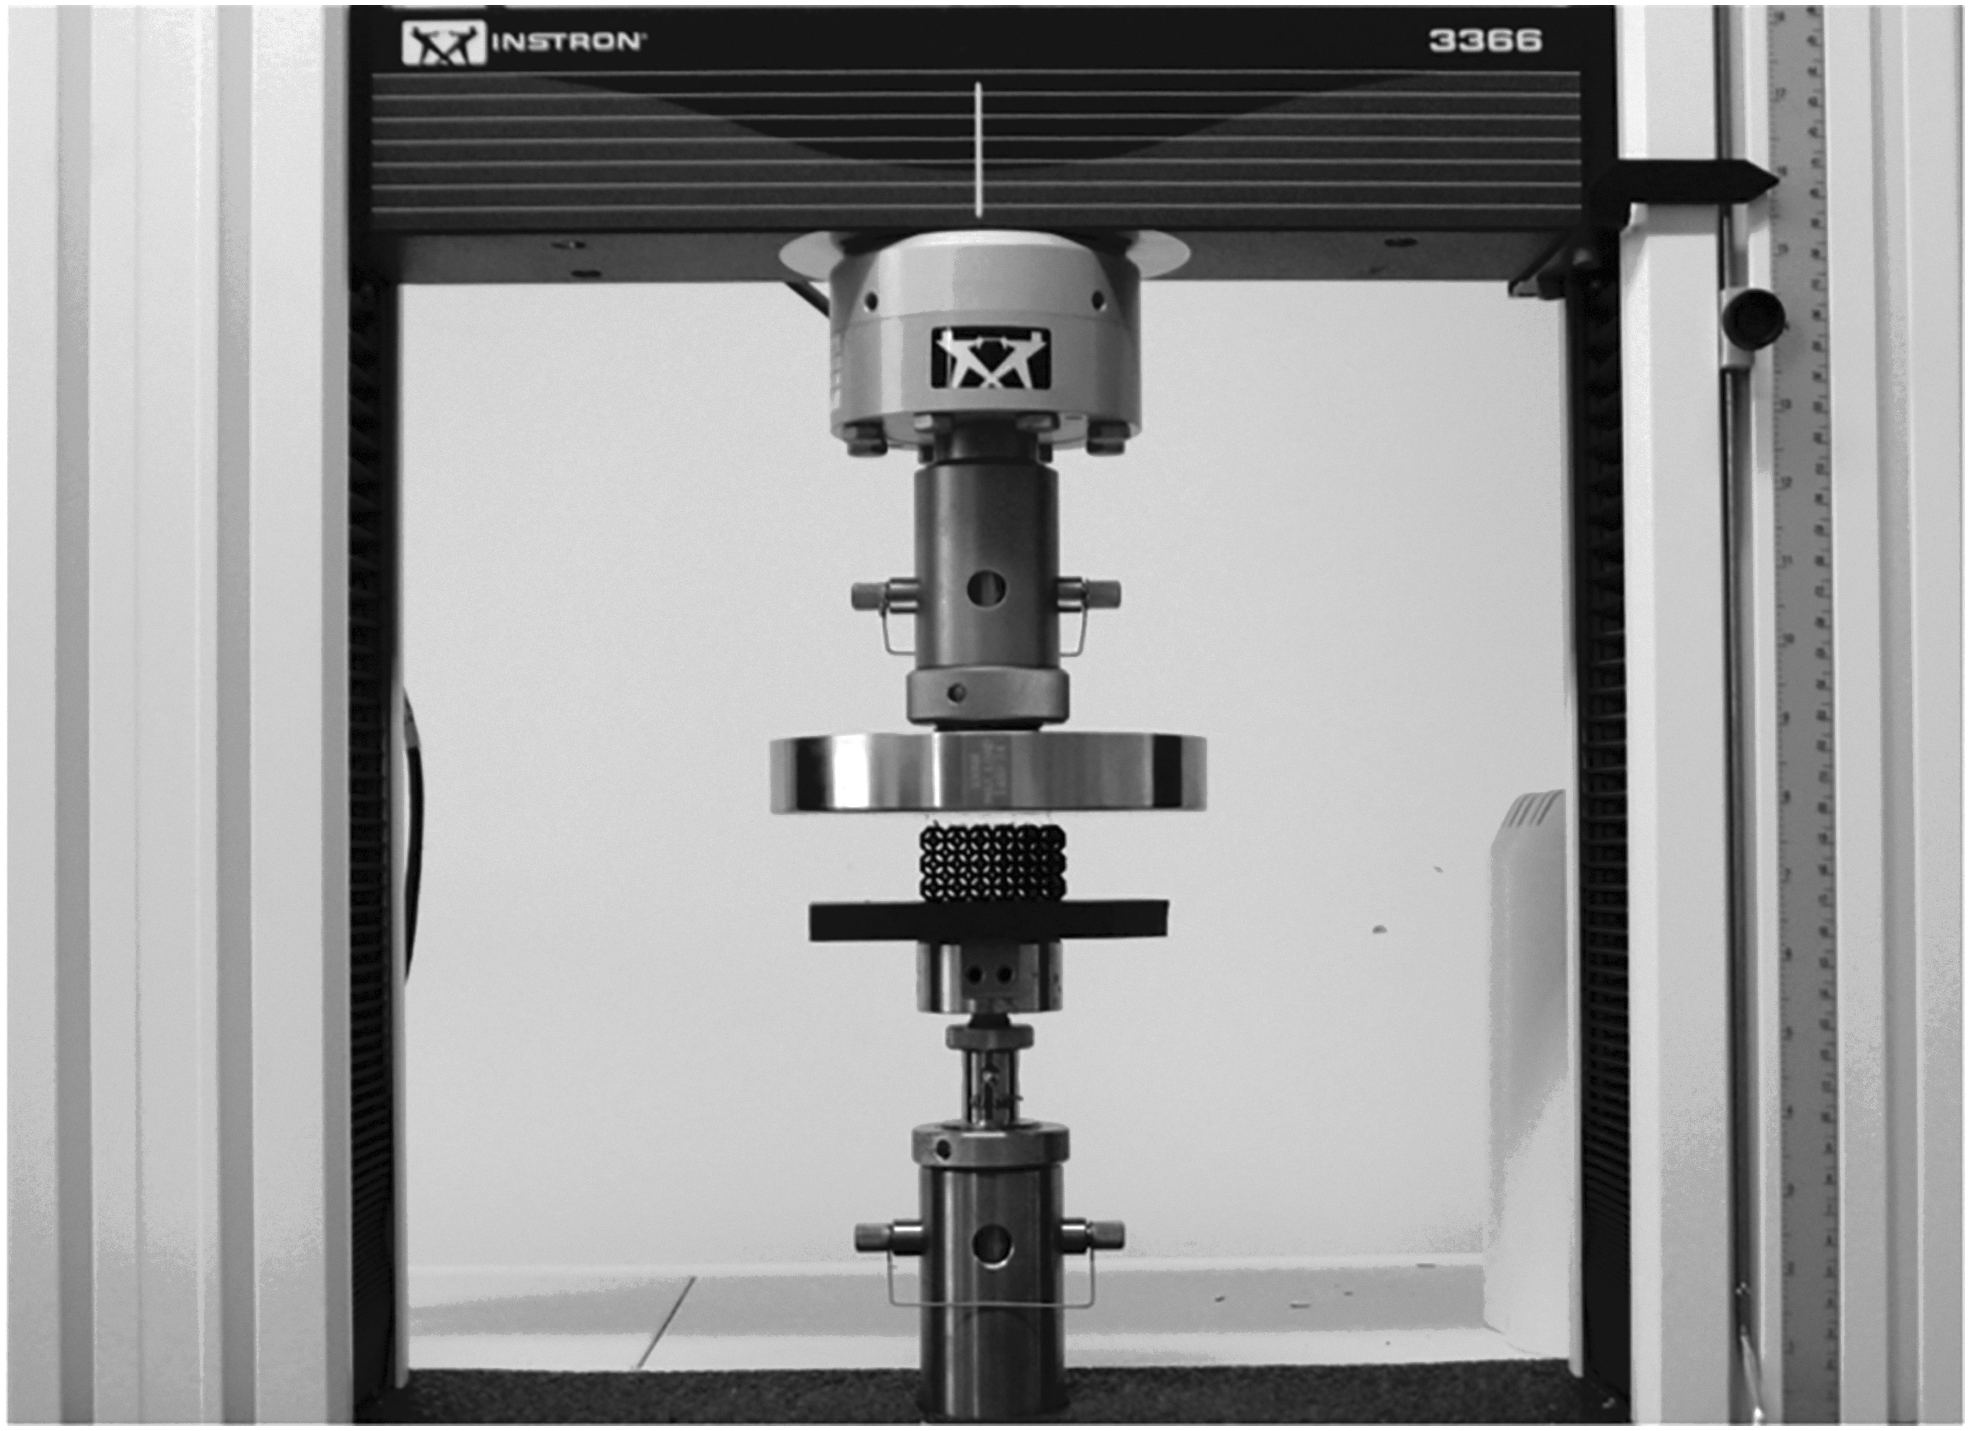
Apparatus setup.
A strain rate of 1.0 s−1 was used, and tests were terminated when the sample entered its densification phase, as indicated by a sharp increase in loading rate. Raw data were processed using MATLAB R2016a (MathWorks, Natick) to calculate the plateau stress and total energy capacity for each specimen and subsequently exported to Minitab 17 for statistical analysis.
Calculation
To calculate the energy capacity of the plateau regime, the onset strain of densification, which refers to the point on the stress–strain response that represents the border between the plateau and densification regimes, must be found. 5 The onset strain of densification marks the end of the plateau regime and is calculated by plotting the energy absorption efficiency against strain where energy absorption efficiency is given by Equation (1). 40
Energy absorption efficiency
where η = energy absorption efficiency, σ = stress, and ɛ = strain.
The onset of densification is identified by peak efficiency or the last peak of the plateau within the efficiency plot. 41
Energy capacity of the plateau regime within the stress–strain response is given by Equation (2). 5
Energy capacity
where Wd = energy absorbed by the plateau, ɛd = strain at onset of densification, and ɛy = yield strain.
The plateau stress is given by Equation (3). 42
Plateau stress
where σpl = plateau stress and ɛy = yield strain.
Results
Results of the analysis of variance are displayed in Table 4.
Analysis of Variance
Adj SS, adjusted sum of squares; Adj MS, adjusted mean squared.
Mean results and standard deviations with respect to the 16 design variations for each output are given in Table 5.
Means and Standard Deviations for Each Specimen Variation
SD, standard deviation.
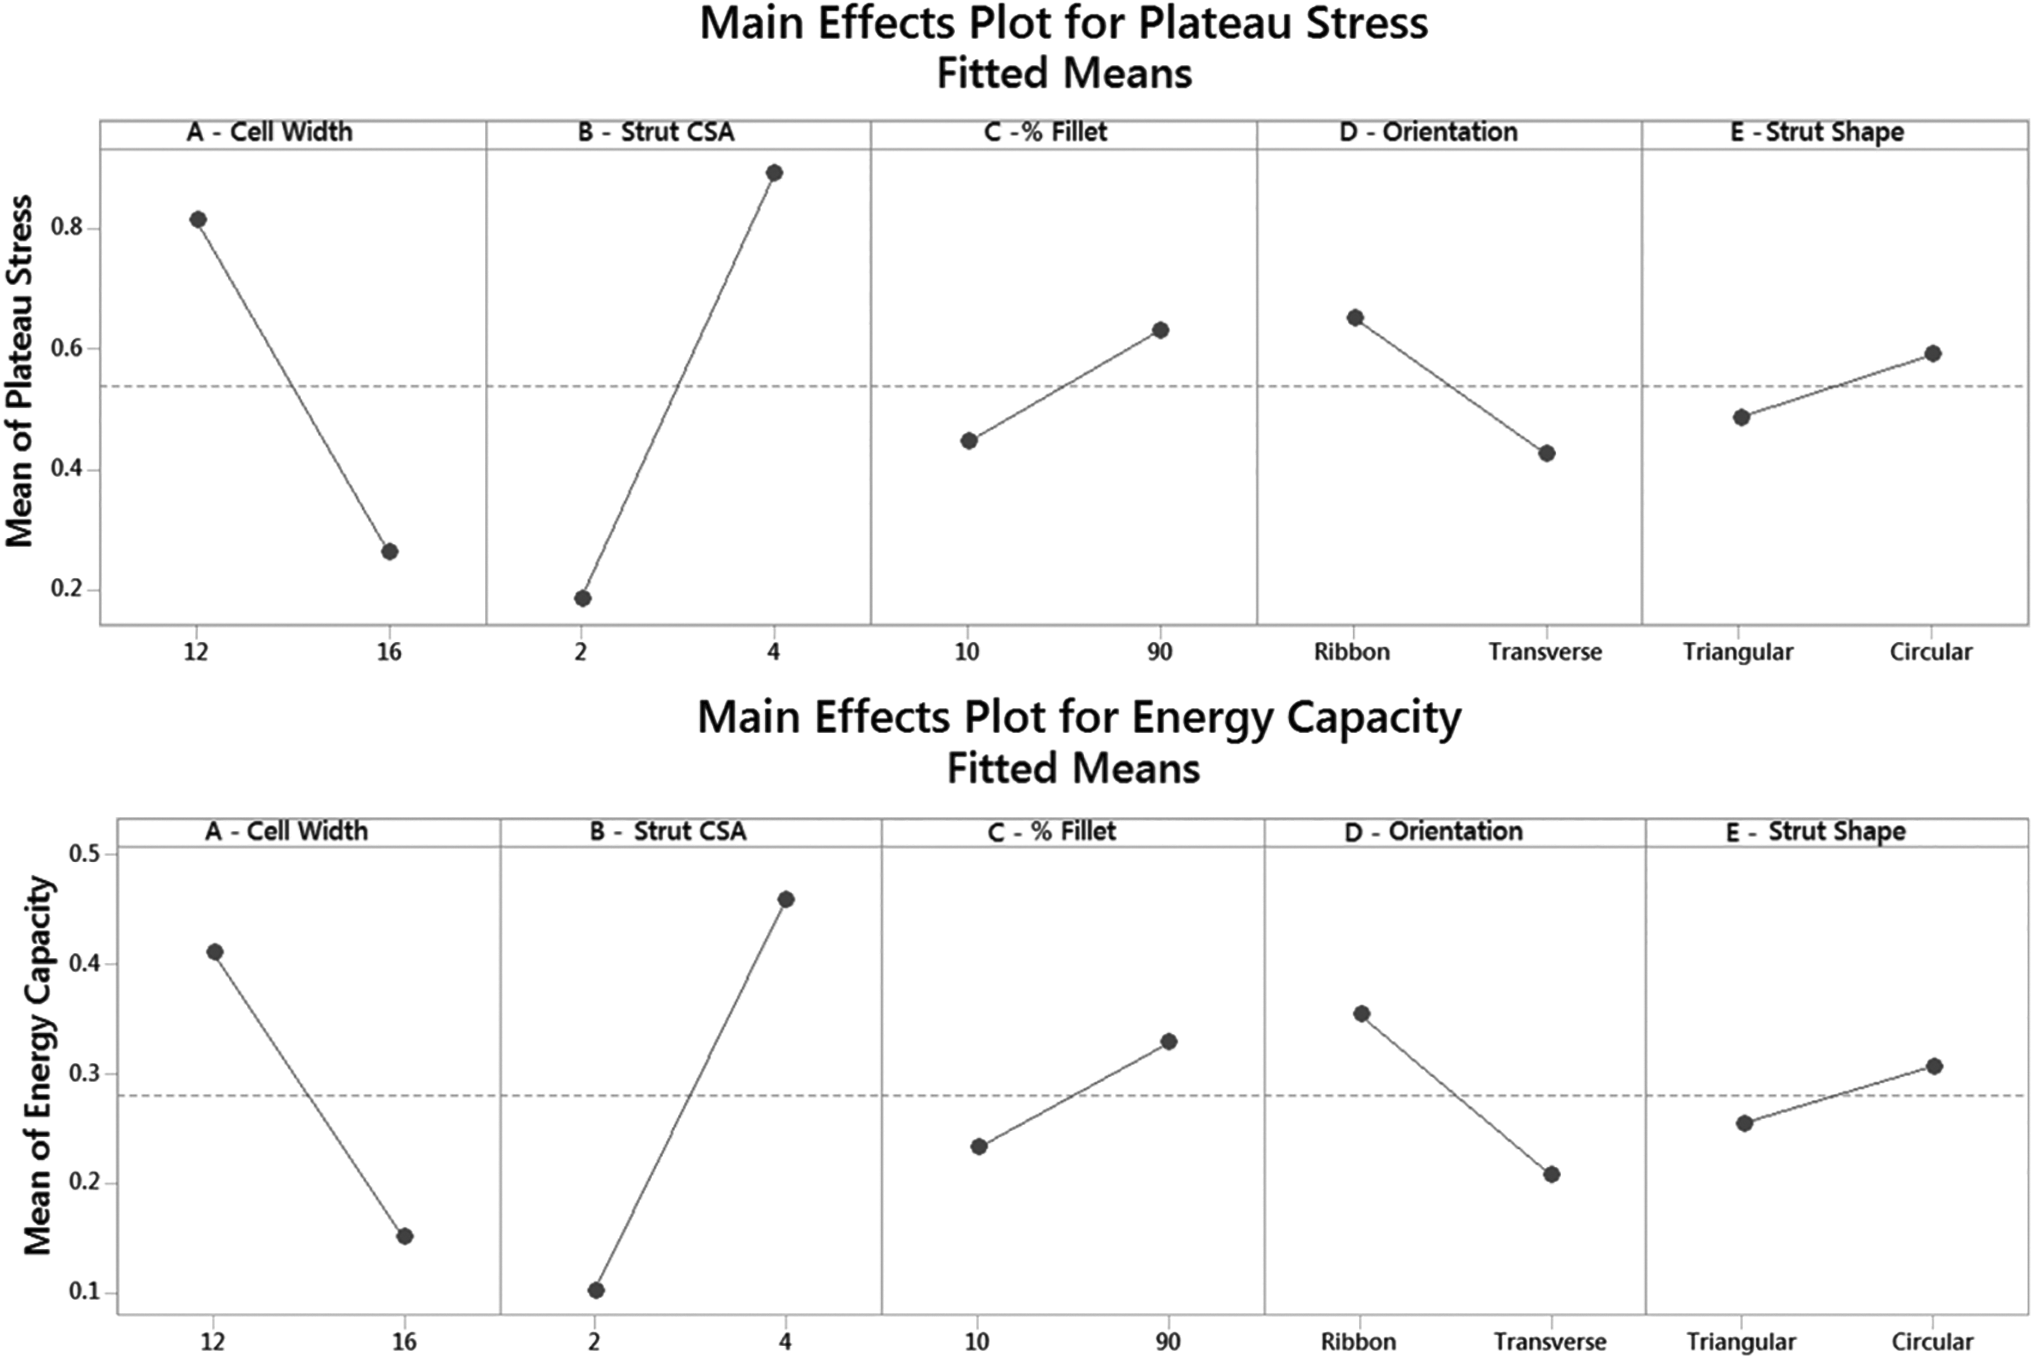
The factorial plots given in Figure 5 show that the direction and magnitude of the main effects were similar for both plateau stress and energy capacity across all five design characteristics.
Main effect plots for factorial design.
The cell width and strut CSA appear to display larger main effects than the other factors examined. This is confirmed by the larger effect sizes demonstrated by both of these factors within Tables 6 and 7.
Regression Coefficients for Plateau Stress
Coef., coefficient.
Regression Coefficients for Energy Capacity
Using Pareto charts, these effects were placed in rank order based on their effect size, as shown in Figure 6.
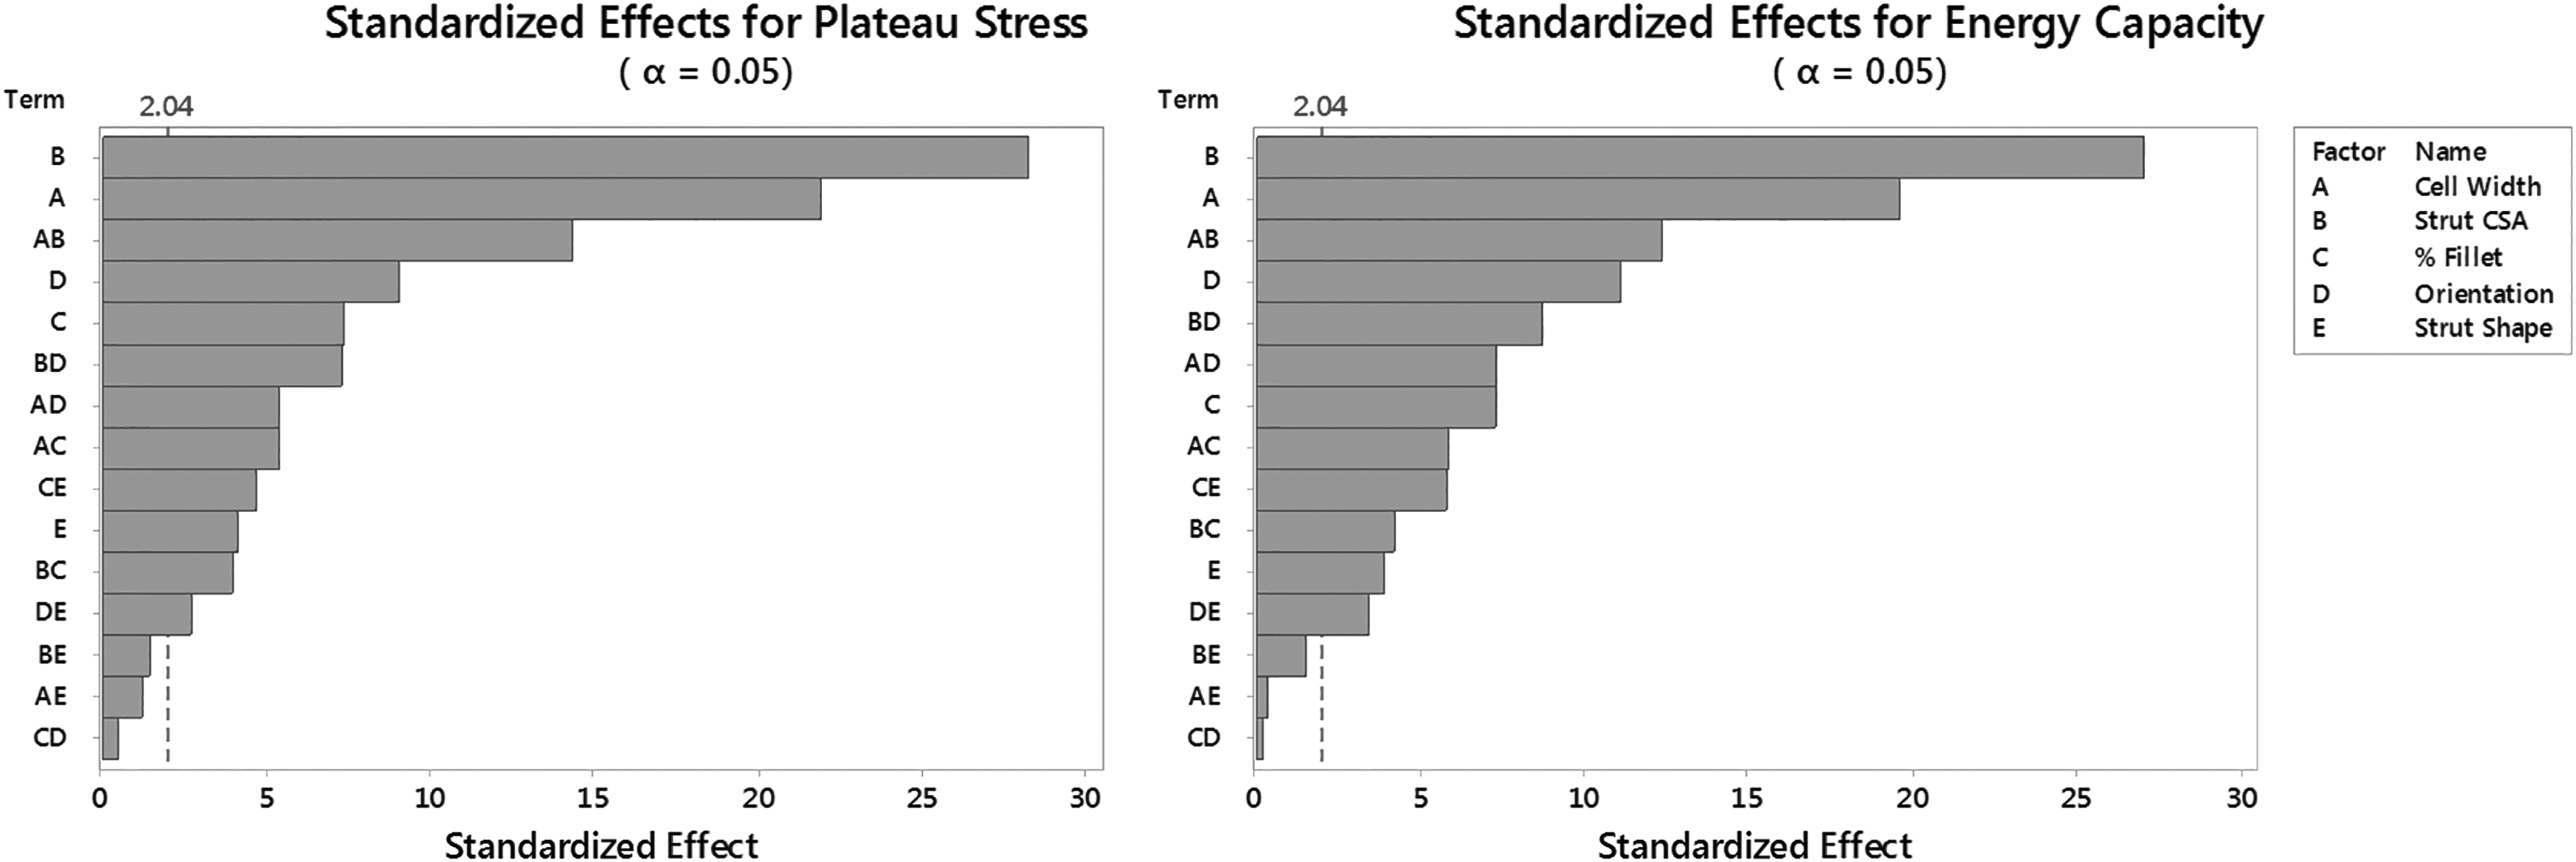
Pareto charts of effect sizes prereduction. Note that the dashed line indicates significance of the 95% confidence interval.
A technique known as backward elimination was implemented to reduce the model complexity. This involved iteratively removing the least significant variable from the analysis until only significant variables remain where significance to the 95% confidence interval is indicated by the red dashed line in Figure 6. 43 The results following backward elimination are displayed in Figure 7.
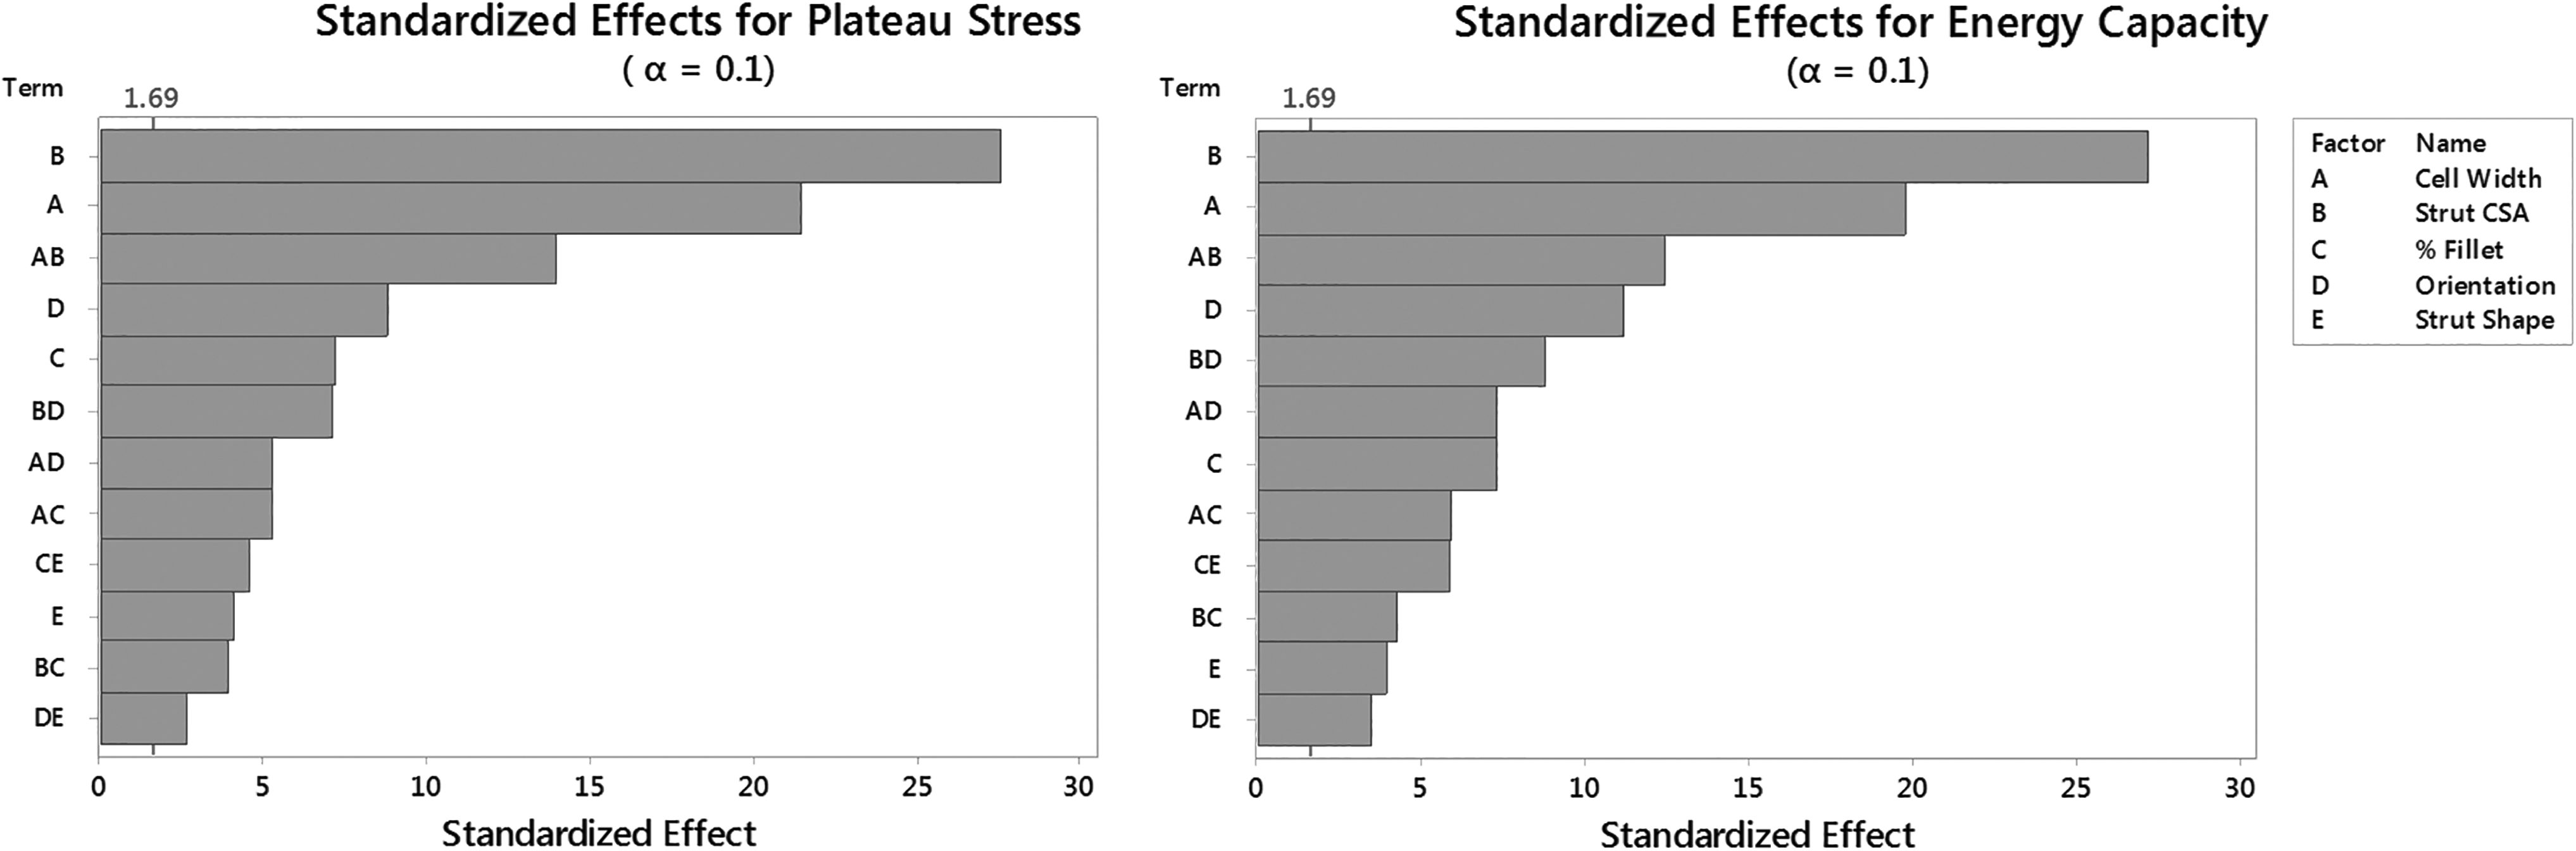
Pareto charts of effect sizes for the reduced model.
Three interaction effects were removed from the analysis for both plateau stress and energy capacity, specifically these were as follows:
cell width × strut shape (BE) strut CSA × strut shape (AE) % fillet × orientation (CD)
With nonsignificant factors now dropped from the analysis, the resulting regression models are given by Equations (4) and (5).
Reduced model for plateau stress:
Reduced model for energy capacity:
The R2 values for the plateau stress model were calculated at 94.92%, while the energy capacity model value was 98.24%, therefore indicating that these models fit very well to the data collected. The predicted R2 for the plateau stress model was 91.9%, while 96.87% was calculated for the energy capacity model. Given that the predicted R2 values for both models are close to the R2, this indicated that the models are not overfitted.
The block analysis of interprinter variation yielded p-values of p = 0.26 for plateau stress and p = 0.37 for energy capacity, which indicate that there was no significant difference between the printers used for manufacturing the test specimens.
Discussion
Strut shape had the smallest effect of all the main effects, with circular struts demonstrating larger values for both energy capacity and plateau stress. In addition, circular struts also have no edges, which enabled the manufacture of specimens with smaller cross sections. However, Brennan-Craddock 26 noted that using triangular struts significantly reduces .stl file size and, as a result, is far less computationally expensive. Where computation power is not a limiting factor, circular struts are suggested for future investigations.
Fillet percentage showed the weakest effect with both outputs of the three continuous variables. The positive correlation for energy capacity supports previous research by Vesenjak et al., 44 which showed a similar correlation in square honeycomb structures. Interaction effects occurred at higher filleting values.
Cell orientation had a significant main effect, with the ribbon orientation producing higher values for both plateau stress and energy capacity. This is in support of previous research by Bates et al. 7 when using honeycomb structures. It also demonstrated interactions with cell width, CSA, and strut shape, with the ribbon orientation displaying a larger interaction for both outputs. Given that cells in the ribbon orientation also have a smaller cell height, they are useful for applications where specimen thickness is to be minimized. It is therefore recommended that the ribbon orientation should be adopted for future research in the area of AM-based protective clothing.
Cell width had the second largest effect size with a negative correlation for both outputs. Cell width also displayed strong interaction effects with strut CSA and a slightly weaker interaction effect with both cell orientation and fillet %, both of which were effective at smaller cell widths. It is therefore suggested that cell width should be minimized where possible, within the constraints of the AM process being utilized.
Strut CSA had the largest effect, showing a strong positive correlation for both outputs. Strut CSA also displayed a negative interaction effect with cell width, while the main effect cell width displayed a strong negative correlation and the second largest effect size for both outputs.
Energy capacity is an important property for impact protection as it illustrates how much kinetic energy a lattice structure can absorb. Plateau stress is also important as it relates to the pressure transmitted to the wearer. Both a smaller cell width and larger strut CSA increase energy capacity and plateau stress. Fujikawa et al. found that a peak pressure of 1.46 MPa carries a 10% probability of a minor soft tissue injury from human–robot interactions 45 ; however, further research is needed on soft tissue injury thresholds specific to sport.
For applications that require the tailoring of lattice properties at a local level, each cell may need to be tuned individually. Of the design variables examined within this study, strut CSA is the most appropriate for this application. However, its strong interaction effect with cell width must also be considered in applications where cell size is not constant, such as within a conformal lattice structure. While this study focused on specimens manufactured solely using MEX, the factors analyzed are related to unit cell geometry and thus are not AM process specific—further investigation is, however, required to verify this.
The half-fractional model used within this study was not sensitive to curvature in the response between the three continuous variables and plateau stress or energy capacity. Use of Equations (4) and (5) is therefore cautioned until a higher resolution study is performed on these variables.
Conclusions
In this study, the effects of five geometric design characteristics within additively manufactured, truncated, octahedron lattice structures were examined in relation to their compressive response. In summary:
All variables tested were found to have significant main effects. Strut CSA was shown to have the largest effect on the performance of lattices and was suggested as the most suitable design characteristic to adjust for a cell-by-cell tailored response. Cell width also exhibited a strong main effect and a strong interaction effect with strut CSA for both outputs. This should be considered in applications such as conformal structures where the cell size may vary in the lattice. Lattice orientation had a significant main effect for both outputs, and it is recommended that a ribbon orientation should be adopted in applications where there are limits on lattice thickness. Results of this study suggest that for future work relating to all protective applications, the truncated octahedron lattice shows potential for generation of a tailored response and conformal structures.
A wide range of opportunities exist for further investigation with a view to advance the domain of AM-based protective structures, including, but not exclusive to, the development of functionally graded and conformal lattices; consideration of alternative periodic structures such as the rhomboid, dodecahedron, triply minimal surfaces and auxetic structures; the use of digital test methods such as finite element analysis; higher definition additive manufacture processes; and materials such as laser sintering.
Footnotes
Author Disclosure Statement
No competing financial interests exist.
Funding Information
This research was funded by a Loughborough University School of Design & Creative Arts Doctoral Scholarship.