
Abstract
Fused deposition modeling polymer 3D printing has become a popular versatile additive manufacturing technology. However, there are limitations to the mechanical properties due to the layer-by-layer deposition approach. The relatively low strength of the interface between layers is the cause for potential microstructural weak points in such printed components. The interface strength of 3D-printed Polylactic Acid (PLA) polymer was determined through physical tensile testing in combination with microstructural finite element method (FEM) simulations. A custom tensile specimen was created to isolate the interlayer interfaces for direct testing of interface strength. Tensile tests resulted in an average 2.4 GPa stiffness and an average 22.8 MPa tensile strength for printed specimens, corresponding to a 32.4% and 47.8% reduction from the bulk filament stiffness and strength, respectively. Sectioned tensile specimens were observed under a digital microscope to examine microstructural features such as inter-layer gaps, extrusion cross-section, and voids. These were measured to create accurate FEM microstructural model geometries. The brittle fracture that occurred during the tensile testing was due to debonding of the interfaces. This was represented in Abaqus by using cohesive surfaces. Interface strength was inferred by varying the strength of the cohesive surfaces until the simulation mechanical response matched the physical tests. The resulting interface strength of the PLA polymer was 33.75 MPa on average, corresponding to a 22.5% reduction from bulk properties. Potential improvements to the overall strength of the 3D printed PLA were investigated in simulation by parameterizing improved gap morphologies. As the size of the interlayer gaps decreased, the stiffness and strength of the printed parts improved, whereas completely eliminating gaps resulted in a potential 16.1% improvement in material stiffness and 19.8% improvement in strength. These models show that significant improvements can be made to the overall printed part performance by optimizing the printing process and eliminating inner voids.
Introduction
Additive manufacturing methods have quickly become viable engineering prototyping and fabrication processes, which are capable of creating complex geometries for a variety of applications. Fused deposition modeling (FDM), also called fused filament fabrication, is a method of polymer additive manufacturing whereby a polymer material is extruded through a heated nozzle and deposited onto a build surface in many thin layers. This technology has been researched for use in space applications, as well as by using low-cost materials and open-source hardware.1,2 The FDM 3D printing has been shown to be successful in creating printed instruments for space missions. 3 This technology has been used in medical applications to print prostheses.4,5 Researchers are developing methods to recycle biomass material to be used in a 3D printer. 6 The FDM 3D printing has been used to print composites by combining a regular plastic extrusion nozzle and a carbon fiber spool to print complex composite parts that are not possible through traditional methods. 7
During FDM printing, a filament is pushed through a heated nozzle where it melts and is deposited in a predetermined path. 8 A schematic of this process is shown in Figure 1. The path is generated by a program commonly called a slicer, which generates a gcode file of instructions for the printer to follow. Due to the layer-by-layer approach, there is an inherent anisotropy of the final parts. Mechanical properties along the x and y directions from Figure 1 are significantly stronger than in the z direction due to poor bonding between layers. 9 The layers also create corners at the interface between layers, as shown in the right image of Figure 1, and these corners create stress concentrations. It is necessary to analyze the characteristics of the FDM process to understand the mechanisms responsible for the performance and to research possible improvements.
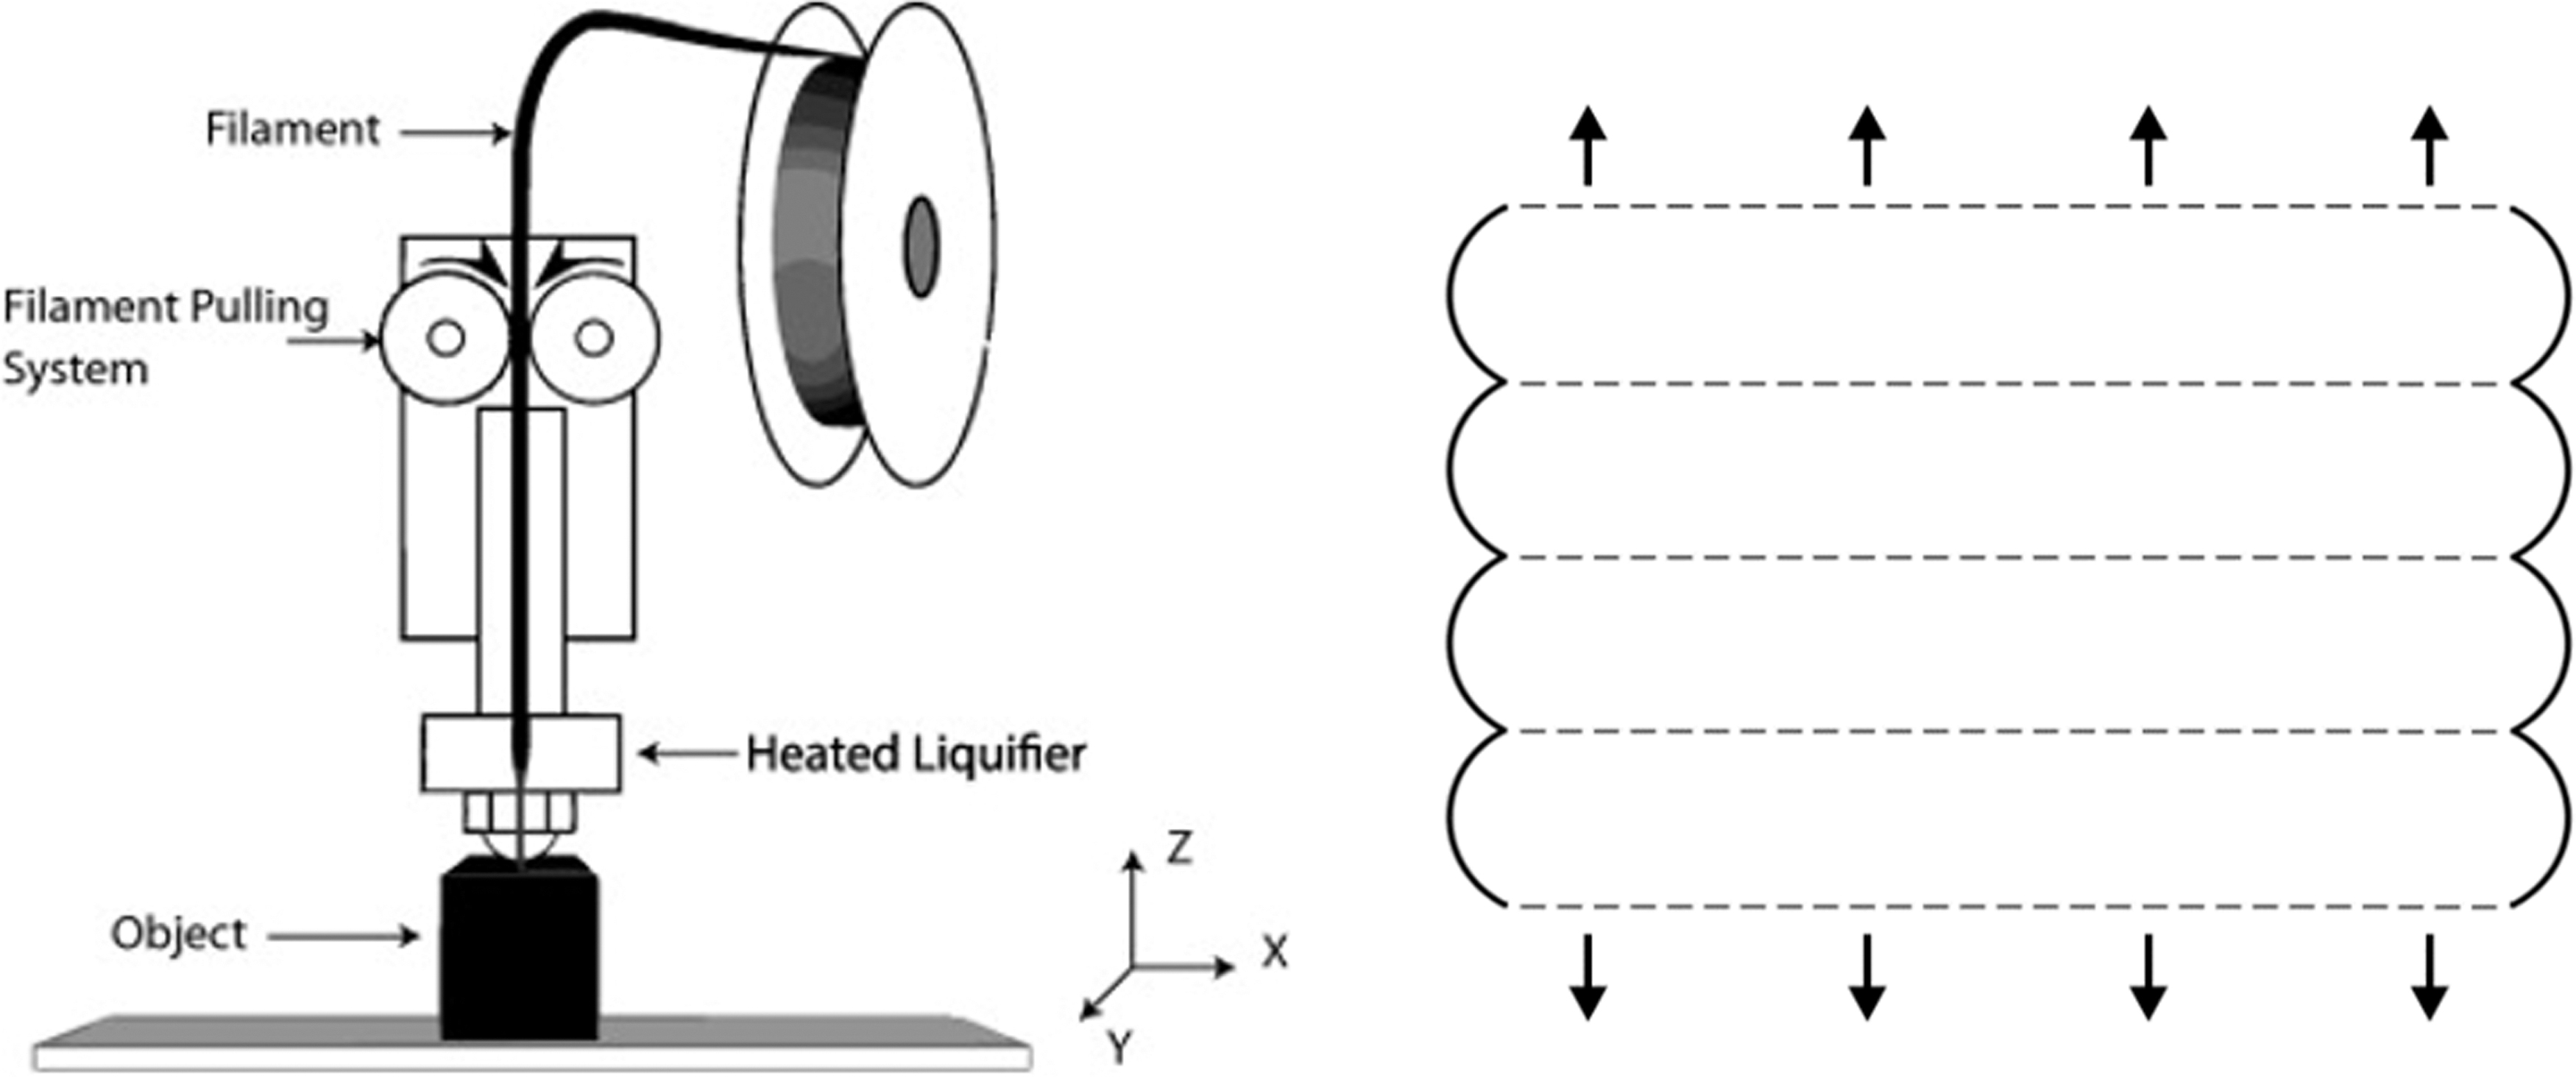
Left image shows a schematic of the FDM 3D printing process. 10 Right image shows a 2D illustration of printed layers showing interfaces (dashed lines) and applied tensile stress (arrows). FDM, fused deposition modeling.
Research has shown that the tensile strength of these materials varies significantly with the process parameters, such as the layer height and the orientation of the part due to the layer-by-layer deposition. 11 Researchers have attempted to characterize the temperature-dependent effects of this interface strength of FDM printed parts, and other process control factors such as feed rate, cooling conditions, and layer printing time. 12 The FDM layer-by-layer deposition approach relies on the last layer cooling before the new material is added. This creates weak bonding when the molten polymer is deposited onto the previous layer that has already cooled and partially solidified. Researchers have analyzed the formation of these bonds by using heat transfer analysis to quantify and predict the bond quality created during deposition. 13 The interlayer bonding strength, or interface strength, has been shown to be highly dependent on the processing parameters. 14 Previous research on the interlayer strength of 3D-printed Polylactic Acid (PLA) investigated the effect of layer height on the interlayer fracture energy. 15 The research showed that the interlayer fracture energy is dependent on layer height; however, this can be due to geometric differences rather than a change in bond strength. The bonding mechanism itself has also been the subject of study, specifically whether the bonding is the result of coalescence of the polymer or adhesion between the layers. 16 This study does not distinguish between the bonding mechanisms and refers to the bonding strength as the interlayer interface strength.
This research combines tensile tests of 3D-printed PLA specimens with finite element method (FEM) computational analysis to characterize the interface strength. This study aims at characterizing the stiffness and strength properties along the z direction of 3D-printed PLA, as well as at discretely modeling the microstructures to determine the strength of the interlayer interfaces. A novel tensile specimen preparation method was created to isolate the interlayer bonds to directly test the strength in tension. Tensile tests and computational finite element modeling of the microstructures were then combined to determine the interlayer bonding strength. These models were subsequently used to predict the possible improvements to the mechanical properties of the FDM parts that can be achieved through microstructure refinement.
Methods
To completely isolate the effect of these interfaces, and to correlate the results with computational FEM models, a custom tensile specimen design and preparation procedure was created. These tensile specimens were printed in an upright orientation such that the tension is normal to the planar interfaces. The specimens were subjected to displacement controlled uniaxial tension until failure. The right image in Figure 1 shows the direction of the applied tension, pulling the interfaces apart. The strength of 3D-printed parts in this orientation is entirely dependent on the interface strength. The stiffness and strength of the 3D-printed PLA were compared with the bulk PLA properties, and the mechanical performance reductions were assessed.
FDM interface modeling overview
In combination with physical testing, computational FEM modeling of the microstructures in these FDM-printed parts will illuminate the mechanism, leading to the demonstrated property reduction. The models were created in Abaqus/CAE to replicate the extrusion geometries and the interface bonding that occurs in the specimens. Validity of the model depends on parity with the physical geometry of the test specimens. Careful considerations were given to the design and processing of the 3D-printed tensile specimens to create a uniform cross-section that could be modeled efficiently and accurately. In addition to correctly matching geometry, the material properties must be correctly determined from the original filament to determine the bulk PLA properties. Filament tension tests were carried out to ascertain the stress versus strain curve to then be imported into Abaqus.
Finite element modeling was used to determine the interface strength between printed filament lines by employing bulk properties and varying the interface strength to match the failure of the printed specimens. Two different microstructures were tested and modeled to ensure that the interface strength was consistent and not due to geometric variations. The geometry of the simulated printed specimens was then varied to evaluate the effects of improved print geometry on overall stiffness and strength. Modeling interface strength was achieved by defining surface-based cohesive behavior between the layers and extrusion of the model. Zero-thickness cohesive surfaces are designed to represent interface failure governed by a traction separation law set by the user. The strength of these surfaces was varied until the simulations matched the tensile tests. The procedure was repeated with both microstructures, and the results were compared. The resulting interface strength was imported into various models with improved geometry to predict the possible improvements to the overall printed material performance.
Custom tensile specimen design and processing
A specially designed tensile specimen and preparation procedure was developed to isolate the extrusion interface microstructure and create a uniform extrusion that can be easily modeled in computational Finite Element Method (FEM) software. The 3D printer nozzle size that was used was of 0.4 mm diameter, and the layer height was 0.2 mm. Tuning of the machine parameters and filament diameter was completed to achieve the most consistent microstructure possible. The printing process creates a nonuniform cross-section due to the so-called “seam” that is caused by the starting and stopping of the perimeter. This creates a small molten zone that is inconsistent with the general material microstructure. The custom specimen design eliminates this molten zone and achieves a uniform microstructure in the specimen. A specialized slotted shape shown in Figure 2 was designed to be printed smoothly with as little acceleration as possible on the flat surfaces and no stopping in the specimen area. This part is printed hollow, with no infill and only external perimeters, creating two solid test specimens from each print. The two flat sections are cut out of this part in the shape dog-bone tensile specimens. By varying the number of perimeter extrusions (sometimes called walls, shells, or skins), the wall thickness of the specimens can be varied. Figure 2 shows the number of (wall) perimeters set to 4. To ensure that the interface strength is not dependent on the number of perimeter extrusions, specimens with both 3 and 4 perimeters were tested. In this work, these specimens will be referred to as three-extrusion and four-extrusion.
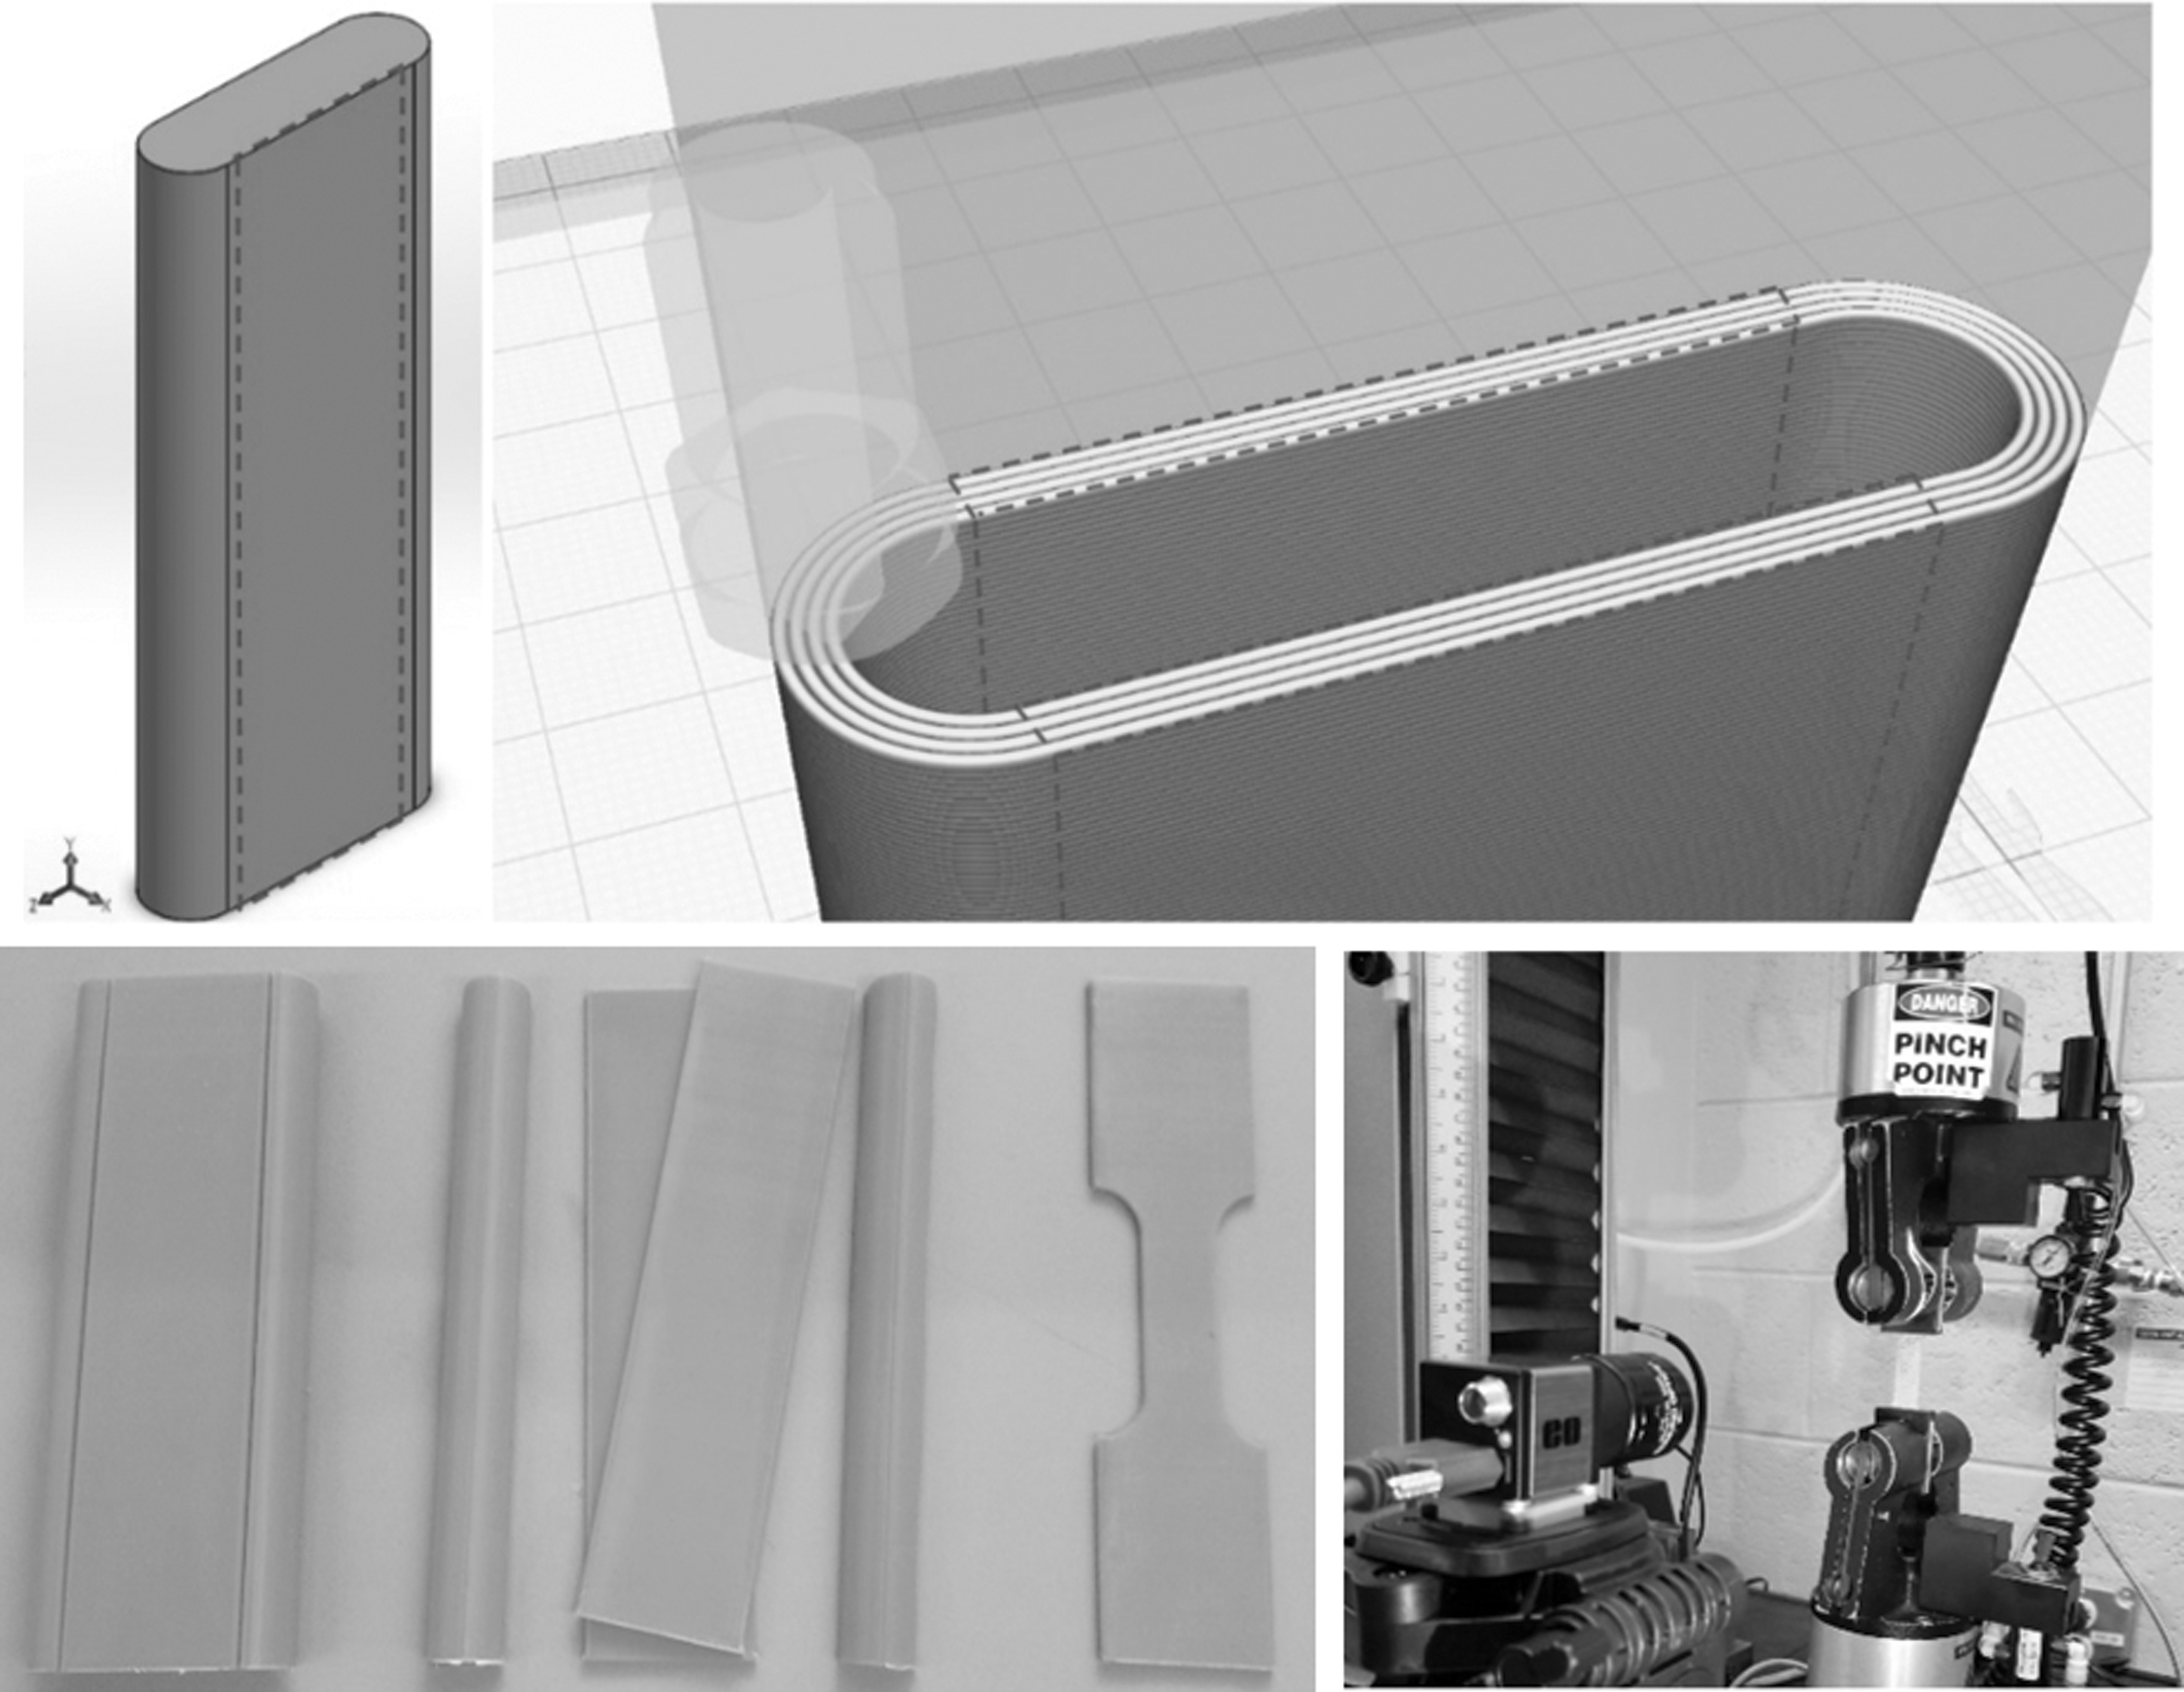
Custom slot design (top left) and close-up view of four-extrusion configuration layer preview showing the nozzle position where the layer seam occurs (top right). Dashed lines signify flat sections to be cut out for specimen fabrication that isolates extrusion interfaces. FDM tensile dog-bone specimen in various stages of the laser cutting preparation (bottom left). Experimental tensile test setup with USB camera video capture for DIC strain measurement (bottom right). DIC, digital image correlation.
From each slotted print, the two flat sections shown in the dashed lines shown in Figure 2 will each be cut out to create a tensile specimen that isolates extrusion interfaces. Cutting creates sharp flat edges and significantly reduces the matching computational model. The interface strength is then isolated from additional microstructures or edge effects that are not representative of the general interlayer bonding. The printed slot specimens were placed into a laser cutter to cut out the flat sections. The stages of the laser cutting process are shown in the bottom left image of Figure 2. After laser cutting, light sanding of the edges removed the melted edges created during laser cutting to create a flat rectangular specimen area.
The specimens were tested on an Instron 5564 test frame with a 1 kN load cell at quasi static loading rates until failure. Strain was measured by a custom digital image correlation (DIC) system by using an Edmund Optics machine vision USB camera and open-source software. The experimental test setup is shown in the bottom right image of Figure 2. Stiffnesses of the specimens were calculated by taking the average strain in the gauge section and taking the slope of the stress versus strain curve. The strength was determined by the maximum stress recorded for the specimens. The results of the tensile tests were used to compare and validate the FEM simulations.
Cross-section microscopy for microstructural FEM model generation
To accurately simulate the behavior of these 3D-printed materials, it is important to understand the microstructure created during the FDM process. The printer was tuned to reduce defects or voids, but gaps still occur between extrusions laid side by side. Specimens as previously described were set in epoxy and polished on a Struers LaboSystem polishing machine to obtain a clear view of the layers. After polishing, the cross-sections of the tensile specimens were viewed under a Keyence VHX-F series digital microscope. Figure 3 shows the magnified view of the sectioned specimens. The polishing reveals the gaps and allows for accurate measurements and generation of the microstructures in FEM software.
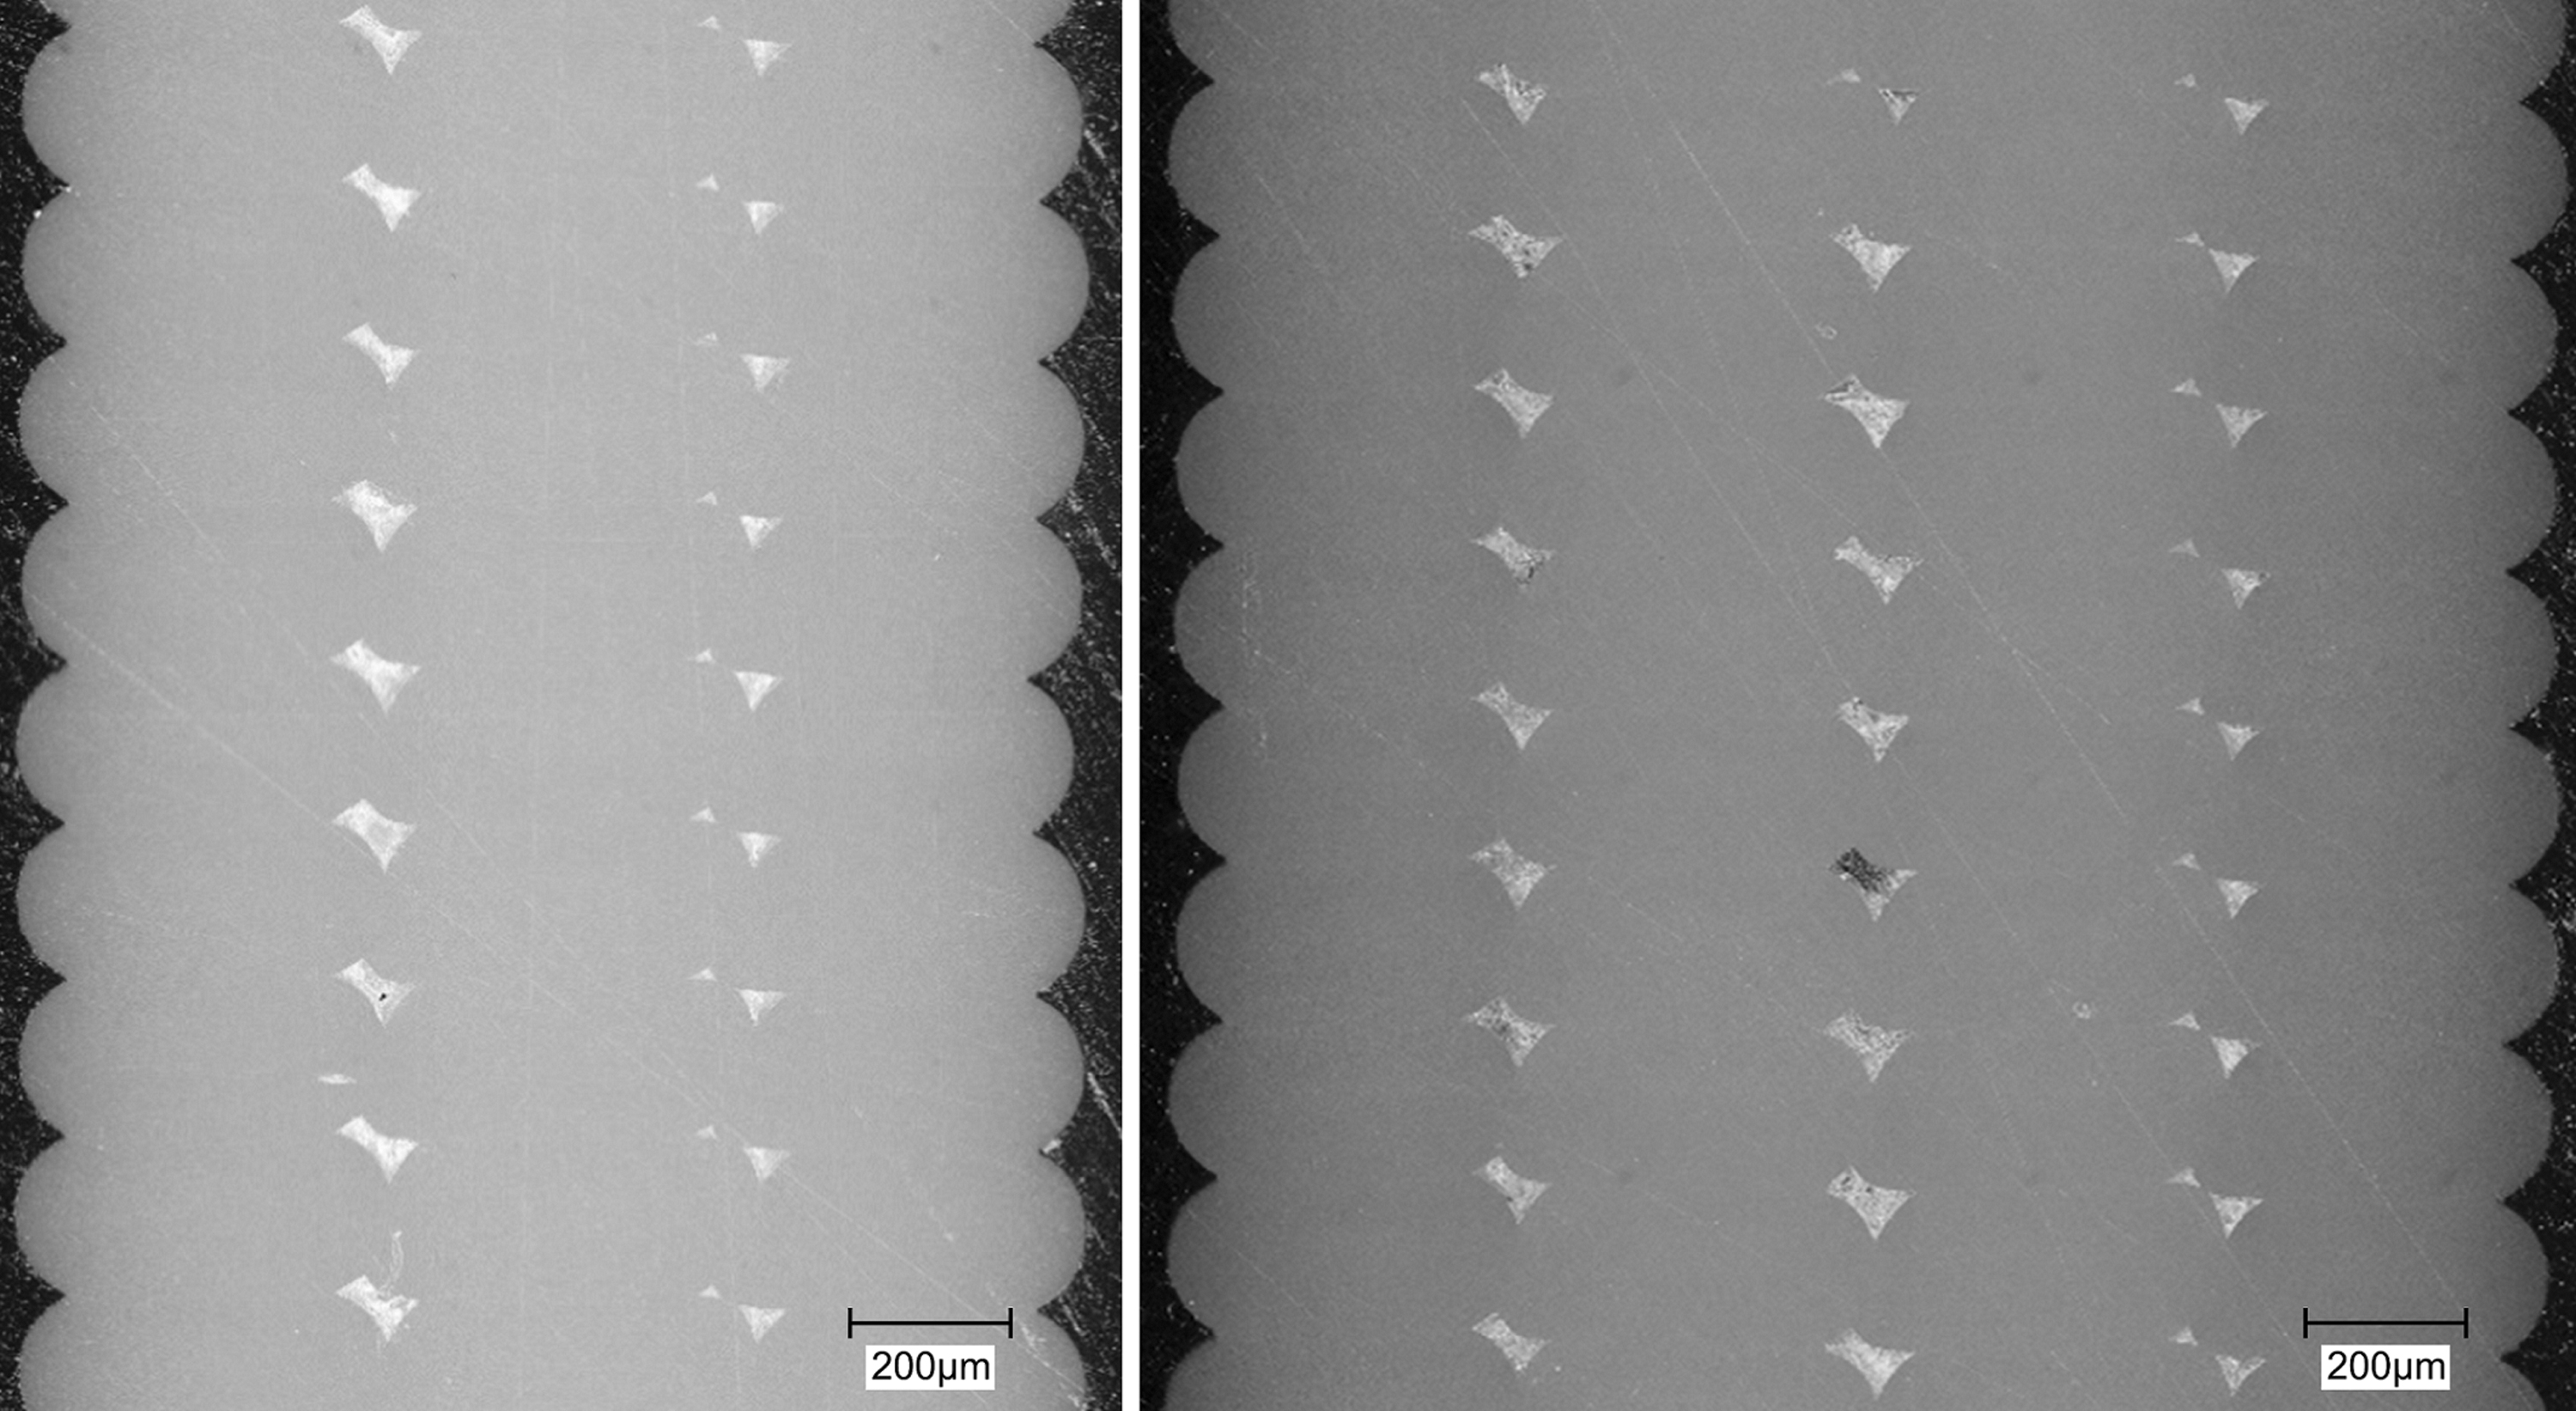
Digital microscope images of three-extrusion (left) and four-extrusion (right) polished specimen cross-sections. The asymmetric gap morphology is created by the order in which the layers are deposited. In both images, the right-most extrusion is deposited first, followed sequentially from right to left. The extrusions overlap and rest over the previous one, while not fully filling the available space, leading to the void shapes observed.
The printed specimens tested in this study had gaps between extrusions, as is common in all such printed materials. The gaps showed a slight misalignment and asymmetry. This asymmetry of the gaps is caused by the extrusion process. Referring to Figure 2, the inner perimeter of the slot design is extruder first, followed by the next outermost perimeter until the final exterior perimeter is deposited. Ideally, the molten polymer completely fills in the volume when it is deposited next to the previous layer, but gaps and voids form between perimeter extrusions. In Figure 3, the right-most perimeters of both images are the first to be deposited and the gaps show how the next extrusion slightly rests over the previous one. These unique morphologies contribute to the overall mechanical behavior and failure response; therefore, computational models were created to match this geometry as closely as possible. Digital measurement software was used to carefully trace each gap of select microscope images. The three-extrusion specimen had two distinct columns of gaps of different dimensions. The average length and width of the gaps were matched in the model, and the radii were adjusted until the model gap area matched the specimen average gap area. The same procedure was repeated for the four-extrusion specimen, and the resulting models are shown in the top images of Figure 4. An additional model with five extrusions was created to verify that the interface strength is a material property that is not dependent on the geometry and number of extrusions. This model is shown in the bottom image of Figure 4.
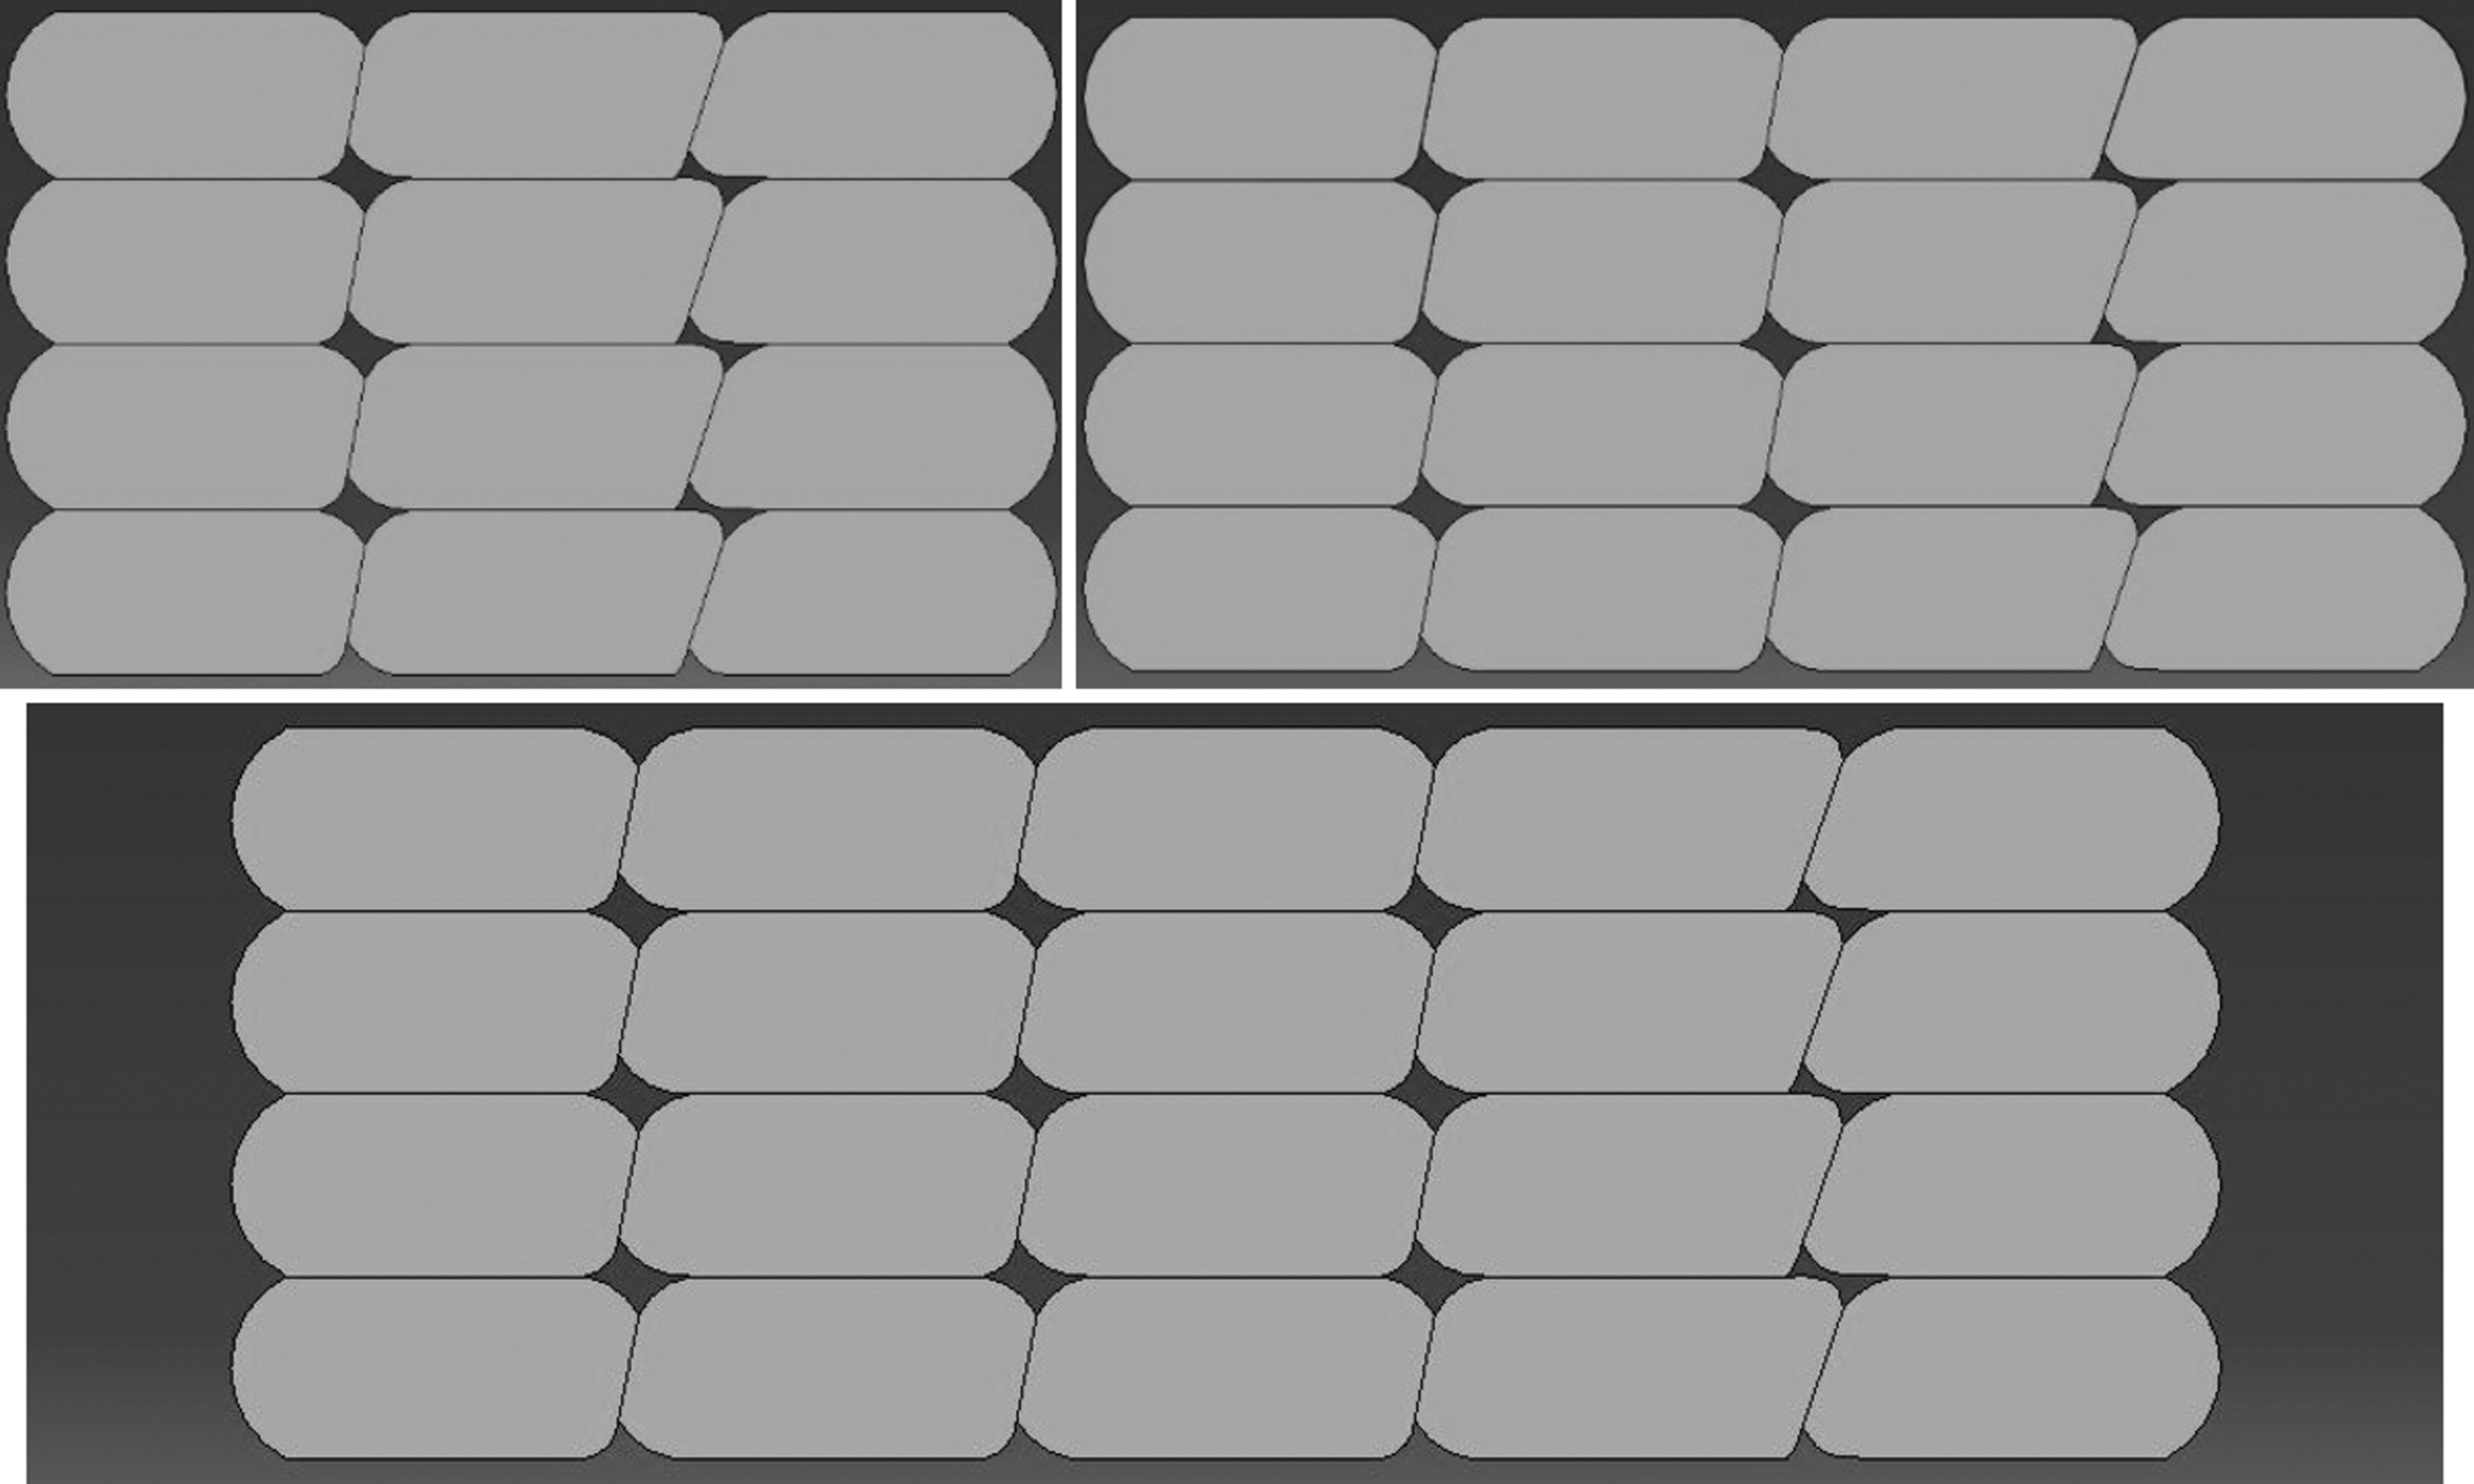
FEM models of three-extrusion and four-extrusion FDM 3D printed tensile specimens (top), and five-extrusion model (bottom) to determine geometric of additional perimeters on the interface strength. FEM, finite element method.
Simulations were run to determine the interface properties between printed layers. The properties of each extrusion were set to match the measured continuum properties from the filament tensile tests. Boundary conditions were designed to directly match the physical tests. The top surfaces were assigned a displacement boundary condition in the vertical direction in tension, and the bottom surfaces were held in the vertical direction. Abaqus C3D8 eight- node brick elements were used with cohesive surfaces defined between subsequent layers. The depth of the model was 1 mm, about a 10th of the printed tensile specimens. Symmetric boundary conditions were applied to the faces of the model in the yz plane (Fig. 5) to extend the depth of the model while reducing mesh size and computational time, though this was not necessary and did not noticeably alter the results. Although the models were created to match the tested tensile specimens as closely as possible, the models do not capture all possible defects in the physical specimens. Microvoids and defects within the extrusions are possible and would not be reflected in the computational models. However, the intent is to capture the interlayer bonding strength, as it is the weak point that is responsible for failure in the z printing direction. The carefully designed specimen and preparation techniques attempt to create uniform specimens to isolate this interlayer interface strength as a material property.

Matching geometry model 3D view (left), and matching geometry model mesh (right), with dashed black lines show the locations of the cohesive surface definitions.
Material properties of the precursor polymer filament previously measured through tension tests were used in the simulations. The elastic/plastic properties of the filament were included.
Results described later show the brittle failure that occurs when testing printed parts in this orientation. The interlayer interfaces debond cleanly in a single plane, and this can be represented by using surface-based cohesive behavior. These cohesive surfaces were defined on the surfaces along the black lines in Figure 5. These cohesive surface properties were varied until the stress–strain response of the simulation matched the stress–strain response of the previously described experimental tests. This interface strength represents an important property in printed polymers, and this feature does not exist in cast/bulk polymers. Once the interface properties were determined, they were employed in a parametric study of print morphology. The cohesive surface property that led to results that matched physical tensile tests was the interface strength of the printed polymer.
Unstable brittle fracture occurs at these interfaces and debonds the layers along a single plane. This suboptimal bonding is the primary mechanism for the reduced strength along the z direction of FDM-printed polymers. Cohesive surface contact properties were defined between extrusions to represent the interlayer bonding characteristics. The black lines in Figure 5 indicate where these cohesive surfaces were defined. The cohesive behavior used a traction-separation behavior.
Parametric study of the effect of inter-extrusion gap size on mechanical properties
The interface strength property determined from the previous models was used to investigate the potential improvements that can be achieved by reducing or eliminating the gaps between the extrusions. The models in Figure 6 were generated to investigate these potential improvements by creating symmetric gaps of varying sizes to more clearly isolate the effects of print geometry and to be able to use as a reference for further varied models. The symmetric gap model was created to homogenize the gap geometry but keep the width and height of the gaps consistent with the matching model to keep the interface area equal. The radii of the rounded corners were adjusted until the gap areas matched to create a similar behavior to the original geometry. From there, the size of the gaps was reduced to study the stiffness and strength improvements to the full-scale printed parts.
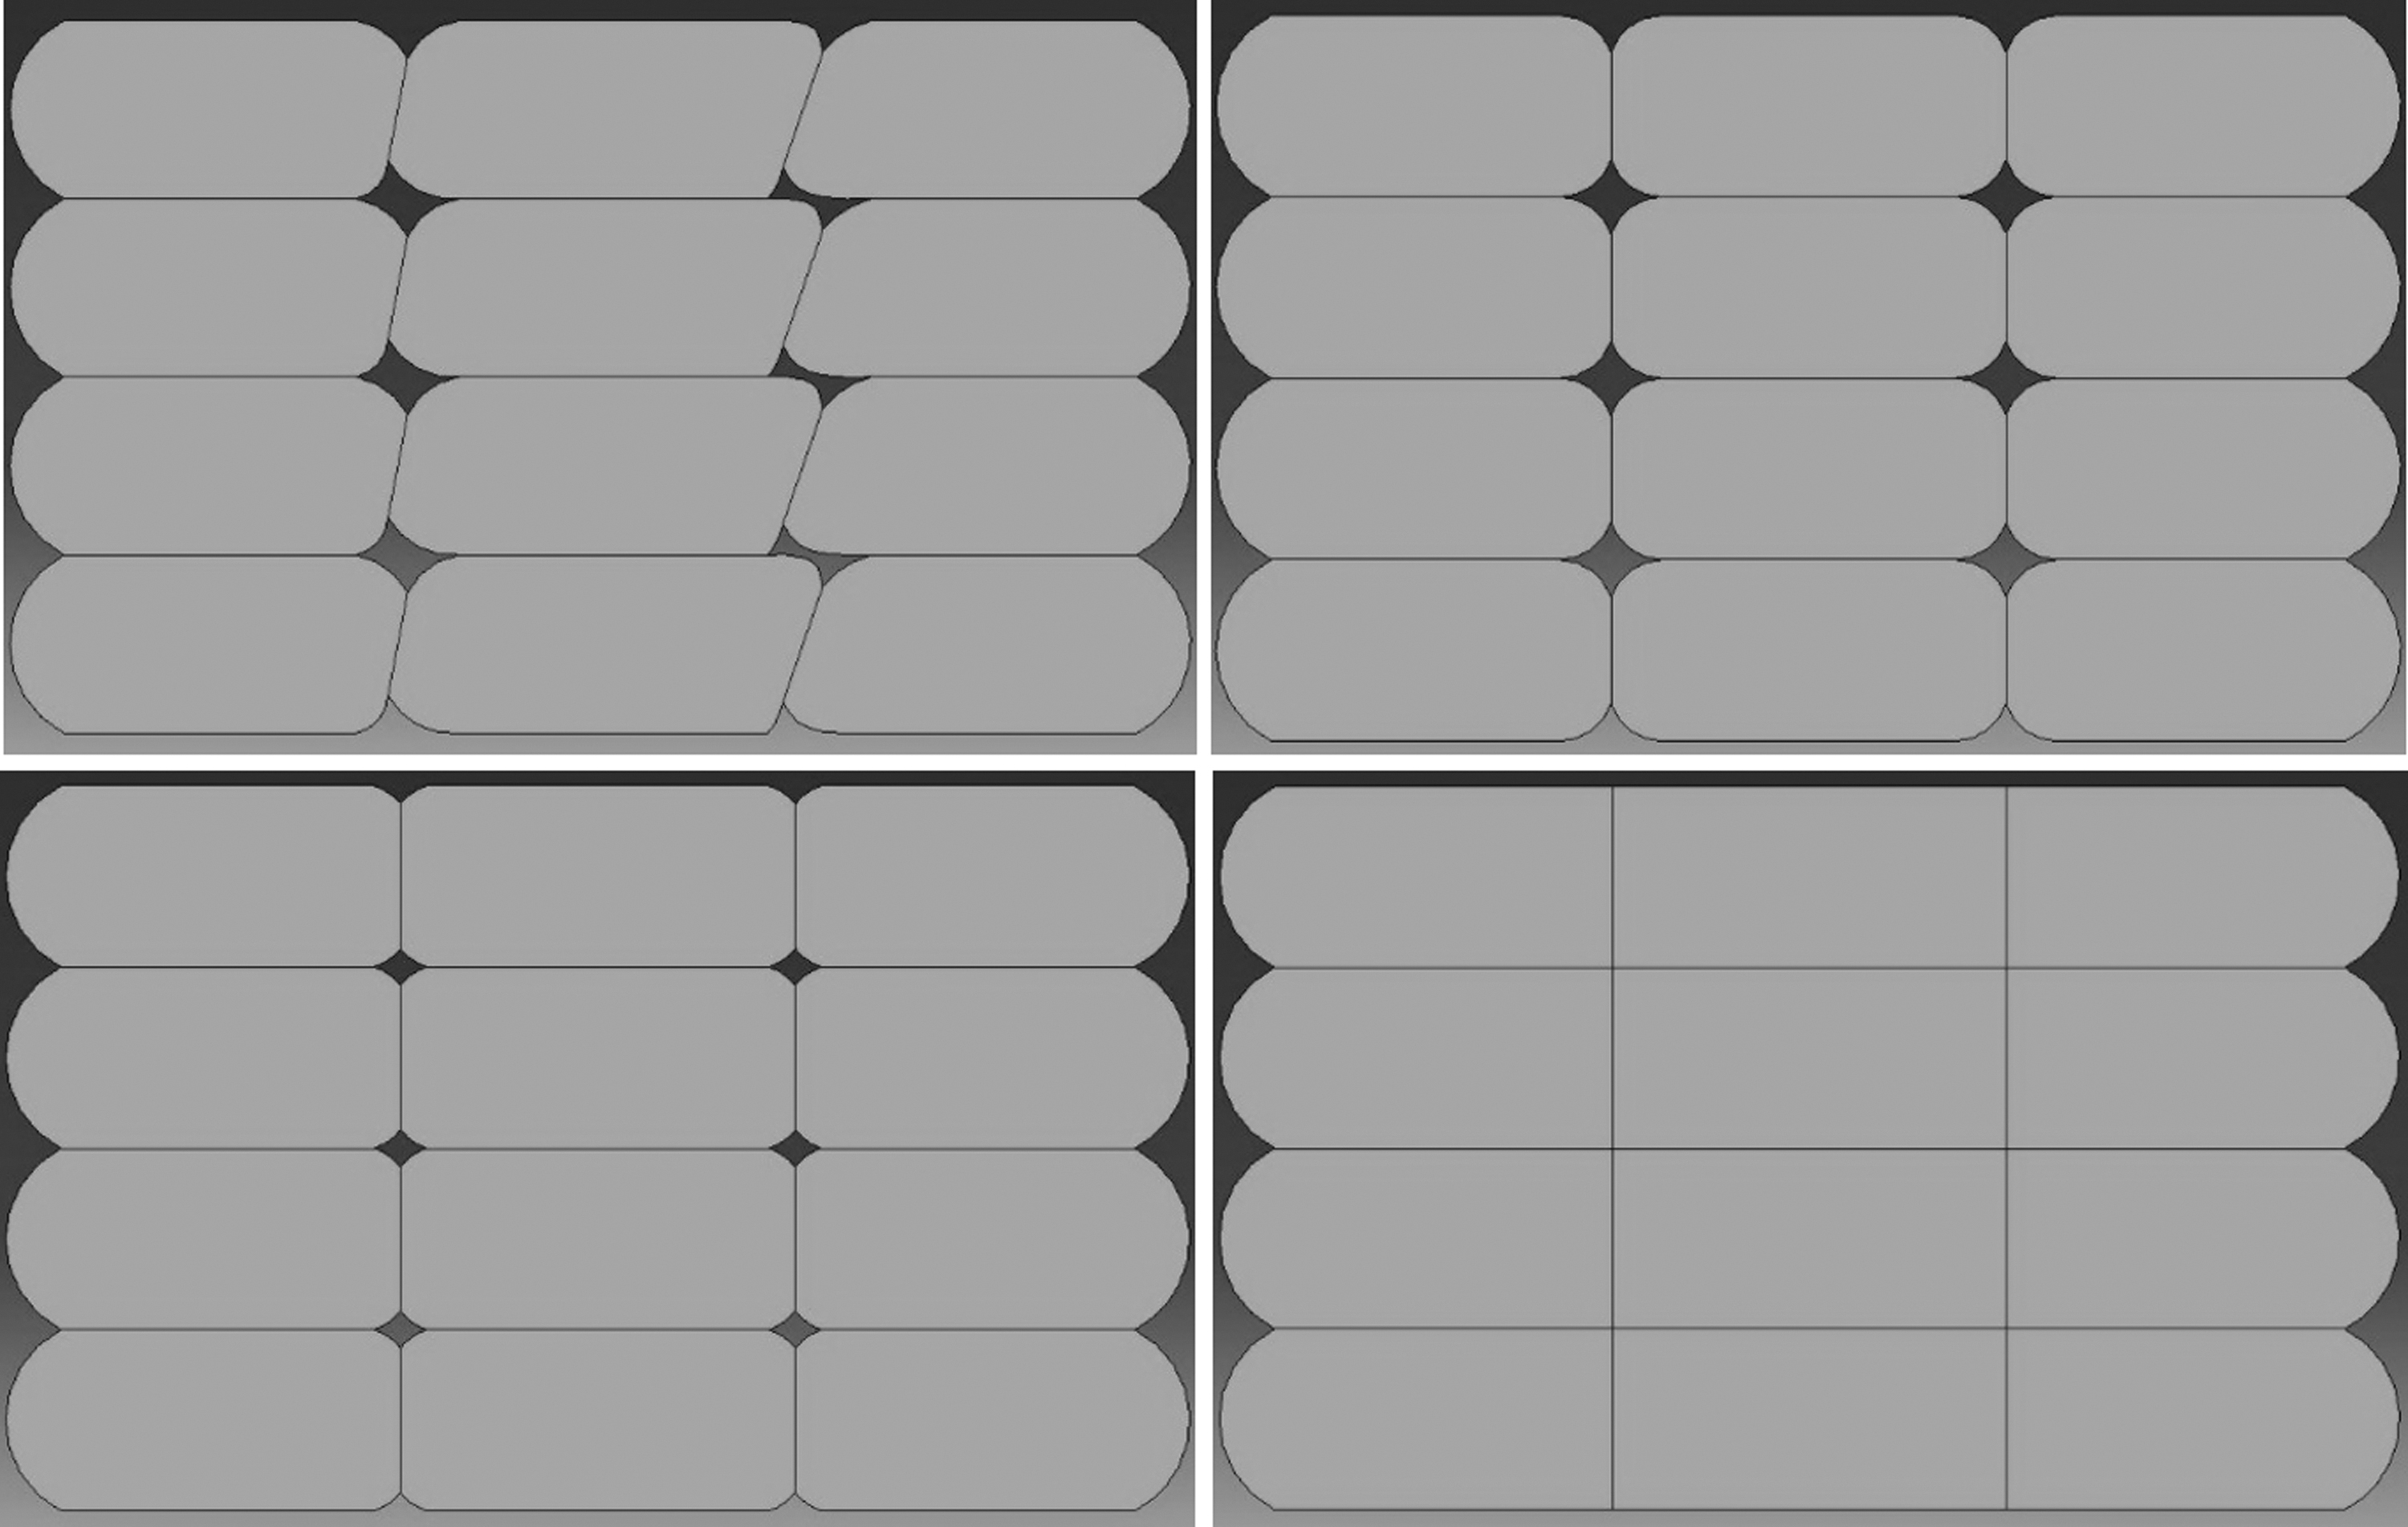
Original matching geometry model (top left), symmetric model made with similar gap dimensions and area (top right), improved microstructure model with a reduction in gap area (bottom left), and a perfect model with no gaps between extrusions while remaining exterior layer shape (bottom right).
Reducing the gap size will have the most significant effect on the mechanical properties of this microstructure. The improved gap model has gaps scaled down by a factor of 4. The resulting gap area is 15.8 times smaller than the symmetric model. This improved model is shown in the top right image of Figure 6. In addition to the improved model, a model with no gaps or voids was created to show the perfectly matched inner bonding while retaining the outer rounded edges, shown in the bottom left of Figure 6. Eliminating the gaps will increase the interface area and avoid the additional internal stress concentrations. This may be difficult to achieve in practice, but this model serves as an upper limit of what can be achieved by improving the internal geometry for a given interface property.
Results
PLA filament material properties
Filament properties were directly measured to be used in Abaqus microstructural simulations to investigate the effect of varying print morphology on overall part stiffness and strength. Filament properties must be measured directly to ensure the properties used in the model match the property of the filament-printed specimens. Mechanical properties of PLA can vary depending on the molecular weight, so parity must be ensured. Material properties can also potentially vary between manufacturers and filament batches. Therefore, it is beneficial to perform tensile tests on the filament feedstock used to print the tensile dog-bone specimens.
Filaments were directly loaded into a uniaxial testing machine. Strain was measured using 1D DIC by tracking a series of dots on the surface of each filament. Table 1 shows the average stiffness and ultimate tensile strength of the filament tensile tests.
PLA, Polylactic Acid.
FDM tensile testing results
The average stiffnesses for each of the two specimen types are shown in Table 2 along with the average strength and strain to failure. The results show that the four-extrusion specimens exhibited a similar response in comparison to the three-extrusion specimens.
Average Stiffness and Strength of Fused Deposition Modeling Tensile Tests
The stiffness of the filament PLA is 3.57 GPa, and the ultimate tensile strength is 43.57 MPa. From filament to printed specimen, there was an average of a 32.4% reduction in material stiffness. This can be attributed to a variety of factors, including degradation of the polymer during printing, internal voids during the printing process, and inter-layer gaps. The strength is also much lower than the bulk PLA strength, exhibiting a 47.8% reduction. There are many potential causes at the microstructural level for this low strength. The strength of the bond between subsequent layers and between adjacent extrusions is much weaker than the bulk polymer (later simulation results will estimate this difference at 22.5%). Gaps and voids between the extrusions can cause significant stress concentrations.
The left image of Figure 7 shows an image of the tensile sample just after fracture has occurred. These specimens fail in brittle fashion, and no plastic deformation can be observed. Fracture occurred through a single layer, in a plane perpendicular to the tension direction. The extrusions on either side of the broken specimen appeared to be intact, that is, the interface between print lines has failed. The average strain at failure, or elongation at break, for these specimens was much lower than the bulk PLA value. Reported values of elongation at break for bulk PLA range from 2.5% to 6%.18 The failure occurred before any significant plastic deformation was able to progress. This is due to the comparatively weaker interface bond between layers. The strength of the interface is the limiting factor that is primarily responsible for failure.
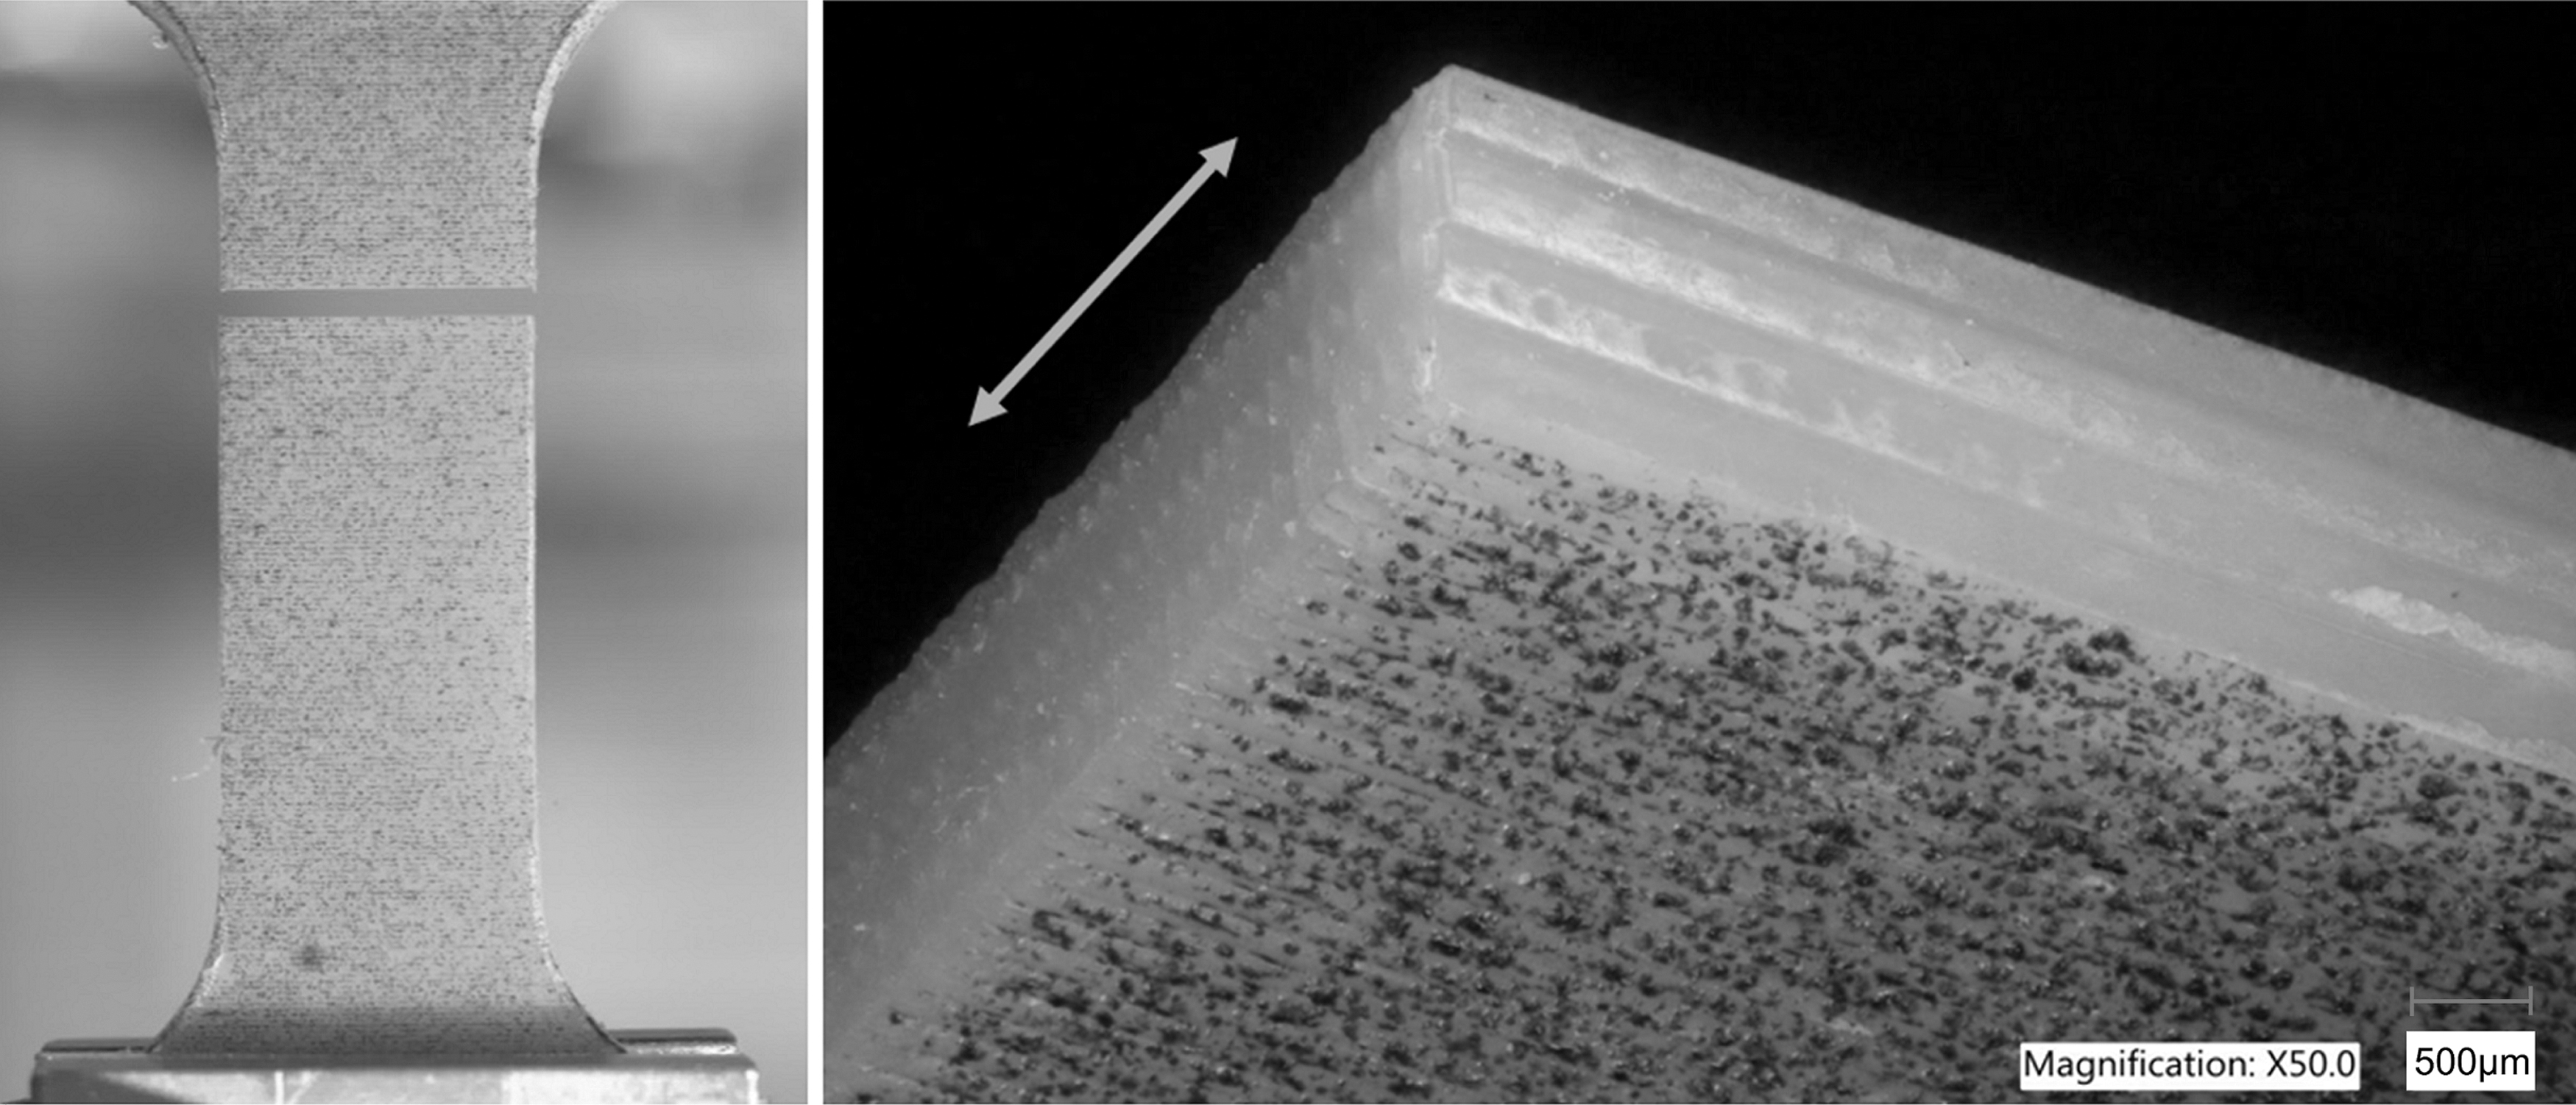
Postfailure image of tensile test specimen (left), and failure surface microscopy showing planar fracture at interface between layers (right). The arrow shows the direction of the applied tension.
The figure shows the failure morphology of the tensile specimens. The near surface of the specimen in right image of Figure 7 shows the speckle pattern painted on the specimens for DIC strain analysis of the specimens. This image shows the relatively intact extrusions, with the damage occurring where adjacent layers have cleanly separated.
FDM interface strength determination through FEM microstructural modeling
In the physical tests, failure occurs at the interface between layers. This behavior was represented in the models through use of cohesive surfaces. The horizontal surfaces between the extrusions were defined as cohesive surfaces that are able to break at a specified nominal stress. This nominal stress represents the interface strength of the 3D-printed material. The nominal stress of the cohesive surface property was parameterized until the strength of the overall models matched the tensile tests results. The strength of the model is the maximum tensile load divided by the overall cross-sectional area of the model, as it would be measured by calipers during a physical test. The average stiffness of the models was compared with the physical tests (Table 3).
Comparison of Tensile Test Stiffness Versus Model Stiffness
FEM, finite element method.
Using the updated filament material properties, the models predicted a slightly higher stiffness for each specimen type. As previously mentioned, the physical specimens contain defects and internal voids (essentially trapped air within printed filament lines) that are currently not accounted for by the computational models. These additional defects and microvoids are responsible for the reduced stiffness of the physical test specimens.
The interface strength is an unknown material property that can be determined by the computational models. The cohesive surfaces are governed by the maximum nominal stresses in the normal and shear directions. The interface strength of the 3D-printed PLA specimens was parameterized by varying the maximum nominal stress in the normal direction until the model strength matched the tensile tests. The data are shown in Table 4. Both parameterization studies resulted in nearly identical interface strengths, showing close agreement.
Interface Strength Parameterization of Three-Extrusion and Four-Extrusion Models
Bold values indicate models whose strength matched experimental tensile tests.
The average interface strength for this material was determined to be 33.75 MPa. Earlier assessments of the brittle failure morphology showed evidence that the failure occurs at a stress below the ultimate tensile strength, due to lack of any observed distortion or plastic deformation on the failure surface. This suggests that the earlier assessment is correct and the interface is not tough enough to cause the surrounding PLA to reach plastic deformation. Note that although the strength is nominally greater than the specimen strength, this is a highly localized property defined only at the interface, whereas the energy/toughness of the interface has been determined for further use. It should be further noted that these strengths are much lower than that of a cast PLA property (Table 1). This would be expected since the printed interfaces do not interdiffuse readily, significantly limiting the polymer chain entanglement in comparison to a cast bulk specimen. Any thermomechanical property of a thermoplastic will depend heavily on polymer chain entanglement, as well as Van Der Waal's forces between molecules, both of which must be overcome for plasticity or fracture. At any interface, some additional mechanisms may contribute to interface strength (local electrostatic forces between surfaces, interpenetration of molecular side groups into the microstructure of a neighboring surface, etc.), but these are weaker in comparison to polymer chain entanglement. This interface strength was then used in the remaining models to investigate the potential stiffness and strength changes for FDM 3D-printed parts with varying gap morphologies as described in the next section.
In addition to the weaker interface strength, the microstructure creates many stress concentrations. The rounded edges of the extrusions meet at sharp corners and raise the stress substantially over the surrounding material. The stress at the edges of the interfaces was greater than 1.6 × the stress at the center. Reducing or eliminating these inner voids can increase the strength substantially. The stress contour in the right image of Figure 8 shows the progressive failure, with the crack having propagated halfway through the cross-section of the model. The right interface has fully debonded in the figure, and crack tip stress concentrations are seen as the crack propagates through the middle extrusion. The models were run until complete failure after the crack propagated through the rest of the interlayer interfaces of the same layer.

Tensile stress contours of matching geometry models. Left image shows the stress concentrations that form along the sharp corners, as indicated by the arrow. The right image shows the progressive failure of the interlayer interface where half of the interface has debonded. The crack tip and failure process zone are indicated by the arrow. The darker region of the stress contour on the right side of the model signifies low tensile stress due to the debonded interface along that portion of the model.
Parametric study of the effect of inter-extrusion gap size on mechanical properties
The results of the study are shown in Table 5. The improvement values in the table are based on the relative improvement from the “matching” model (Fig. 4), which is the baseline configuration most closely representative of the as-printed geometry. The symmetric (idealized gap) models were similar to the matching model. Reduction in gap size led to a 7.65% and 10.67% increase in stiffness for the three-extrusion and four-extrusion models, respectively.
Stiffness and Strength Improvements for Three-Extrusion, Four-Extrusion, and Five-Extrusion Models
The larger four-extrusion and five-extrusion microstructures showed significant improvements over the three-extrusion model. This effect seems to converge to an almost 20% improvement in material strength that could be achieved with a no-gap print morphology as compared with the as-printed morphology. The improvement in overall specimen strength can be attributed to larger interface areas providing resistance to tensile loading. Improving the interface strength to that of the filament strength would lead to additional strength improvements; however, the nature of the process causes the interlayer bonding to suffer. However, by reducing the gap size, the improvement is significant enough to warrant further research into how such morphologies may be accomplished.
The parametric study results for the five-extrusion model show a maximum of 16.12% increase in stiffness and 19.80% increase in strength over the baseline matching model. Removing the internal gaps reduces the amount of stress concentrations and therefore increases the strength. Referring to Figure 6, the perfect model with no internal voids maintains the external rounded shape and sharp corner. For this reason, the models did not converge to the interface strength of 33.75 MPa. However, this would be the maximum strength of the printed parts if the external surfaces of the parts were also square with no stress concentrations. This is also the reason why the addition of perimeters/extrusions leads to a larger maximum improvement, since the stress concentration is now comparably less significant to the larger width of the specimen. This trend is summarized in Table 6.
Summary of Maximum Stiffness and Strength Improvements Possible from Comparison of an As-Printed Geometry to a No-Gap Geometry
The maximum property improvement increases with increasing number of extrusions due to the lessened impact of the outer surface stress concentration. For an ideal printed specimen with perfectly square outer surfaces, the expected strength for all three of the models would equal the interface strength of 33.75 MPa; however, this is not yet possible with current FDM printing technology.
Conclusions
Tensile tests of carefully prepared 3D-printed PLA specimens were conducted to investigate the effect of unique printed microstructures on the stiffness, strength, and strain to failure characteristics. Specifically, the specimens were tested in an orientation perpendicular to the build plate such that it pulls the layer-to-layer interfaces apart. The average stiffness and strength of the tested 3D-printed specimens are 2.42 GPa and 22.8 MPa, respectively. The interface between print layers created during layer-by-layer deposition is imperfectly bonded and resulted in a 32.4% reduction in stiffness and 47.8% reduction in strength compared with the filament property.
Further investigation of this behavior was accomplished by recreating the microstructure of the specimens in Abaqus for computational simulations. Cohesive surfaces with varying strength parameters were used to represent the failure occurring along the interfaces. The models were used to perform a parametric study to determine the correct interface strength of the printed PLA material. The interface strength was determined to be 33.75 MPa, which was significantly below the 43.57 MPa filament strength. Layer-to-layer interface weakness can be attributed to both imperfect bonding and imperfect packing of rounded print lines. Cross-section microscopy showed large gaps between adjacent print extrusions, leading to stress concentrations that precipitate failure.
Utilizing the interface strength from the parametric studies, additional models were created to investigate the potential mechanical improvements associated with reducing or eliminating internal gaps between rounded print lines. Three by four, four by four, and five by four print line geometries were analyzed to ensure isolation of internal geometry effects from edge effects. Eliminating the inter-layer gaps while maintaining external rounded surface features improved the strength by as much as 19.8%, which is a significant improvement, although the printed strength would still have a limit of 62.5% of the filament strength. Although the interface strength is a limitation that must be improved to reach full-strength 3D printed polymers, eliminating the voids between the extrusions would remove the stress concentrations and lead to an overall stronger material. Careful tuning of the printer is important to achieve the best possible results. Further improvement of the nozzle shape can deposit the extrusions more precisely to avoid these defects as well. The results of this study show the possible improvements in overall part performance that can be achieved by optimizing the printing parameters to improve the resulting microstructures of FDM printed polymers.
Footnotes
Acknowledgments
Author Disclosure Statement
No competing financial interests exist.
Funding Information
No funding was received for this article.