
Abstract
Oxygen plays a critical role in the photopolymerization process resulting in the formation of solid structures from liquid resins during three-dimensional (3D) printing: it acts as a polymerization inhibitor. Upon exposure to light, oxygen is depleted. As a result, the polymerization process becomes activated. Electron paramagnetic resonance (EPR) imaging is described as a tool to visualize changes in oxygen distribution caused by light exposure. This nondestructive method uses radio waves and, therefore, is not constrained by optical opacity offering greater penetrating depth. Three proof-of-principle imaging experiments were demonstrated: (1) spatial propagation of the photopolymerization process; (2) oxygen depletion as a result of postcuring; and (3) oxygen visualization in a 3D printed spiral model. Commercial stereolithography (SLA) resin was used in these experiments. Lithium octa-n-butoxynaphthalocyanine (LiNc-BuO) probe was mixed with the resin to permit oxygen imaging. Li-naphthalocyanine probes are routinely used in various EPR applications because of their long-term stability and high functional sensitivity to oxygen. In this study, we demonstrate that EPR imaging has the potential to become a powerful visualization tool in the development of 3D printing technology, including bioprinting and tissue engineering.
Introduction
Ambient oxygen plays a critically important role in the photopolymerization process acting as an inhibitor. Modern three-dimensional (3D) stereolithography printers use this property of oxygen to spatially separate areas where the polymerization process should take place from the bulk resin.1,2 Specially designed oxygen-permeable materials are used to achieve this goal. 1 No analytical imaging method is currently available to directly observe oxygen distribution during 3D printing and postcuring. Electron paramagnetic resonance imaging (EPRI) permits such measurements.3–8 EPRI has the potential to become a useful tool for the developers of new 3D printers and photopolymerized resins. The first oxygen imaging results in the application to 3D printing are presented in this article.
Electron paramagnetic resonance spectroscopy is used to measure compounds containing unpaired electrons, such as metal complexes, free radicals, and oxygen.9,10 EPRI is in many ways similar to the well-known magnetic resonance imaging (MRI) modality. Both methods are based on the same quantum mechanical principles, such as interactions between spins and magnetic fields.
In the case of EPR, electron spin is used as the reporter of inter- and intramolecular interactions. EPR imaging is routinely used in biomedical research to observe changes in the microenvironment of tissues and tumors.11–15 Chemically stable electron spin probes have been developed to measure redox potential, pH, inorganic phosphate concentration, enzymatic activity, and oxygen partial pressure pO2.6,11,13,16–24 These parameters are important biological markers that are used to study various physiological conditions but can also be applied for use in general 3D printing applications.
The goal of this article is to explore the application of EPR imaging to 3D printing. Toward this goal, proof-of-concept experiments were conducted to map pO2 in photopolymerized resin after light exposure. During polymerization, molecules of monomers and/or oligomers cross-link to form solid structures. Atmospheric oxygen, which is naturally dissolved in the resin, acts as an inhibitor of the reaction. 25 First, it quenches the photoexcited photoinitiator that is used to generate initial free radicals. 26 Second, O2 molecules attack radical species to form peroxides 27 that remove oxygen from the media. Due to slow oxygen diffusion in resins, O2 is not immediately replenished, and once removed, the polymerization chain reaction can begin.
Developers of stereolithography printers implement an ingenious engineering solution that takes advantage of oxygen dissolved in the 3D printing media. The 3D printers are designed to utilize a thin “dead zone” layer that separates the liquid resin and the bed of the vat, through which light is projected, to form two-dimensional (2D) slices of the printed 3D objects. 2 This window is made from an oxygen-permeable material that permits constant oxygenation of the “dead zone.” The formation of this zone creates a liquid interface between the freshly printed object and the vat window. This technology permits fast and reliable printing.
An alternative fast 3D printing approach (in which oxygen also is a key player) was recently published in Science. 28 The 3D objects are created in bulk liquid media (resin) using a mathematical algorithm developed for computed tomography. In this method, the back-projection of 2D masks forms a 3D object. Constructive interference creates areas with high light intensity where oxygen is quickly depleted. When the depletion level exceeds a certain threshold value, polymerization chain reaction activates. In this method, the control and detection of pO2 levels by the means of EPR oxymetry will permit fine-tuning of the mechanical properties of 3D-printed or bioprinted parts.27,29
Monitoring oxygen distribution with the help of EPR imaging during the polymerization process may provide important information to improve the resolution and quality of 3D prints. Timing of light exposure and intensity can be optimized for a given oxygen concentration and diffusion coefficient within the printing volume. This optimization would ensure a high-threshold nonlinear oxygen depletion response to light, which is an important factor in the creation of high-resolution 3D objects.
Micro EPR imaging 30 can be used to optimize the microfabrication process. Several techniques have been developed that take advantage of oxygen inhibitory properties in 3D printing.31,32 Computational modeling of oxygen diffusion and the polymerization process is used to optimize manufacturing. 33 EPR imaging can directly measure oxygen concentration with a spatial resolution of 30 μm or better30,34 to verify and fine-tune the theoretical models.
To date, only 2D spectral-spatial EPR imaging has been used to observe the polymerization processes. 35 Changes in EPR spectra of radicals along a single spatial dimension were measured, and no oxygen imaging has been done. Allylic radical formation resulting from light-induced resin polymerization 35 was visualized. Such spatial images are not informative for most 3D printing applications.
In comparison, this article demonstrates 4D spectral-spatial imaging results. These images comprise of the three Cartesian dimensions (x, y, z) and a single spectral dimension (EPR intensity as a function of the magnetic field). Absorption EPR spectra are analyzed to give local oxygen concentration. This is done by nonlinear curve fitting. The width of the EPR spectrum is a linear function of oxygen partial pressure. The fitting procedure transforms 4D spectral-spatial images into 3D oxygen maps. In this article, we present the first oxygen images in 3D prints containing photoinduced resin.
Commercially available Formlabs “Clear” resin, a photopolymerizable, methacrylic acid ester-based liquid substance, was used in the imaging experiments described here. We routinely use the Formlabs Form 3 printer (Formlabs, Somerville, MA) to manufacture various parts of a locally-built EPR imaging system with this resin. 3 The introduction of stable EPR probes into the resin makes it possible to monitor both the static oxygen concentration and its kinetics.
Three types of proof-of-concept experiments were conducted. First, we observed the propagation of the polymerization front upon exposure to light and subsequent depletion of oxygen. In the second experiment, the process of postcuring was imaged. Oxygen levels in the print were imaged before and after postcuring. Finally, oxygen partial pressure in a 3D-printed object was imaged. Towards this goal, an Ender-3 Pro printer was modified to extrude resin instead of plastic.
The EPR oximetry imaging method described in this article is not limited to a specific resin type but can be used with any photopolymerizable resin. Oxygen inhibition is encountered in a very wide range of polymerization reactions. We envision applications of EPR imaging to 3D bioprinting, where a wider range of probes16,17,36–39 can be used to monitor changes both in the prints and the cell environment. We hope that this article will introduce EPR imaging into the field of 3D printing and stimulate interdisciplinary collaborations.
Materials and Methods
EPR imaging system
A recently described modular rapid-scan (RS) EPR imaging system3 was used. The RS EPR method has been demonstrated to provide superior sensitivity in comparison with the traditional first-harmonic continuous-wave EPR method.40,41 Crucially, a larger number of projections can be acquired per unit of time, which is critical for imaging.
Modification of 3D printer
An open-source extrusion-type 3D printer (Creality Ender-3 Pro, Shenzhen Creality 3D, China) was modified for stereolithography resin extrusion (Fig. 1). The extruder and its stepper motor were replaced with a linear actuator (S20-3030-B; Actuonix, Canada) and a 1 mL Luer-Lok Tip syringe (BD, NJ) with a 23-gauge stainless steel blunt needle (Component Supply Co., TN) to extrude the resin. A light source (405 nm, MTPCB-0842; Marktech Optoelectronics, NY) was added to photopolymerize the resin. The firmware of the 3D printer was reprogrammed to control the movement and extrusion of the actuator. Bed and extruder heating were disabled.

Modified Ender-3 Pro 3D printer. A stepper motor responsible for plastic filament extrusion was replaced by a linear actuator. The linear actuator, connected to a syringe plunger, permits both extrusion and retraction of a mixture of Clear FLGP CL04 resin and LiNc-BuO crystals. A 385–410 nm light source is attached to the printer frame that initiates photopolymerization of the resin. 3D, three-dimensional; LiNc-BuO, lithium octa-n-butoxynaphthalocyanine. Color images are available online.
Sample preparation
Commercial “Clear” resin (FLGP CL04; Formlabs) was used for oximetric EPR imaging. This resin is a mixture of methacrylic acid esters and a diphenyl (2,4,6-trimethylbenzoyl) phosphine oxide (DPTBP) as a photoinitiator. 42 “Clear” resin, as its name suggests, is a semitransparent viscous substance. Upon exposure to blue light (405 nm wavelength), the resin solidifies forming semitransparent solid 3D objects.
To permit oxygen EPR imaging, lithium octa-n-butoxynaphthalocyanine (LiNc-BuO) microcrystals were dispersed in the resin at various concentrations. LiNc-BuO is an oxygen-sensing particulate microcrystalline probe used for longitudinal oximetry measurements in preclinical and clinical EPR applications.43–47 Crystal sizes varied in the range of approximately 2–10 μm (Fig. 2). LiNc-BuO (molecular weight [MW] = 1297 g/mol) crystals are hydrophobic compounds and can be easily dispersed, but not solubilized, in the methacrylic acid ester resin using a shaker and/or sonicator. LiNc-BuO was found to be insoluble in the monomer. Long-term storage of the prepared mixture (3 months) does not compromise the probe.

Microscopic images of LiNc-BuO crystals dispersed in Formlabs “Clear” resin.
The resin containing LiNc-BuO was calibrated with respect to the linewidth in response to oxygen partial pressure. Several oxygen EPR probes, India ink, for example, characteristically display nonlinear dependence of linewidth on oxygen. However, LiNc-BuO has been found to have a linear dependence of linewidth on oxygen concentration, independent of crystal size and preparation procedure. 48
Three processes were investigated: (1) propagation of the front of photopolymerization in a glass bottle filled with liquid resin; (2) postcuring of a polymerized resin; and (3) imaging of a 3D printed spiral object.
A 2 mL glass bottle with a diameter of 11 mm was filled with “Clear” resin containing LiNc-BuO at 0.5 mg/mL. High-efficiency violet LZ1–00UB00 LED (LED Engin, San Jose, CA) was used as the light source for photopolymerization. This small-size surface-mount chip (4.4 × 4.4 mm footprint) emits within a narrow wavelength band between 385 and 410 nm. This range matches that specified for the commercial Formlabs resin that was used in the imaging experiments. As explained above, the light-emitting diode (LED) activates the photoinitiator and starts the polymerization chain reaction after the depletion of oxygen. The bottle containing the probe/resin mixture was placed in the EPR resonator of the RS EPR imaging system3 (Fig. 3a), and the LED was positioned underneath the sample. As a result, light (and polymerization) propagated in the upward direction (Fig. 3b). The LED was placed slightly off the bottle's center. Three images were acquired after 3, 7, and 82 s of the total light exposure time. Images were measured directly following light exposure to observe the propagation of the polymerization front throughout the sample.
A solid cylinder was formed by sequential (layer by layer) photopolymerization of the probe/resin mixture of 8 mg/mL LiNc-BuO. The probe/resin mixture was added into a cup (ID = 8.8 mm) and photopolymerized to form five layers, each ∼0.9 mm in height, resulting in a polymerized cylinder with a height of 4.5 mm. Each layer was exposed to LED light for 2 s.
A 3D spiral was designed with OpenSCAD and printed on the modified Ender-3 Pro with a mixture of resin and 32 mg/mL LiNc-BuO crystals. The spiral was printed with 20 layers of 0.04 mm height, resulting in a structure ∼0.8 mm high. The spiral had an outside diameter of 10 mm. Each layer was exposed to LED light for 2 s.
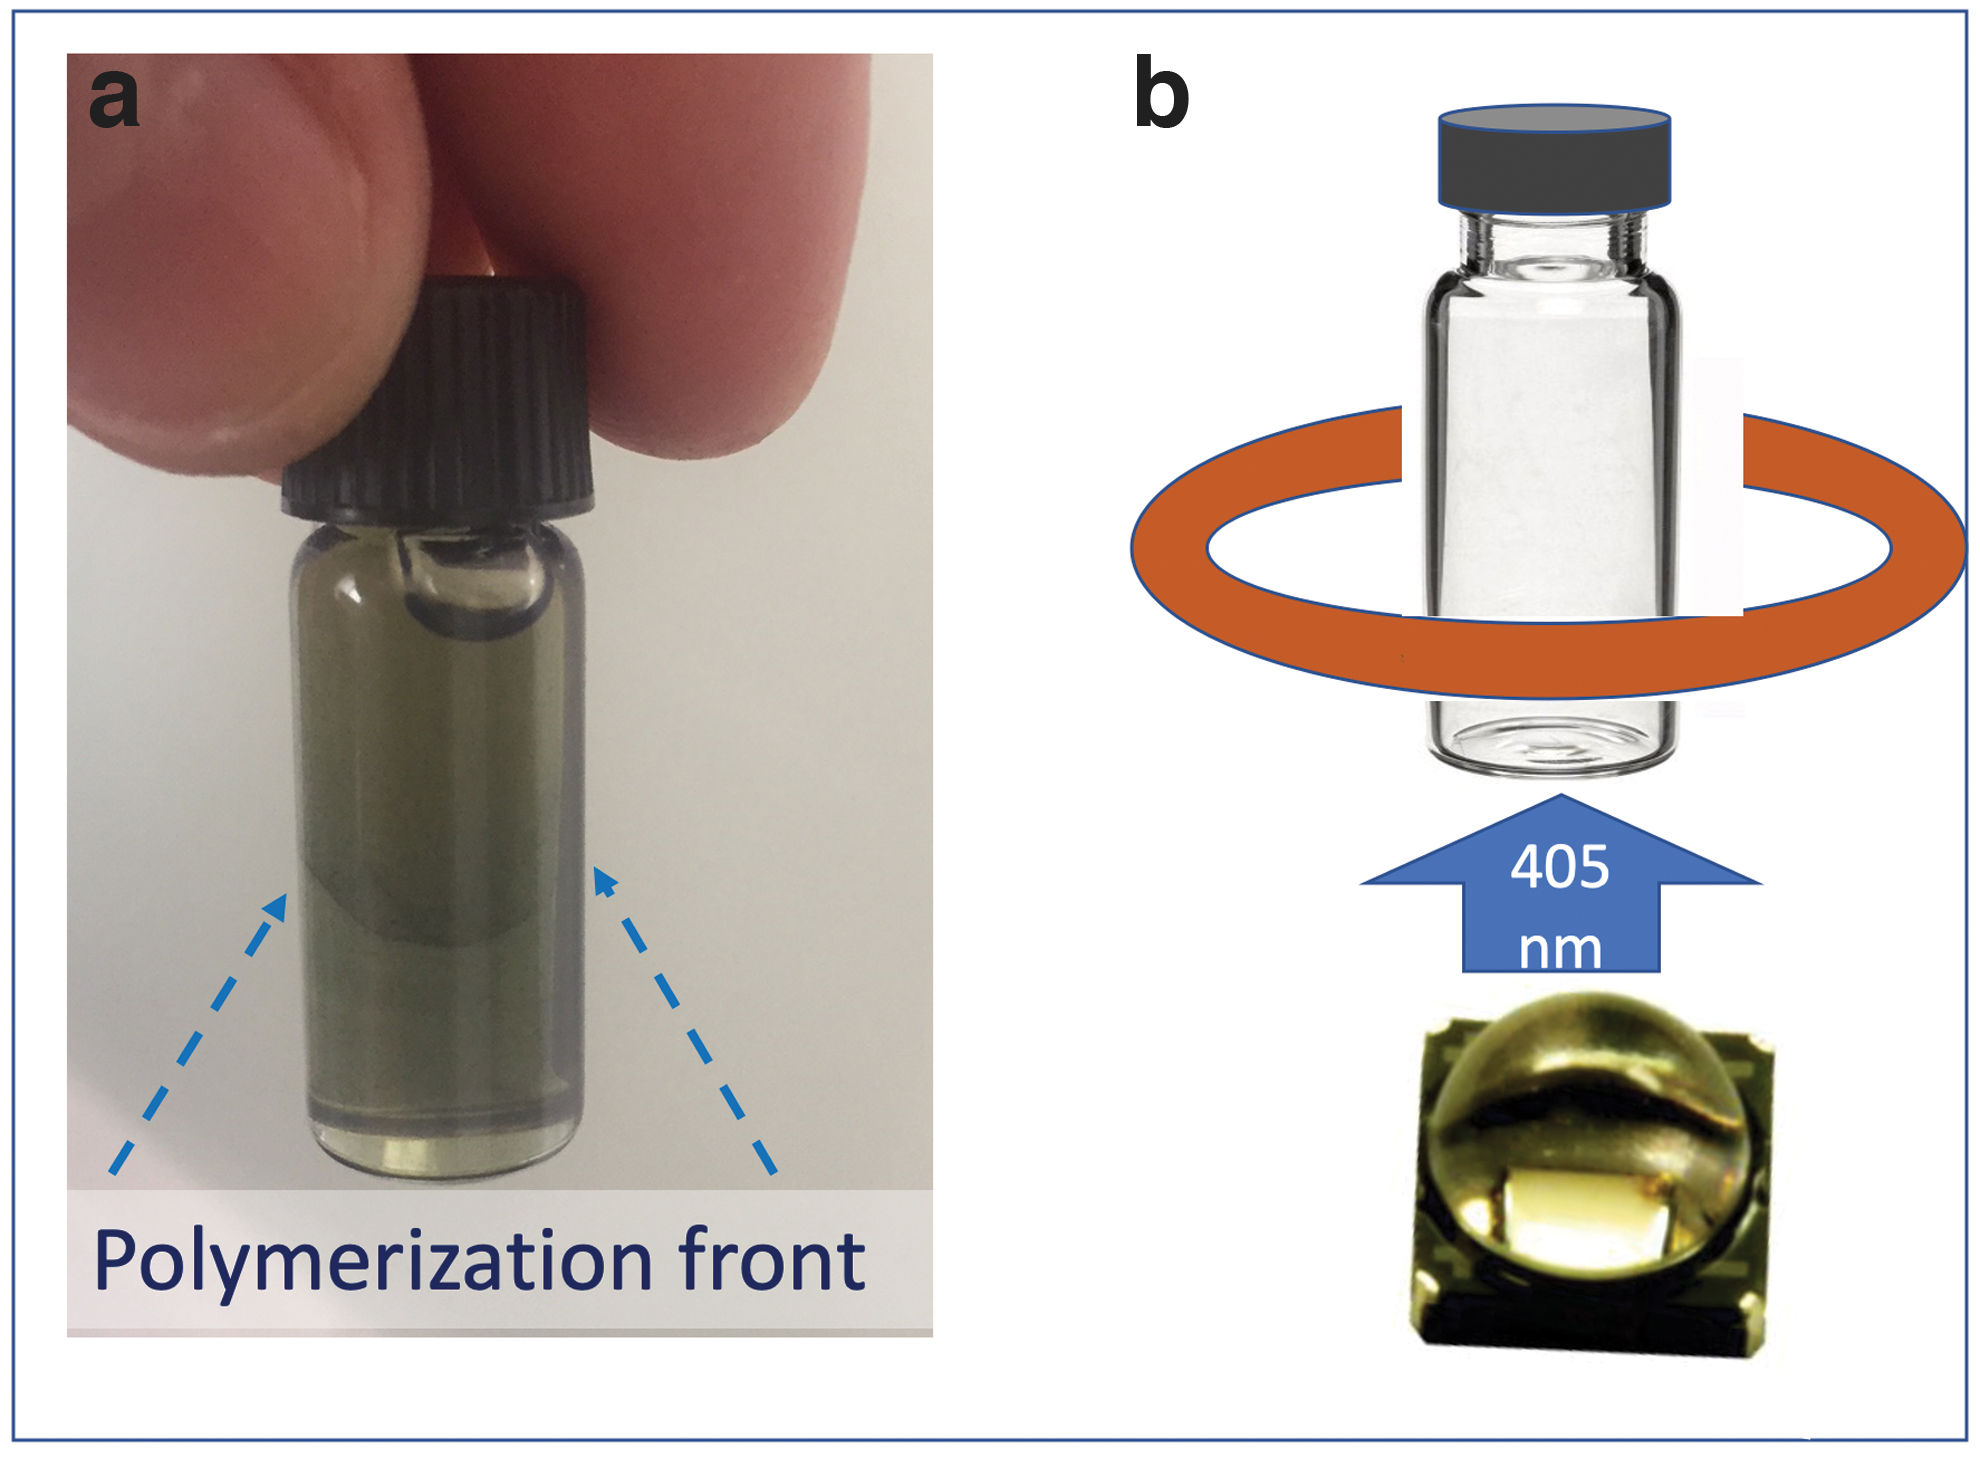
A bottle filled with a mixture of oxygen-sensitive EPR probe LiNc-BuO and “Clear” resin.
Rapid scan EPR imaging
A locally-built, modular, RS EPR system operating at 800 MHz 3 was used for spectroscopy and imaging. RS EPR signals were acquired and then postprocessed into absorption spectra. 49 For both spectroscopy and imaging, the scan frequency was 9400 Hz. Scan amplitude varied depending on the gradient values. After the 4D spectral-spatial images were reconstructed, EPR spectra corresponding to each voxel were line fitted to extract linewidth and integral spin intensity proportional to the spin-probe concentration. MATLAB Curve Fitting app was used to fit EPR absorption spectra which had a Lorentzian shape. As a result of the fitting, 3D linewidth and concentration maps were obtained. The linewidth maps were translated into oxygen images using the known linear dependence of LiNc-BuO spectral width (SW) as a function of O2 partial pressure, pO2. 45
Results
Imaging of the photopolymerization process
LiNc-BuO oxygen probe was homogeneously distributed throughout the bottle volume. However, areas containing fully oxygenated probes are not visible in the image. This happens due to two reasons. First, the oxygenated (at ambient partial oxygen pressure) LiNc-BuO probe has a broad relative to the image SW EPR linewidths. Magnetic field scans at low gradient values are comparable to SW. RS deconvolution algorithm was designed to treat any line comparable in width to the scan amplitude as background. As a result, broad spectral components are subtracted from the reconstructed EPR absorption lines. 50 It is also important to note that due to the inverse relationship between RS EPR linewidth and intensity, degassed LiNc-BuO crystals will produce × 25 higher intensity spectra compared to an analogous sample in an ambient 21% oxygen atmosphere.
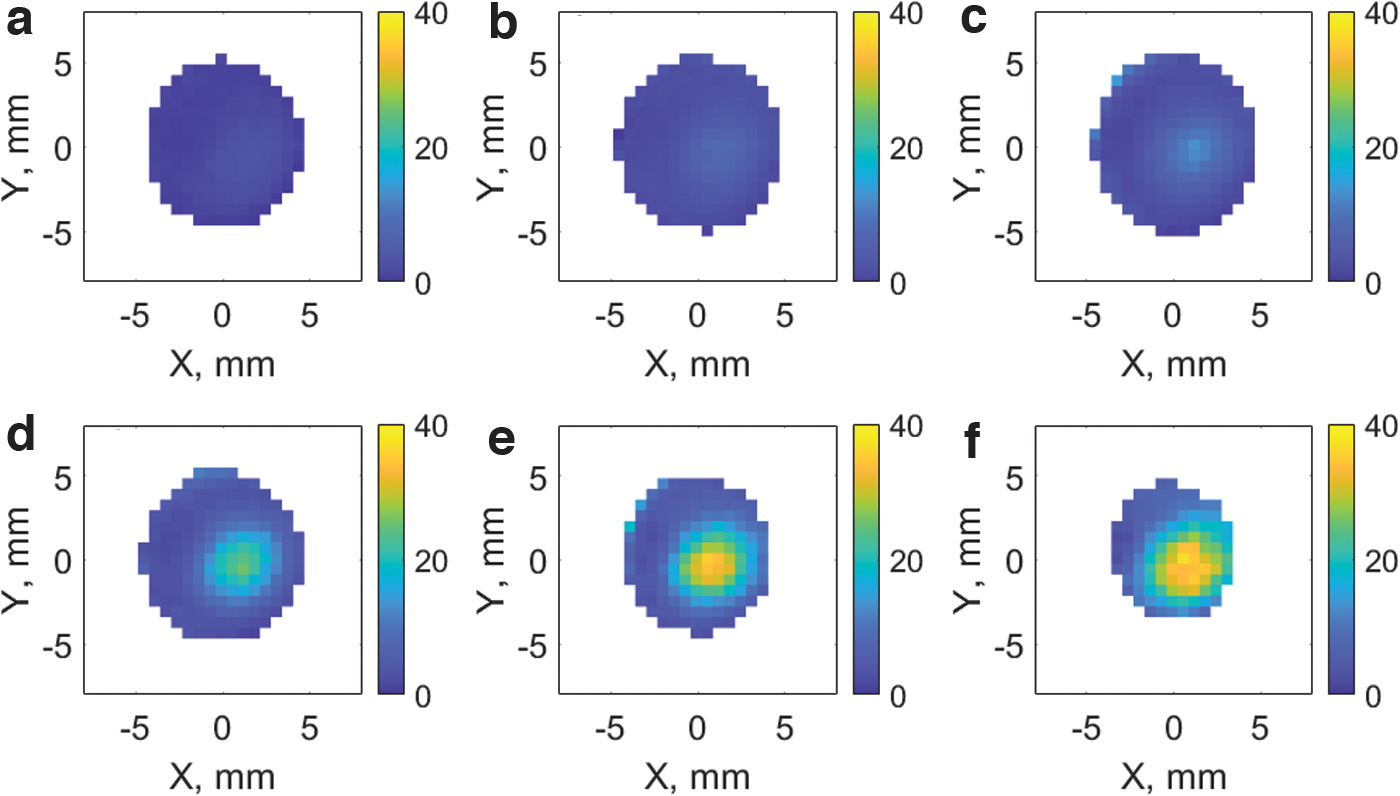
The cumulative result of these effects is a sharp spatial contrast in EPR intensity images (Fig. 4a–c). The advancement of the polymerization front is visible with increased light exposure. A total of 2546 projections were acquired per image, including 26 intermediate zero-gradient spectra. These spectra were used for fine adjustments of the drifting external magnetic field, which occurs as a result of heating of the permanent magnet by the gradient coils. Total image acquisition time was ∼2.5 min. A maximum gradient of 3 G/cm was used to measure projections.

Spin probe concentration and oxygen partial pressure (pO2) data obtained from three 4D EPR images acquired after 3
Four-dimensional spectral-spatial images were reconstructed using a previously described algorithm 51 developed by Komarov and Hirata. The four dimensions in the images include three cartesian coordinates (x,y,z) and a spectral coordinate (EPR spectrum as a function of the scanning magnetic field). As a result, each voxel (3D volume element within the image) contains an EPR spectrum (4th dimension). During the postprocessing, the spectra are line fitted to extract two (or more depending on the probe being used) parameters: oxygen and spin probe intensity. Only Figure 4a–c shows spin intensity 3D maps extracted from the 4D EPR images. The rest of the results show 2D cross-sections and histograms obtained from 3D pO2 maps. These maps were extracted from 4D EPR images by the means of the EPR line fitting procedure.
Due to the off-center placement of the LED source, the polymerization process propagates asymmetrically. In addition, light reflection and refraction along the glass bottle walls expose resin close to the wall surface to higher intensity LED irradiation. As a result, polymerization near the walls advanced further compared to the center of the bottle. The depletion of oxygen throughout the volume is shown in the histograms (Fig. 4g–i). The LED circuit was nonmagnetic and contained a minimal amount of metal so no effect on the EPR resonator and scanning field was detectable.
Imaging of postcuring process
It is common practice to postprocess photopolymerized 3D printed objects by simultaneous light exposure and heating (often to 60°C). Postcuring is required to achieve the desired mechanical properties of 3D prints. Timing and light intensity need to be optimized for the object's size and the resin used. In industrial use, an unnecessarily long curing process may reduce the manufacturing throughput and the profit margins, as a result. In addition, overexposure may damage the polymer chains, weakening the mechanical strength of a printed object. EPR imaging is proposed as a tool to monitor and optimize the postcuring process. Toward this goal, a cylinder (described in Sample preparation: 2) was polymerized under ultraviolet (UV) light and imaged with EPR. The cylinder was then postcured for 30 min at 60°C in the Form Cure machine (Formlabs) and imaged again. Voxels in 4D EPR images measured before and after postcuring were processed to obtain two 3D oxygen maps using the line-fitting procedure described above. The difference between the two O2 maps (Fig. 5) demonstrates changes in oxygen distribution as a result of curing. Histograms of pO2 distribution in the photopolymerized cylinder before and after postcuring are presented in Figure 6.
Change in oxygen partial pressure in the units of mmHg across a photo-polymerized cylinder as the result of the curing process. Slices
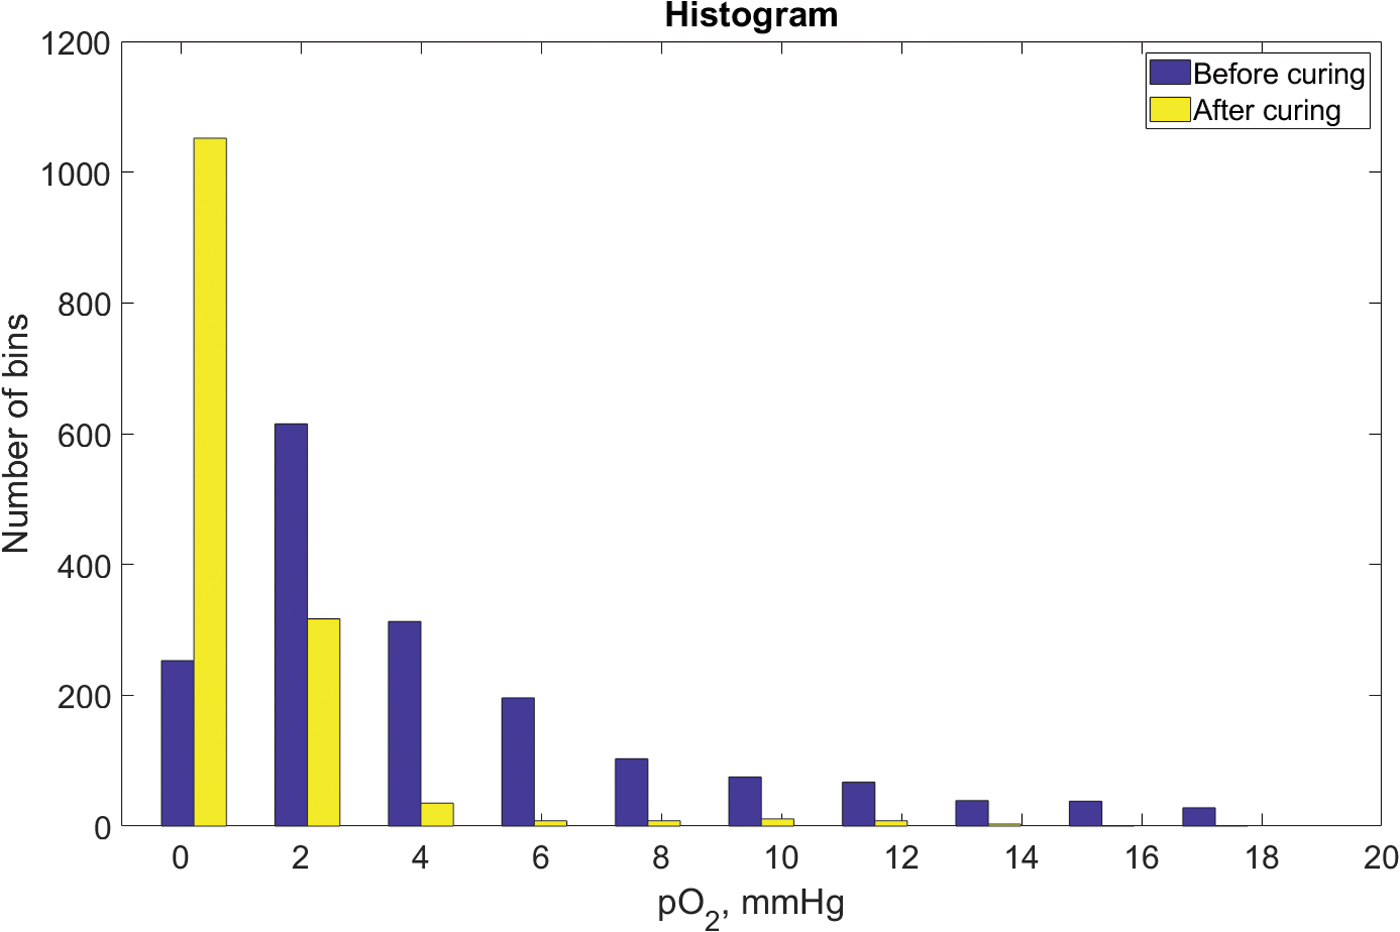
Histograms of pO2 distribution in the polymerized cylinder before and after postcuring. The number of voxels in the precuring and postcuring oxygen images are 1727 and 1442, respectively. The difference in the numbers is the result of the thresholding procedure that removes voxels with low signal-to-noise ratios. The voxel volume is approximately 3e-4 mm3. Color images are available online.
Imaging of 3D printed spiral
Oxygen distribution in a 3D-printed spiral was visualized. Oxygen concentration was found to be higher at the perimeter of the spiral and in areas with less resin. The CAD model (Fig. 7a) was sliced with Simplify3D and printed using the modified Ender-3 Pro printer (Fig. 1). The 3D printed spiral shown in Figure 7b was imaged. The oxygen image (2D slice from 3D map) shown in Figure 7c demonstrates a close resemblance in shape with the printed object.

OpenSCAD spiral model
Discussion
Proof-of-concept experiments were conducted to demonstrate the capability of EPR imaging to monitor the light-induced consumption of oxygen in the resin used for 3D stereolithography (SLA) printing. It was shown that the incorporation of oxygen-sensitive EPR probe into SLA resin permits monitoring of the photopolymerization and postcuring processes. The latter can be used to time- and quality-optimize postprocessing of 3D printed objects. EPR imaging can also be used to visualize internal structures of the prints that are not visible to the naked eye. In this capacity, EPR can serve as an alternative to other imaging modalities, such as computed X-ray tomography (CT). In comparison with CT, EPR, in addition to spatial information, measures oxygen distribution in the printed objects.
To demonstrate the feasibility of 3D printing using SLA resin impregnated with an EPR probe, an extrusion-type 3D printer was modified (Fig. 1). A spiral model (Fig. 7) was printed and imaged. The quality of the print was not perfect given the use of a modified plastic printer. However, the EPR image captured the real shape quite accurately. The introduction of oxygen-sensing probes into resins used in the commercial 3D SLA systems will improve the print quality and permit oxygen imaging.
The imaging technology described in this article has the potential to become a practical tool for the developers of 3D printers and resins. Imaging of oxygen will provide a unique insight into the polymerization process not achievable with any other technique. Further studies need to be conducted to optimize probe concentration. It needs to be low enough to ensure no interference with the printing process and high enough to produce high-quality oxygen images. Faster image acquisition will be more informative in capturing oxygen diffusion real-time, during printing. Increasing gradient strength to about 30 G/cm will permit oxygen mapping throughout the entire sample, including fully oxygenated (21%) regions. However, in this case, the reduction of sensitivity may need to be compensated by increasing the probe concentration. Imaging of the postprint curing process may become a valuable tool to optimize both duration and light intensity.
The monitoring of oxygen and other important biomarkers in bioprinted structures is another future direction for this technology. We hope that this article will serve as a starting point for future collaborative research with manufacturers and developers of 3D printers and other interested parties. For example, we envision the application of EPR oximetry to 3D printing in dental research and clinical practices.52,53 EPR imaging could be additionally used to study polymer degradation over time caused by atmospheric oxygen. 54
Footnotes
Disclaimer
The content is solely the responsibility of the authors and does not necessarily represent the official views of the National Institutes of Health.
Author Disclosure Statement
No competing financial interests exist.
Funding Information
This work was supported by the NIH grants R01-EB023888, U54GM104942, and P20GM121322. This project was supported by the RAP WVU program for undergraduate students (V.S.).