




Abstract
Fused filament fabrication is one of the most desired thermal plastic additive manufacturing processes because of its ability to fabricate complex objects with high accessibility. However, due to the extrusion track-based direct write process mechanism, parts built using this method exhibit anisotropic mechanical properties. In this work, an in-process laser heating method is introduced to heal interface adhesion between adjacent deposited tracks by increasing the interface temperature to promote polymer reptation and enhance bonding strength of the interface of adjacent tracks. With the use of laser heating induced interface healing, the measured flexural strength between adjacent tracks in the same layer increased and exceeded that of the control sample tested along the track direction. The effect of laser on interface healing was also verified by investigating the load–displacement curve and morphology analysis of the fractured surface.
Introduction
Additive manufacturing, also known as 3D printing, is a layer-by-layer fabrication process of 3D objects from a digital 3D model.1,2 Fused filament fabrication (FFF) has become a preferred additive manufacturing method for thermal plastic materials due to its accessibility, and process and material flexibility.3–5 In the FFF process, a filament feedstock of thermoplastic polymer is forced through a heated nozzle that operates above the glass transition temperature of the feedstock material. The softened filament flows through the nozzle orifice to form a cylindrical track of reduced diameter. The cylindrical track of thermoplastic material is then deposited and bonded to a build plate surface or previously deposited material layer to form tracks, layers, and eventually 3D objects.6,7
To control the deposition process, a slicing software is used to slice and convert the 3D model into motion control commands to control movement of nozzle and build plate, extrusion speed, temperature, and other process parameters for a 3D printer to operate continuously. 8 FFF has numerous advantages, including a wide range of printable material,9–13 ability to print multiple materials in the same build space, 14 ability to produce an object of a wide-dimensional range, 3 and ability to process biomedical materials.15,16 However, parts fabricated using this method are anisotropic. 17
The anisotropic property of an FFF-built object originates from the nature of extrusion-based process. In this process, filament is extruded from a nozzle and undergoes a diameter reduction usually from 1.75 to 0.4 mm, while it is deposited steadily on an existing surface. The mechanics and rheological behavior of the extrudate in this process have been described by the following two models: the “nozzle flow” and the “90° turn.”18–21 These models provide some insight into this process with a thermomechanical explanation. As described by these two models, polymer chains are highly stretched and disentangled in deposited tracks, especially within the region in proximity of the track surface.20,22 In order for the printed part to be isotropic, full reptation and relaxation are required for the polymer chains at the surface of the deposited track and at the interface between tracks. Both relaxation and reptation are time- and temperature-dependent.20–22
In fact, if enough time at sufficiently high temperature is allowed, polymer chains are capable of fully relaxing and entangling to form microstructures similar to those of parts fabricated using traditional methods such as injection molding. However, during the actual deposition process, polymer extruded from a nozzle and deposited on or next to a previously deposited track which are at a lower temperature due to the time it takes for the nozzle to travel along its prescribed toolpath. The resulting lower temperatures on interfaces do not allow reptation and relaxation to fully occur.17,21 As a result, the mechanical strength of parts fabricated with FFF is anisotropic, primarily in the directions normal to track–track and layer–layer interfaces being the weakest.
Various efforts have been made to improve the mechanical strength uniformity of FFF-printed parts, as shown in Table 1. 23 Many have focused on improving the interlayer bonding strength by optimizing printing parameters, such as nozzle temperature,24–27 build plate temperature,28,29 print speed,27,30 layer thickness,31–34 and raster strategy.35,36 However, the range of effectiveness of optimizing printing parameter is limited due to the process physics of FFF method (e.g., stretch and disentanglement from extrusion, and low interface temperature between tracks and layers for reptation and relaxation). Postprocesses such as annealing have also been used to increase bonding strength.37,38 In-process approaches using laser heating17,21,22 and ultrasonic vibrations 39 have also achieved increased adhesion at interlayer interfaces.
Number of Publications for Strength Enhancement of Fused Filament Fabrication
Directions: X: in-plane (along track) direction, Y: between adjacent tracks direction, Z: build direction.
However, all the reported work in the literature thus far focuses either on the bonding strength at the interlayer interface or mechanical strength along the in-plane direction. Work focusing on the interface healing process between adjacent tracks in the same layer has not been reported.
In this work, the effect of in-process laser-assisted method on healing the interface between adjacent tracks in the same layer is investigated. An in-process laser preheating apparatus is designed and implemented. The interfaces between adjacent tracks of control and laser-assisted samples are characterized and compared. Mechanical testing is used to investigate strength as well as flexural behavior of laser-assisted samples of different process inputs.
Experimental
Orbiting laser preheating apparatus
A commercial 3D printer (Type A Machine Series 1, San Francisco) was used as the platform for the laser preheating apparatus. The controller of the printer was replaced with a Duet 2 Wifi (Duet3D, United Kingdom) for laser input rotation control. The laser (808 nm) preheating apparatus was implemented (Fig. 1a). To rotate the laser about the nozzle and filament axis, a stepper motor was used to drive a gear set, which defines the angular position of the nozzle-laser mount assembly. The stepper motor was controlled as an independent axis whose position is defined in the same g-code file used for printing. A custom postprocessor was developed to add rotational commands to an existing g-code file generated by a commercial slicer software. The final g-code file contains commands that allow the laser illuminated spot to stay on the boundary of a predeposited adjacent track and the track being deposited.
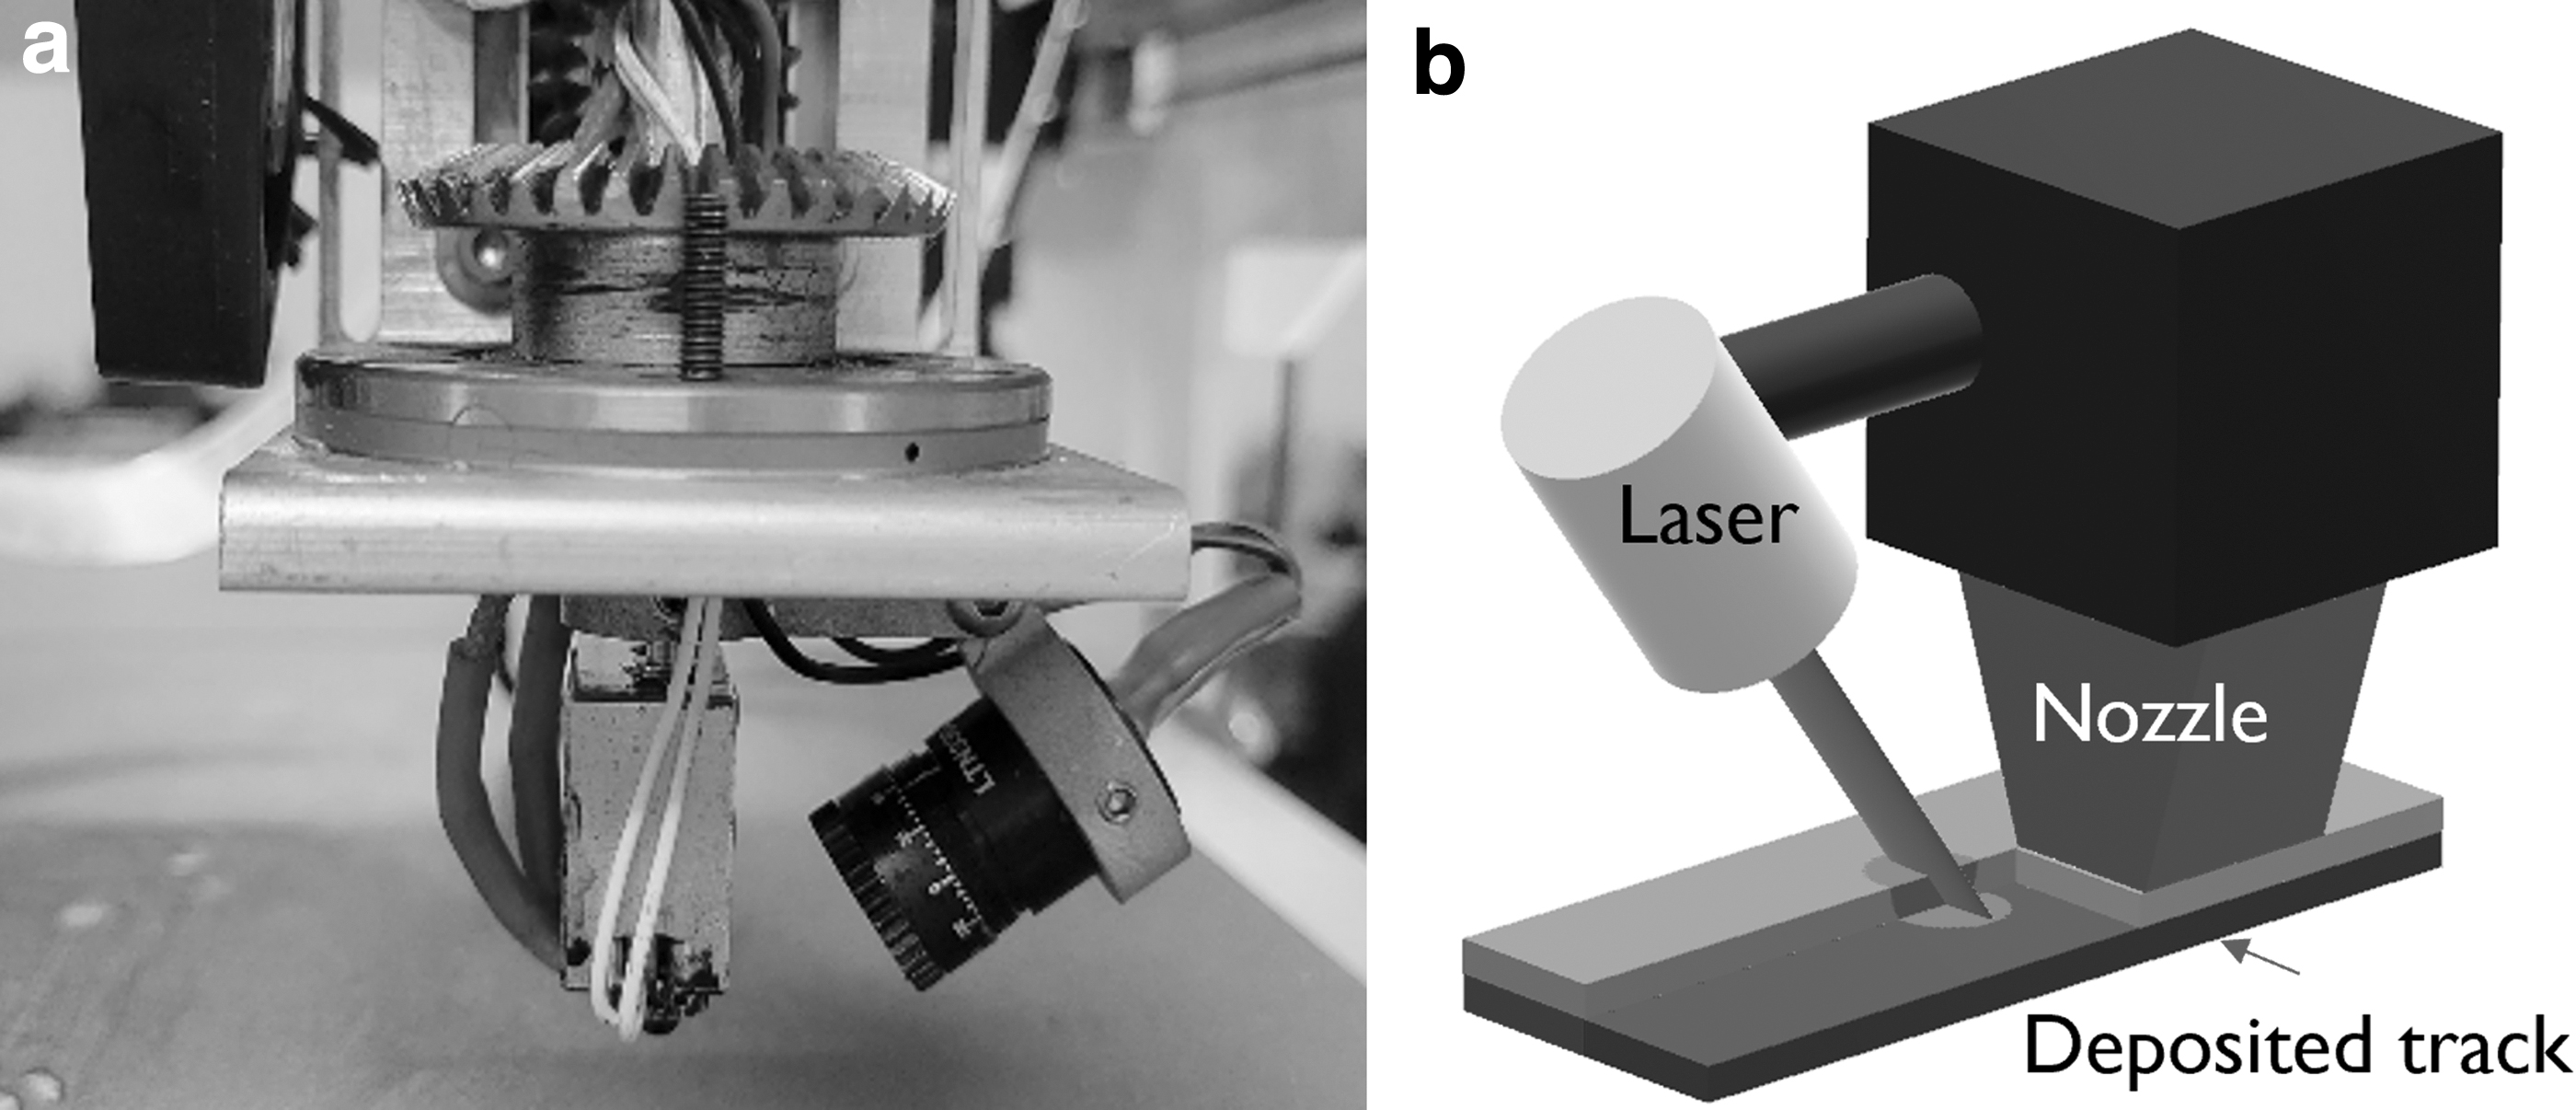
More specifically, half of the intensity falls on the adjacent track (current layer, marked in light blue), while the other half falls on the previously deposited track (one layer lower than the current layer, marked in dark green) underneath the current track (right under the nozzle, marked in light green) (Fig. 1b). The shape of laser spot is rectangular with a length of 1 mm and a width of 0.5 mm (this is the fully focused spot size, and the distance between laser source and laser-heated spot is fixed). The center of laser spot is positioned at the intertrack interface to avoid side effects (postheating, this effect can also be increased by increasing laser focal size) on nearby tracks (tracks next to blue or green tracks) (Fig. 1b).
Sample preparation
A black polylactic acid (PLA) filament (MakerGear, Beachwood) was used as the feedstock material. The print parameters are shown in Table 2. The printed samples were multiwall rectangular blocks (Fig. 2a), with dimensions of 80 mm by 50 mm by 5 mm. The printed samples were cut into 4-mm-wide bars (along the red dash lines) (Fig. 2a) using a diamond cutter (Preciso-CL; Top Tech Machines Co. Ltd., Taichung, Taiwan) for use as bending test specimens. The same procedure was used for samples with laser powers from 0 to 250 mW. Another control group of samples were fabricated for the flexural behavior along track direction (longitudinal direction, marked with blue dash line; Fig. 2a) without laser.

Print Parameters
Mechanical test
An MTI-2K tensile testing machine (Measurement Technology, Inc., Marietta) and a set of customized three-point bending tooling were used for the flexural test. For each laser power setting, load–displacement data from four samples were collected. The preload for flexural test was 30 N, and the tool displacement rate was 5 mm/min. The thickness of all flexural samples was 5 mm. 40 The actual width of each sample was measured before each test and was used for calculation of flexural strength. The distance between the two fixed lower supports in the three-point flexural test was 15.11 mm (Fig. 2b). Note that due to configuration of the bending test, the bottom of the bar experiences tensile stress, while the top side experiences compression.
Temperature profile
Thermal images of samples during printing were collected using an Teledyne FLIR LLC a6753sc thermal camera (FLIR, Wilsonville). The highest temperature detected at the laser spot was considered the temperature of the preheating spot. The heated spot temperature versus input laser power was plotted (Fig. 3). Due to the size of the thermal camera and configuration limitations of the setup, the thermal images were captured from an angle of 53° with respect to the nozzle axis (where the nozzle is orthogonal to the build plate). Therefore, the temperature profile is used only as a reference but not for calculation. An example of a thermal image taken during print is included (Fig. 3).

Thermal profile of laser preheated spot (three thermal images were taken for each laser power, black block for average value and error bar for standard deviation).
Scanning electron microscope imaging
A scanning electron microscope (SEM) (TESCAN for control and 150 mW laser sample, Zeiss Auriga for other samples) was used to image the fracture surface of bending samples. The bottom tracks of samples that experience tension during a bending test were focused on. The microscopic images of two areas—interlayer position and intertrack interface—were analyzed to determine the effect of laser heating on fracture mechanism.
Differential scanning calorimetry
PLA is a semicrystalline polymer. The energy input from laser heating may result in a slower cooling rate, therefore increases the crystallization during cooling. Differential scanning calorimetry (DSC; TA Instrument, New Castle) was used to characterize the effect of laser heating in crystallization during the cooling process by measuring the cold crystallization enthalpy. The heating rate used was 10°C/min.
Results and Discussions
The flexural strength of laser-assisted sample along with two control groups, one for control samples of flexural testing without laser predeposition heating (lower horizontal line) and the other group for strength of printed track along the track direction (upper straight line), was tested (Fig. 4). It is noteworthy that strength along track direction showed the strongest value obtained in the FFF process as a result of breakage of the deposited track along its length direction. 17 In contracts, the flexural strength of control sample (that represents adhesion between adjacent tracks) showed 80.3% of strength along track direction. Interestingly, with the laser preheating process, the flexural strength of 150 mW laser sample achieved 106% of that for samples along track direction.

Flexural strength of laser-assisted and control samples (four samples each set, error bar represents standard deviation).
The 6% increase can be explained by previous research 22 that a 10% increase in mechanical strength along track direction was noted with the usage of laser, while it was still weaker than the raw material. Hence, the flexural strength of 150 mW still lies in a reasonable range. Therefore, this process has effectively demonstrated the effect of resolving strength anisotropy by healing the interface between adjacent deposited tracks within a certain range of laser power. A decrease in flexural strength, however, was observed once laser power exceeded 150 mW. This trend can be attributed to polymer degradation, which has been seen in previous works.17,21 At the lower range, no significant effect on flexural strength was detected with the use of 100 mW laser predeposition heating. This cutoff limit can be viewed as a consequence of not reaching the threshold level required for occurrence of thermal diffusion.
The effect of laser preheating on flexural strength between adjacent deposited tracks can be explained using the following equation proposed by Ezekoye. 41

where
Both Ds and
In addition to the mechanical strength, the interface healing from the laser preheating process also has observable effects on maximum displacement at fracture (ductility). The displacement of sample (Fig. 5) at fracture corresponds to data points (Fig. 4) for each sample. All laser samples showed a similar displacement value upon fracture, and all stay higher than those of control sample. The displacement of 150 mW laser samples shows a slightly higher value than those of all other samples and has reached 68.8% of samples tested along track direction. Note that displacement for control sample is only 50.1% compared with that of samples along track direction.

Displacement upon flexural failure or ultimate strength (for samples along track direction).
To better understand the mechanical behavior of each sample group before fracture, the load–displacement curves of one sample in each group (control samples, 150 mW laser samples, and samples along track direction) were investigated (Fig. 6). Note that the flat region from 0 to ∼0.6 mm is not counted as displacement (because of sliding). Both control sample and 150 mW laser sample show stiffer behavior than sample along track direction. The highest load and slop data for laser samples were observed at 150 mW.
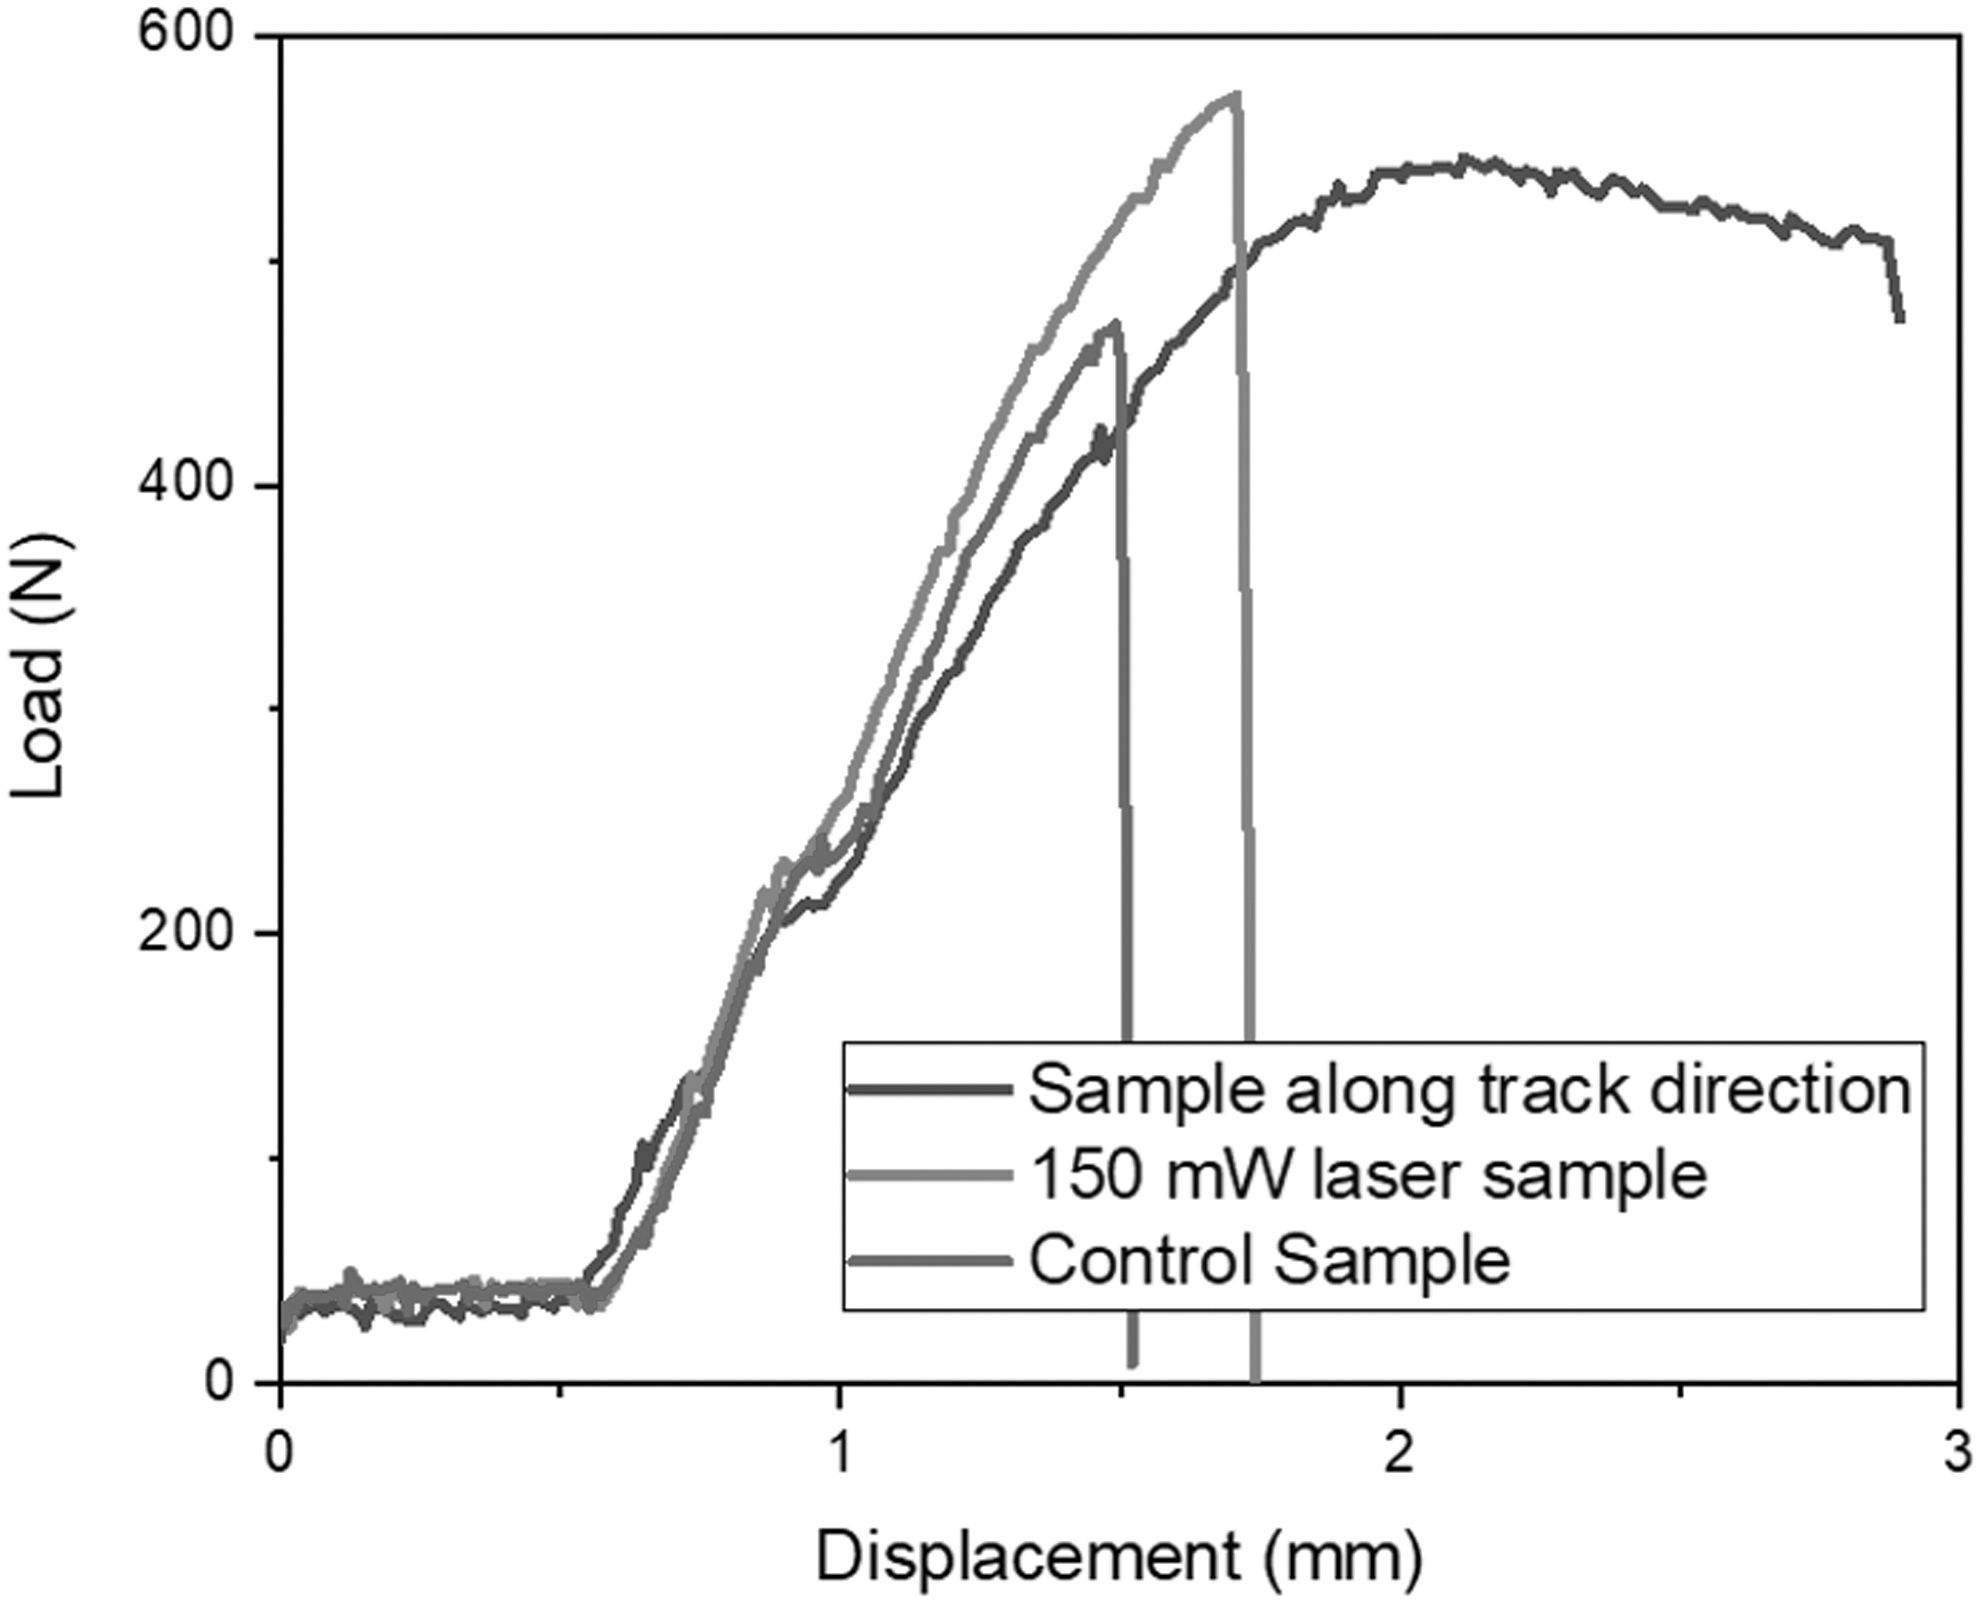
Load–displacement curve of samples in different groups.
It can be seen that the curve for 150 mW laser sample is slightly steeper than that of the control sample (Fig. 6), but the flexural strength of 150 mW laser sample is significantly higher. The difference is attributed to the interface healing induced by the laser predeposition heating process. To be more specific, with the laser predeposition heating process, a higher interface temperature was achieved and resulted in longer time for mass transfer across the interface (reptation) and relaxation. Relaxation is defined when stress in a linear polymer chain relaxes through a curvilinear diffusion path and finally confined into a tube region for reptation. 22 Hence, the fracture mechanism of control sample contains a higher percentage of pulling disentangled polymer chains out, while in that of the 150 mW laser sample, there is a higher amount of breaking entangled polymer chains.
In the sample along the “track” direction where no laser heating process is involved, a higher fraction of polymer chains are orientated along the same direction with a lower amount of entanglement due to the nozzle flow and 90° turn. The fracture mechanism becomes elongating and breaking/pulling out polymer chains. Furthermore, necking behavior has been observed for the lower layer during flexural test. Therefore, the lower flexural strength of sample along track direction can be explained by a lesser amount of entanglement and reduction of width during test.
The microimages of the fracture surfaces (between adjacent tracks) were taken using SEM (Fig. 7). The flexural failure surface of control (Fig. 7a) and 150 mW laser sample (Fig. 7b) with a lower magnification was presented, respectively. The area shown (Fig. 7a, b) represents the bottom of sample during flexural test (Fig. 2b). In the flexural test, the bottom of the sample experiences tension, while the top of the sample experiences compression. The SEM image focused only on the layers at the bottom since it is the location where fracture initiated. The photograph at the bottom left that enlarged the local region (Fig. 7a) clearly shows the interface of adjacent tracks in three layers. Gaps are observed between tracks from the neighboring layers.
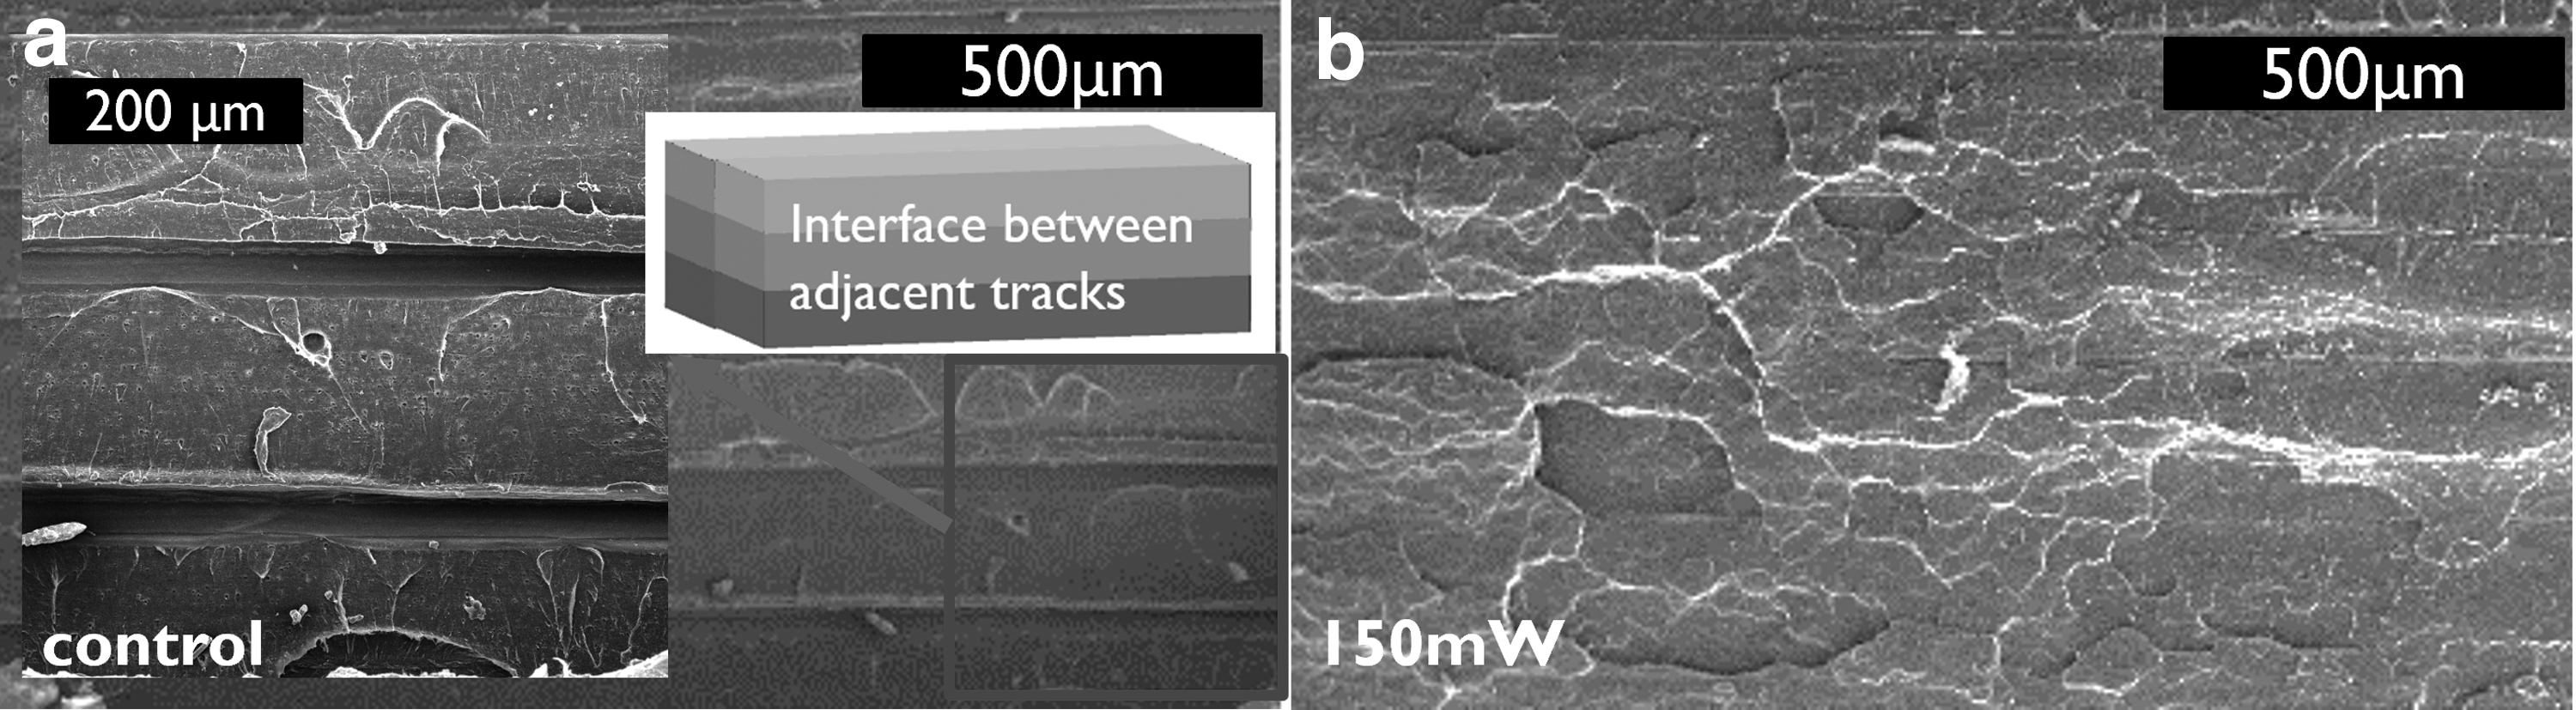
SEM image of flexural surface at low magnification.
Clearly, in the 150 mW laser sample (Fig. 7b), no gap between tracks in the same region was observed. The gaps between tracks represent the weakest region in FFF 3D-printed parts. It is a straight region located at the intersection of two planes: interlayer interface and the interface between adjacent tracks. Fracture under load typically initiates in this region. The laser preheating process irradiated heat directly into this weakest region (edge of tracks), and therefore promotes mass transfer of polymer chains in that region and reduced the anisotropic behavior.
At a higher magnification (Fig. 8), the control sample (Fig. 8a) appears to have a smoother fracture surface, while that of 150 mW laser sample (Fig. 8b) seems to be rougher with string-shape and peeling-off surface feature. The 100 mW laser sample (Fig. 8c) shows a fracture feature between control and 150 mW laser sample with very few peeling-off feature. Therefore, the fracture process between tracks in control sample exhibit less plastic deformation; while in comparison, the 150 mW laser sample shows significant string-shape material pulling-out feature. This result further verified the reptation across the interface between adjacent tracks.
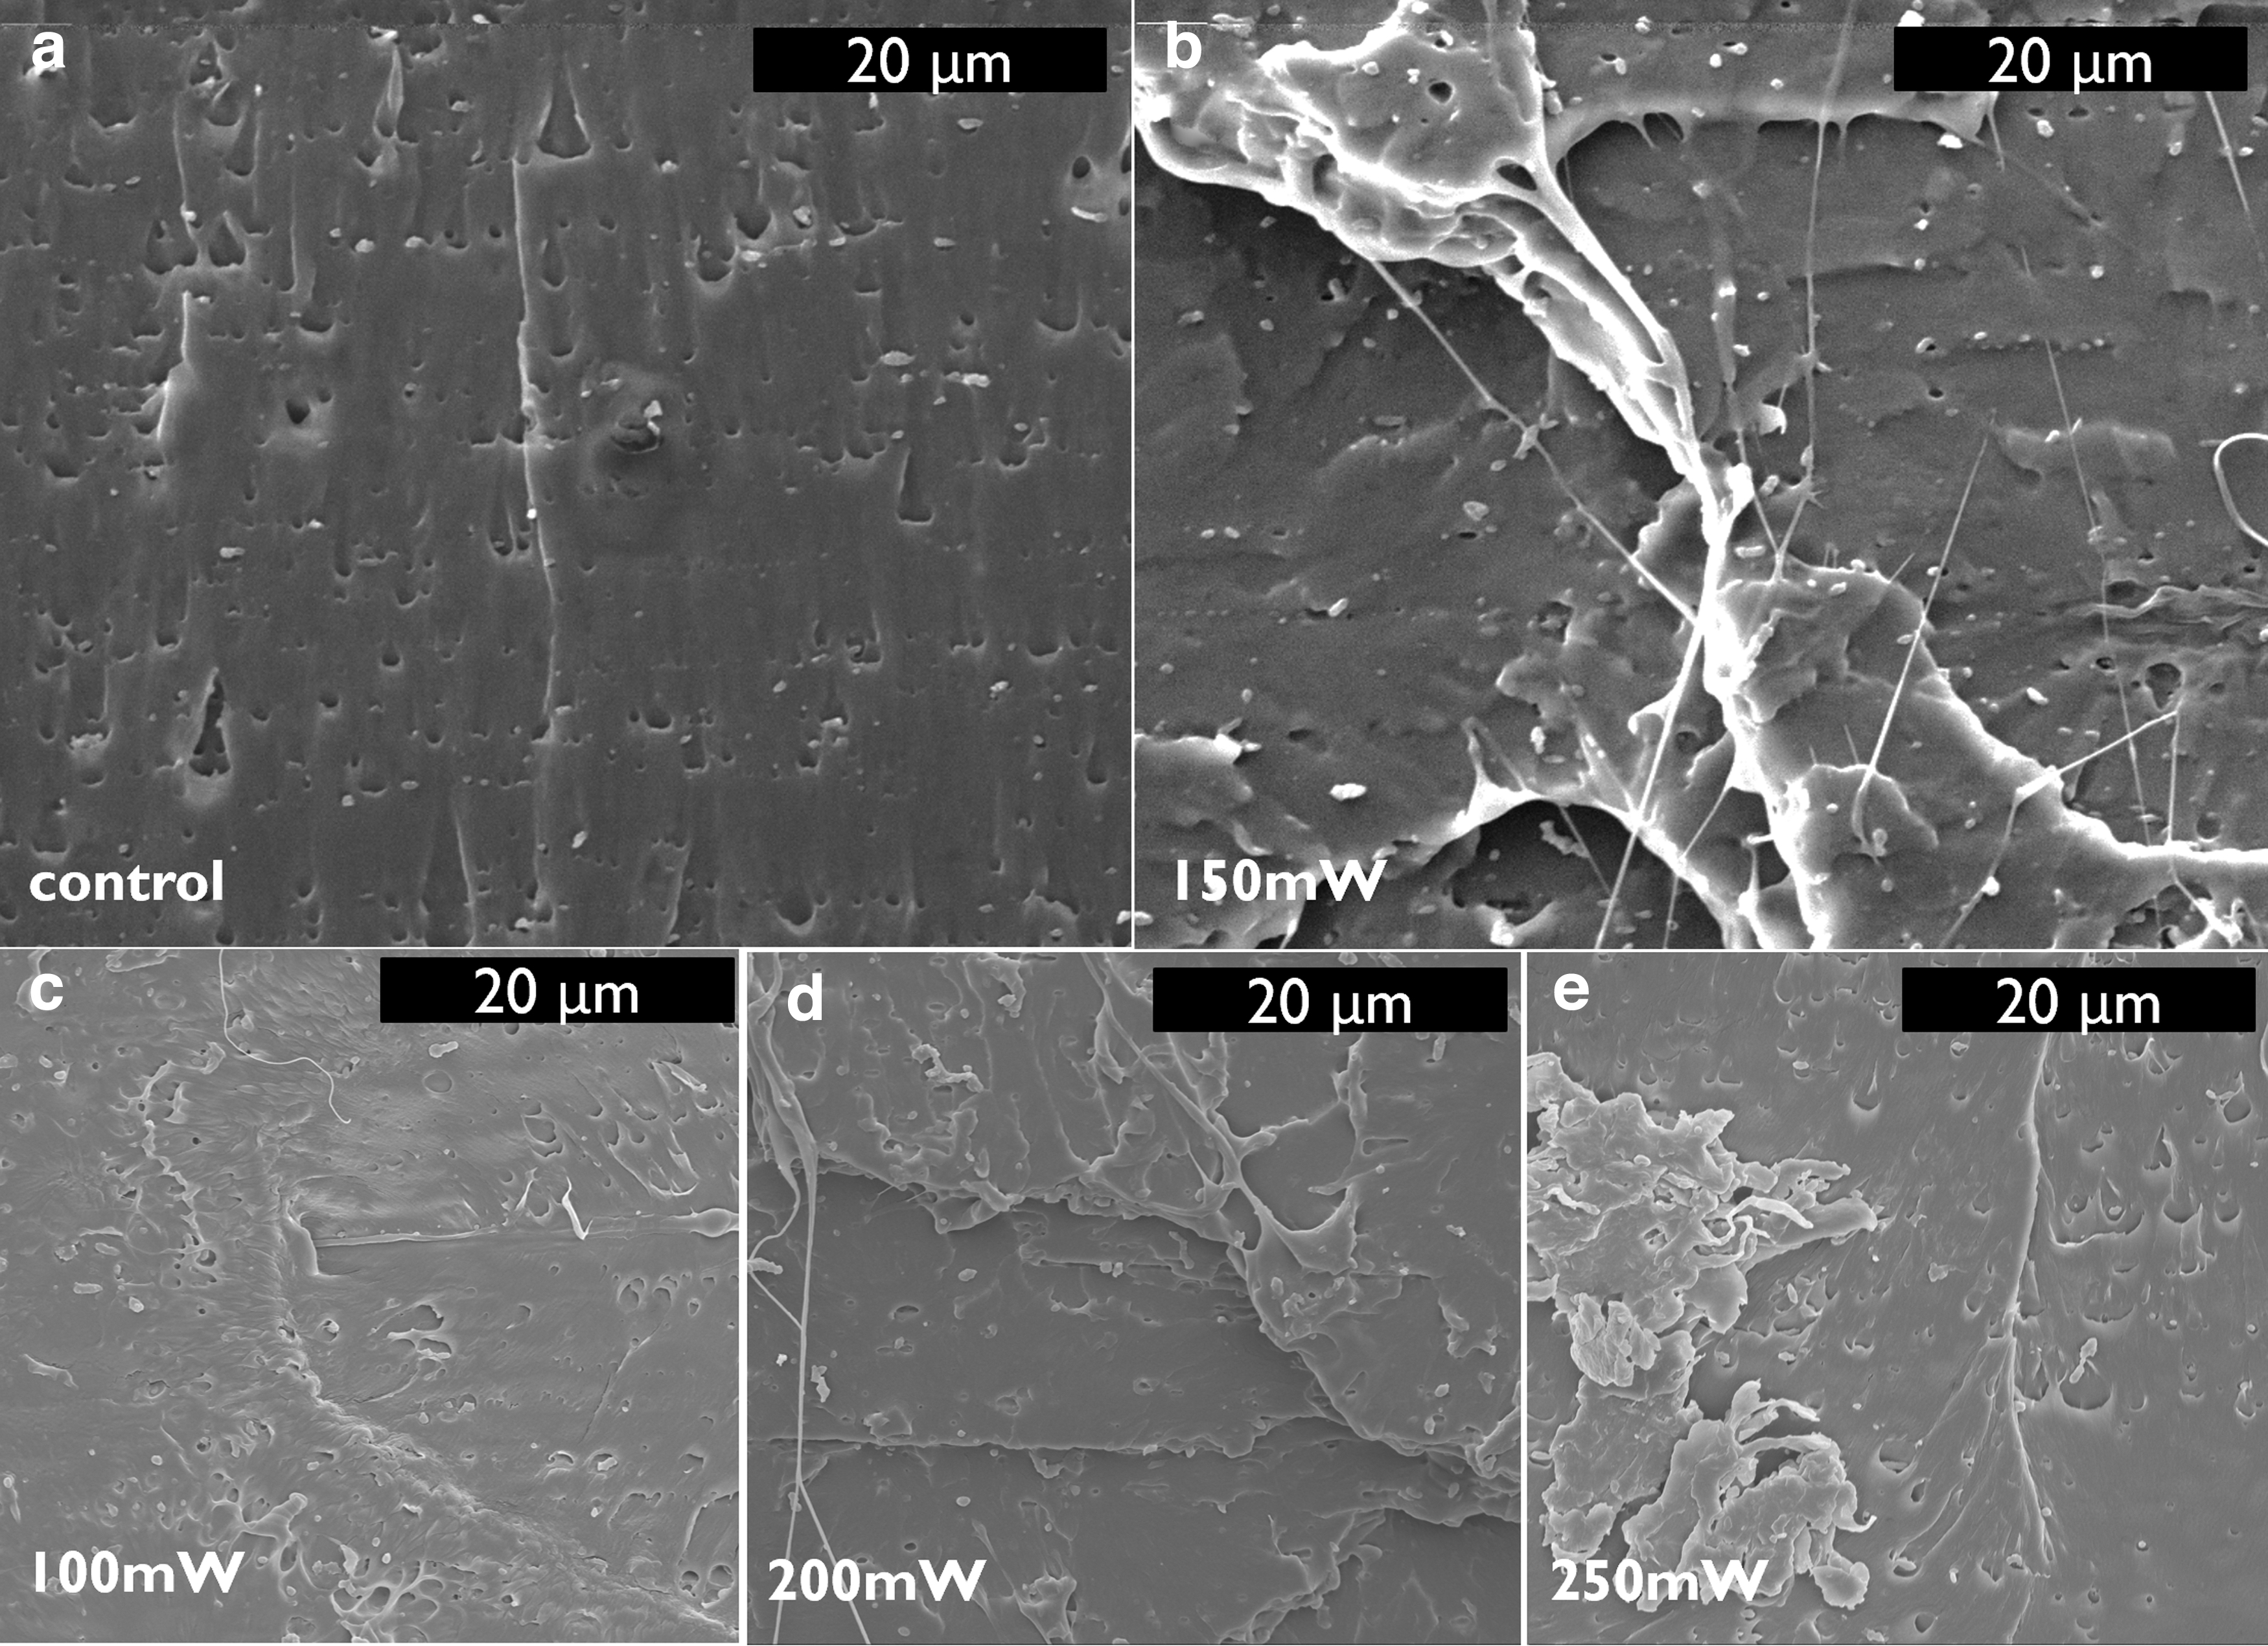
SEM image of flexural surface at high magnification.
The fracture surface of 200 mW sample is similar to that of 150 mW. As the laser power increased to 250 mW (Fig. 8e) that a decrease in tensile strength is observed (Fig. 4), the part of the fracture surface (right side) turns to be similar to control sample, which means the amount of reptation that happened across the interface is limited. The left side of the image (Fig. 8e) shows brittle fracture feature. This indicates that polymer degradation happened at the interface, and therefore weakens the bonding between adjacent tracks.
A difference between control and 150 mW laser sample in crystallization is observed from DSC heating data (Fig. 9). The first and last peaks are for glass transition and melting, respectively. The peak in the middle is for cold crystallization. The cold crystallization peak of control sample is slightly higher than the 150 mW laser sample, which means a higher amount of crystallization was allowed to happen in the control sample during the DSC heating cycle. Therefore, the crystallinity of control sample is lower than that of 150 mW laser sample due to the difference in cooling process during fabrication. The cold crystallization enthalpy for control and 150 mW laser sample is 7.94 and 5.57 J/g, respectively. Therefore, this in-process laser heating technique increases polymer crystallinity in FFF-printed parts.

DSC heating cycle data for control and 150 mW laser sample. DSC, differential scanning calorimetry.
Conclusions
The effect of laser preheating on interface healing between adjacent tracks of 3D-printed PLA using FFF was investigated. Flexural test was performed on control and laser preheating bending samples. The effects of laser preheating on flexural behavior and energy-material property interaction were observed and discussed. An increase in flexural strength between adjacent tracks up to 106% of that along track direction was found, as well as an increase in displacement upon fracture from 50.1% to 68.8%. The effects associated with the use of laser preheating are attributed to the thermal-induced increase in polymer reptation and relaxation, hence gave rise entanglement at the interface between adjacent tracks.
Footnotes
Authors' Contributions
P.H.: Conceptualization, methodology, investigation, formal analysis, data curation, and writing—original draft. A.T.: Writing—review and editing, and formal analysis. S.Z.: Investigation and formal analysis. J.J.I.: Formal analysis. K.H.: Writing—Review and editing, supervision, project administration, and funding acquisition.
Acknowledgments
We thank Mr. Varunkumar Thippanna and Dr. Kenan Song for helping with DSC, and Mr. Aliaksandr Sharstniou and Dr. Bruno Azeredo for helping with Zeiss Auriga SEM (Arizona State University).
Author Disclosure Statement
No competing financial interests exist.
Funding Information
No funding was received for this article.