
Abstract
In connection with the growing demand of the medical and medicine-related industry for materials exhibiting biocompatible properties used as part of three-dimensional (3D) printing additive technologies. The article presents research results concerning rheological and selected mechanical properties of a modern, photocurable MED610 resin, which is also used mainly in medicine, as well as dentistry. The article also shows extensive results of testing bending stress relaxation and creep, as well as the tensile strength of samples created with the PolyJet Matrix (PJM) technology. The authors used various sample types, including ones of unique shape and a hexagonal cellular structure. The analysis of the impact of element orientation on the working platform of the machine (3D printer) on the obtained test results (so-called printing direction—Pd) was also taken into account as a key technological parameter of the 3D printing process. Experimental rheological curves were matched with theoretical curves resulting from the application of a five-parameter Maxwell–Wiechert (M-W) model in the case of stress relaxation and a five-parameter Kelvin–Voigt model for creep. Very good matches were achieved, mean coefficients Chi2 = 0.0014 and R2 = 0.9956 for matching the five-parameter M-W model and mean coefficients Chi2 = 0.000006 and R2 = 0.9992 enable recommending the obtained results to be used for various engineering calculations, especially computer simulations. Moreover, the use of relaxation curves can significantly increase the construction capabilities within the design process, which includes the MED610 material.
Introduction
The ongoing industrial revolution 4.0 is currently entering a very advanced stage especially in quality control aspects. With it we are observing a significant development of the material chemistry industry involving three-dimensional (3D) printing technologies, very much fitting the realities of the so-called lean manufacturing. Polymer materials can be used in tissue engineering and for the manufacturing of cellular scaffolding, since they are distinguished by versatility in terms of processing and machining, adaptability, degradability, and biocompatibility. 1 However, in most cases, polymer materials are used to manufacture medical equipment, with polyethylene, polypropylene, polystyrene, polyesters, polyvinyl chloride, and polycarbonates being the most often used types. In the event of using these materials in orthopedics, they must be characterized by good mechanical properties and high strength within the biological system. 2 Therefore, very often the materials used in 3D printing are additionally reinforced through introducing, for example, glass or carbon fibers. 3
In addition, a structure is frequently required to exhibit numerous geometrical features, such as thin-walled, which has not been previously fully described in research articles, and what is made possible by 3D printing. 4 Polymer materials are also used in prosthetics, for the production of tendons (polyester fabric), hip joints (polymethyl methacrylate), hand joints (silicone rubber), or bones (polyester plates). In the case of temporary in vivo applications, polymer materials are used for producing vascular and urinary catheters, wound dressings, and ureteral stents. Moreover, polymers are used in drug delivery systems.2,5,6
Polymer materials used in tissue engineering are biobased (if they fully or partially originate from biomass resources) and biodegradable (if they can be treated as a carbon source by microorganisms and safely transformed into carbon dioxide, biomass, and water). Such biopolymers can be divided into three groups, namely, biopolymers originating from renewable resources, but not subject to biodegradation (e.g., biobased polyethylene); biopolymers originating from nonrenewable resources, but subject to biodegradation (e.g., polybutylene adipate terephthalate); biopolymers originating from renewable resources and subject to biodegradation (e.g., polyhydroxyalkanoate).7–9
3D printing enables creating complex structures used in regenerative medicine, disease modeling, or orthotics. For this purpose, sought after are biopolymers with adequate chemical and mechanical properties, to be used for the construction of regenerative implants, and also able to fully recreate the biological functionality and structural complexity of organs. 10 It is also important to test the tribological properties of the models (prostheses, implants) created using additive technologies and with medical materials, and searching for composites that would improve them.11–13 Designing such advanced polymers for medical applications is a complex process, shaped by clinical needs and relationships between material structure and its function. It covers numerous material engineering disciplines, such as multiparticulate chemistry, polymer matrix morphology, composite materials, as well as complex 3D geometries at the nano-, micro-, and macroscopic levels.
In the light of the progressing research on biopolymer fabrication, it is becoming obvious that they will have a key application in reaching future breakthroughs in regenerative medicine, drug delivery systems, and little invasive surgery. 14
Thin-walled structures are used in almost all fields of science, increasingly more often also in the construction of elements using 3D printing additive technologies. Compared with conventional manufacturing processes, for example, Computerized Numerical Control (CNC), 15 3D printing is characterized by completely different process parameters and the top layer quality, which are extremely important in medical applications. Thin-walled elements made from plastics, depending on the selected material and fabrication technology, may be rigid or flexible and bent several fold within their bending range without the risk of a crack. The distinguishing feature of thin-walled elements and cellular structures is their lightness, while maintaining all the strength-related characteristics.
Selecting a material with high-strength properties, while optimizing the structure through controlling element thickness, ensures mass reduction and maintaining mechanical properties. 16 This enables obtaining the highest strength with the lowest object weight, which fits the lean manufacturing development trend. Activities as part of the ongoing industrial revolution 4.0 involve developing hybrid/composite structures combining 3D printing and electrospinning,17,18 significantly increasing the medical application potential of such models. Due to the need to save the materials, thin-walled cellular structures are the most economic solution and promise a prospective development-wise future. Manufactured items are also filled with a thin-walled cellular structure, which significantly affects the mechanical properties of elements such as implants, prostheses, crowns, bridges, bone restorations after accidents, or even medical robot grippers, which are lightweight, thin-walled structures. 19
Due to the fact that additive technologies are characterized by a technological process that involves applying the material layer-by-layer, it is important to determine printing orientation relative to the working platform of the element, and also, in many cases, using a material reinforced with additives, which positively impacts mitigating the phenomenon of anisotropy. 20
Another important issue from the perspective of studies associated with a practical application of modern materials in 3D printing is the research on load constant over time, that is, rheology. Rheological testing of materials, including cellular structures, involves tensile, compression, bending or relaxation, and creep resting of structures. The problem is that the number of studies on relaxation and creep is negligible and mainly involves compressing cellular structures, which is not always sufficient.21,22
Rheological properties reflect the behavior of a solid body under loads or strains, taking time of exposure into account. Rheological tests provided graphs demonstrating material creep and stress relaxation phenomena. Stress relaxations may be defined as internal stress reduced over time, with strain remaining constant.23,24 The material creep phenomenon is defined as strain increase at a constant stress.25–27 Known rheological models are used to mathematically describe the stress–relaxation curve.26,28 The most common rheological model used to describe the relaxation curve is the five-parameter Maxwell–Wiechert (M-W) model.29–32 The five-parameter Kelvin–Voigt (K-V) model is often used in the case of material creep. 28
The research on the rheological properties of 3D-printed models was the subject of several articles, however, their number is insufficient and they do not exhaust the research topic, particularly in the context of medical materials. Kozior 22 used a five-parameter M-W model to describe a relaxation curve of a model created using the selective laser sintering (SLS) technology involving the PA 2200 polyamide. It was demonstrated that the layer thickness, as one of the process parameters in 3D printing using the SLS technology, had the highest impact on stress relaxation, which meant that increasing layer thickness entailed greater stress relaxation.
Subsequent studies of stress relaxation, taking into account the impact of the constructed layer thickness, printing orientation, and density of the energy supplied to a sintered powder layer, have been discussed in Kozior. 33 The authors, according to the lean manufacturing trend, determined optimal technological parameters that enable constructing high-strength models, including rheological, but with reduced weight, which leads to optimizing not only the structure but also the fabrication process and has a significant ecological importance, with the issue often omitted in engineering and research work.
Resan and Challoob 34 demonstrate research that involved assessing the impact of creep and stress relaxation of the material used for the popliteal acetabulum in a leg prosthesis and an analysis of strain resulting from a reduced stress relaxation modulus.
Reis et al 35 studied nanocomposite-based materials printed in the fused filament fabrication—FFF/fused deposition modeling (FDM) technology. Material creep and stress relaxation were tested using compression, bending, and tensile tests.
As demonstrated, rheological tests enable an actual assessment of material behavior under a constant load, since constant loads over time are the dominating load time in most industrial cases.
The objective of the research discussed in this article is assessing the rheological properties of the MED610 medical material relative to constructing SOLID-type full models having a cellular structure. The article also evaluated the mechanical properties of an empty hexagonal structure and filled with support material, made from the MED610 reference material and the FullCure 705 (SUP705) support using the PolyJet Matrix (PJM) technology. In some cases, structures constructed using the PJM technology contain a support material that is hard to remove, unlike structures fabricated using, for example, the material extrusion process.36–38 As a result, the authors verified how a support material left in a cell might impact the mechanical and rheological properties in quality control aspects. These studies show a great application-wise potential since their results fits the concepts of lean manufacturing and industrial transformation 4.0.
In addition, these are preliminary studies leading to extended research involving models of cellular structure, taking into account the compression and bending processes, in the perspective of their application in the medical industry.
Materials and Methods
MED610 reference material
According to its manufacturer, MED610 (Stratasys, Corp., Minneapolis, MN) is a medical material that can remain in contact with the mucosa for up to 24 h and permanent with the skin. MED610 is intended for medical and dentistry applications.39,40 The resin has been developed in accordance with approved standards, taking into account type-IV hypersensitivity and irritation (EN ISO 10993-10:2013), 41 cytotoxicity (EN ISO 10993-5:2009), 42 genotoxicity (EN ISO 10993-3:2014), 43 and chemical characteristics (EN ISO 10993-18:2009). 44 Table 1 contains the chemical composition of the material. 45 Table 2 shows material properties declared by its manufacturer, pursuant to standards. 45
Chemical Composition of the MED610 Material
Source: EN ISO 10993-3:2014. 43
Properties of the MED610 Material
The Poisson's ratio value was obtained through an e-mail at the request of the authors from Stratasys.
Source: EN ISO 10993-3:2014. 43
SUP705 support material
Gel support material SUP705 (Stratasys, Corp.) for use with photocurable resins 46 is easily removed manually or with a water jet. The chemical composition is given in Table 3.
Chemical Composition of the SUP705 Support Material
Source: EN ISO 10993-18:2009. 44
PJM technology
The technology of photocuring liquid polymer resins (PJM) is a method where liquid resin is injected onto the printer's working platform, at the model's cross section, followed by a stage of ultraviolet irradiation, which initiates the polymerization process,21,47 and the transition of the polymer from the liquid state to the solid state, thus creating a 3D model. The PJM technology enables mixing two materials during a single printing process, making it possible to create a new material with different properties. The minimum layer thickness in this technology is 0.016 mm, compared with ∼0.1 mm in the case of FDM/FFF.48,49 A gel-like support material can be easily removed using a jet water stream, however, this requires designing a so-called open structure. 3D PolyJet printing is commonly used to fabricate mechanical subassemblies, gaskets, and casting patterns. 48 Owing to the biocompatible materials, it can also be used to manufacture models for medical applications.
All sample models were manufactured using the Objet 350 Connex (Stratasys Company) after the machine was properly calibrated to provide high-quality products.
Sample preparation
All test samples were prepared in accordance with outside dimensions specified in the ISO 527 standard. Figure 1 shows samples for testing relaxation and creep. L2 is the total sample length of 75 mm. L1 is the length of the section limited by lines and is 30 mm. R is a radius of 40.45 mm. B2 designates the width at the ends, which is 10 mm, while B1 designates the width of the narrow part, which is 5 mm. The recommended thickness is marked with the h symbol and is 4 mm.

Sample dimensions from ISO 527. L2 is the total sample length of 75 mm. L1 is the length of the section limited by lines and is 30 mm. R is a radius of 40.45 mm. L2 is the distance between the wide parallel parts, which is 106 mm. B2 designates the width at the ends, which is 10 mm. While B1 designates the width of the narrow part, which is 5 mm. The recommended thickness is marked with the h symbol and is 4 mm.
The cellular structure shape is shown in Figures 2 and 3, where it is based on a hexagonal structure. Hexagon side “a” is 2.42 mm, and the wall thickness of the structure s is 1 mm. The structure was filled with a soft, load-bearing Fullcure 705 material, and the sample frame with the MED610 material.
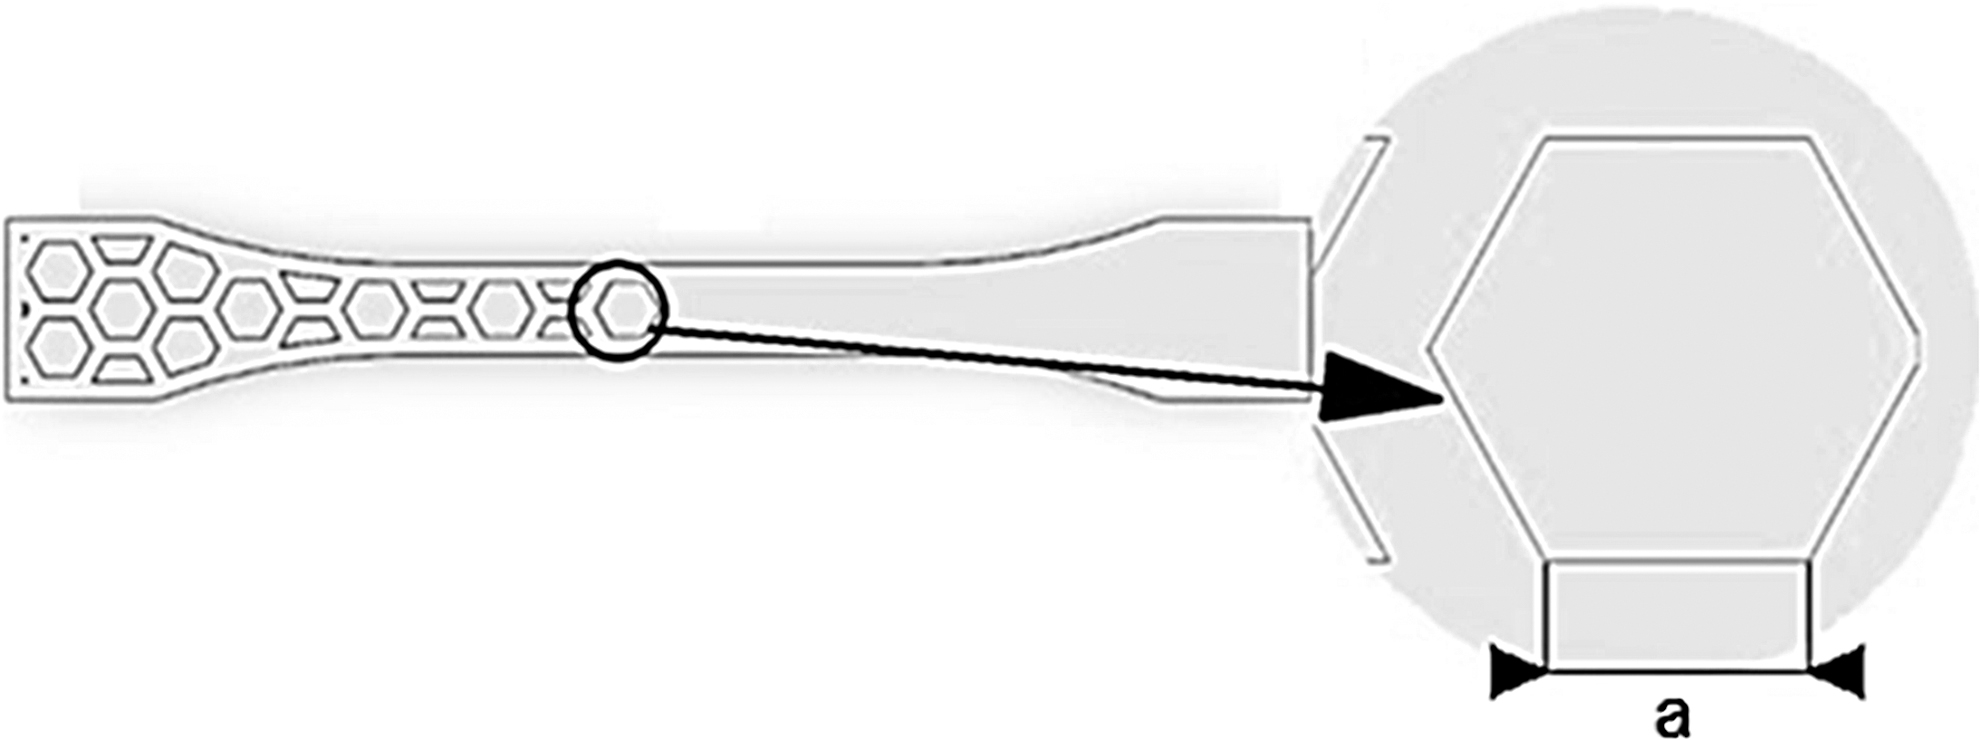
Sample with a hexagonal cellular structure-HF. A hexagon side is 2.42 mm, and the wall thickness of the structure s is 1 mm.
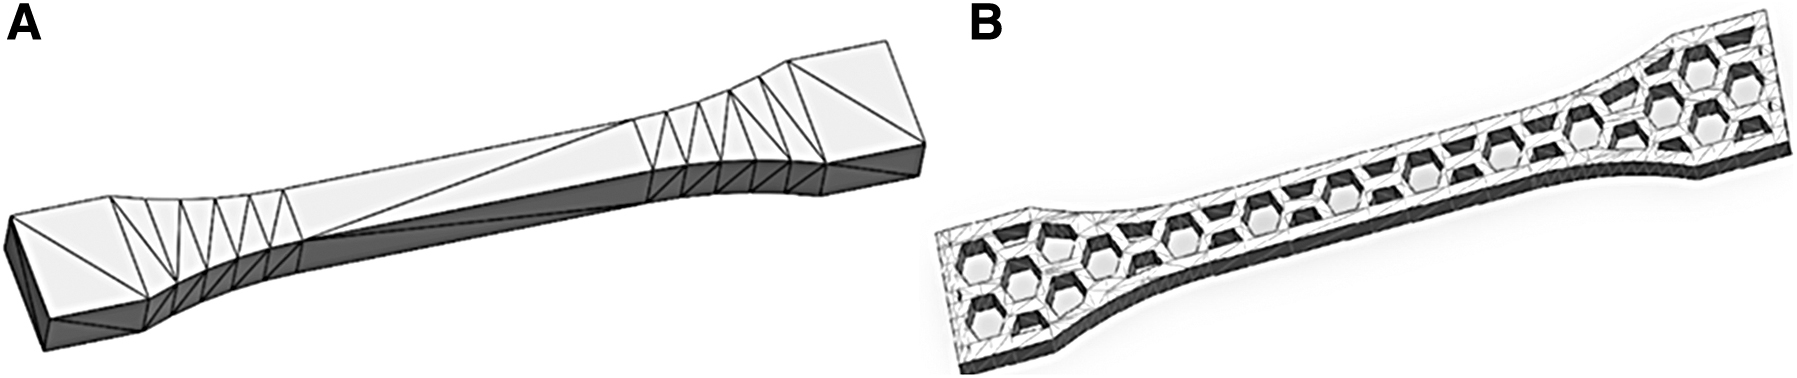
Samples in STL:
Example of a sample view after printing is shown in Figure 4.

Samples after printing:
Samples were placed on a working platform, following the printing orientation: 0°, 45°, and 90°.
All samples were printed with a layer thickness of 0.016 mm and in the glossy mode. Sample view on the platform is shown in Figure 5.
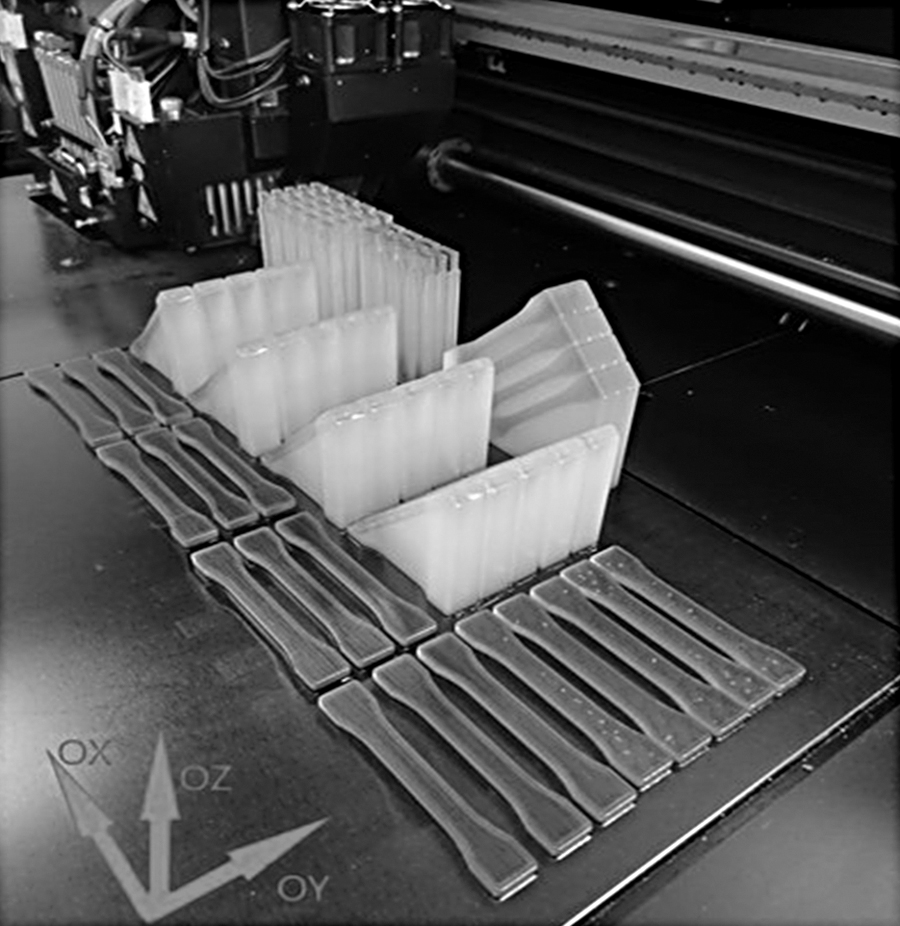
View of the samples on a 3D printer working platform. Samples were placed on a working platform, following the printing orientation: 0°, 45°, and 90°. All samples were printed with a layer thickness of 0.016 mm and in the glossy mode. 3D, three-dimensional.
The following designation system was adopted to identify the samples:
F—full sample,
HE—empty hexagonal structure sample,
HF—hexagonal structure sample filled with support material,
0, 45, and 90—printing orientation,
R—sample used in relaxation tests,
C—sample used in creep tests,
T—sample used in tensile tests,
1, 2, 3…—sample numbers in a given measurement series.
An example designation shall be read as follows:
F-45-C-4 is the fourth sample in the measurement series of the creep test, fabricated in the 45° orientation as a full sample,
HF-0-T-9 is the ninth sample in the measurement series of the tensile test, fabricated in the 0° orientation as a sample with a hexagonal structure, filled with support material.
Five-parameter M-W model
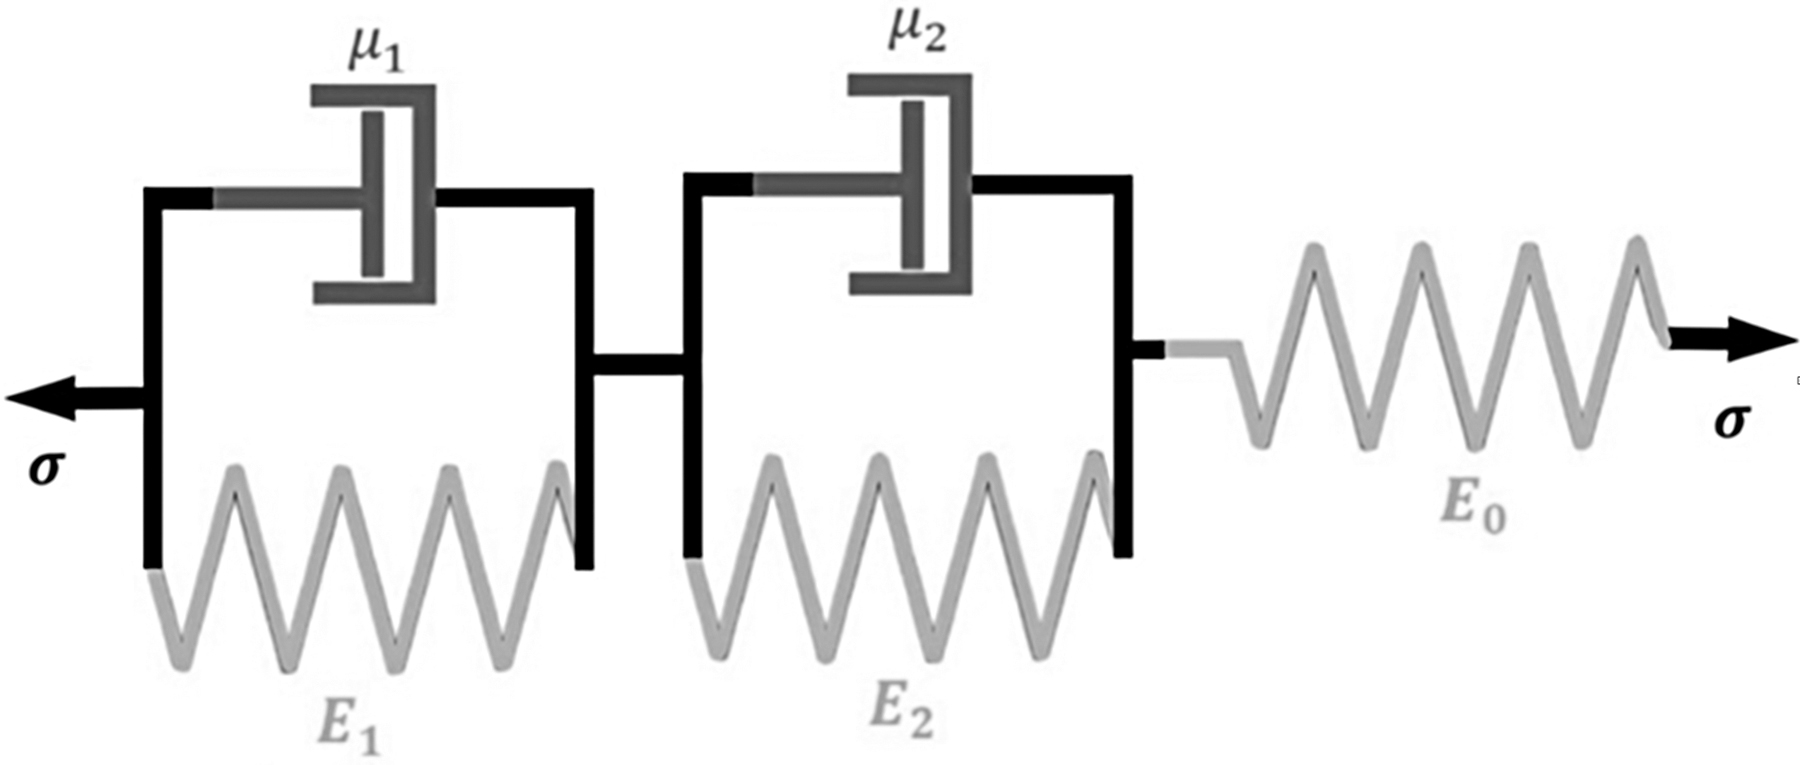
The five-parameter M-W model was used to describe the stress–relaxation curves in the simulation part (Fig. 6). The five-parameter M-W model is a combination of the Hooke and Newton models. More specifically, these are two basic Maxwell models combined in parallel with the Hooke model. 28

Five-parameter M-W model. The five parameter M-W model is a combination of the Hooke and Newton models. More specifically, these are two basic Maxwell models combined in parallel with the Hooke model. 24 M-W, Maxwell–Wiechert.
The equation that describes the five-parameter M-W model is as follows:
where:
where: μ—viscosity.
Equation (1) was transformed into Equation (3):
Equations (1) and (3) were used to determine the values of moduli of elasticity:
Rheological models were matched with relaxation curves using the Levenberg–Marquardt method in the OriginPro software. Besides the calculated coefficients of the five-parameter model, the authors also obtained the following: the determination coefficient R2 and conformance coefficient
The equivalent modulus was calculated from Equation (4) as follows:
where:
In addition, each of the partial stresses and relaxation times had a calculated mean value, standard deviation (SD), and A-type measurement uncertainty using Equation (5) as follows:

where: xi—value of the i-th measurement,
Five-parameter K-V model
The five-parameter K-V model is usually used to describe creep curves (Fig. 7). The five-parameter K-V model is a K-V and Hooke body combined in parallel. 28
Five-parameter K-V model. The five-parameter K-V model is usually used to describe creep curves. The five-parameter K-V model is a K-V and Hooke body combined in parallel. 24 K-V, Kelvin–Voigt.
The equation that describes the five-parameter K-V model is as follows:
where:
Equation (6) was transformed into Equation (8):
Equations (6) and (8) were used to determine the values of moduli of elasticity:
Rheological models were matched with the creep curves using the Levenberg–Marquardt method in the OriginPro software. In addition, besides the calculated five-parameter model coefficients, we also get the determination coefficient R2 and an information coefficient
The equivalent modulus was calculated from Equation (9) as follows:
where:
Each of the partial stresses and relaxation times had a calculated mean value, SD, and A-type measurement uncertainty using Equation (5).
Measurement technologies
Stress relaxation and creep tests involved stretching samples using the Inspekt Mini universal testing machine by Hegewald & Peschke MPT GmbH, equipped with Lab Master software. 50 The maximum device loading force is 3 kN. An example of a fastening and load for relaxation and creep tests involving full samples and samples with a cellular structure is shown in Figure 8.

Sample fastening during relaxation and creep tests. The maximum device loading force is 3 kN. An example of a fastening and load for relaxation and creep tests involving full samples and samples with a cellular structure.
Material creep and stress relaxation tests were conducted using the following parameters: machine crossbar displacement speed to reach the preset elongation value—10 mm/min, initial load—20 N, and relaxation time—600 s. A constant elongation value of 1 mm, maintained for 600 s, was adopted for relaxation tests, based on previously conducted preliminary tests. In turn, a constant force value of 200 N, corresponding to a stress of 10 MPa for full samples, was adopted for creep test based on previous preliminary tests. Strength testing test parameters are machine crossbar displacement speed—1 mm/min, and an initial load—25 N.
Results
Test results were divided into two groups. The first group applies to analyzing the relaxation and creep tests of full samples—F, MED610 material. The second group contains strength parameters of empty hexagonal structures—HE and hexagonal structures filled with support material—HF.
Rheological properties
Figures 9–11 show stress relaxation test results for individual printing orientations. Each of the colors represents an individual sample.
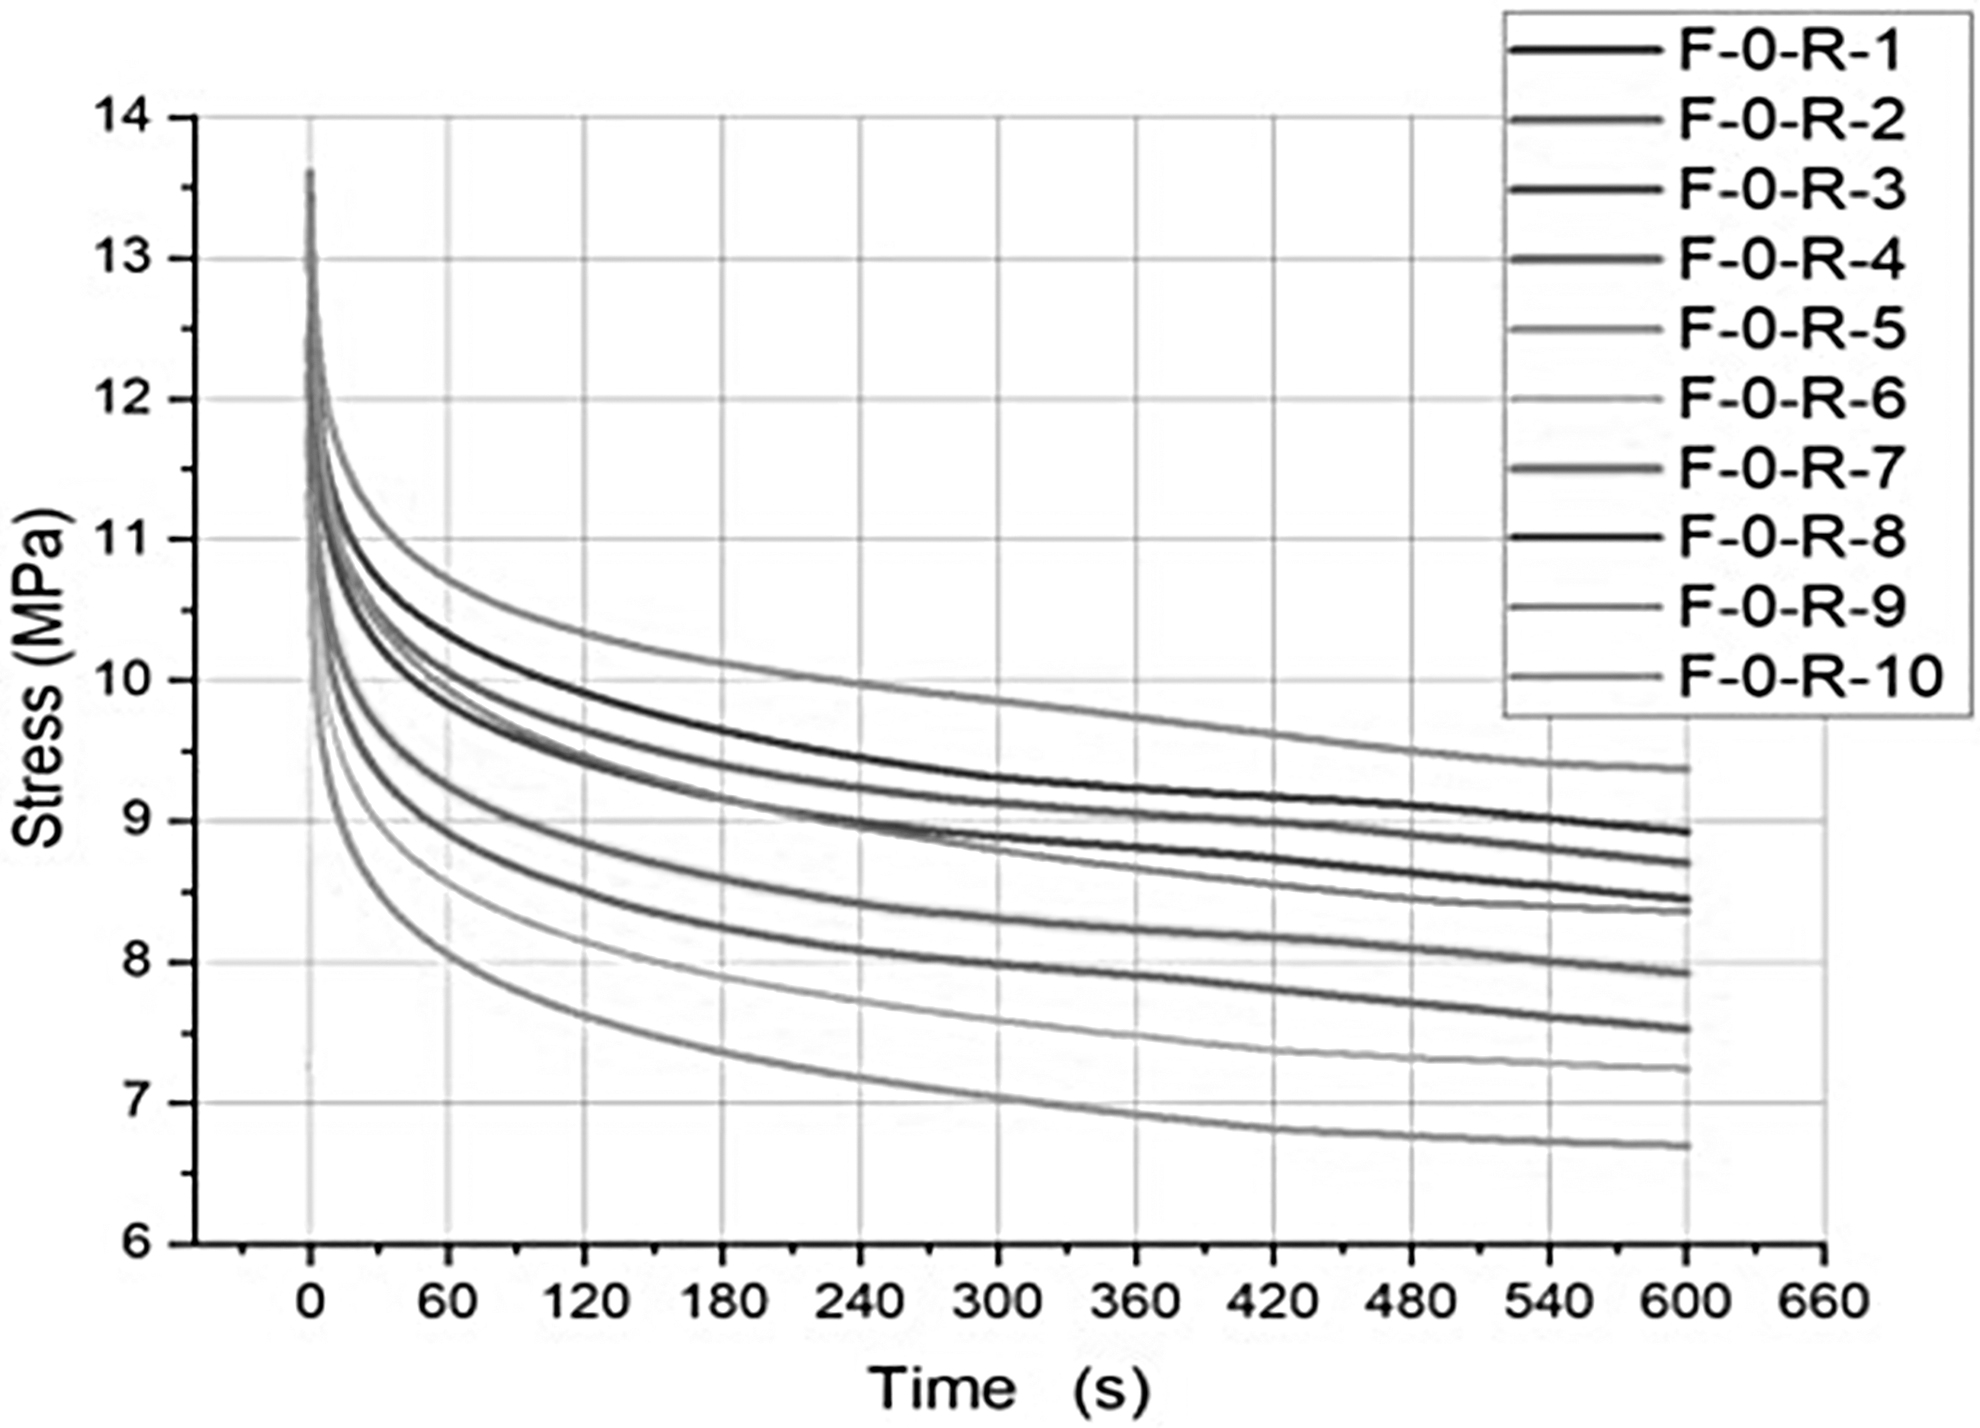
Stress relaxation tests for printing orientation 0°, full samples.
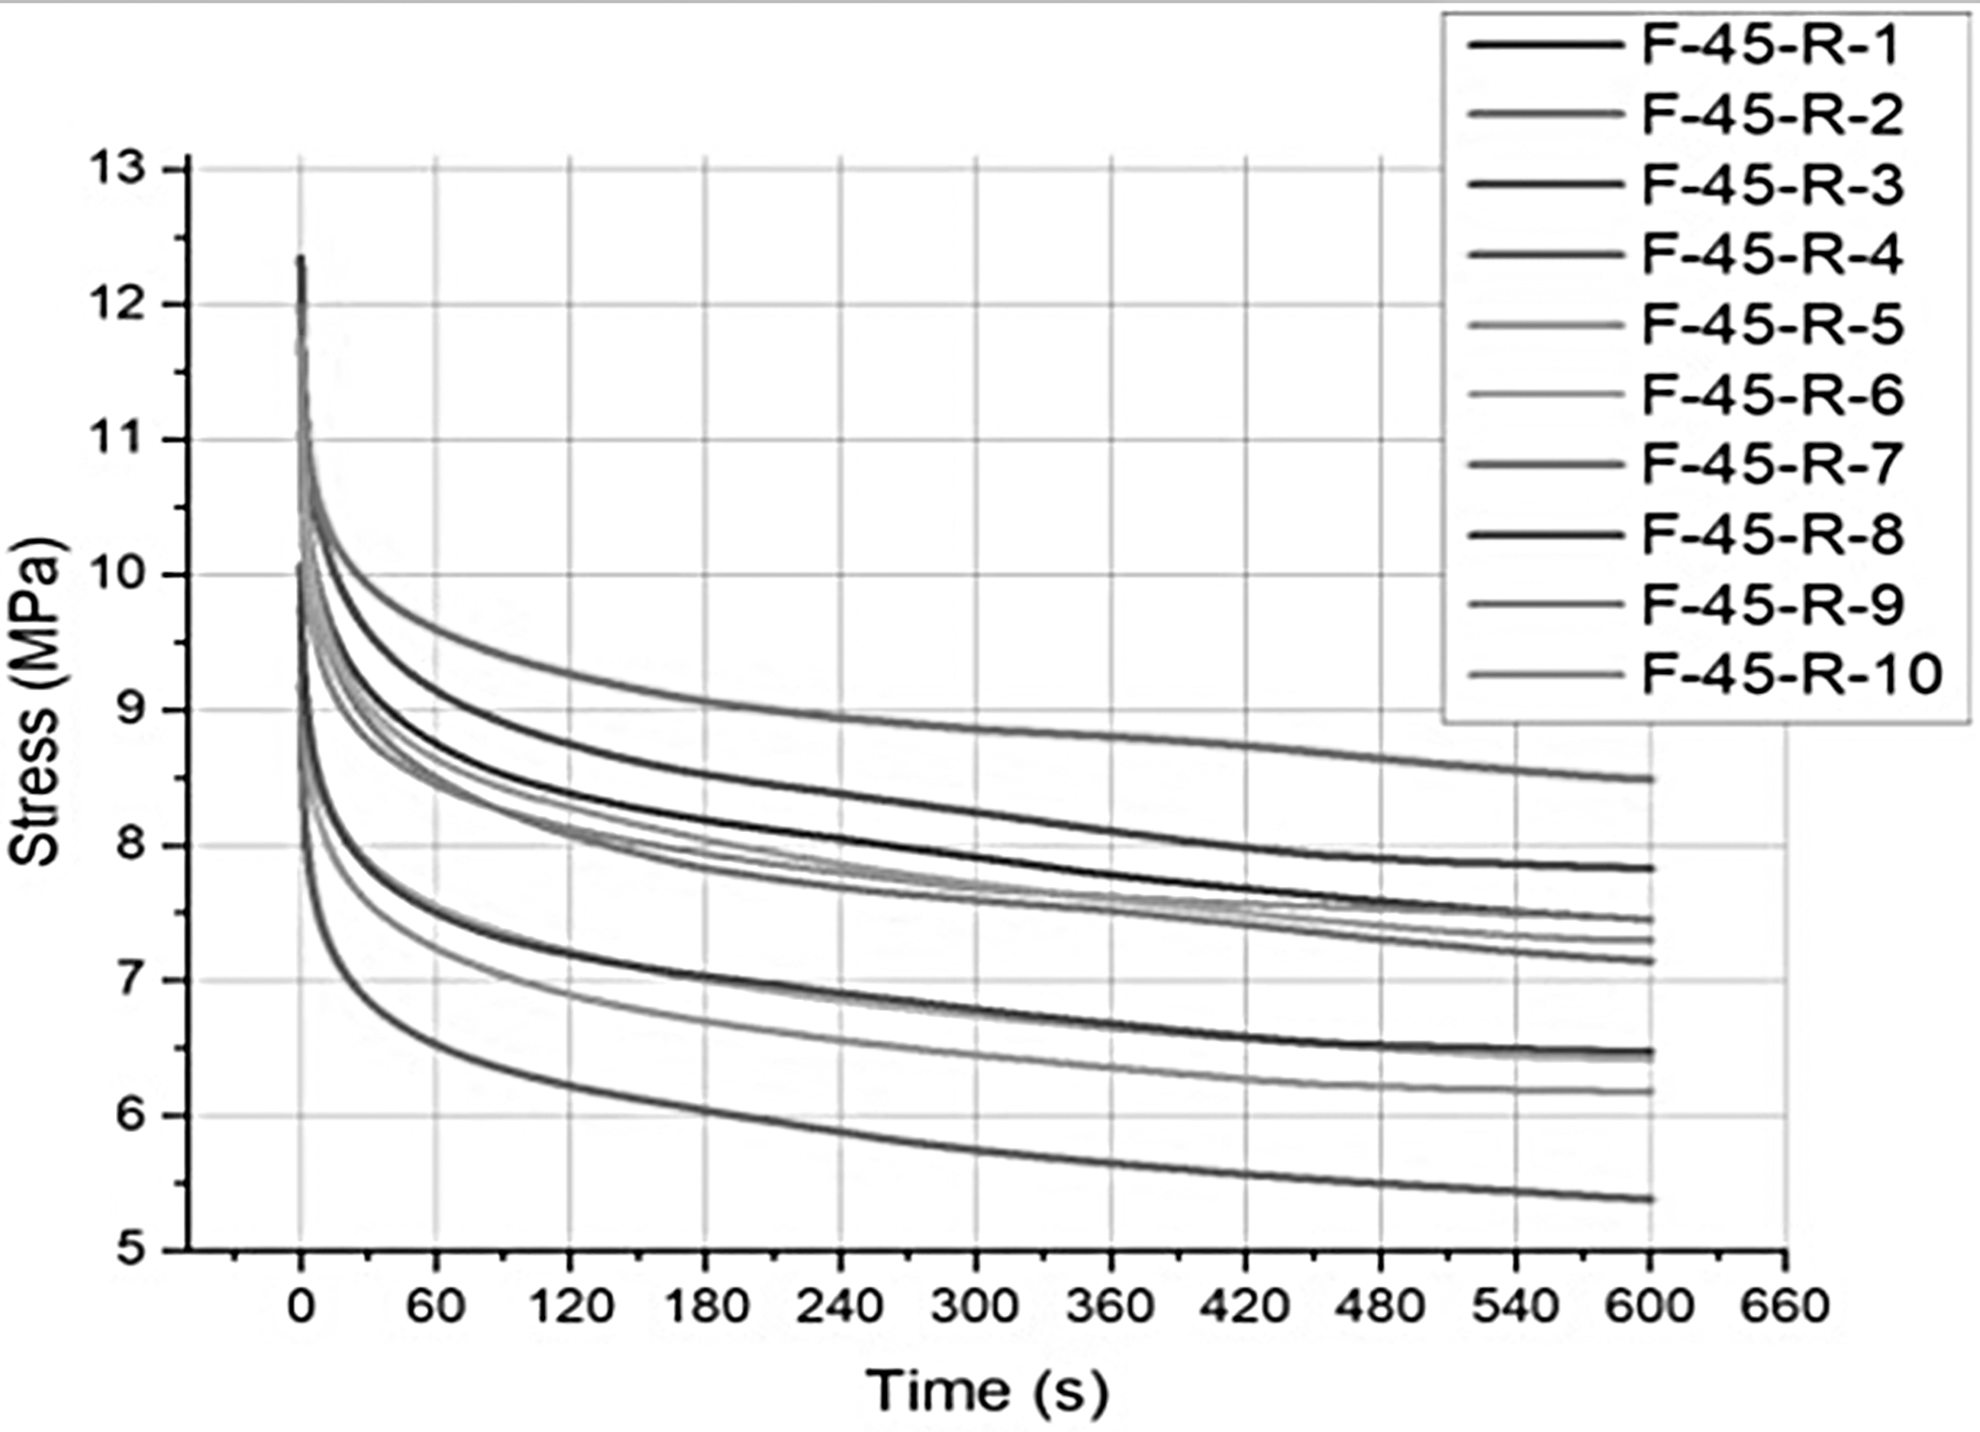
Stress relaxation tests for printing orientation 45°, full samples.
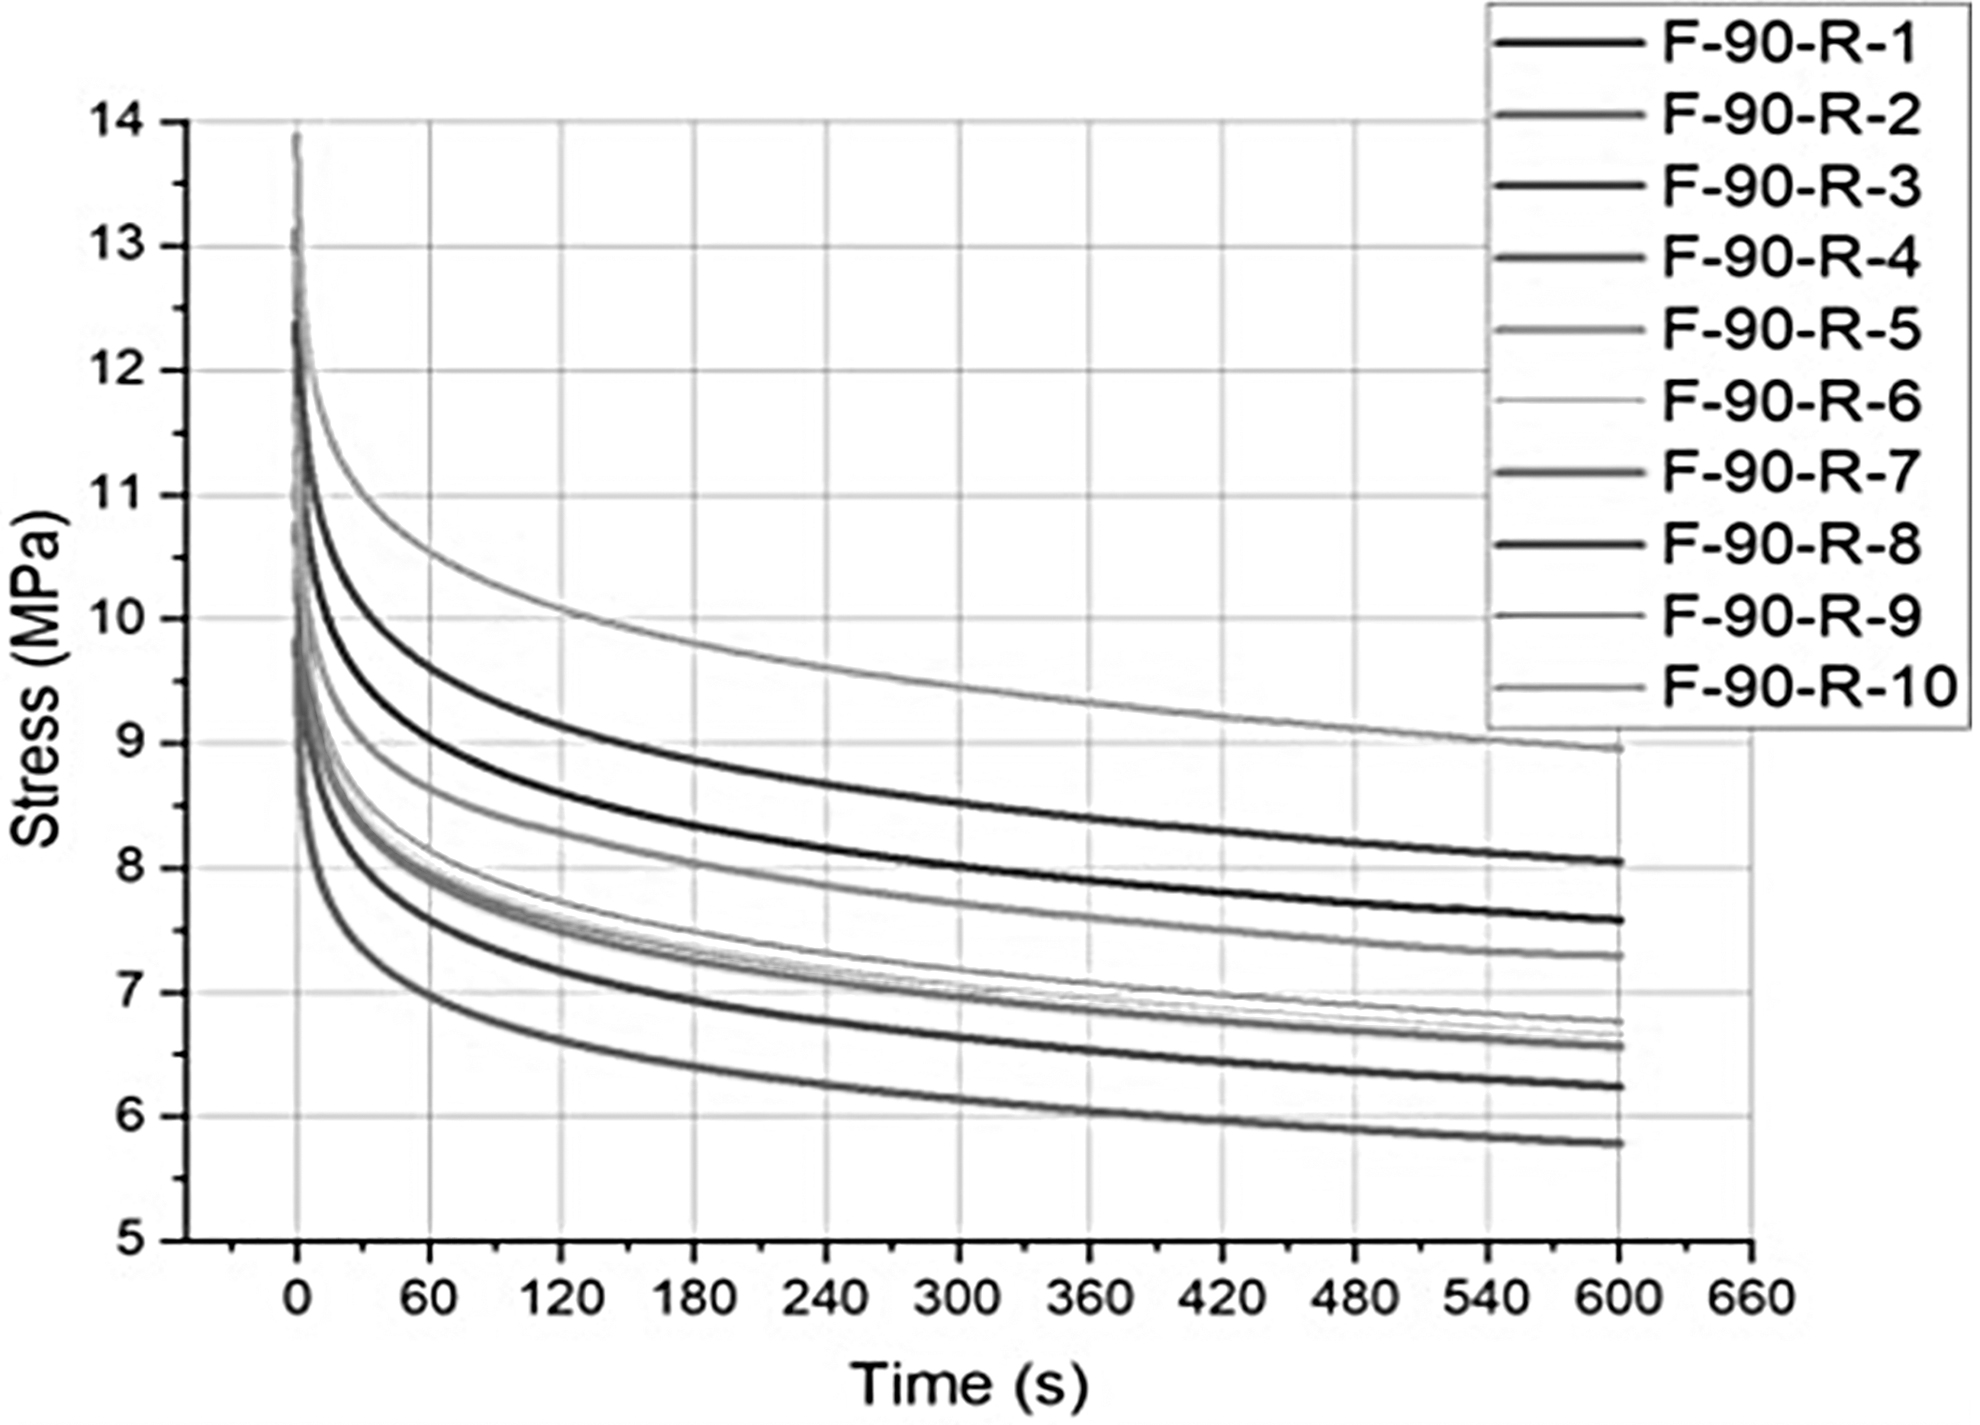
Stress relaxation tests for printing orientation 90°, full samples.
Figure 12 shows examples of matching the approximation curve of a five-parameter M-W model with relaxation test curves. Red marks the rheological model curve, while a black line is the experimental curve. The tables next to the graphs show the model name, equation representing the curve approximating the equation coefficient for the five-parameter M-W model and coefficients determining match quality (accuracy).
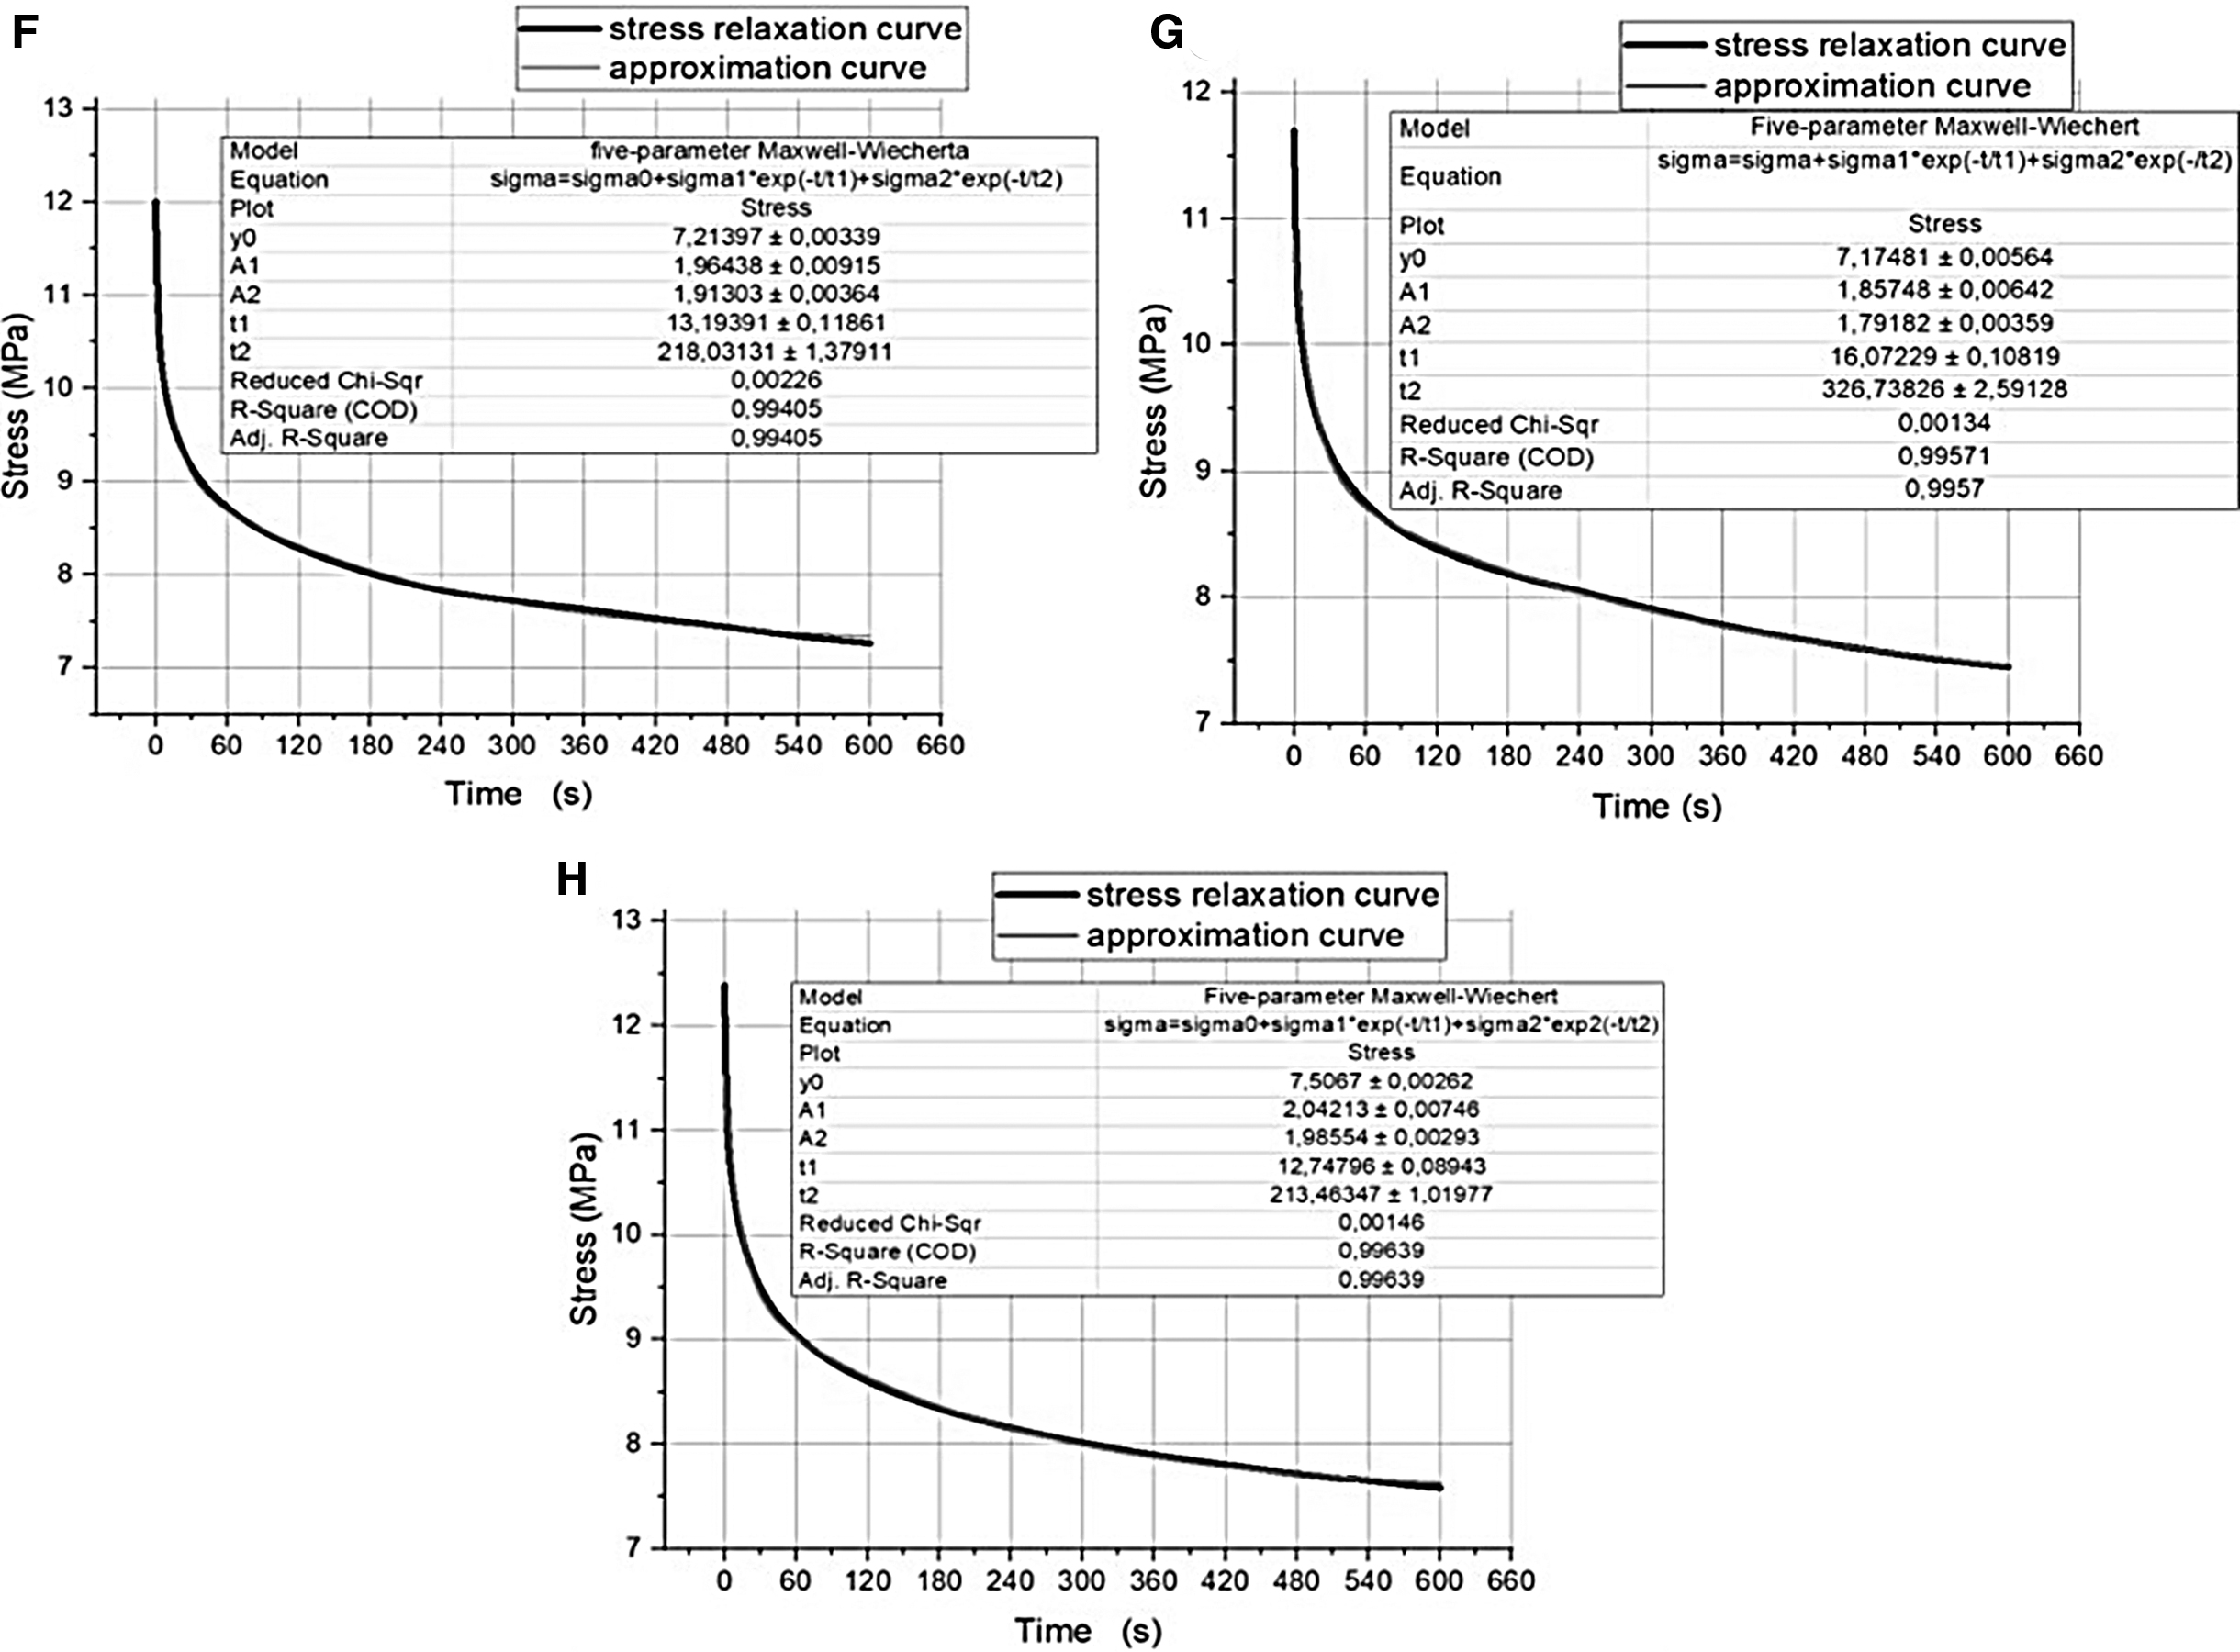
Matching for full samples:
Table 4 shows stress and relaxation time values resulting from matching the five-parameter M-W model to the stress–relaxation test curves. Based on Table 4, the moduli of elasticity, equivalent modulus, and dynamic viscosity coefficients were calculated for each printing orientation and shown in Table 5. In addition, Tables 4 and 6 also contain conformance coefficients
Results of Matching Relaxation Test Curves to the Approximation Curves
SD, standard deviation.
Calculated Moduli of Elasticity, Equivalent Modulus, and Dynamic Viscosity Coefficients
Results of Matching Approximation Curves to Creep Test Curves
As can be seen, Table 4 contains very low values of the
Based on Table 5 data, it can be seen that the highest equivalent modulus Ez: 589.888 MPa occurs for the printing orientation 0°. The lowest equivalent modulus Ez: 509.602 MPa occurs for the printing orientation 45°. The highest dynamic viscosity coefficient
Figures 13–15 show material creep test results for individual printing orientations. Each of the colors represents an individual sample.
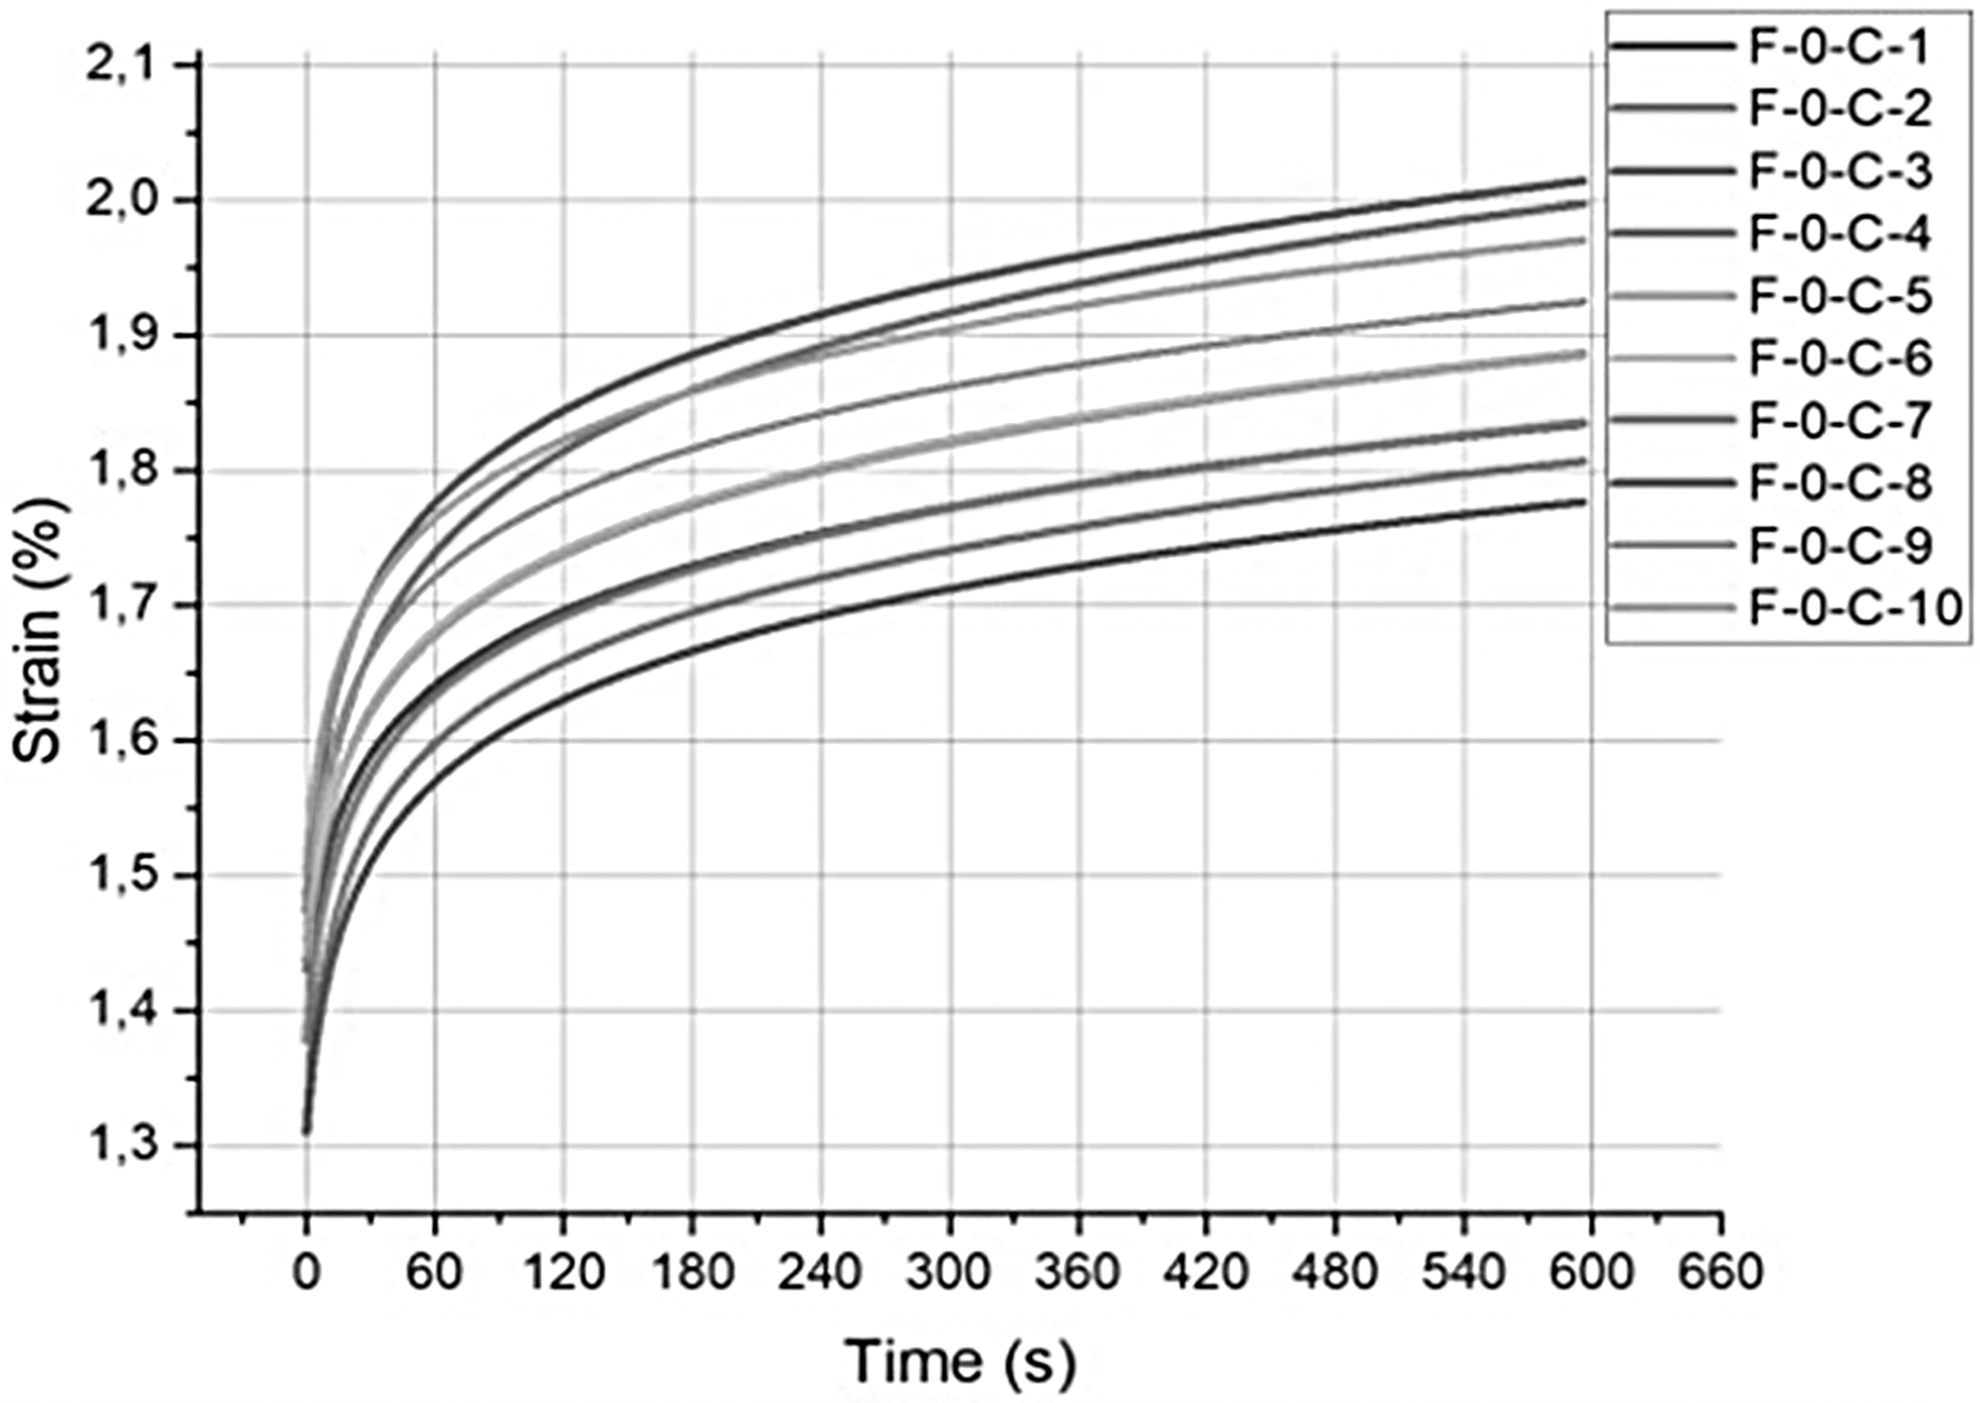
MED610 material stress relaxation tests for printing orientation 0°, full samples.
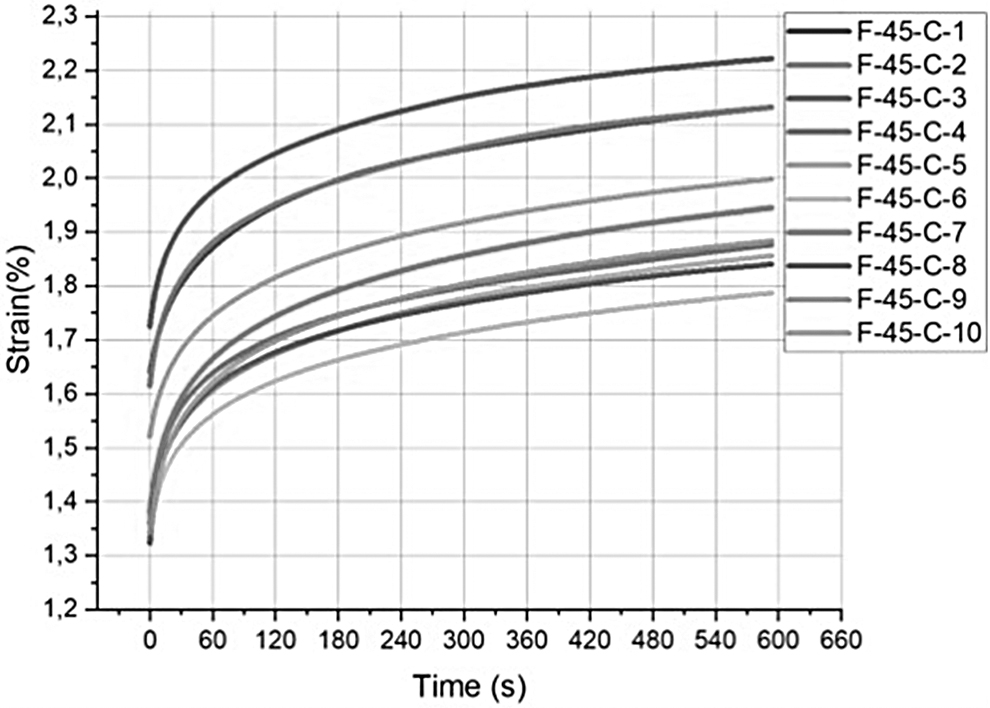
MED610 material stress relaxation tests for printing orientation 45°, full samples.
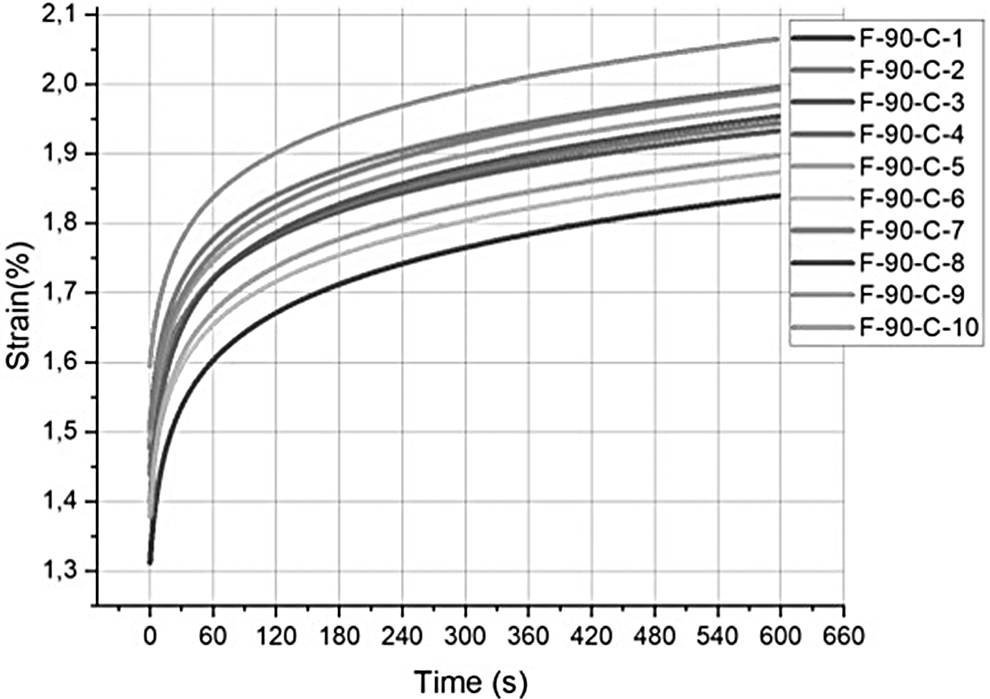
MED610 material stress relaxation tests for printing orientation 90°, full samples.
Figure 16 shows examples of matching the approximation curve of a five-parameter K-V model with material creep test curves. Red marks the rheological model curve, while a black line is the experimental curve.
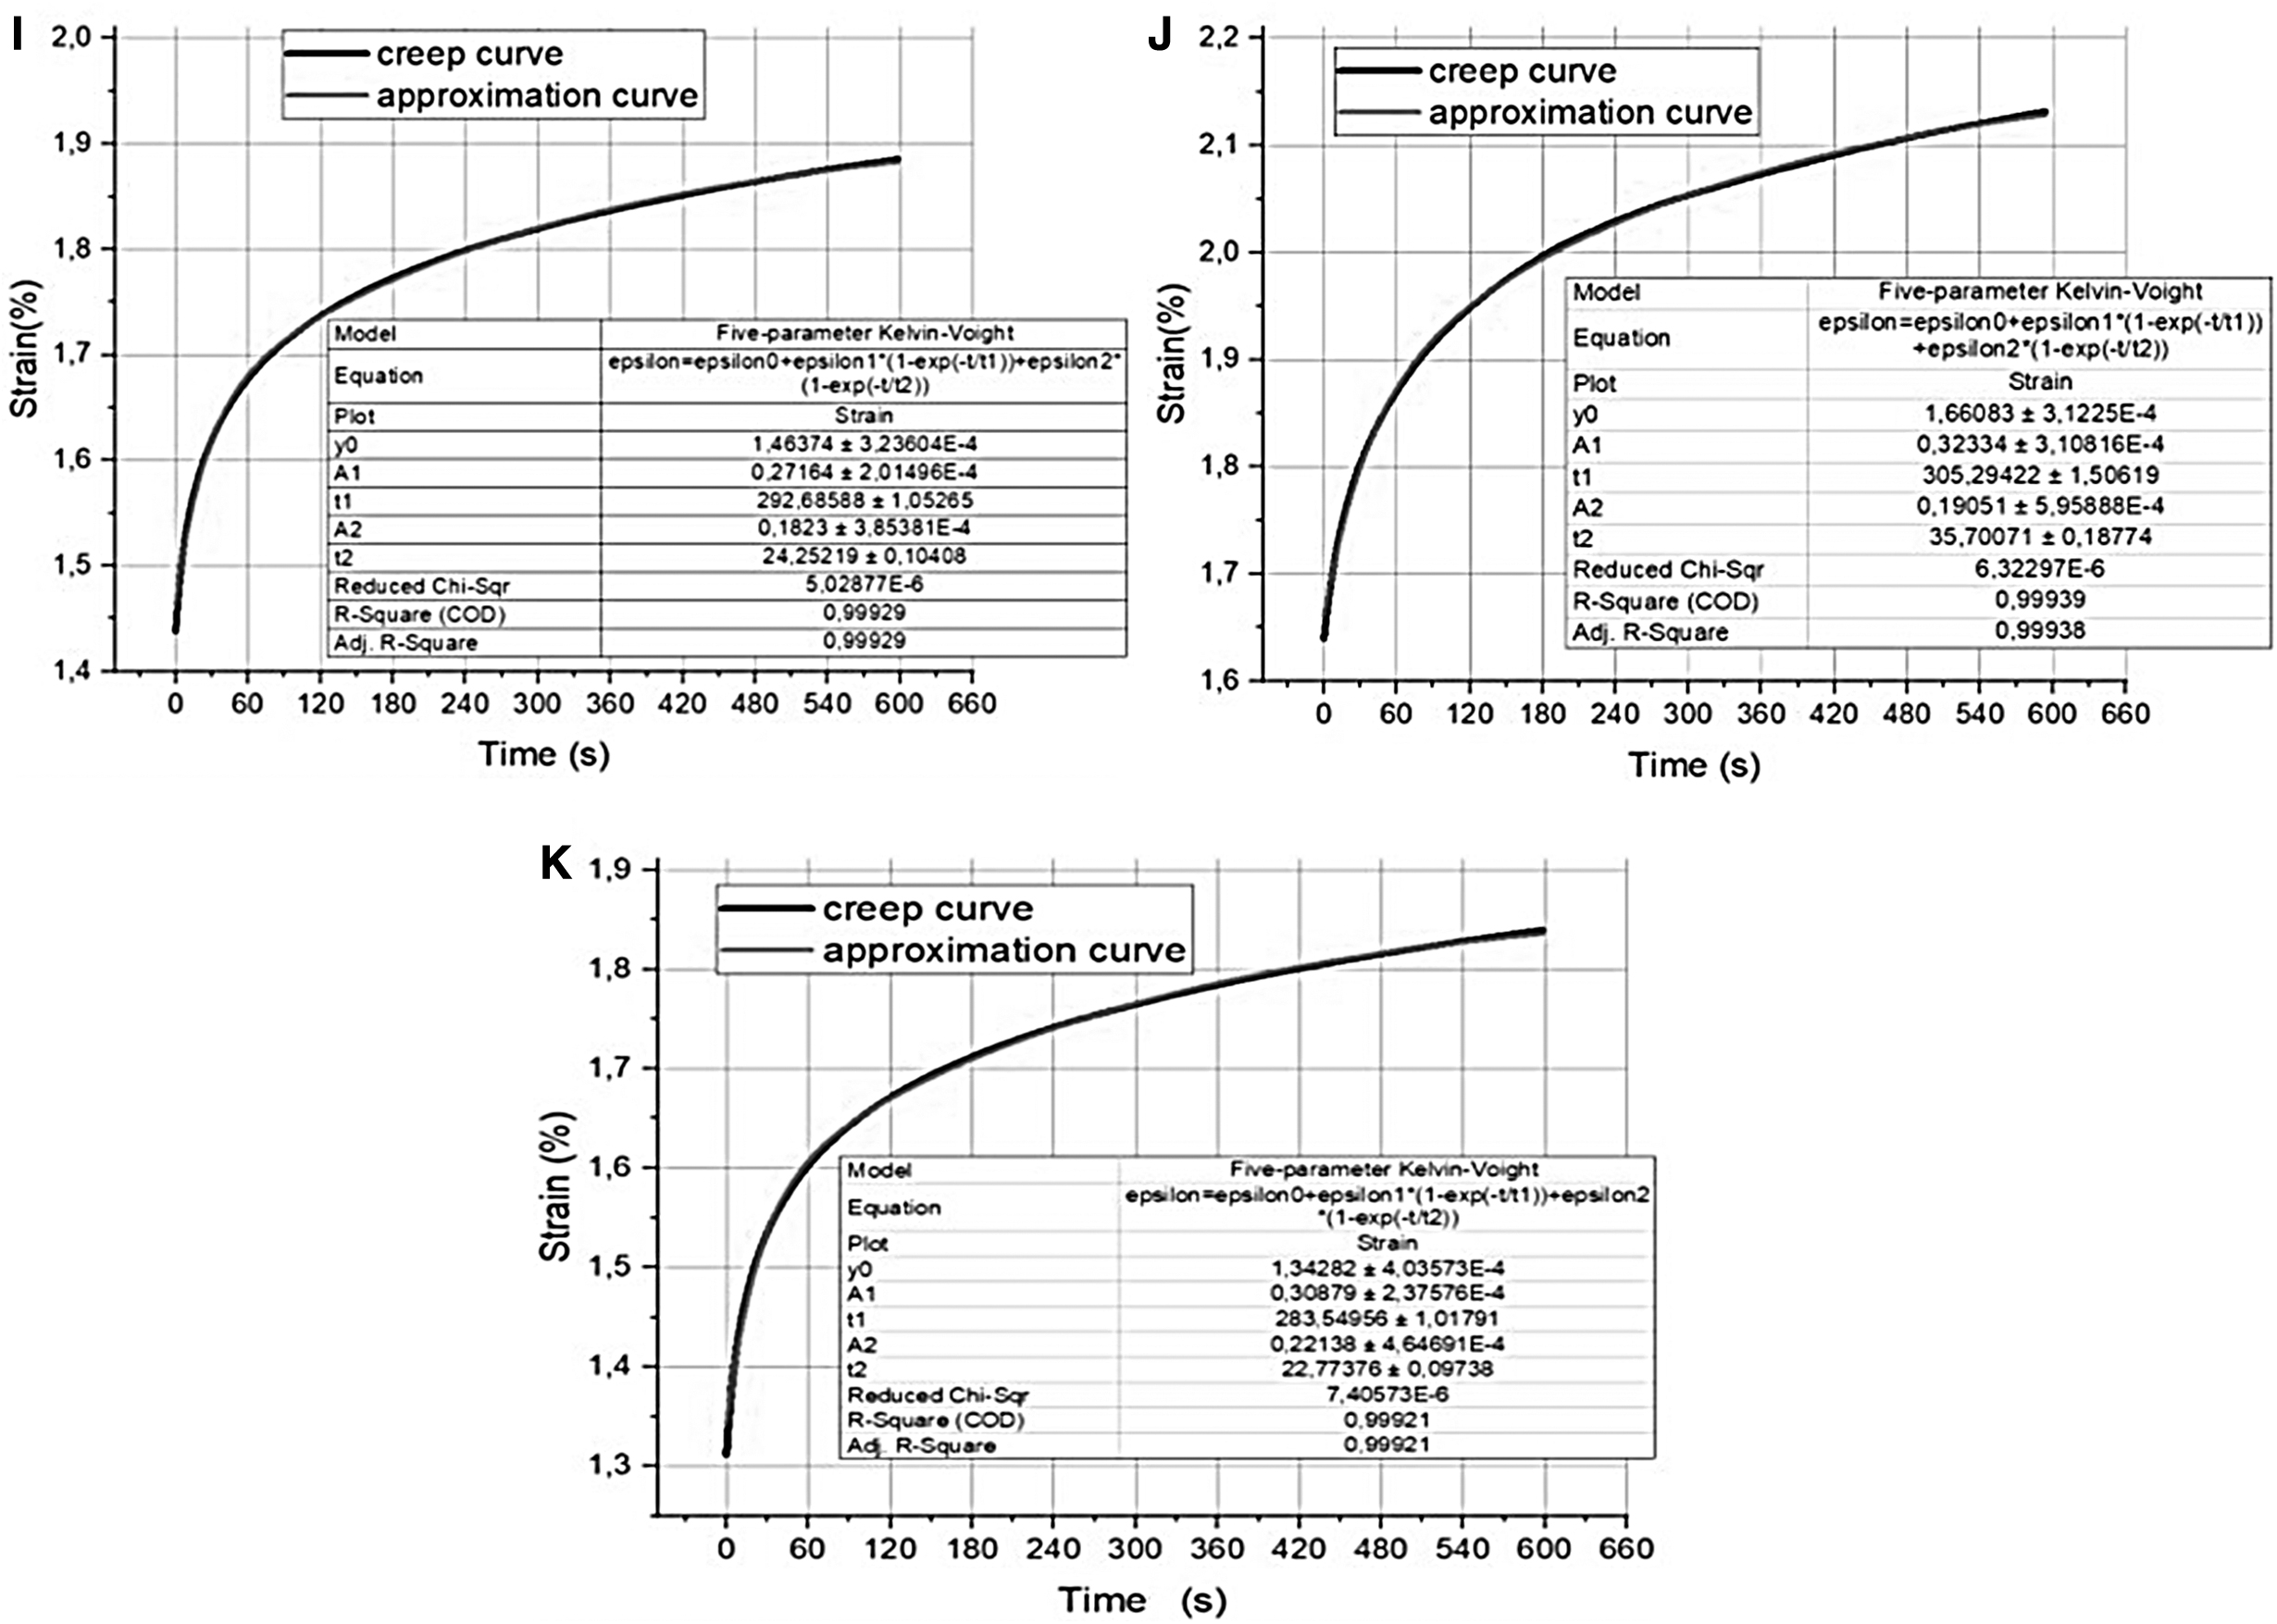
Matching for full samples:
The tables next to the graphs show the model name, equation representing the curve approximating the equation coefficient for the five-parameter K-V model, and coefficients determining match quality.
Table 6 shows strain and elastic after-effect values resulting from matching the five-parameter K-V model to material creep test curves.
As can be seen, Table 6 contains very low values of the
Based on Table 6, the moduli of elasticity, equivalent modulus, and dynamic viscosity coefficients were calculated for each printing orientation and shown in Table 7.
Calculated Moduli of Elasticity, Equivalent Modulus, and Dynamic Viscosity Coefficients
Based on Table 7, it can be seen that the highest equivalent modulus Ez = 5.197 MPa occurs for the printing orientation 0°. The lowest equivalent modulus Ez = 4.973 MPa occurs for the printing orientation 45°. The highest dynamic viscosity coefficient
Mechanical properties of structures
Figures 17 and 18 show tensile curves for hexagonal structure samples in a stress–strain coordinate system. Each of the colors represents an individual sample.

Samples of an empty hexagonal structure.

Sample tensile graphs—full hexagonal structure.
Table 8 shows tensile test results for hexagonal structure samples filled with support material and empty. The table contains a test number, cross section, maximum force, and tensile strength. Sample printing orientation is
Tensile Results for Samples with a Hexagonal Structure
Based on Figures 17 and 18, it can be seen that rupturing of full hexagonal samples caused the highest displacement in the range from 7.6 to 9.2 mm. On the contrary, these values ranged from 3.7 to 4.5 mm in the case of empty hexagonal samples. The highest force for empty hexagonal samples ranged from 350 to 440 N, while the highest force for full hexagonal samples was 640–670 N. In the case of full samples, the highest maximum force was recorded for sample No. 3 at 665.1 N. The lowest maximum force was recorded for sample No. 2 and amounted to 648 N. In the case of strain, the highest value of 9.2 mm was recorded for sample No. 4, and the lowest value of 7.6 mm for sample No. 2.
When it comes to empty samples, the highest maximum force of 430 N was recorded for sample No. 1, and the lowest force of 345.2 N for sample No. 10. The highest maximum strain value of 4.5 mm was recorded for sample No. 9, while the lowest maximum strain value of 3.7 mm was recorded for sample No. 4.
Discussion
Coefficients
As far as the stress relaxation phenomenon is concerned, the highest SDs among all other parameters of the model and for all printing orientations occurred for time t2 (Table 4). The highest SD for time t2 was 56.3 s for orientation 0° and was 355% higher than the lowest SD for time
As far as material creep is concerned, the highest SD values among other module parameters were recorded for retardation time t1 and for all printing orientations (Table 6). The highest SD for retardation time t1 was 29.2 s for the printing orientation of 45° and was 242% higher than the lowest value for time t1 and angle of 0°. The highest measurement uncertainty values calculated with the A-type method were recorded for time t1. The highest value was recorded for the printing orientation 45° t1 = 9.3 s and was 242% higher than the lowest deviation value for time t1 and printing orientation angle of 0°.
Other SDs and measurement uncertainty values for other parameters of the five-parameter rheological model were very low.
When analyzing the stress relaxation phenomenon, it can be concluded that the highest equivalent modulus value Ez = 589.888 MPa was achieved for the orientation angle of 0° and was only 15% higher than the lowest value for an angle of 45°. The highest dynamic viscosity coefficient
An analysis of the material creep phenomenon enables a conclusion that the highest equivalent modulus value Ez of 5.197 MPa was recorded for an angle of 0° and was only 4.52% higher than the lowest value for an angle of 45°. The highest dynamic viscosity coefficient
Based on Figures 17 and 18, it can be seen that full hexagonal samples were ruptured at a mean maximum force of 658.1 N, while empty hexagonal samples at a mean maximum force of 383.7 N. The highest force for empty hexagonal samples ranged from 350 to 440 N, while the highest force for full hexagonal samples was 640–680 N. Rupturing of empty samples occurred in the range 280–430 N, while samples filled with support material ruptured in the range 480–510 N. The highest maximum force value among full samples was recorded for HF-0-T-3 (0°, tensile test, third number in series) and amounted to 665.1 N, while the lowest maximum force was achieved by sample HF-0-T-2 (0°, tensile test, second number in series) and amounted to 647.985 N.
In terms of SD, the highest value was recorded for sample HF-0-T-3 i (full, 0°, tensile test, third number in series) and amounted to 9.4 mm, and the lowest value for HF-0-T-2 i (full, 0°, tensile test, second number in series) and amounted to 7.4 mm. In the case of empty samples, the highest maximum force value was recorded for the HE-0-T-1 sample (empty, 0°, tensile test, first number in the series) and amounted to 430 N, while the lowest value was recorded for the HE-0-T-10 sample (empty, 0°, tensile test, 10th number in the series) and amounted to 345.2 N. When it comes to strain, the highest value of 4.5 mm was achieved for the HE-0-T-9 sample, and the lowest value of 3.7 mm was recorded for the HE-0-T-4 sample (empty, 0°, tensile test, fourth number in the series).
Obtained tensile test results for samples with a hexagonal structure were compared with the results of studies described in Kozior et al. 19 It presents test results related to the mechanical properties of the MED610 material, including, for example, a static tensile test for full samples, in accordance with ISO 527. The comparison shows that the maximum force for full samples is 173% higher than in the case of an empty hexagonal sample and 59% higher than in the case of a full hexagonal sample.
Conclusions
The extensive results of rheological tests (stress relaxation and creep tests) and tensile tests of samples made with the MED610 material in the PJM technology presented herein enable formulating the following conclusions.
Experimental rheological curves were matched with theoretical curves resulting from the application of a five-parameter M-W model in the case of stress relaxation and a five-parameter K-V model for creep. Very good, reliable matches were obtained. Mean coefficients Chi 2 = 0.0014 and R2 = 0.9956 for matching the five-parameter M-W model. Mean coefficients Chi 2 = 0.000006 and R2 = 0.9992 for matching the five-parameter K-V model. This enables recommending the obtained results to be used in various engineering calculations, especially computer simulations of practical application.
Based on comparing the maximum tensile force for continuous (full) structure samples with hexagonal structure samples, it can be concluded that a cellular structure can be used in certain cases, leading to reduced element weight. This, in turn, may be of importance, for example, in prostheses for medical applications.
The support materials, thin-walled and hexagonal cellular structures, within stretched samples significantly impact the mechanical property tests described herein. The mean tensile force value is 71.51% higher for hexagonal structure samples filled with support material than for empty samples (not filled).
Elongation in samples with a hexagonal cellular structure is greater by 112.20% in the case of full samples, compared with empty samples. This will allow to continue the research on relaxation and creep of cellular structures.
Footnotes
Authors' Contributions
Conceptualization: J.B., T.K., W.S., and M.R. Methodology: J.B., T.K., W.S., M.R., D.G., P.Z., P.S., and M.M. Software: W.S. and M.R. Validation: J.B. Formal analysis: J.B., T.K., W.S., M.R., D.G., P.Z., P.S., and M.M. Investigation: J.B., W.S., M.R., and P.S. Resources: J.B. and T.K. Data curation: W.S. Writing—original draft preparation: J.B., T.K., W.S., M.R., D.G., P.Z., P.S., and M.M. Writing—review and editing: J.B., T.K. W.S., M.R., D.G., P.Z., P.S., and M.M. Visualization: J.B. and T.K. Supervision: J.B. All authors have read and agreed to the published version of the article.
Author Disclosure Statement
No competing financial interests exist.
Funding Information
The research was partially financed by the National Centre for Research and Developments part of the Lider XI project, number LIDER/44/0146/L-11/19/NCBR/2020, under the title, “An analysis of application possibilities of the additive technologies to rapid fabrication of casting patterns.” Moreover, this research was also partially funded by the National Science Center of Poland under the Miniatura 4, grant number 2020/04/X/ST5/00057 entitled: Analysis of polymer composites produced by 3D printing and electrospinning technologies in the applications of filtering devices.