




Abstract
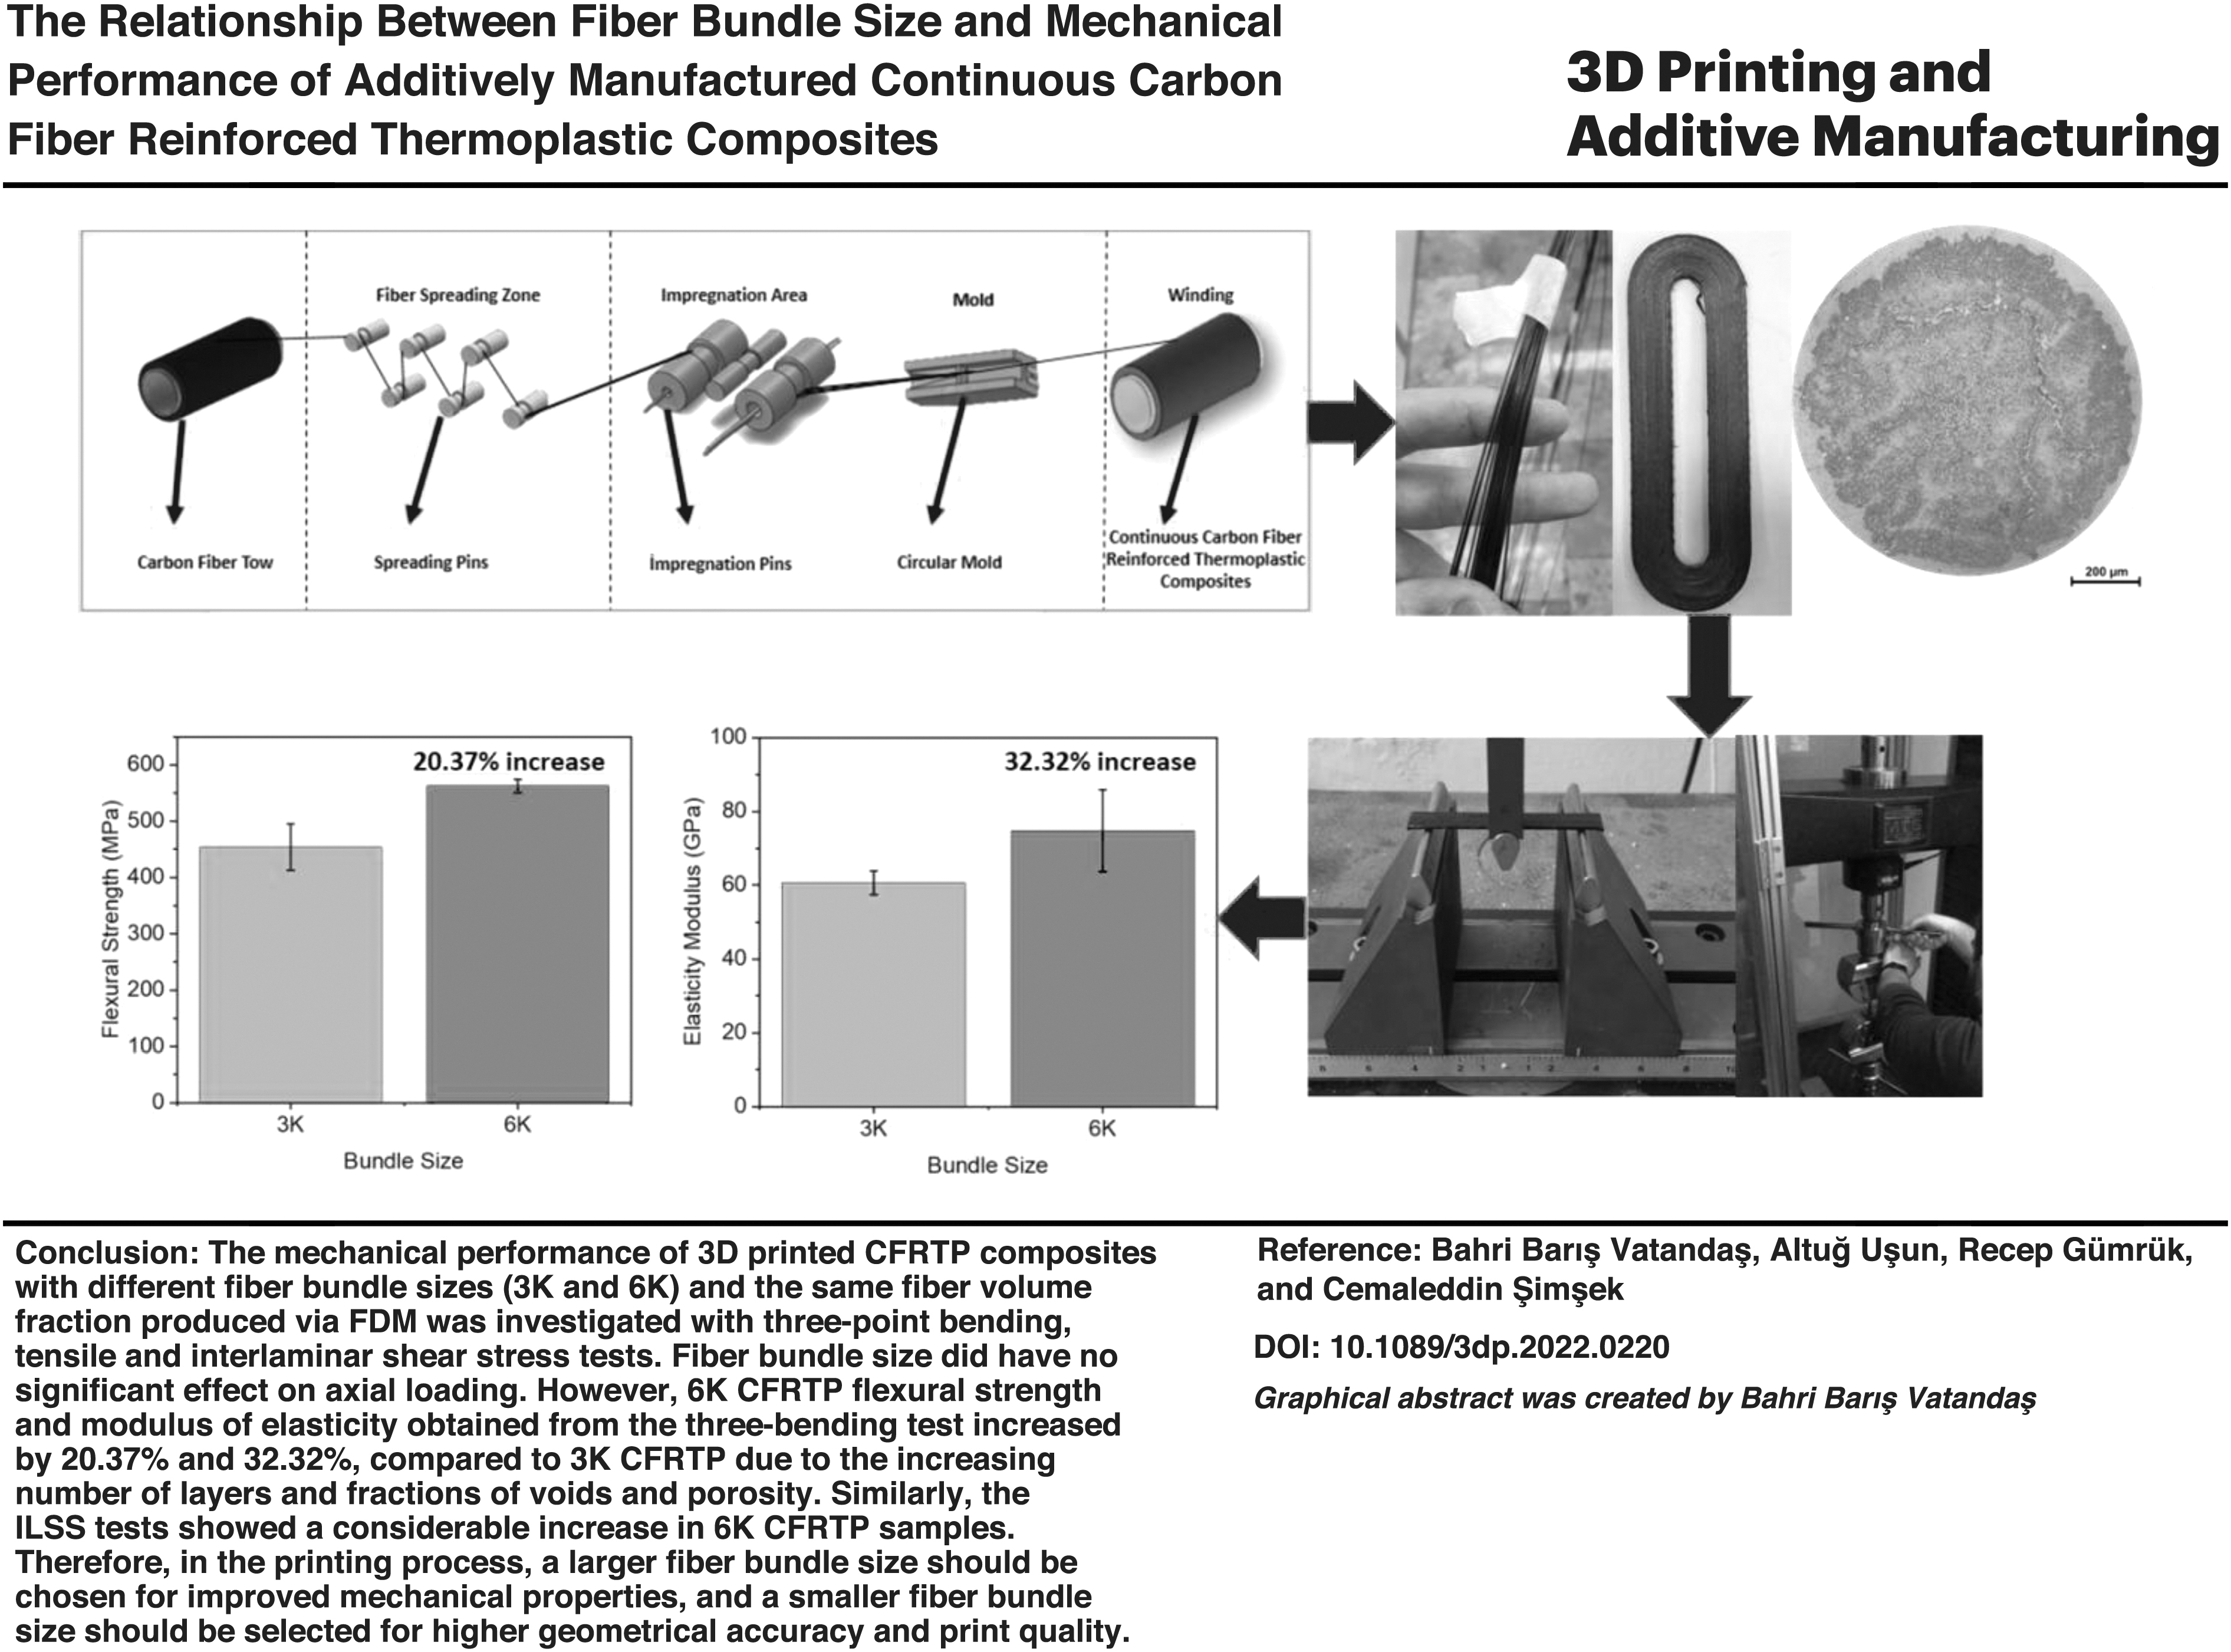
Additively manufactured continuous fiber-reinforced thermoplastic (CFRTP) composites are still in the early stages of reaching competitive mechanical properties compared with conventional composites. The main reason for this is that their mechanical properties are limited due to weak interlayer strength, porosity, and low fiber fraction. Therefore, the effects of many parameters, such as layer thickness, temperature, printing speed, and fiber fraction, have been extensively studied to improve mechanical properties. With a different perspective on these parameters, this study aimed to investigate the effect of fiber bundle size on the mechanical properties of CFRTP composites. For this purpose, 3K and 6K fiber bundle filaments with the same fiber volume fractions (∼41%) were produced utilizing a polymer impregnation setup. CFRTP samples were printed using fused deposition modeling with polylactic acid as the matrix. The mechanical properties were investigated via three-point bending, interlaminar shear strength (ILSS), and tensile tests. The results showed that fiber bundle size does not particularly influence tensile strength but dominates flexural and ILSS performance. Although increased flexural strength and modulus were observed, the bundle size effect was much more dominant in ILSS tests, and 6K bundle size samples with the same fiber fraction showed much higher strength.

Introduction
Recently, researchers have been interested in the production of continuous fiber-reinforced thermoplastic (CFRTP) composite parts using 3D printers due to their increased mechanical properties and lower costs with developing technology.1,2 Additionally, CFRTP parts are gaining more and more importance due to the usage of lightweight and high-strength parts in many industries, such as aviation, space, automotive, and medical. 3 Fused deposition modeling (FDM), one of the most common additive manufacturing methods in recent years, is preferred in producing CFRTP materials because of its convenience and applicability. Although many different methods4–7 are used in the literature for the production of CFRTP parts, the following two methods are generally adopted in FDM-based printing: in situ impregnation8–15 and the usage of pre-preg filament.16–20
With the in situ impregnation method, the printing process is performed by mixing the fiber and polymer matrix in a specially designed nozzle or extruder. The fiber additive fractions can be manipulated by changing the amount of polymer, and thus, functionally graded composites can be produced. However, problems such as nonhomogeneous fiber and polymer mixture and being unable to wet all the fibers with the matrix appear as the main disadvantages of this method, which negatively affect the mechanical properties of the CFRTP parts. 12 In the pre-preg filament usage, parts are produced by using a previously prepared filament by impregnating it with thermoplastic polymer according to the desired fiber fraction. With this method, a more homogeneous polymer–fiber mixture can be obtained. 21
An intensive effort is made in the literature to improve the mechanical performance of additive CFRTP composites.19,22–24 For example, many studies have been carried out on optimizing the printing parameters of CFRTP. 25 In these studies, the effects of many parameters such as nozzle temperature,8,26–29 printing speed,30,31 raster angle,30,32,33 layer thickness,28,31,33 and bed temperature34,35 have been investigated, and improvements have been made in the mechanical properties of CFRTP parts. As a result, CFRTP technology and printing parameters have reached very high mechanical properties' levels for the printed parts at the end of these efforts.
When the studies on additive manufacturing of CRFTP composites are examined, it can be observed that various fiber bundle sizes are used, including 1K,8,13,17,36 3K,12,18,37 and 6K. 38 However, it is noteworthy that no study has been conducted directly investigating the mechanical properties of fiber bundle size in CRPTP materials. Therefore, this study investigated the effect of different fiber bundle size with the same fiber volume fraction on the mechanical performance of CRFTP samples printed with FDM additive technique.
For this purpose, two different fiber-reinforced thermoplastic pre-preg filaments with different carbon fiber bundles (3K and 6K) were produced using a fiber–polymer impregnation platform developed in the laboratory. Polylactic acid (PLA) was used as the matrix, and the fiber volume fraction for both filaments was kept at ∼41%. The mechanical properties of the CFRTP samples were investigated using three-point bending, tensile, and interlaminar shear strength (ILSS) tests. In addition, the quality of the filaments was investigated with an optical microscope, and the microstructural behavior of CFRTP composites was investigated by scanning electron microscope (SEM).
Materials and Methods
Materials
In this study, 3K continuous carbon fiber supplied by the Dowaksa was used as reinforcement with an ultimate tensile strength of 4900 MPa, a modulus of elasticity of 245 GPa, and a density of 1.8 g/cm3. The diameter of each fiber is around 7 μm. In addition, as a polymer matrix, 1.75 mm diameter PLA filament obtained from the Porima was used, which has 54.3 MPa ultimate tensile strength and 2300 MPa modulus of elasticity.
CFRTP filament production process
In this study, a platform based on the melting impregnation pultrusion method was built to produce CFRTP filaments. The schematic of the production platform is shown in Figure 1. The production platform consists of three main zones: the fiber spreading zone, the impregnation zone, and the mold. The fibers extend into the fiber spreading zone from the carbon fiber tow, which was bedded on both sides. In the fiber spreading region, the fibers are spread laterally by using differently positioned rollers to ensure a homogeneous mixture of the fibers with the polymer. The positions of the rollers are designed so that they can move axially to change the tension force on the fiber. The resulting tension force causes the fibers to spread laterally. However, the intensity of the applied force should be controlled. If the applied force is too much, the fiber strands may become deformed.

Schematic image of the production platform.
In the impregnation zone, which is the second zone of the production platform, the fiber–polymer mixture is aimed. For this purpose, impregnation rollers were heated to 210°C using heater cartridges to achieve the polymer flow into the fibers. The PLA filament is pushed into the impregnation zone on the hot roller using an extruder. The polymer-mixing roller has a channel designed for the polymer and fiber to meet. Thanks to 10 radial holes with a diameter of 0.6 mm on the surface where the roller and fiber come in contact, the molten polymer flows and meets the fiber. To change the composite filament from a strip into a circular form, a heated nozzle with a 0.6 mm radius was used, which is the last part of the production platform. The fiber fractions of the produced filaments were theoretically calculated with the same principle as described in the previous study. 18 That is, it was volumetrically obtained by dividing the total area of the fibers by the area of the CFRTP filament. From this perspective, the fiber fractions were calculated as ∼41% for the 3K filament bundle.
Similarly, for 6K filament production, it was calculated that a 0.8 mm nozzle should be utilized to ensure that both 6K and 3K filaments have about 41% fiber volume fraction. Both filaments were continuously manufactured so that they had enough length to print multiple parts. Therefore, two 3K CFRTP filaments were conjoined by passing them simultaneously through a 0.8 mm nozzle. The test samples produced using 3K and 6K continuous fiber-reinforced composites will be referred to as 3K CFRTP and 6K CFRTP to avoid confusion.
Production of CFRTP samples
The 3D process of CFRTP filaments is known to be a challenging process because continuous path planning or cutting of the fibers is required. Therefore, in this study, a special g-code has been issued for additive manufacturing of CFRTP filaments to be used to manufacture mechanical test samples. Figure 2 shows the g-code movements. In addition, this code is configured as a ring so that no filament cutting is needed during printing. Standard nozzles used in 3D printers have been found to cause fiber separation and clogging during printing. Therefore, the nozzle in the print head of the printer has been modified for CFRTP printing. The hole diameter of the nozzle is 2 mm, and the edges are rounded to avoid sticking to the nozzle or damaging the filament. The modified nozzle and extruder are shown in Figure 3.
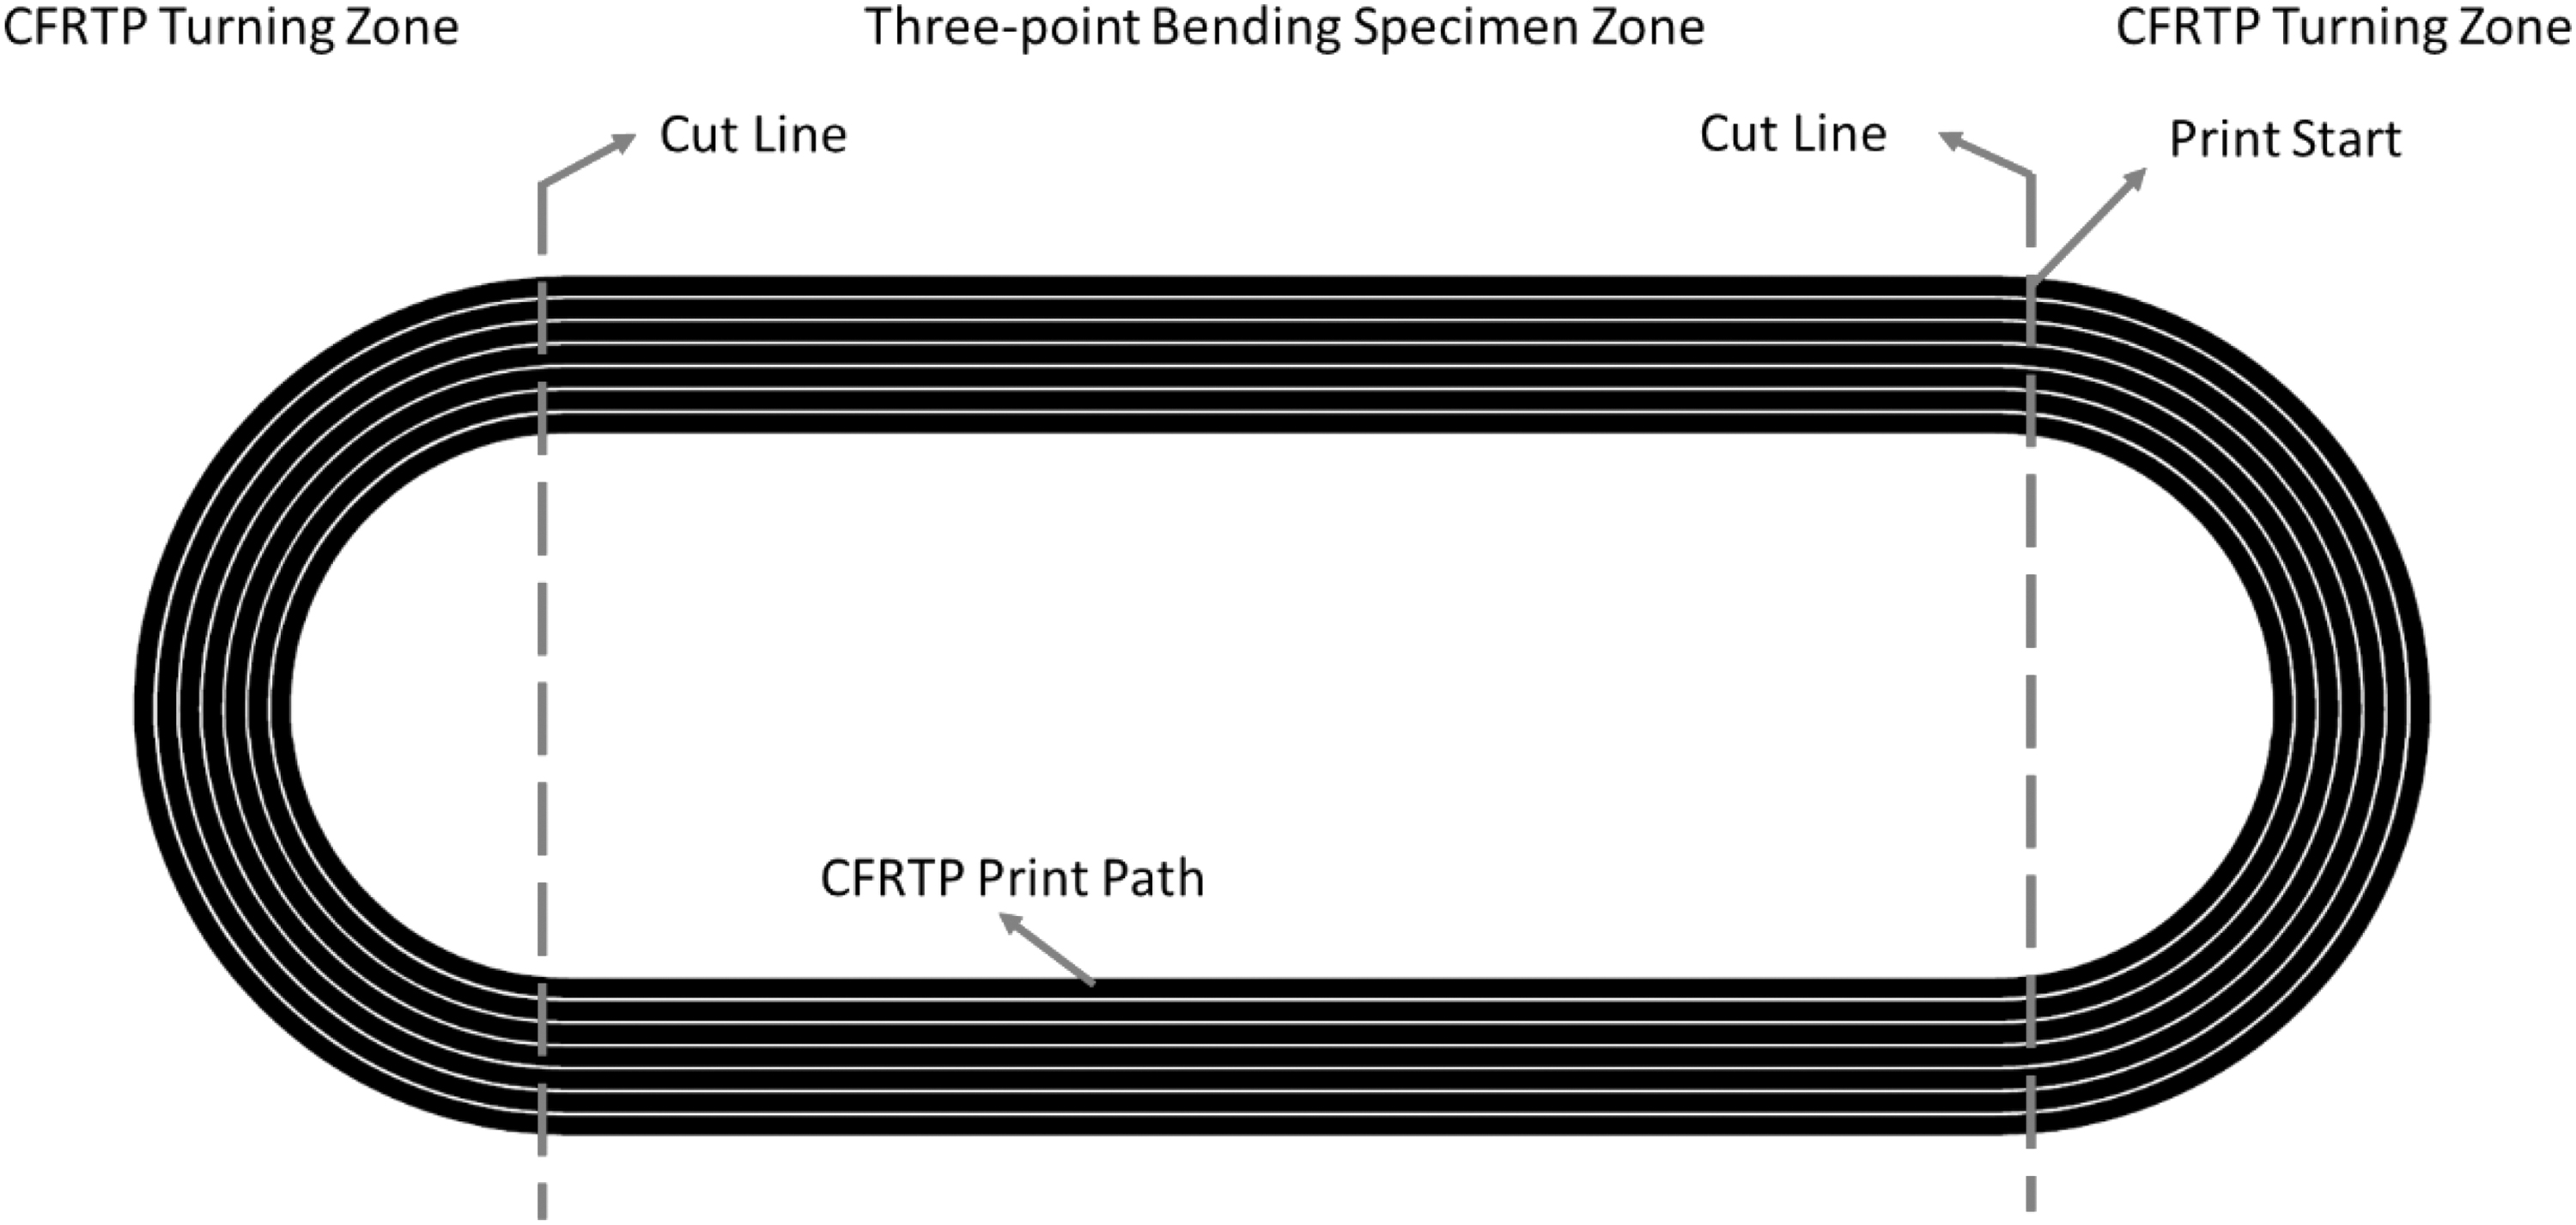
G-code movements created with the developed python code.

The photos of nozzle:
In the printing process a spool of CFRTP filament is placed in its chamber and then brought to the tip of the nozzle via guide channels. After the temperature settings in the printer are made, the printing process is started by sticking the filament to the printing table. In this study, the layer thickness was taken as 0.25 mm for 3K CFRTP. As a result, the fraction of filament diameter to layer thickness is 2.4. This fraction is in accordance with the value used in the literature.8,12 For 6K CFRTP, reconsidering the layer thickness fraction to the filament diameter, the layer thickness was taken as 0.30 mm for 0.8 filament diameter. 220°C nozzle temperature, 75°C bed temperature, and 2.5 mm/s printing speed were selected as the printing parameters of 3K and 6K CFRTP samples.
In addition, nine and six layers were used for the 3K and 6K CFRTP, respectively, for the flexural test samples, whereas six and five layers were used for the tensile test samples, respectively. All printing parameters are summarized in Table 1. Figure 4 shows the preparation steps of the samples. The curved ends of these samples were cut along the line shown in the figure to achieve rectangular-shaped test samples.
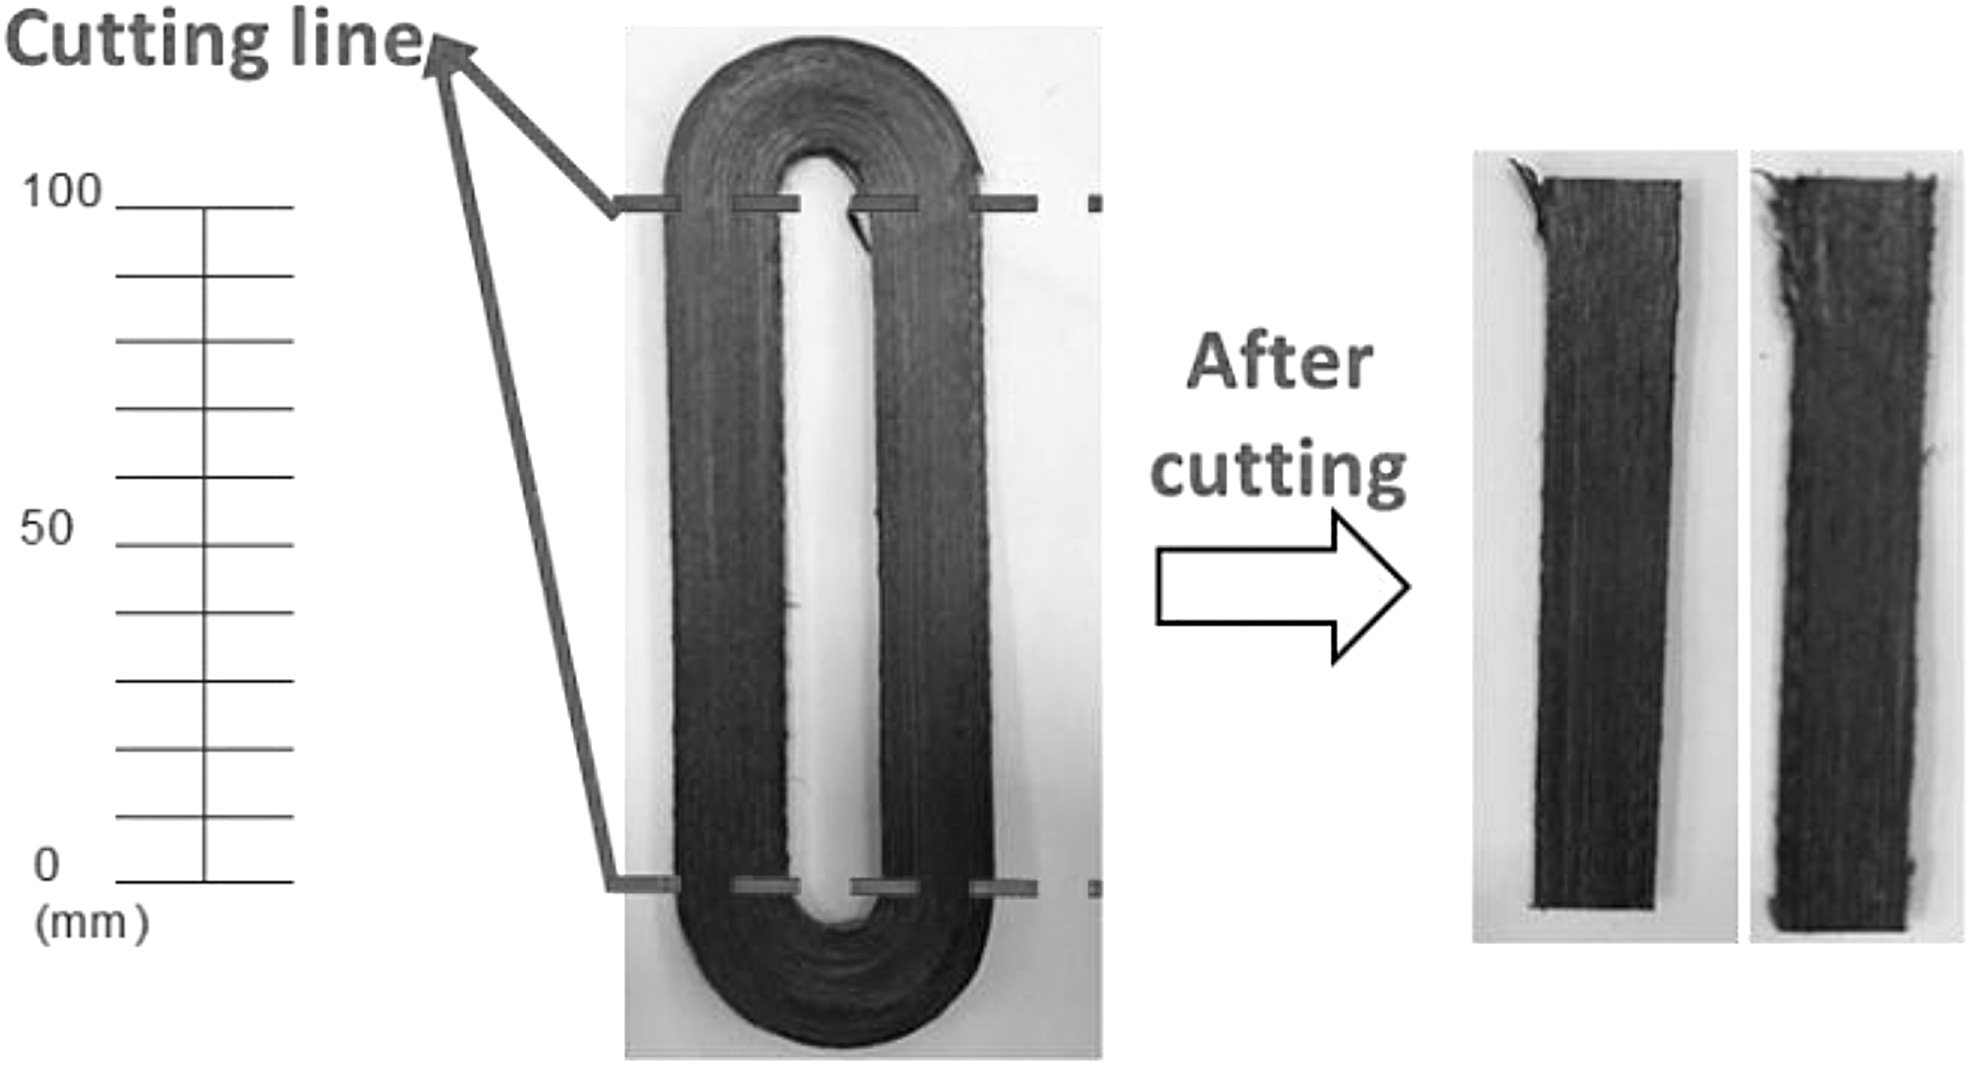
Preparation of CFRTP test samples. CFRTP, continuous fiber-reinforced thermoplastic.
Printing Parameters for Continuous Fiber-Reinforced Thermoplastic Test Samples
The minimum turning radii in 3K and 6K are different due to their amount of fiber. Since there are more fibers in 6K, the turning radius is larger than 3K. Therefore, turns are more difficult. Considering the minimum turning radius, the gaps between the 3K and 6K samples were taken quite wide to avoid printing failures and the g-code was prepared accordingly.
Mechanical tests
In this study, CFRTP samples were subjected to flexural, ILSS, and tensile tests using an Instron Universal device with Laser Extensometer. The dimensions of the flexural test samples were produced in accordance with the parameters of “ISO 14125” from ISO standards as 100 × 15 × 2 mm3. The crosshead speed was determined as 2 mm/min for flexural tests. The support was positioned at 80 mm.
Tensile test samples are manufactured to ASTM D3039. Nevertheless, due to the constraints of the geometric print environment, its dimensions were scaled by 0.5, which corresponds to 125 × 12.5 × 1.25 mm3. The crosshead speed in the device was determined as 5 mm/min. In addition, to prevent the tensile samples from being adversely affected by the notch effects, 15 × 30 × 1 mm3 sized aluminum plates adhered to the ends of the tensile samples.
ILSS test was performed for the interlayer shear strength of CFRTP samples. ILSS test samples were produced with dimensions of 20 × 10 × 2 mm3. All mechanical tests were performed at least four times for repeatability, and the standard deviations were given in the results. The application of flexural, tensile, and ILSS tests is shown in Figure 5.
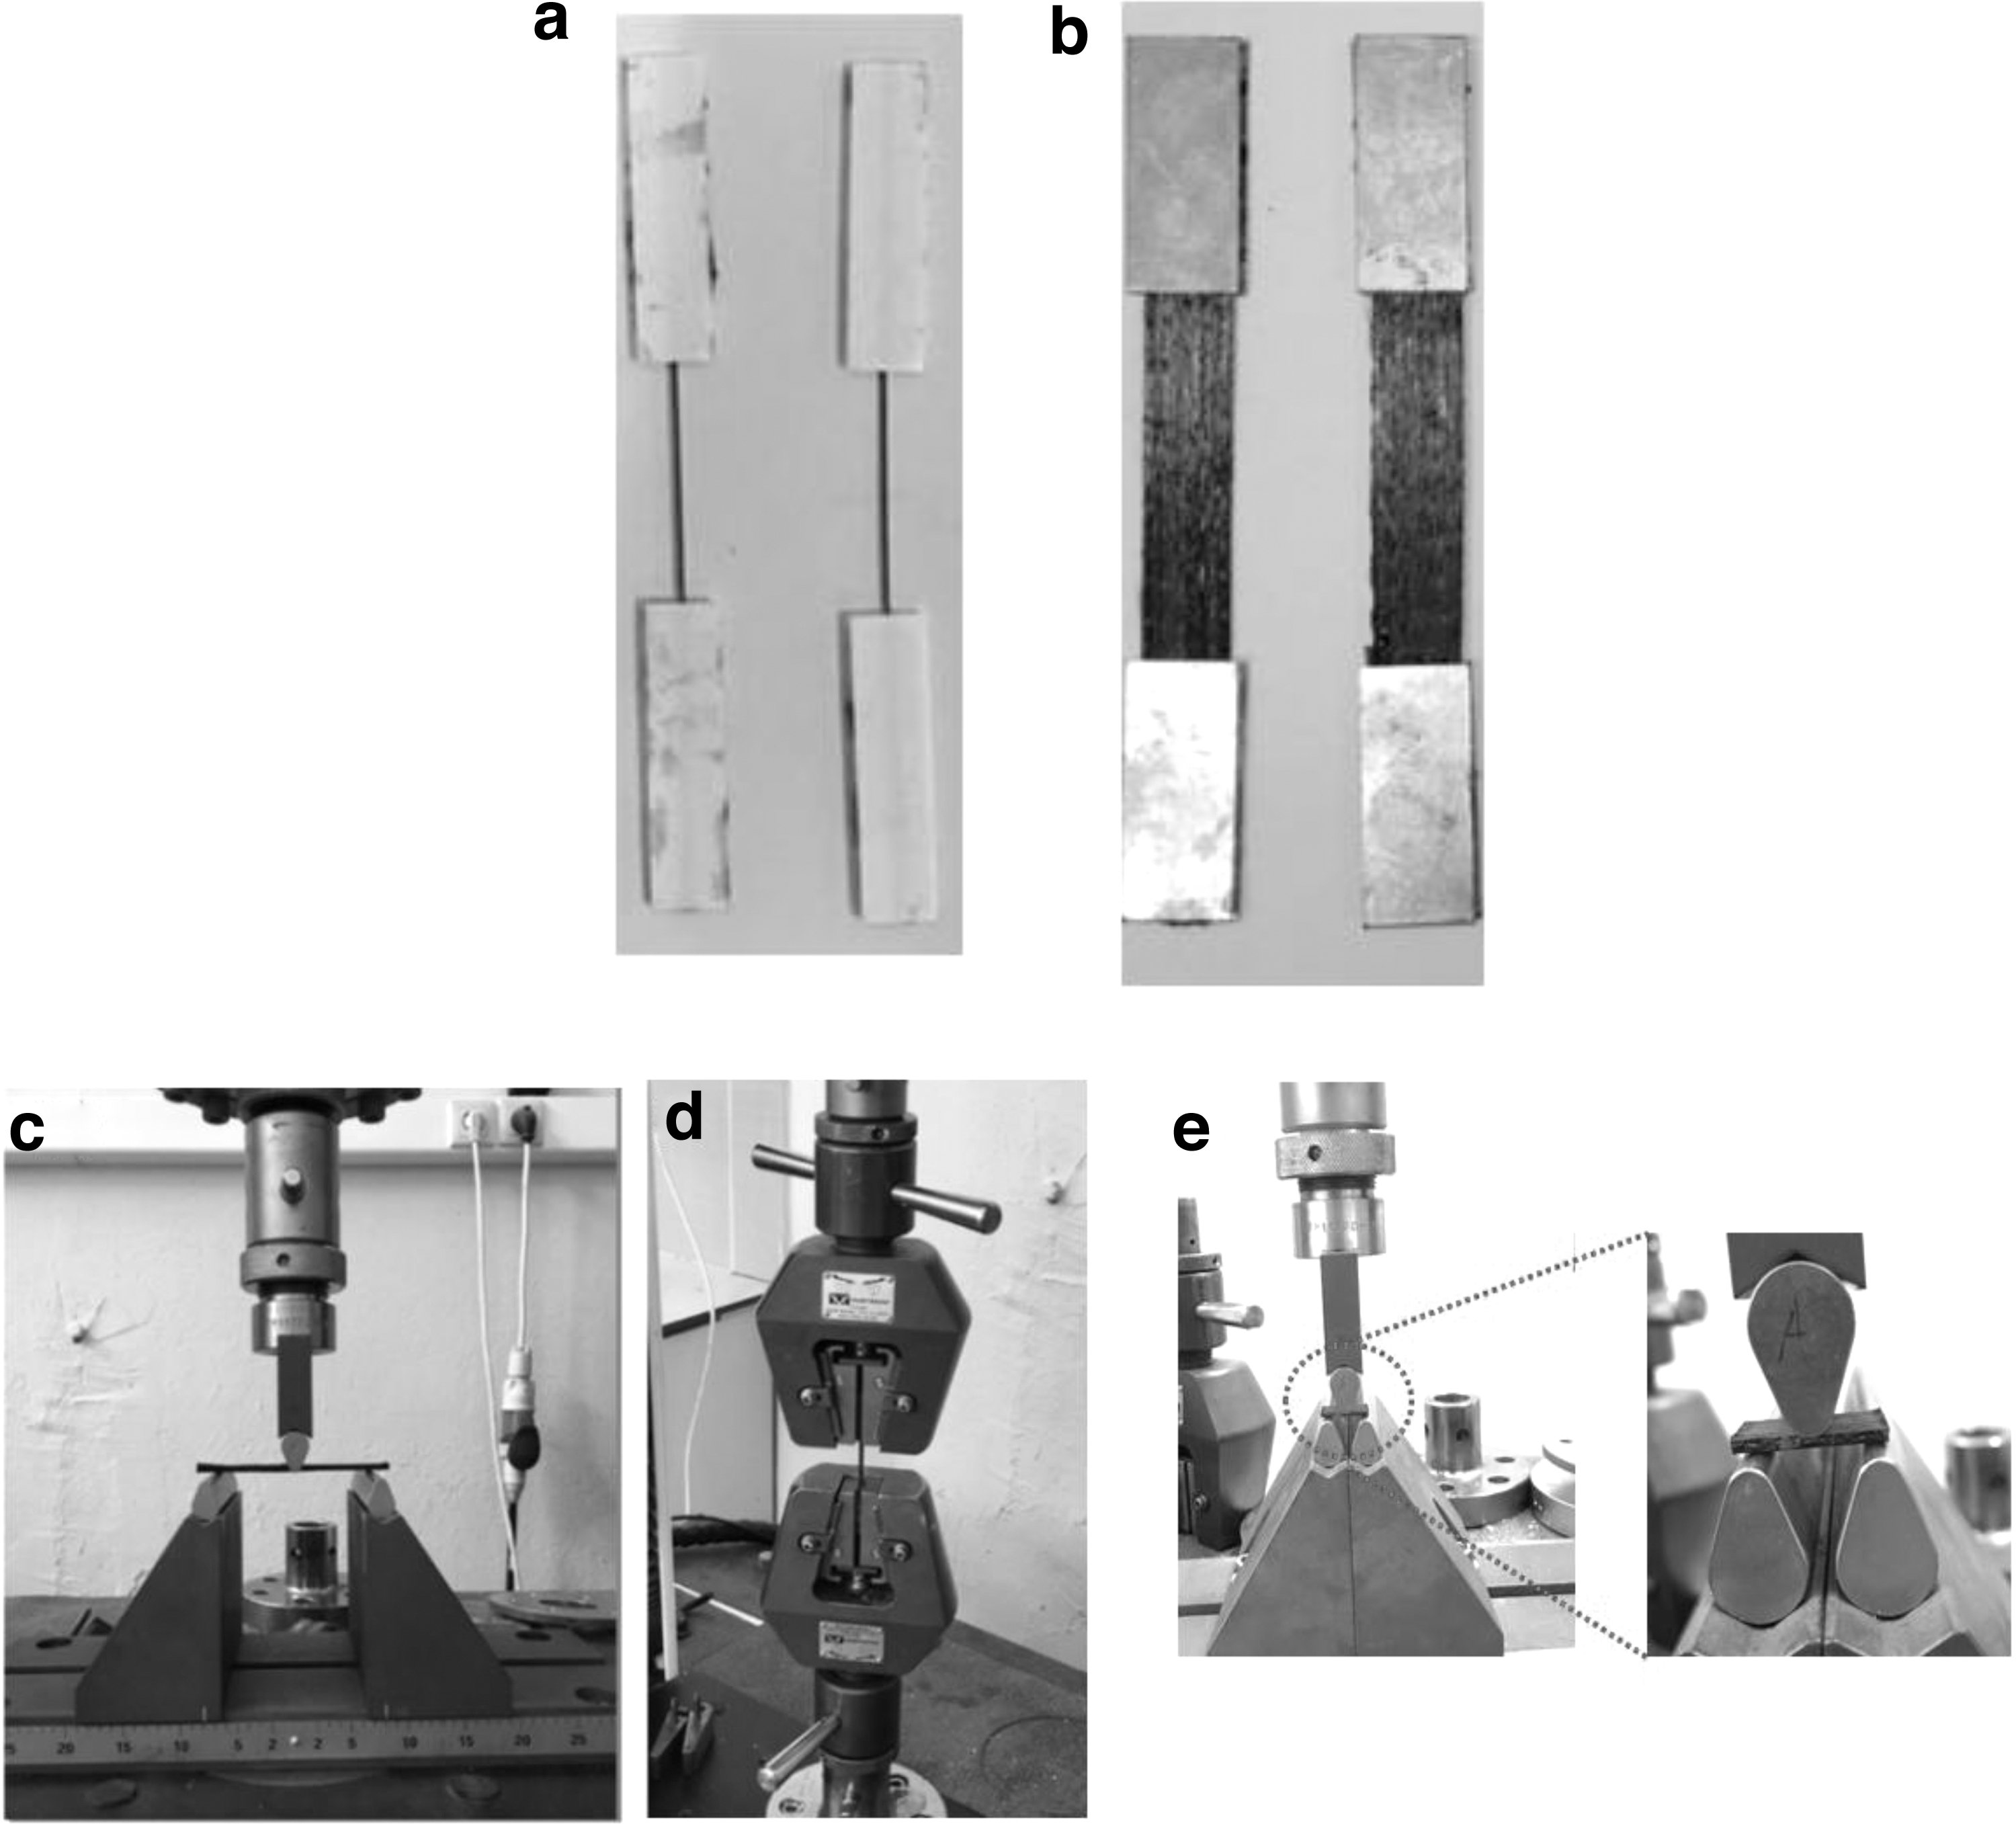
The photos of the samples and mechanical tests:
Microstructural tests
Microstructural tests were carried out to examine the fracture surface morphologies of flexural test samples using scanning electron microscope (SEM). In contrast, the impregnation qualities of each CFRTP filament were examined using optical microscopy. ZEISS EVO LS 10 and ZEISS Observer.A1 devices were used to examine SEM and optical images, respectively.
Results
Tensile test responses
Tensile test behavior of CFRTP filaments
Stress–strain curves obtained from the filament tensile test are given in Figure 6. These curves show that the samples exhibited a typical composite tensile behavior.39,40 Both samples exhibited a sudden failure behavior without showing any yielding during elongation. The ultimate tensile strength was 1067.27 ± 10 MPa for the 3K CFRTP filament and 1090.22 ± 14.1 MPa for the 6K CFRTP filament. As can be seen from the results, the values for both samples are quite close to each other, but their standard deviations are also relatively low. This reveals that the repeatability of the tests is quite high.

The stress–strain curves obtained from filament tensile tests:
It is also seen that the tensile strength values reach the highest value in CFRTP filaments for the PLA matrix. 18 However, it can be stated that it is ∼25% higher than both the values found for polyamide (PA) matrix CFRTP filaments with 50.2 Vf% fiber fraction 12 and commercial PA matrix filament (with 38 Vf%). 18 From the results, it can be easily estimated that the quality of the filaments is high. It was expected that different fiber bundle sizes would not influence the ultimate tensile strength for the same fiber fraction. Obtained ultimate tensile strength of the 3K and 6K filaments were approximately the same, which confirms the expectations.
Tensile test behavior of CFRTP samples
The stress–strain curves obtained from the 3K and 6K CFRTP tensile tests are given in Figure 7. The figure shows that the average ultimate tensile stress was ∼652.26 ± 85.44 MPa for the 3K CFRTP sample and 653.06 ± 18.48 MPa for the 6K CFRTP sample. It is observed that the results are almost the same for both samples. Table 2 compares the results of some similar studies in the literature. As can be seen from the table, the current study results are higher than the values obtained from the studies using the in situ impregnation method and are at a level that can compete with the studies using the pre-preg filament method. In particular, it is seen that better results are obtained than the results of studies using the PLA matrix.13,18,23,24,27

The tensile test results for
Comparison of Tensile Test Results with the Literature
CFRTP, continuous fiber-reinforced thermoplastic; PLA, polylactic acid; Vf%, volume fraction; W, weight fraction.
The results show that similar behaviors were achieved for the same fiber fraction and sample dimensions for the tensile tests. It should be noted that the difference in the number of layers for both samples did not significantly affect the tensile test results. As is well known from classical mechanical strength theory, shear stresses predominate in transverse rather than axial loading. Therefore, it is easy to understand that poor interlaminar bonding does have no primary effect in the tensile tests for CFRTP samples. Thus, it can be said that the tensile test results for both samples are similar in accordance with the expectation.
In addition, failed samples are shown in Figure 7c. From the figure, it can be observed that the tensile samples showed typical brush-type failure.22,41 This type of failure mode has been shown as a partial separation between the layers in various regions within part. 18 A summary of the tensile test values for both filaments and samples is comparatively given in Table 3.
Summary of Tensile Test Results for Both Continuous Fiber-Reinforced Thermoplastic Samples and Continuous Fiber-Reinforced Thermoplastic Filaments
Three-point bending test results
The stress–strain curves obtained from the 3K and 6K CFRTP flexural tests are given in Figure 8. As can be seen from the figure, the samples exhibited only linear elastic behavior and sudden failure, which is an expected composite flexural behavior.42,43 For the 3K CFRTP flexural sample, the ultimate flexural stress and modulus of elasticity were 470.85 ± 23.05 MPa and 60.67 ± 3.2 GPa, respectively, whereas the 6K CFRTP sample has shown 566.77 ± 8.06 MPa and 80.28 ± 5.75 GPa, respectively. When the results are examined, the ultimate flexural strength and modulus of elasticity of the 6K flexural sample are 20.37% and 32.32% higher, respectively, compared with the 3K. These samples seem to be performed better when compared with other studies in the literature.19,44 Comparison of the results with respect to some studies, including the PLA matrix in the literature, is summarized in Table 4.

Three-point bending test results for
Comparison of Flexural Test Results with the Literature
Interlaminar bonding is one of the biggest problems in parts produced with additive manufacturing. 45 Insufficient bonding of the layers and porosity adversely affects the flexural strength of the part. Furthermore, if the bonding between the layers is not sufficient, delamination may occur. In this study, it should be emphasized again that the number of layers of the sample produced using 3K CFRTP is higher than the sample produced using 6K CFRTP. It is thought that this introduced a decreasing the flexural strength because of the possible, increasing gaps and pores between the layers besides poor interlaminar bond effect depending on the increasing layer number. Hence, 6K CFRTP samples show better performance than 6K ones in terms of flexural loading. In addition, it can be concluded from the obtained results that the more CRFTP filament diameter or layer thickness is increased, the better flexural performance can be achieved. The failed bending samples are shown in Figure 8c. Due to the nature of the test, tensile stress occurs on the lower surface of the part, while compressive stress occurs on the upper part. This resulted in failure from the lower surface of the part. A complete separation has not occurred due to delamiation and pull-outs due to the incompatible sizing agent on fibers. All results of the three-point bending test are summarized in Table 5.
Summary of Flexural Test Results
ILSS test results
In this study, ILSS tests were carried out to investigate the interlayer shear behavior of 3K and 6K CFRTP samples in more detail. The ILSS values obtained for both samples are given in Figure 9a. The ILSS of the 3D-printed 3K and 6K CFRTP samples were 5.90 ± 0.173 and 11.44 ± 1.043 MPa, respectively. The ILSS of the 6K CFRTP sample is 93.90% higher than that of the 3K CFRTP sample. As can be seen, this increase is much higher than the values obtained from the three-point bending test. This result was expected since much shorter samples were used in the ILSS tests, and the shear effect between the layers became more dominant.9,15,44 As can be seen from the results, the lower number of layers in 6K CFRTP samples makes them much more durable in terms of ILSS than in 3K CFRTP samples. As aforementioned, in structures with additively produced CFRTP, the weakest strength usually occurs between the layers. As the number of layers increases, the interlayer resistance of the samples decreases.

ILSS test results for
Figure 9b shows the examples of failed samples from the ILSS tests. As a result of the applied load, delamination occurred in both samples. The reason for this is thought to be a weak bond between layers in additive manufacturing.15,46,47 In addition, the poor bonding may be caused by the nonhomogeneous mixture of polymer and fiber, nonwetted fibers, lower than the glass transition temperature of the polymer on the previous layer surface during printing, or porosities caused by the printing process.15,22
Microstructural analysis
The bonding of carbon fiber and polymer in CFRTP composite parts and the homogeneous dispersion of carbon fibers in the polymer are crucial for mechanical performance. 48 Therefore, to observe the impregnation behavior between fiber and polymer, the CFRTP filament, the parts printed with these filaments, and the fracture surfaces were examined by optical microscope and SEM images. Figure 10 shows optical images of 3K, 6K, and commercially available 1K/PA filaments from MarkForged 49 for comparison with this work. From the figure, it can be observed that the fiber–polymer mixture looks quite homogeneous for the 3K and 6K filaments. It is clear that the 3K and 6K filaments provide a very homogeneous blend when compared with the MarkForged filament (Fig. 10e). However, there is a minor porosity in a part of the filament.
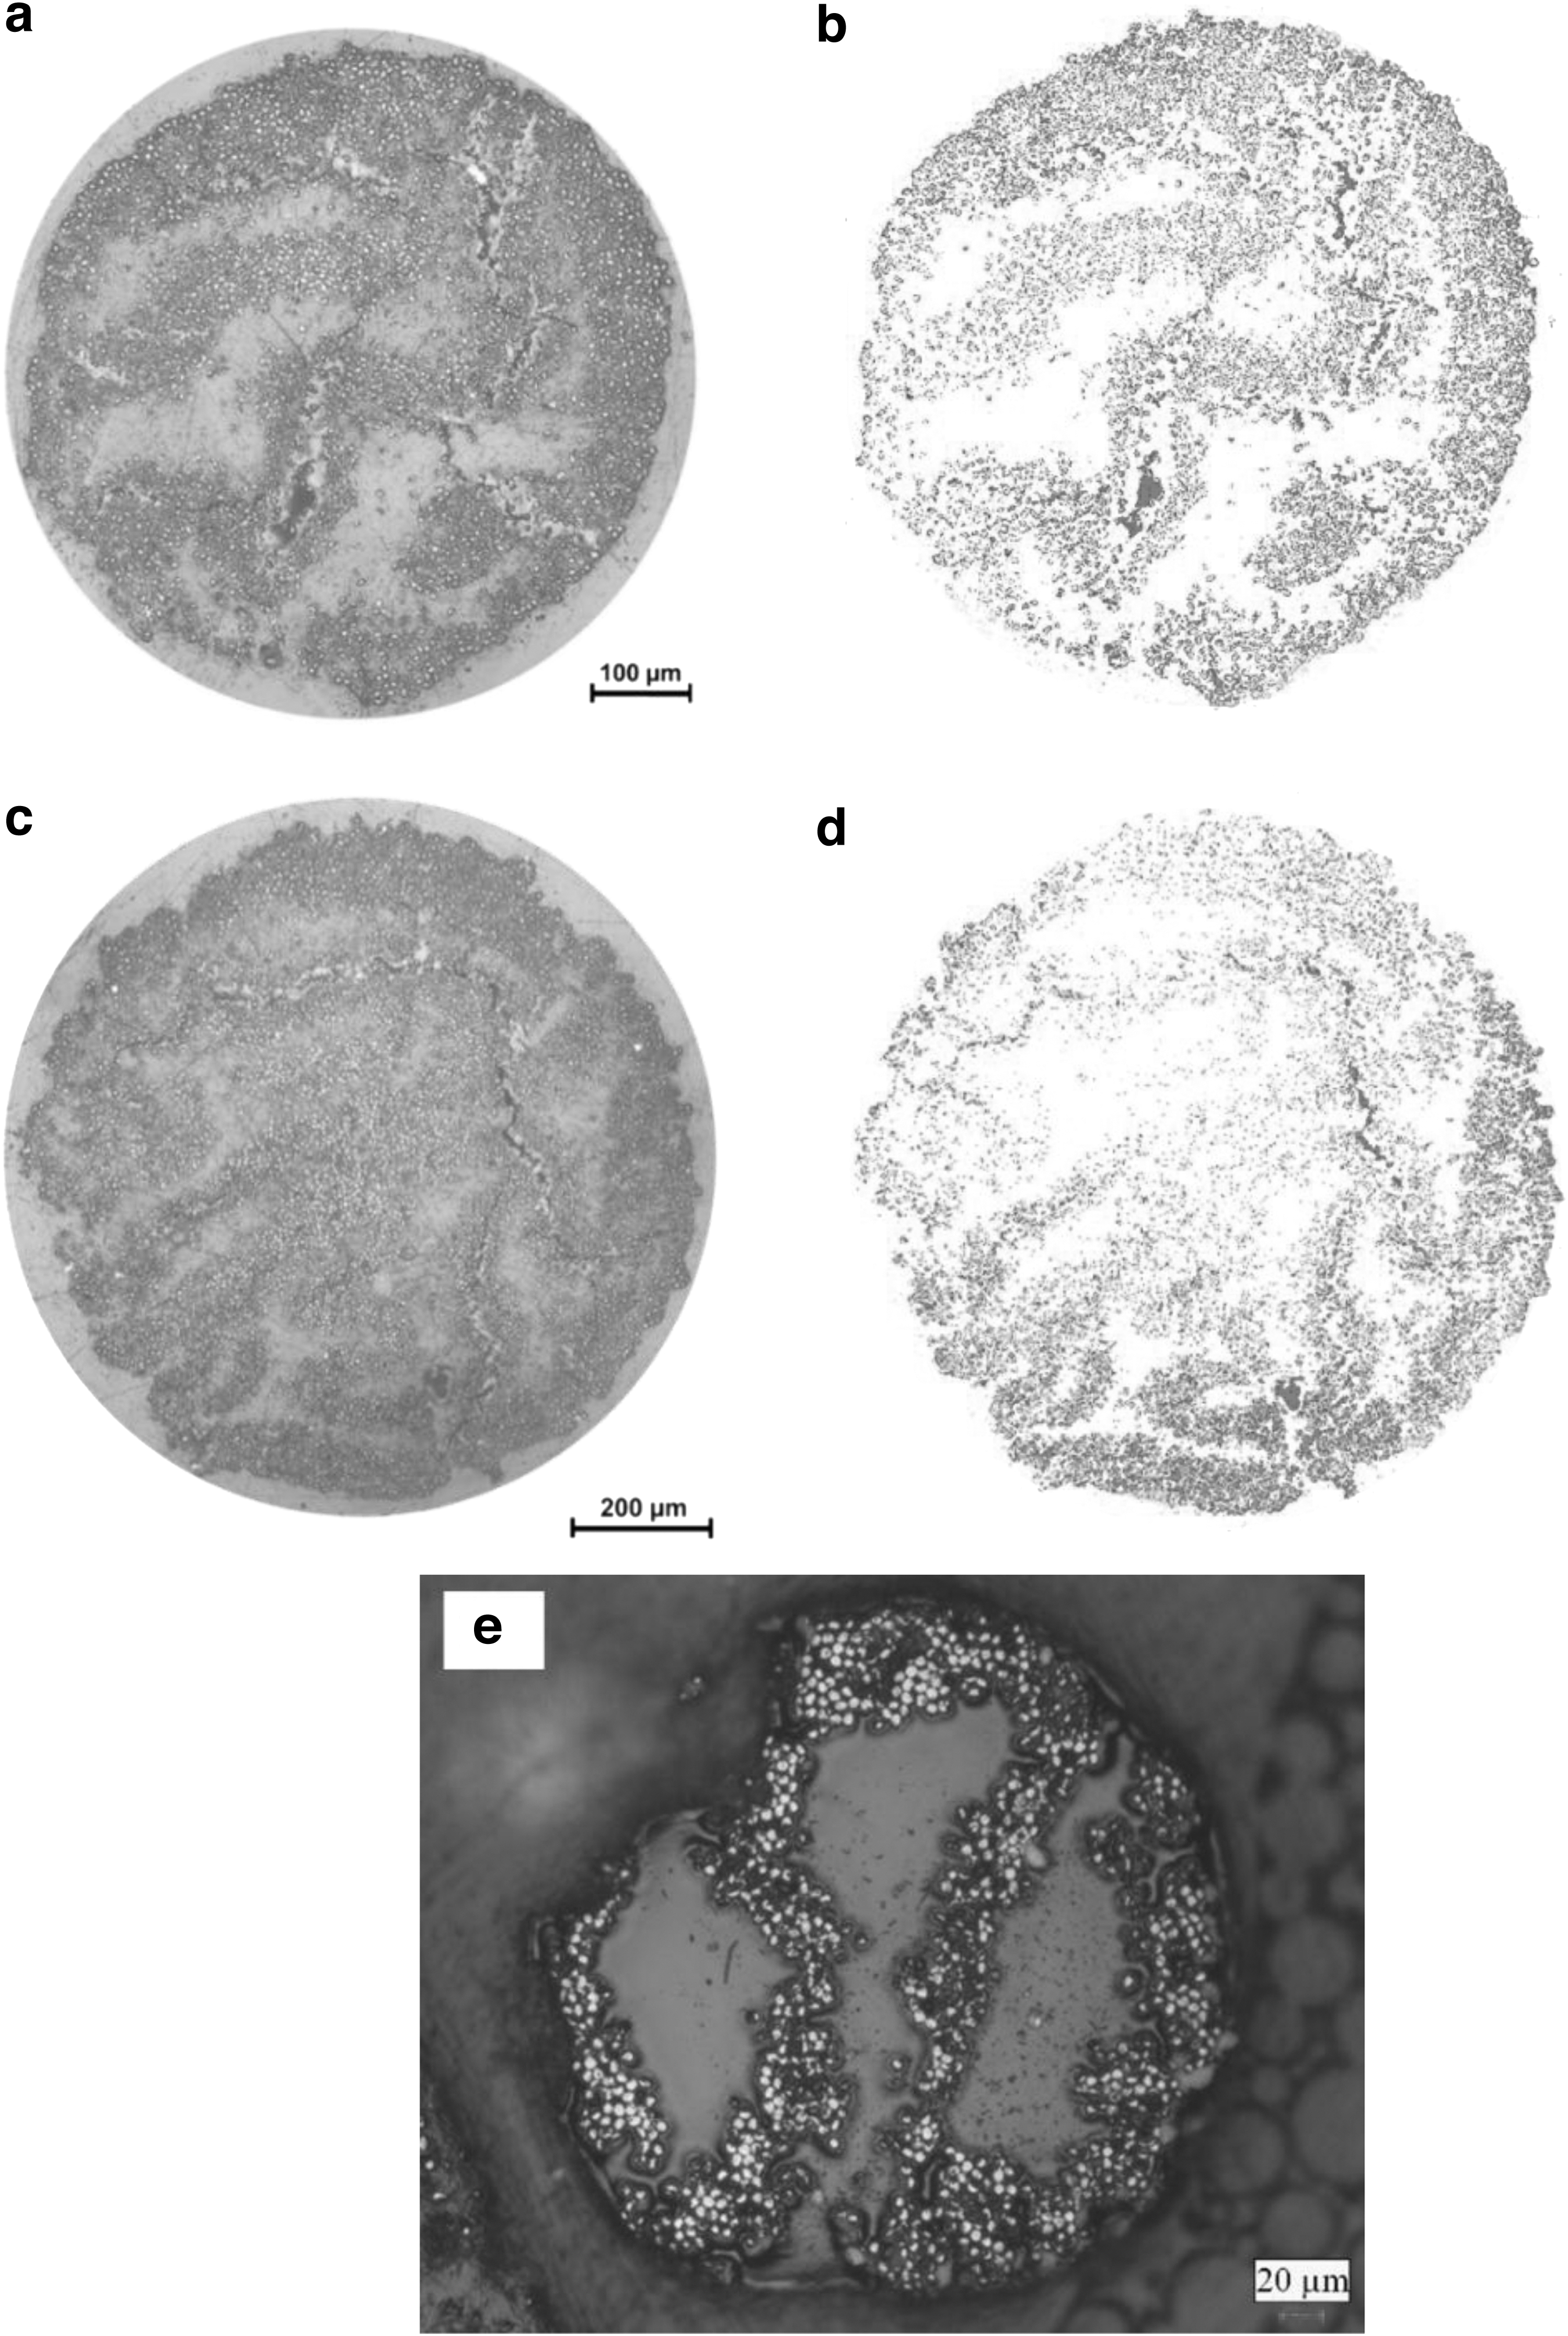
Cross-sectional CFRTP images obtained from optical microscope:
These local areas may have occurred due to the fact that the filament is not drawn in a precise alignment during filament production, and it can be said that the melting impregnation method homogeneity is limited 50 and should be improved. Porosity ratios of the filaments were calculated using the ImageJ software. The ImageJ software is an image processing platform that can calculate the porosity fraction on the part's cross sections using images from optical or scanning electron microscopes. This can be achieved by analyzing the dark regions that correspond to the porosity on the cross section and calculating their area.
For example, the representative images used in calculating the porosity of the filaments are shown in Figure 10b–d. In this study, at least five measurements were taken from the same sample's different cross sections. An average porosity ratio of 3.27% for the 3K CFRTP filament and 6.37% for the 6K CFRTP filament was observed from this analysis. As can be understood, 6K CFRTP filaments contain more porosity. This situation is thought to be caused by the production of the 6K CFRTP filament. As it will be remembered, 6K CFRTP filaments are produced by simultaneously conjoining two 3K CFRTP filaments through a hot nozzle. Meanwhile, it is predicted that additional porosity is formed at the interface during the melting of 3K CFRTP filaments.
In addition, the optical images in Figure 10 were used to determine more accurate fiber fraction values. Considering the averages of many measurements, the average diameter of the 3K CFRTP filament was determined as 0.62 mm and that of the 6K was 0.85 mm. As can be seen, the filament diameters are slightly higher than the nominal value. Therefore, the fiber volume fraction values were updated as 38.25% Vf for 3K CFRTP and 40.16% Vf for 6K CFRTP based on these values.
Figure 11 shows the optical images of the cross-sectional areas of the 3K and 6K CFRTP flexural samples. When the cross section of the CFRTP parts is examined, it seems that the fiber–polymer mixture is again homogeneous. Still, there are polymer and fiber-rich regions, which are emphasized in the figure. Also, more porosity can be observed in both parts. The ImageJ software calculated the porosity fraction: 9.94% for 3K CFRTP and 8.49% for 6K CFRTP. However, even though the 6K filament had more porosity in the filament, 6K parts showed less porosity. This is caused by two main reasons. First, the filament is remelted in the printing process, and pressure is applied from the nozzle. This reduces the porosities in the filament to have a lesser impact on the final part porosity. Second, 3K CFRTP has more layers that cause porosities in the interlayer surface, which has a more dominant effect on the final parts' porosity fraction.
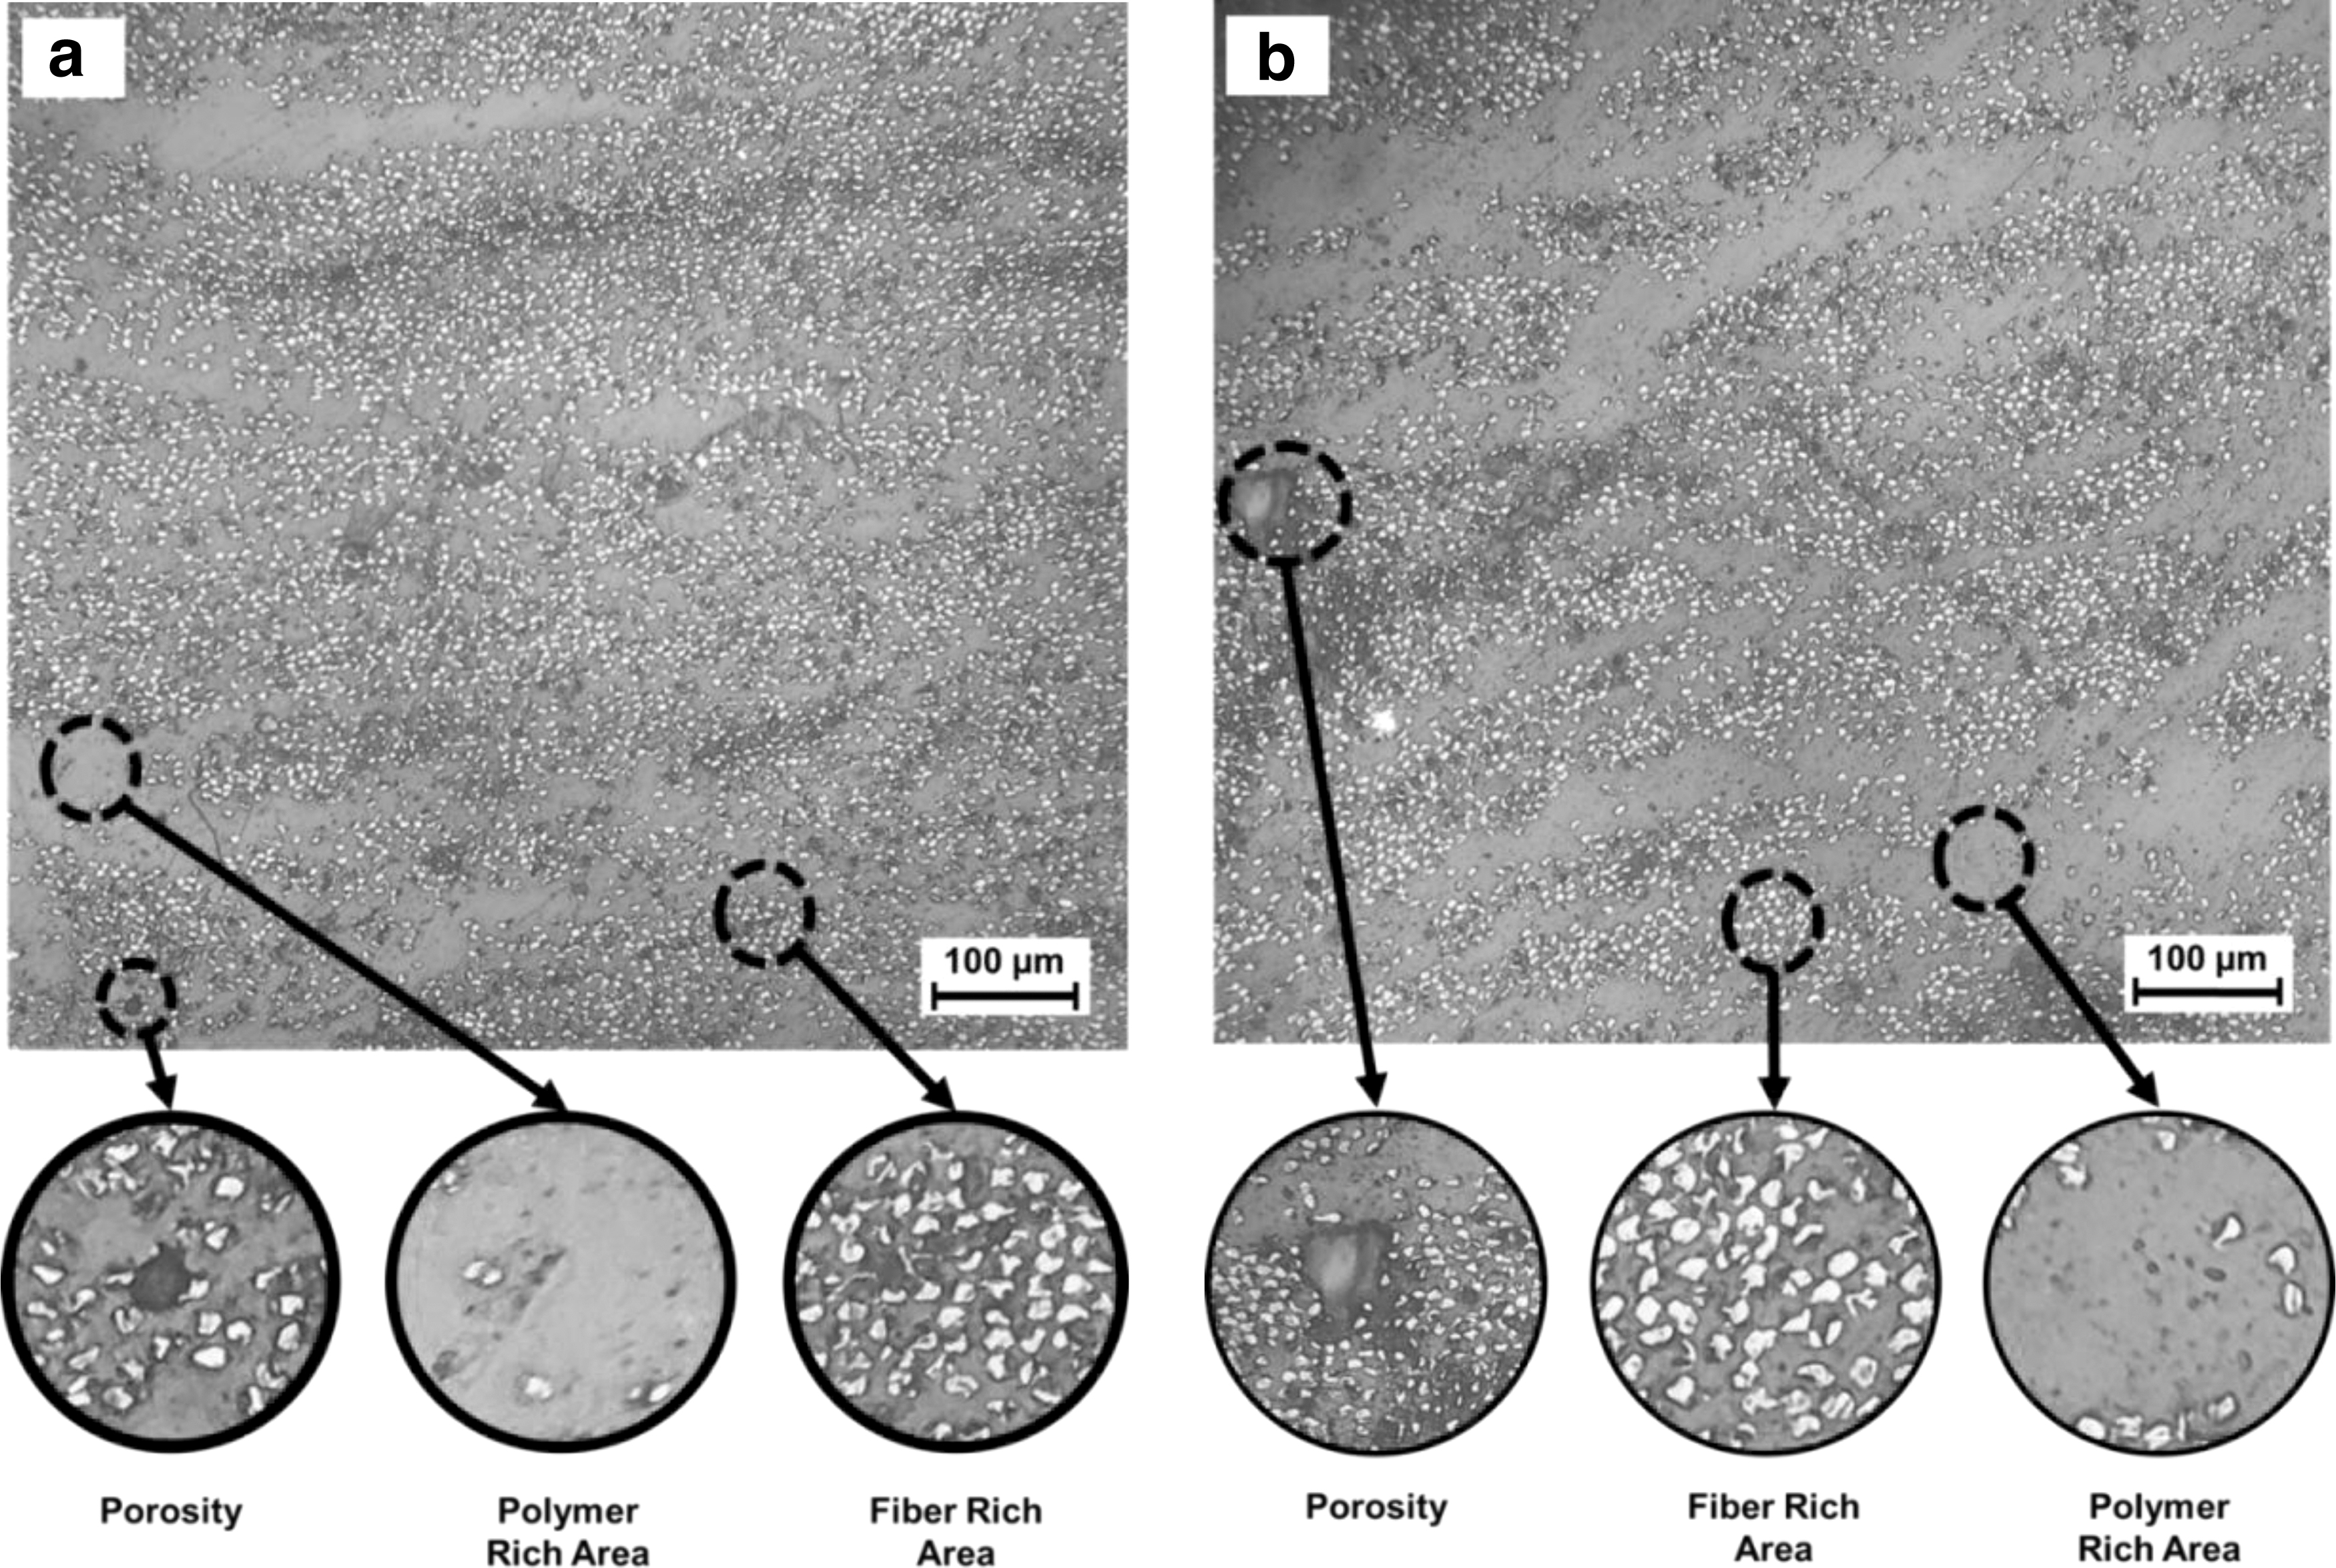
Optical images of CFRTP flexural samples:
The SEM image of the failed surface of the 3K and 6K flexural samples is shown in Figure 12. As shown in Figure 12a, delamination between layers occurred in the flexural test using the 3K filament. Although the fiber and polymer adhesion appear to be quite good, there are still some problems with interlaminar adhesion in some areas. This is thought to be due to the incompatibility of the sizing agent used on the fiber and the polymer matrix. When the fracture surface morphology of the sample printed with the 6K filament in Figure 12b is examined, fiber pull-outs can be observed.

SEM images of failed surfaces from flexural samples:
This failure mechanism is due to insufficient fiber–polymer bonding and nonhomogeneous wetting. Evidence for insufficient fiber–polymer bonding is the voids around the fibers and the absence of any polymer residues on the fiber surfaces. The evidence for insufficient fiber–polymer bonding is the absence of any polymer residues on the fiber surfaces and voids around the fibers, as clearly shown in Figure 12. This is presumed to be due to the incompatible sizing of the fibers with PLA. It can be easily understood that in the case of a sizing application compatible with PLA, both tensile and flexural strength will increase significantly.13,44,51
Conclusions
In this study, the mechanical performance of 3D-printed CFRTP composites with different fiber bundle sizes produced via FDM was investigated. For this purpose, two different fiber-reinforced thermoplastic filaments with the same fiber fraction and different carbon fiber bundles (3K and 6K) were produced using a unique fiber–polymer impregnation platform. Three-point bending and tensile test samples were printed from these filaments using an FDM-based 3D printer and subjected to tensile and three-point bending tests. From the mechanical results, it was revealed that fiber bundle size did have no significant effect on axial loading.
However, 6K CFRTP flexural strength and modulus of elasticity obtained from the three-bending test increased by 20.37% and 32.32%, compared with 3K CFRTP due to the increasing number of layers and fractions of voids and porosity. However, the ILSS value of 6K CFRTP samples compared with 3K CFRTP samples showed a considerable increase. Therefore, it was determined that the fiber bundle size increase caused a serious increase in flexural strength for the same fiber fraction. Finally, it can be said that usage of higher fiber bundle sizes can achieve higher mechanical properties.
In addition, it should be noted that using large-sized filaments can cause problems when printing sharp corners. However, with a smaller bundle size, higher accuracy in the geometry can be achieved on sharp corners and small features. Therefore, a balanced bundle size should be selected according to the geometry and desired mechanical properties in the printing process.
Footnotes
Authors' Contributions
B.B.V.: Writing—original draft, methodology, investigation, and data curation. A.U.: Visualization, writing, review and editing, and conceptualization. R.G.: Literature search, conceptualization, supervision, funding acquisition, and methodology. C.Ş.: Software and methodology.
Author Disclosure Statement
No competing financial interests exist.
Funding Information
This work was supported by the Scientific and Technical Research Council of Turkey (TÜBİTAK) (Grant No. 120M717). This work was also supported by the Office of Scientific Research Projects of Karadeniz Technical University, Turkey (Grant No. FBA-2020-8974).