
Abstract
Additive manufacturing/three-dimensional printing (AM/3DP) processes promise a flexible production modality to fabricate a complex build directly from its digital design file with minimal postprocessing. However, some critical shortcomings of AM/3DP processes related to the build quality and process repeatability are frequently experienced and reported in the literature. In this study, an in situ real-time nondestructive monitoring framework based on the dispersive properties of phononic crystal artifacts (PCAs) to address such quality challenges is described. Similar to a witness coupon, a PCA is printed alongside a build while it is interrogated and monitored with ultrasound. A PCA is substantially smaller than the actual build. Due to its periodic internal structures, a PCA creates pass and stop bands in its spectral response, which are sensitive to the variations in its process and material parameters. These periodic structures, representing the geometric complexities of an actual build, are designed for a specific monitoring objective(s) in AM/3DP. As a model application, in this demonstration study, the effect of the laser scanning speed of a slective laser melting (SLM) printer on the spectral properties of metal PCAs (mPCAs) is ultrasonically evaluated offline. The dependency of the pressure and shear wave speeds, the apparent Young's and shear moduli, and Poisson's ratio on the scanning speed are quantified, and it is found that they are highly sensitive to the laser scanning speed of an SLM printer. The sensitivity of the peaks of the pressure and shear spectral waveforms acquired for the identical mPCA designs printed on the same build plate with the same process parameters is also quantified. For powder-based AM/3DP technologies, where scanning speed is among the crucial process parameters such as laser power and bed temperature, the reported correlations between scanning speeds and the mechanical and spectral features of the mPCAs are expected to be instrumental in developing in situ real-time monitoring systems.
Introduction
Additive manufacturing/three-dimensional printing (AM/3DP) processes offer a highly flexible utility for manufacturing a build directly from its digital computer-aided design (CAD) representation with a resolution on the order of tens of micrometers virtually regardless of its geometric complexity. The promise of AM/3DP has been widely acknowledged1–4 over the past two decades, and substantial progress has been made in its practical utilization, from conceptual design to the fabrication of functional complex builds. 1 Yet, some critical shortcomings of AM/3DP processes related to the build quality and process repeatability are frequently experienced and reported in the literature.1–4 For metal three-dimensional (3D) printing, selective laser melting (SLM) is one of the most popular processes and is widely used in various industries, from aerospace to medical devices and research and development. 5
In SLM, metallic powders are melted and fused using a scanning high-powered laser beam. In SLM, several process parameters are involved, such as laser power, scan speed, hatch spacing, layer thickness, powder materials, and chamber environment. The main challenges of the SLM process include unpredictable defects, such as porosity, the high probability of lack-of-fusion, and keyholing (cracks), depending on the parameters of the SLM process; thus, its effectiveness would benefit from in situ real-time monitoring. 6
Quality assurance is often a challenging requirement for builds with complex overall shapes and intricate internal structures, and print defects are common. 3 The mechanical strengths of load-carrying tracks (at track-to-track, interlayer, and intralayer levels) and their bonding effectiveness (e.g., due to lack of fusion) are impacted by such track-level irregularities. Furthermore, considering the nature of layer-by-layer processing, it is known that the specimen's microstructure inside every track and/or layer varies from that at the layer boundaries, giving rise to anisotropic behavior,7,8 which also impacts how the 3D-printed part behaves under complex loading conditions. The variability in part quality and the measurement science needed to make real-time monitoring possible were documented by the National Institute of Standards and Technology (NIST). 4 Although process control could significantly reduce process variability, the lack of real-time data and robust quality monitoring systems often hampers the effectiveness of a control system.
In response to such quality issues, numerous methodologies have been developed for AM/3DP over the past two decades to understand how printing-related process parameters influence the mechanical properties of printed endproducts.9,10 These traditional approaches often involve direct destructive compression (ASTM standard D695), tensile (ASTM D638 type I), and four-point flexure (ASTM D790) testing of a printed part to evaluate its mechanical properties. Although these methodologies have high accuracies in predicting tensile strength, compressive strength, and Poisson's ratio, they are not always practical or widely accepted due to their high cost and destructive nature. In addition, another major stumbling block with destructive testing techniques, especially these standardized methods, is that they rely on the design, preparation, and testing of the standard test coupons and are limited to a relatively small number of samples, which might not necessarily represent the actual builds.
Thus, nondestructive evaluation (NDE) mechanisms leading to in situ real-time monitoring for each build are desirable for this type of quality control and assurance task since they often enable timely and effective measurements. 11
The utilization of computer vision, 12 thermographic imaging systems, 13 and microscopic imaging techniques 14 is reported for in situ AM/3DP quality assessment. AM/3DP processes often have the propensity to generate residual stresses and suffer from delamination. 15 The typical working assumption in visual inspection and/or imaging techniques is that the nondeformed layers distinguished by machine vision could generate sufficient information to measure whether imperfections of inbuilt geometries are present. 16 However, despite the real-time quality monitoring capability and relatively low computational requirements, the results are often inconclusive because of the extreme sensitivity to even the slightest camera movements and changes in lighting conditions. 12 In the ultrasonic NDE technique, elastic wave attenuation, spectral density, and fundamental grain scattering often deliver valuable information about material and defect states that can be correlated to process conditions. 17
Yet, in the case of an AM/3DP-made component with complex geometric features, the ultrasonic waves strongly attenuate and mix due to complicated wave interactions at nonflat interfaces, periodic support structures, and high acoustic impedance mismatches, resulting in strong refraction and scattering effects. Despite the promising capabilities of ultrasonic NDE techniques for process and part quality monitoring, these factors can significantly reduce the effectiveness of a traditional ultrasonic test in practical AM process qualification applications. The presented approach aims to overcome this limitation of direct ultrasonic evaluation of AM/3DP builds.
The proposed concept is based on the spectral band structures of a phononic crystal artifact (PCA) and its real-time interrogation with an ultrasonic NDE technique. A PCA is printed alongside a build similar to a witness coupon while ultrasonically monitored. A PCA is a specifically designed and fabricated artifact, which is significantly simpler and smaller than the actual build, with repeating (periodic) substructures designed for monitoring the particular quality aspect(s) of an AM/3DP process and a machine as well as its materials due to its tunable sensitivity to the variations in geometric and material properties of the artifact in spectral domain.18,19 Due to its periodic internal structures, a PCA causes its traveling waves to disperse, leading to the formation of the pass bands (PBs) and stop bands (SBs) in its spectral response, which are sensitive to the variations in its process and material parameters.
As an elastic wave pulse propagates in a periodic structure, the impedance mismatch at interfaces of its internal structure results in reflected and transmitted wave fields. The interference between the incident and reflected waves results in destructive (leading to the formation of an SB) or constructive (leading to a PB) interactions, which are known to be sensitive to the process parameters, materials, and internal structure. 20 Generally, an ideal PCA represents a specified subset of the mechanical, physical, and/or geometric attributes of a complex build.
Xu et al 19 conducted ultrasonic NDE experiments with fused filament fabrication (FFF)-made polylactic acid (PLA) PCAs to evaluate the effect of the extrusion speed on the wave propagation properties of PCAs and relate this information to material/geometric quality and reported that the basic PCA with a biperiodic grid structure is capable of detecting printing speeds from the shifts of the SB bounds, indicating that printing speed modulates filament and/or bonding mechanical properties. Furthermore, Xu et al 18 reported that varying thread orientation and placement in fast fourier transform (FFT) on PLA filament-based PCA samples could shift the locations of the PBs and SBs of PCAs.
In the proposed monitoring framework, a PCA's periodic internal structures, representing the geometric complexities of an actual metal build, are chosen for a specific quality monitoring objective(s) and quality program in AM/3DP. In practice, a complex build is decomposed into its elementary PCA set with regular internal patterns by analyzing its sliced version (e.g., its G-code). 21 Depending on the build's geometric complexities and specific quality monitoring objectives, a subset of these elementary PCAs is selected to be used in a monitoring system. 21
In the current proof-of-concept study, the effect of a critical process parameter (laser scanning speed) on the properties of a build is determined by analyzing the ultrasonic responses of the PCAs. The mechanical and spectral properties of the metal PCA (mPCA) sample sets manufactured by an SLM process at three printing speeds (ps) are investigated using an offline ultrasonic technique. The effects of scanning speed (ps) on the elastic wave propagation, spectral characteristics, and mechanical properties are nondestructively evaluated and reported. The practical uses of the presented in situ monitoring framework in real-time process monitoring are discussed.
mPCA Design and Materials
The design of an mPCA used in the current work is a biperiodic 3D frame structure with seven periodic sets (Fig. 1a, b). The existence of a subunit dispersion relation for a periodic structure and the properties of attenuation and propagation zones in the frequency domain has been known and utilized in a wide range of applications (from aerospace structures to high-frequency wave filters and sensors) since the 1940s, 22 as periodicity creates modifiable PBs and SBs in the spectral domain. In general, the band structure of a periodic structure depends on the geometry and dimensions of each repeating subunit and the mismatch in the acoustic impedances of materials of the subunits. The bounds of PBs/SBs for such waves are highly sensitive to the mechanical and geometric deviations of structural subunits and interfaces, such as defects.20,23

This sensitivity is used in designing the PCA-based framework as the primary monitoring mechanism. One-dimensional (1D) wave propagation in layered media and finite layered structures with defects have been studied in the context of periodic structures. 24 In addition to the transfer matrix [T] approach, 25 modal analysis, 26 and receptance formulation27,28 are used to study the structures and sensitivities of PBs/SBs in infinite, mono-, and multicoupled periodic structures. 1D wave localization in disordered biperiodic elastic layered structures was investigated, 29 and it is found that the variations in the elastic and geometric properties of a disordered periodic system could strongly affect its PBs/SBs.
The mPCA sample sets were printed by the FS271M machine (Farsoon Technologies, Inc., Round Rock, TX) at three laser scanning speeds (ps) with the SLM process. The gas-atomized 316L austenitic stainless steel powder (MetcoAdd 316L-A; Oerlikon Metco, New Cassel, NY) with a spherical shape and a particle size distribution of 15–45 μm was used to fabricate the mPCA sample sets. The composition of the 316L powder consists of 18% chromium, 12% nickel, 2% molybdenum, and the remainder is iron. The powder's apparent mass density is listed as 4000 kg/m3, and the bulk mass density (ρ) was taken as 7950 kg/m3 in the reported results. 30 No additional material characterization for this commercially available, widely used powder material is conducted, as its detailed specifications are readily available and the printing process was stable.
The nine mPCA samples were printed directly on the steel build plate (BP) and remained fused during the experiments (Fig. 1c). The print layer thickness was set at 30 μm by the printer. The power of the laser beam with a spot diameter of ∼80 μm was set to 225 W. Since the process parameters used in the current study are widely accepted and common in the industry, and the printed mPCAs and their ultrasonic responses contained no sign of structural abnormality, no additional postproduction material characterization and/or process optimization were deemed necessary. The BP supporting the mPCAs is made of ground low carbon steel (Part No. 1388K481; McMaster-Carr Supply Company, Elmhurst, IL) with a grade of ASTM A36. The plate material comprises a maximum of 0.25% carbon, 0–0.05% copper, 0.03% phosphorus, 0.40% silicon, and 0.03% sulfur, and the remainder is iron. Its bulk mass density (ρ) is 7860 kg/m3. 31
The sample set utilized in the current study consists of a total of 9 mPCAs printed on the same steel BP at 3 different laser scanning speeds (ps) as 15 layers. The specified mPCA thickness in its CAD model is 12 mm with a layer thickness of 0.80 mm and a spacing of 1.60 mm (Fig. 1b). As 1 layer at the interface with the BP is almost completely fused into the BP, each mPCA is assumed to consist of 7 bilayer periodic sets (i.e., 14 layers). The microscopic images of an mPCA sample printed at each scanning speed (ps) are shown in Figure 1d–f. For each scanning speed, the sample set contains three mPCA samples.
Each sample waveform is represented by the unique code in the form of mPCA_Mode_Type_[i j] where Mode is P (for pressure waveforms) or S (for shear waveforms), Type is blank for ultrasonically acquired normalized waveforms or “Sub” if the acquired waveforms are subtracted from the BP waveforms, the index i = 1, 2, or 3 corresponding to the three scanning speeds of ps = 800, 1000, and 1200 mm/s, respectively, and j with values in the range of 1–3 is the number of a sample printed at the same scanning speed (ps). The shape of an mPCA is a rectangular prism with measured average dimensions of 31.36 mm (L) × 31.29 mm (W) × 11.84 mm (h) (Fig. 1b). The apparent mass densities (ρA) of an mPCA sample are determined as follows:
where m and VG are the estimated mass and the geometric volume of a sample, VT is the true volume filled with the 316L materials within the sample, ρ is the bulk mass density of the powder material 316L, and L, W, h are the length, width, and thickness of the sample, respectively. From their measured dimensions, the average apparent mass densities (ρA) of the mPCA samples are estimated as 3211.63 (±3.13), 3227.12 (±21.73), and 3218.86 (±5.65) kg/m3 for ps = 800, 1000, and 1200 mm/s, respectively (Table 1). The pressure (cL) and shear (cT) wave speeds, apparent Young's modulus (EA), apparent shear modulus (GA), and Poisson's ratio (υ) for each sample are determined as follows:
The Sample Length (L), Width (W), Thicknesses (h), Apparent Mass Density (ρA), and the Ultrasonically Extracted Parameters, Round-Trip Time-of-Flight (RToFL and RToFT) for Pressure and Shear Waves, Pressure and Shear Wave Speeds (cL and cT), the Ratio of the Pressure and Shear Speed (κ), the Corresponding Apparent Young's and Shear Moduli (EA and GA) and Poisson's Ratio (ν) Are Listed with Their Averages, Standard Deviations, and Percentage of Standard Deviations for the Metal Phononic Crystal Artifact Sample Sets at Three Levels of Scanning Speeds (ps)
mPCA, metal phononic crystal artifact; SD, standard deviation.
where
Experimental Setup and Ultrasonic Waveform Acquisition
The current evaluation framework is based on the analysis of the pressure (longitudinal [L]) and shear (transverse [T]) wave propagation in the pulse-echo mode into the BP and mPCA samples and the reflections of the pressure and shear waves from (1) the interfaces between the BP and the top layer of an mPCA, (2) the intermediate layer–layer interfaces of the sample, and (3) the bottom surface of the sample and air interface. As depicted in Figure 1a, an ultrasonic experimental setup based on a piece of existing test equipment (ATT2020; Pharmacoustics Technologies, LLC, Potsdam, NY) was developed and used for the ultrasonic evaluation of the mPCA printed directly on the BP (Fig. 1b, c).
The ATT2020 instrument is a computer-controlled ultrasonic waveform acquisition and analysis system consisting of pressure and shear transducers, a load monitoring apparatus, a pulser/receiver board, and a graphical user interface (GUI) based on LabVIEW (LabVIEW 15; National Instruments Corp., Austin, TX) for convenient waveform acquisition and analysis. ATT2020 can be operated in pulse-echo (reflection) (PEM) and pitch-catch (transmission) ultrasonic modes to generate and acquire pressure and shear waves.
In the pressure wave experiments, an ultrasonic pressure transducer with a central frequency of 5.00 MHz (V541-SM; Olympus Corporation, Center Valley, PA), and for the shear experiments, an ultrasonic shear transducer with a central frequency of 2.25 MHz (V154-RM; Olympus Corporation) are used. In the shear wave propagation experiments, the shear wave polarization is chosen to be parallel to the print direction of the mPCAs. For the data acquisition, the ATT2020 instrument was operated in PEM mode with a pulse width of 200 ns, a pulser voltage of 350 V, an amplification gain of 0 dB, a sampling rate of 100 MHz, and an oversampling rate of 512.
An ultrasonic pressure coupling gel (TheraSonic®; Compass Health, Middleburg Heights, OH) in pressure wave experiments and a shear coupling gel (Echo Ultrasonics, LLC, Bellingham, WA) in shear wave experiments were applied on the back side of the BP for reducing air gap and thus increasing wave transmission between the transducers and surfaces of the BP (Fig. 1c). An electrical pulse from the pulser/receiver unit of the ATT2020 instrument excites the pressure transducer. The resulting pressure wave pulse is transmitted through the BP, top layer, internal layers, and the bottom surface of the mPCA and reflected from the interfaces. The reflections are captured by the same transducer and acquired using the ATT2020 instrument for round-trip time-of-flight (RToF) calculations. The same procedure was repeated using the shear transducer for the shear waveform acquisition. The acquired ultrasonic pressure and shear waveforms for the BP (WB) and samples (WS) are processed, digitized, and stored using the UMI2022 GUI. 32
In the experimental setup, the BP plays the role of a delay line, introducing a time delay between the transmitted and reflected waves from the interfaces and separating the main bang (the initial ultrasonic pulse generated and sensed simultaneously by the transducer) from reflections. The mPCA sample sets are fused to the BP (Fig. 1c). An ultrasonic pressure coupling gel (TheraSonic; Compass Health) during pressure wave experiments and a shear coupling gel (Echo Ultrasonics, LLC) during shear wave experiments were applied on the top side of the BP for increasing acoustic transmission between the transducers and the BP (delay line) surface. During the experiments, the ATT2020 instrument was set at a pulse width of 200 ns, a pulse voltage of 350 V, a sampling rate of 100 MHz, an amplification gain of 0 dB, and an averaging (oversampling) rate of 512.
In the present experiments, pressure and shear waveforms are acquired for a total of nine mPCA samples printed at three laser scanning speeds (ps). Each acquired waveform in the PEM is normalized by its maximum amplitude value. As the BP response in the PEM is mixed with the sample response, the subtracted sample waveform is calculated. Each subtracted sample waveform (WS-BP) is obtained as
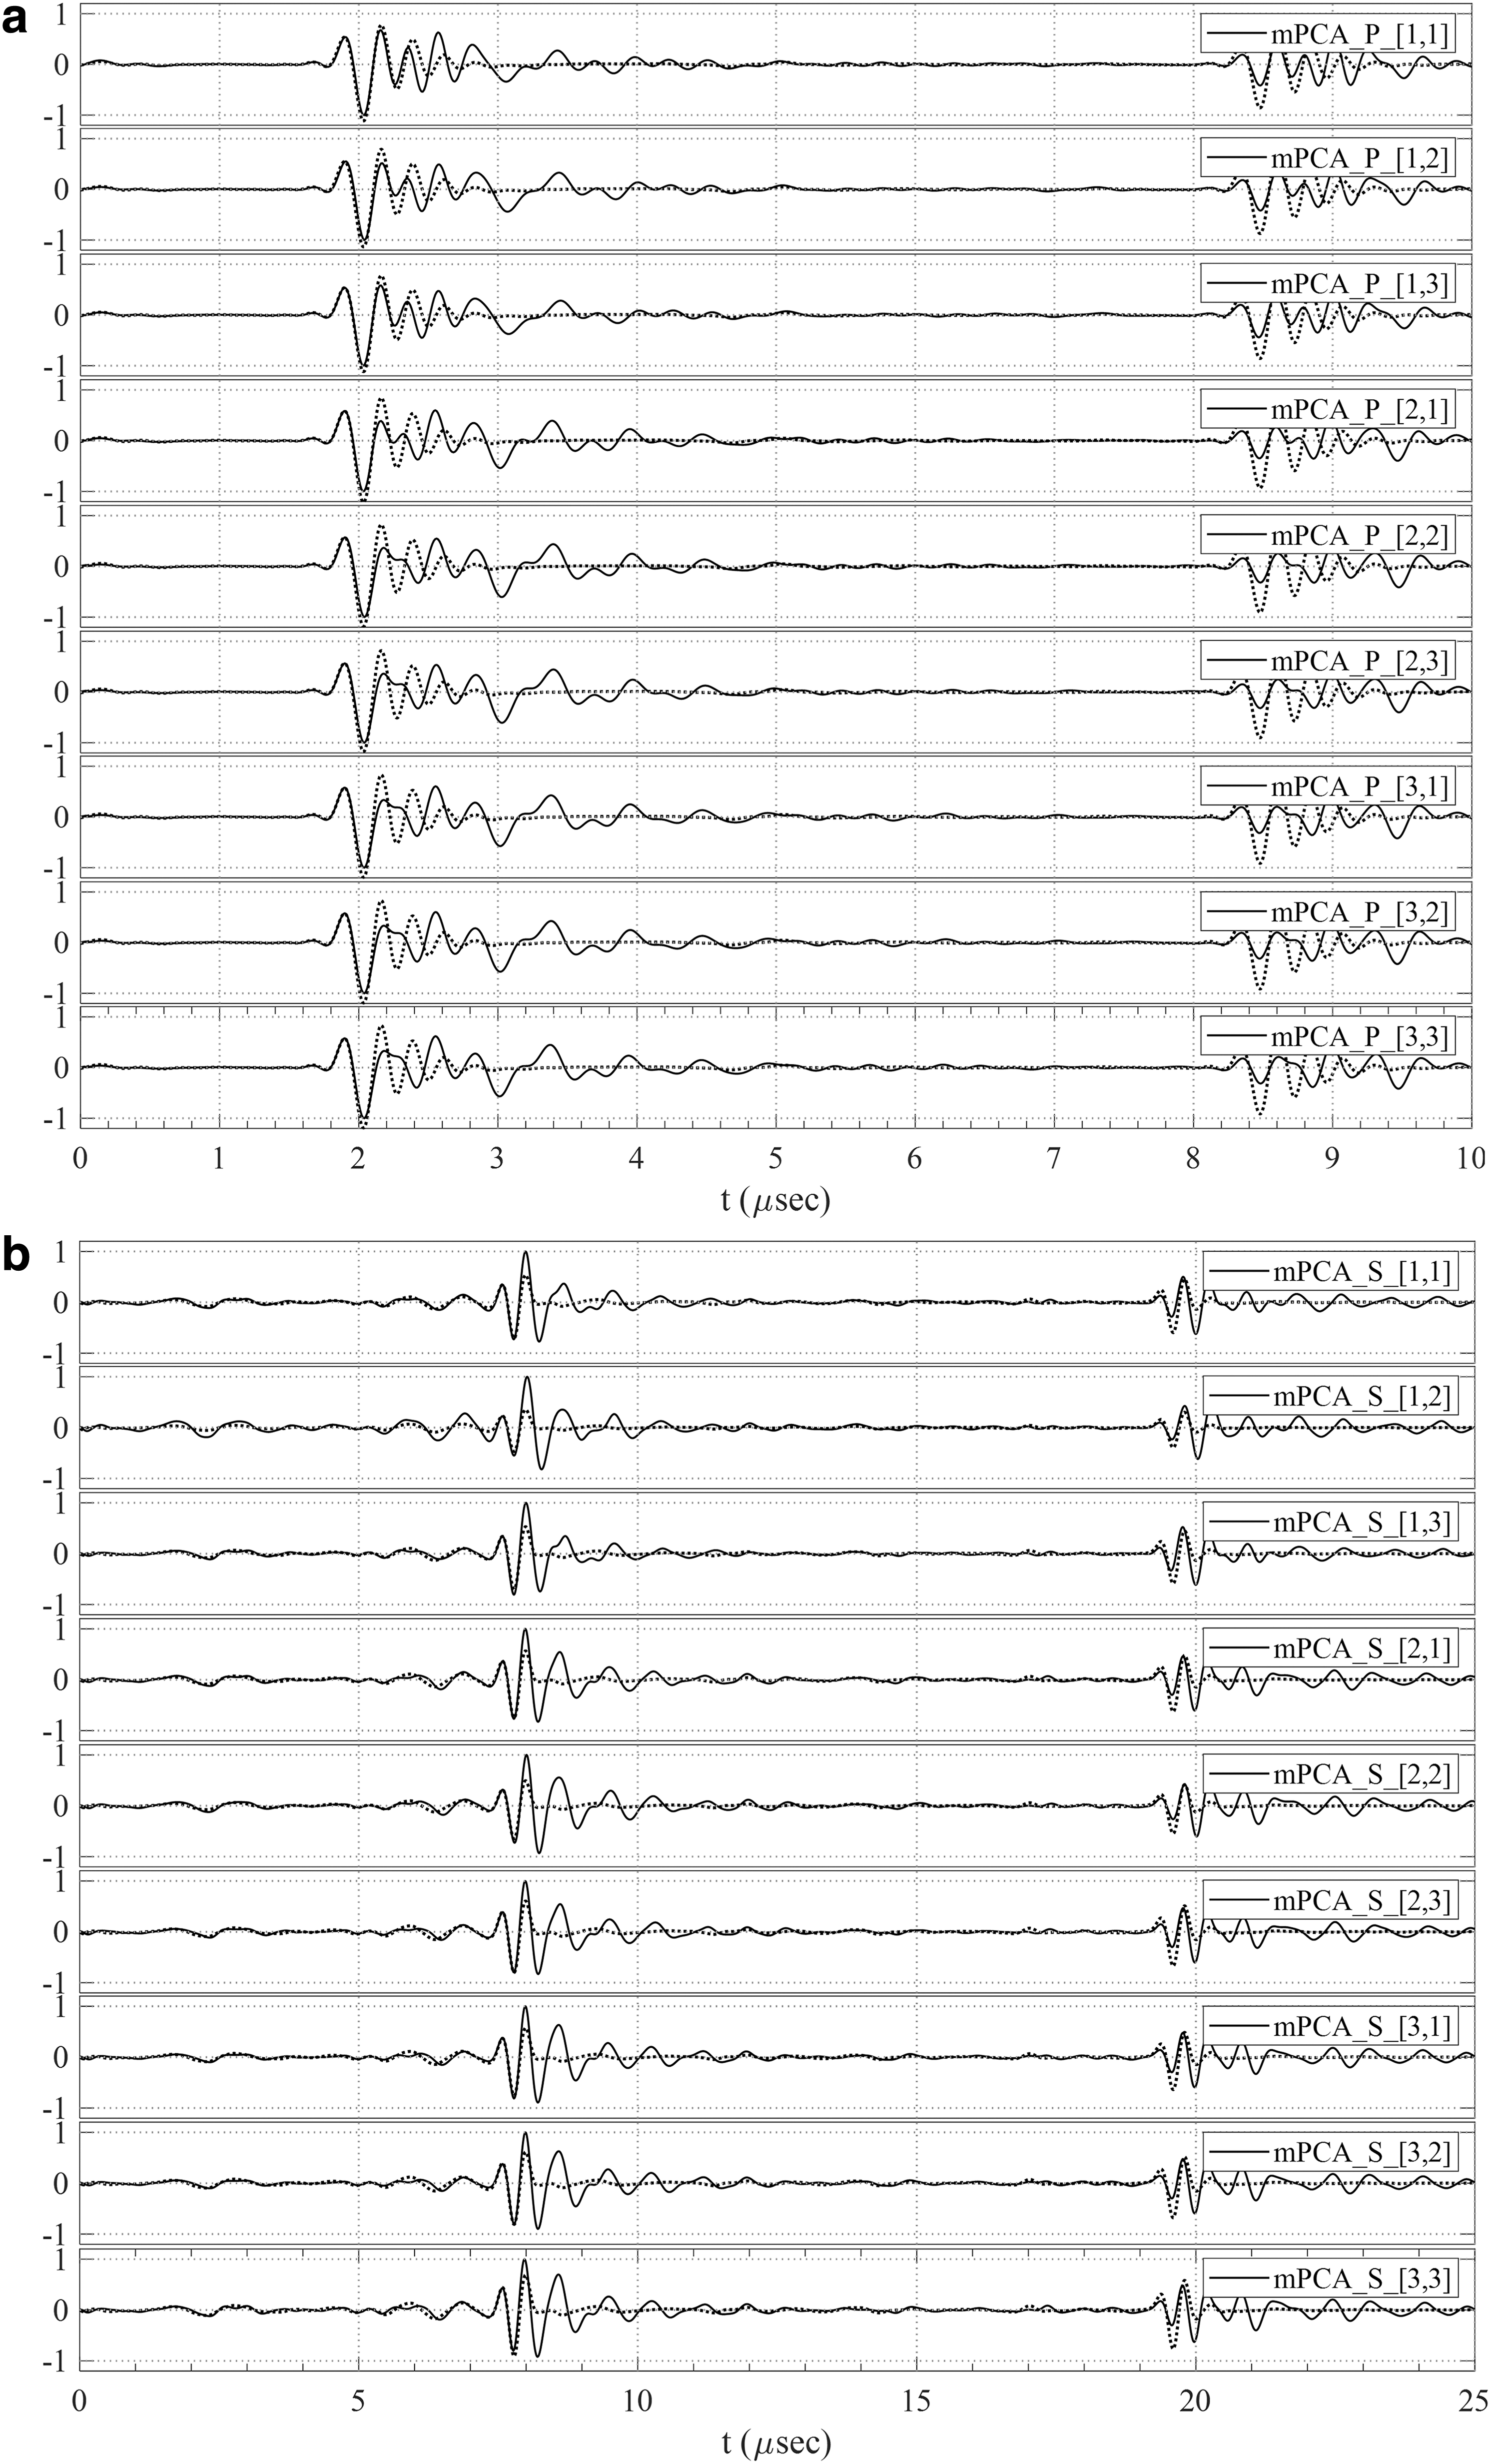
Normalized pressure

Normalized subtracted pressure
Scaled normalized subtracted pressure
The RToF of a (pressure or shear) wave pulse for a sample is obtained to calculate the wave speeds (cL or cT), apparent Young's modulus (EA), apparent shear modulus (GA), and Poisson's ratio (ν) (Table 1).
Results and Discussions
In the current experimental study, the effect of a laser scanning speed (ps) on the properties of a build is determined by analyzing the ultrasonic responses of the PCAs. From the visual observations of the microscopic images of the mPCA samples at three scanning speeds (ps) (Fig. 1d–f), no apparent sensitivities were observed. However, it is found that the ultrasonically extracted mechanical properties and spectral responses are sensitive to the scanning speed (ps). The pressure (cL) and shear (cT) wave speed, apparent Young's moduli (EA), apparent shear moduli (GA), and Poisson's ratio (ν) of the mPCA sample sets are determined using Equations (2)–(4) and listed in Table 1. The extracted average RToFL are obtained as 2.37, 2.32, and 2.31 μs for the pressure wave, and 4.74, 4.68, and 4.66 μs for the shear wave for the printing speeds of ps = 800, 1000, and 1200 mm/s, respectively.
The average pressure wave speeds (cL) and their standard deviations (±SDs) for the mPCA samples are obtained as cL = 9997.71 (±82.33) m/s, 10,214.26 (±17.95) m/s, and 10,279.10 (±18.06) m/s, and the average shear wave speeds (cT) and their ±SDs are determined as cT = 5002.42 (±52.96) m/s, 5063.44 (±9.96) m/s, and 5088.57 (±66.79) m/s at the corresponding scanning speeds (ps), respectively, which are consistent with the published literature. 33 The speed data presented in Table 1 indicate that the wave speeds monotonically increased with the increase of laser scanning speed (ps).
The BP with a thickness of hP = 19.15 mm, which, in the reported experiments, acts as the delay line of the ultrasonic waves before they reach an mPCA sample. The acquired RToFs in the BP are RToFL = 7.15 μs and RToFT = 13.09 μs, and the corresponding measured pressure and shear wave speeds are 5356.64 and 2925.90 m/s. The corresponding Young's (EA) and shear (GA) moduli and Poisson's ratio (ν) are 225.53 GPa, 67.29 GPa, and 0.34, respectively.
It is observed that the EA, GA, and ν values of each mPCA sample are affected by its building scanning speed (ps). For the three samples fabricated at ps = 800 mm/s, the average apparent Young's modulus is obtained EA = 318.82 ± 5.81 GPa, which is 1.57% and 3.38% lower compared with the samples fabricated at ps = 1000 and 1200 mm/s, respectively. Similarly, for the samples fabricated at ps = 800 mm/s, the average apparent shear modulus is GA = 79.81 ± 1.44 GPa, which is 2.88% and 3.75% lower compared with the samples fabricated at ps = 1000 and 1200 mm/s, respectively. Poisson's ratio (ν) of the samples fabricated at ps = 800 mm/s is 0.3329 ± 0.0080, which is 1.26% and 1.42% lower compared with the samples fabricated at ps = 1000 and 1200 mm/s, respectively.
These observations are consistent with Wang et al, 34 reporting that high laser scanning speed causes reduced grain size, leading to an increase in material elastic moduli as predicted by the Hall–Petch relation.
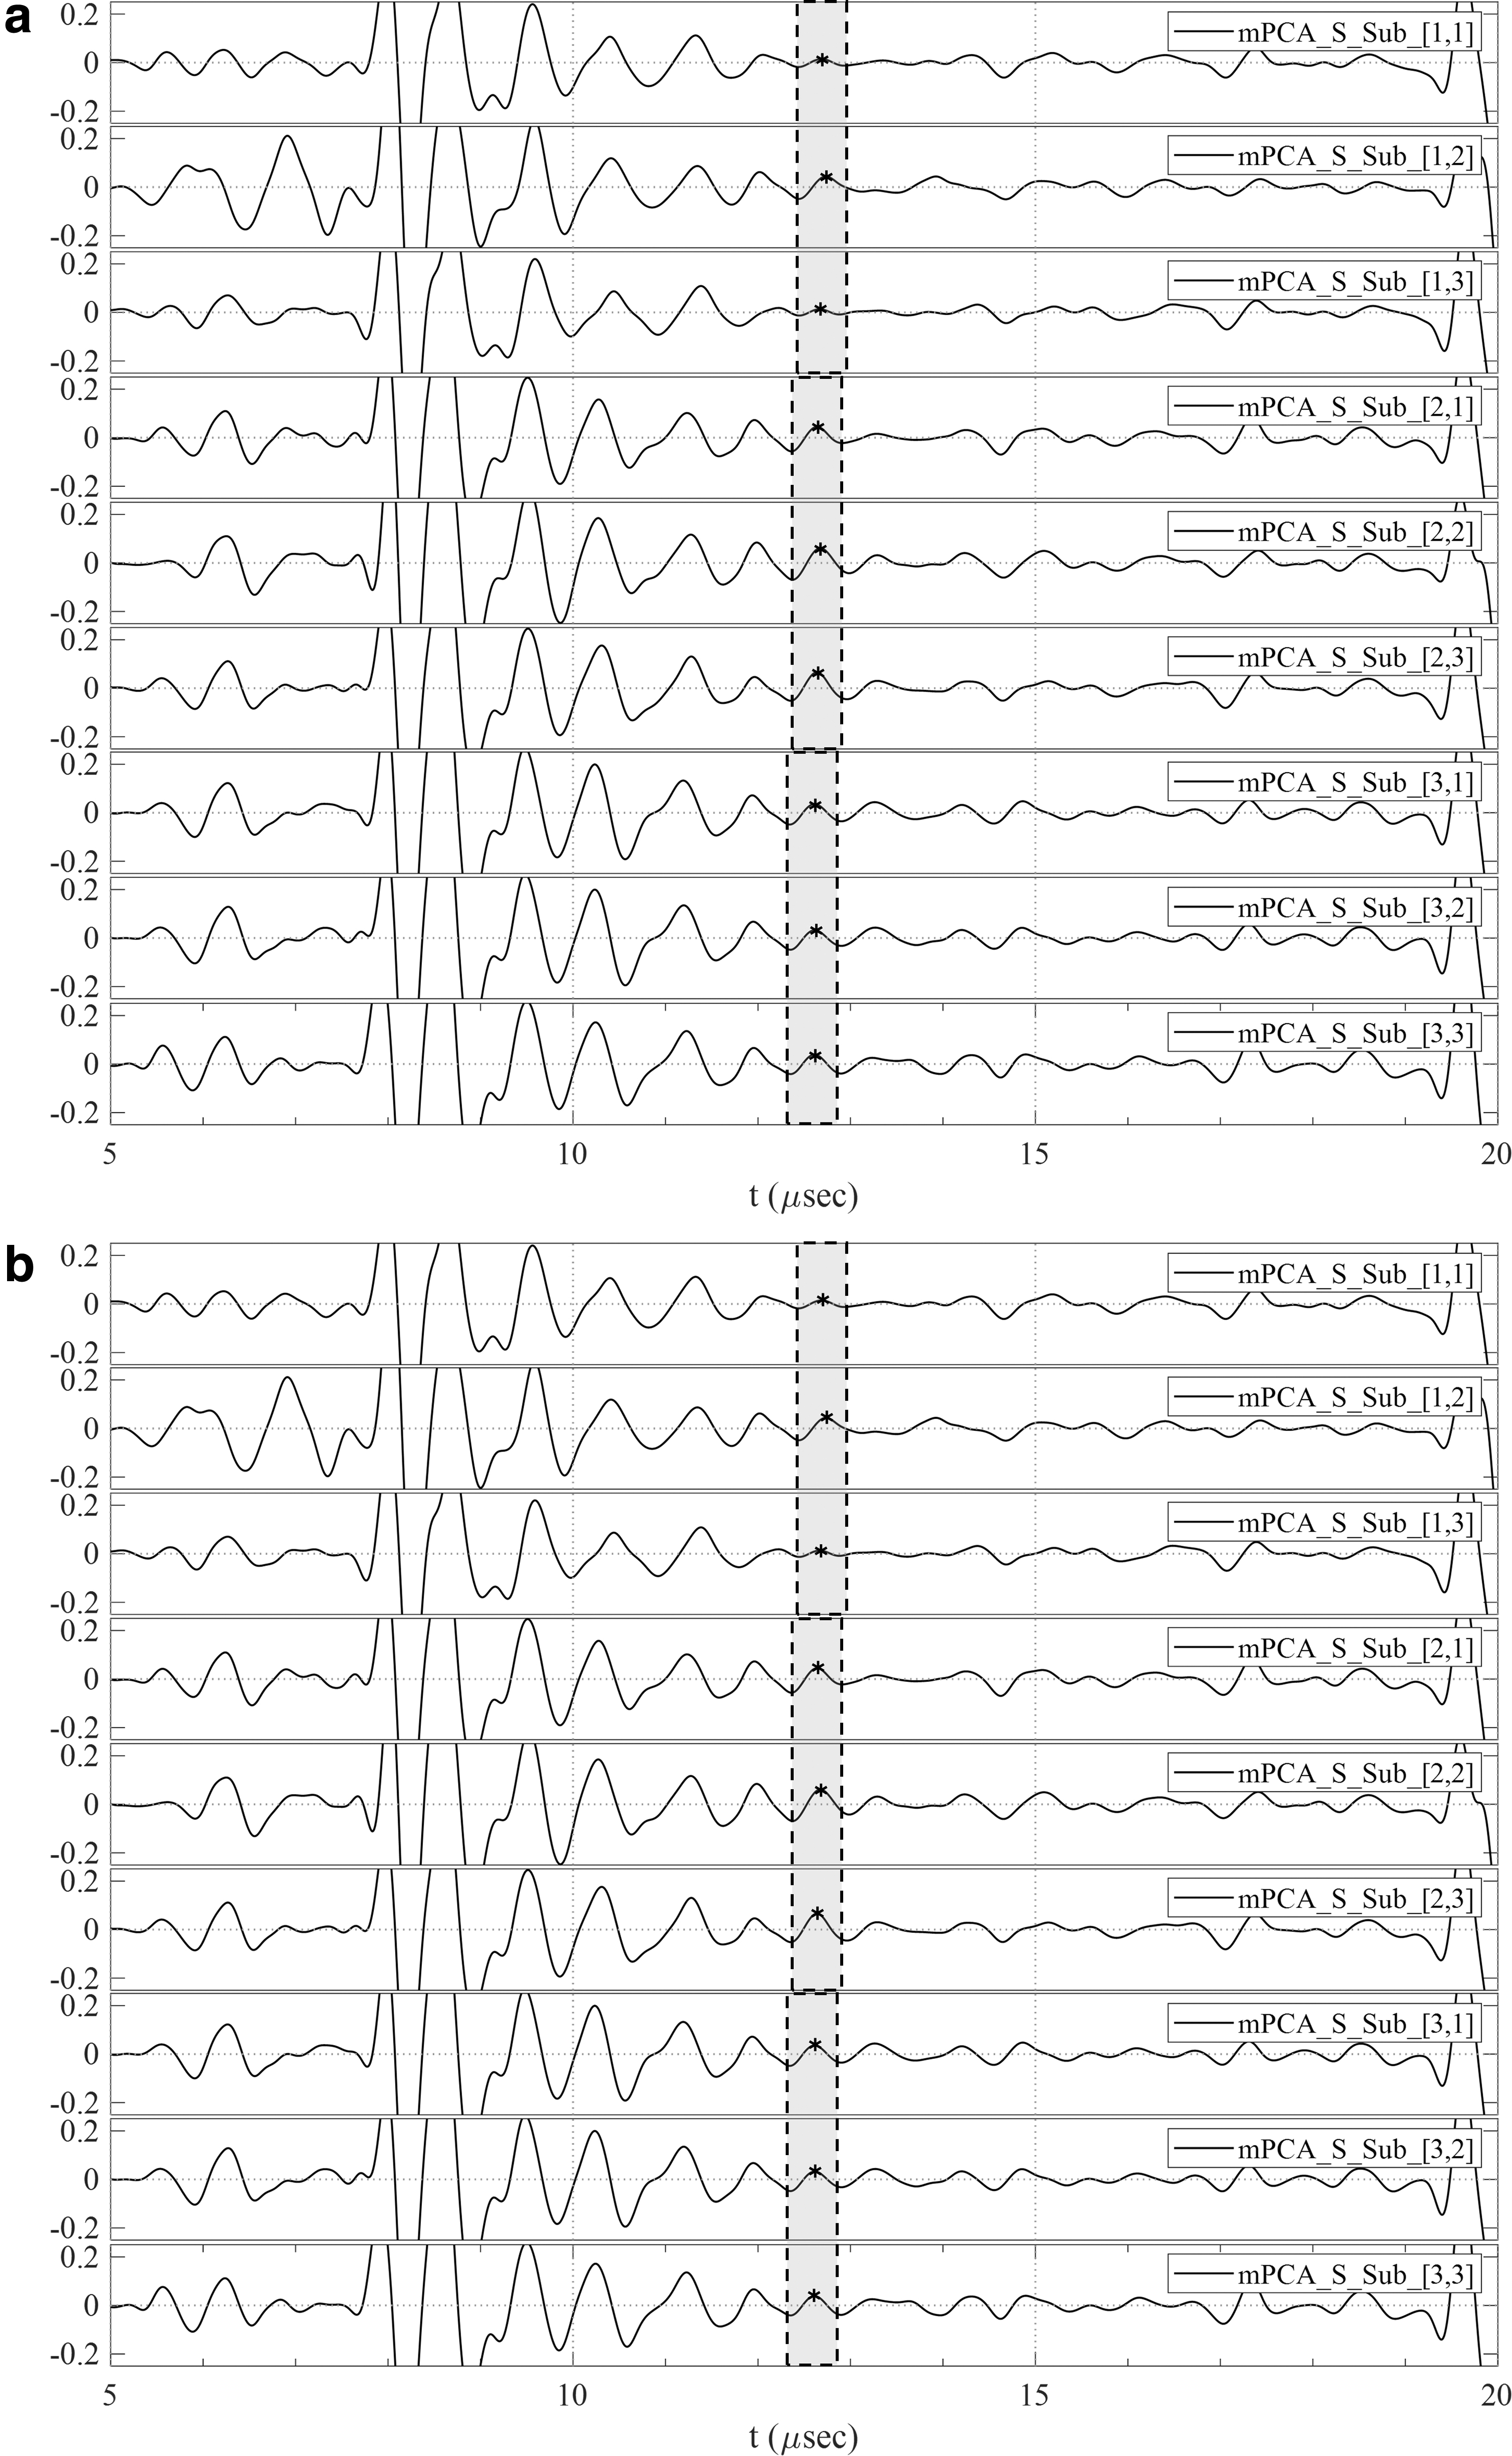
The subtracted waveforms for each sample (Fig. 3) are transformed into the spectral domain using the FFT algorithm, as shown in Figure 5 in the normalized scale, to analyze and evaluate the changes in its spectral characteristics as a function of the laser scanning speed (ps). The shifted peaks of the pressure (Fig. 5a) and shear (Fig. 5b) spectral responses are identified and marked as P1 to P3 and S1 to S3, respectively. It is observed that the peaks are sensitive to the scanning speed (ps), and the peak frequencies decrease as the scanning speed increases (Fig. 6). Although the changes seem small (Fig. 5) with the visual observation in the MHz scale, we can measure and quantify them.

The pressure
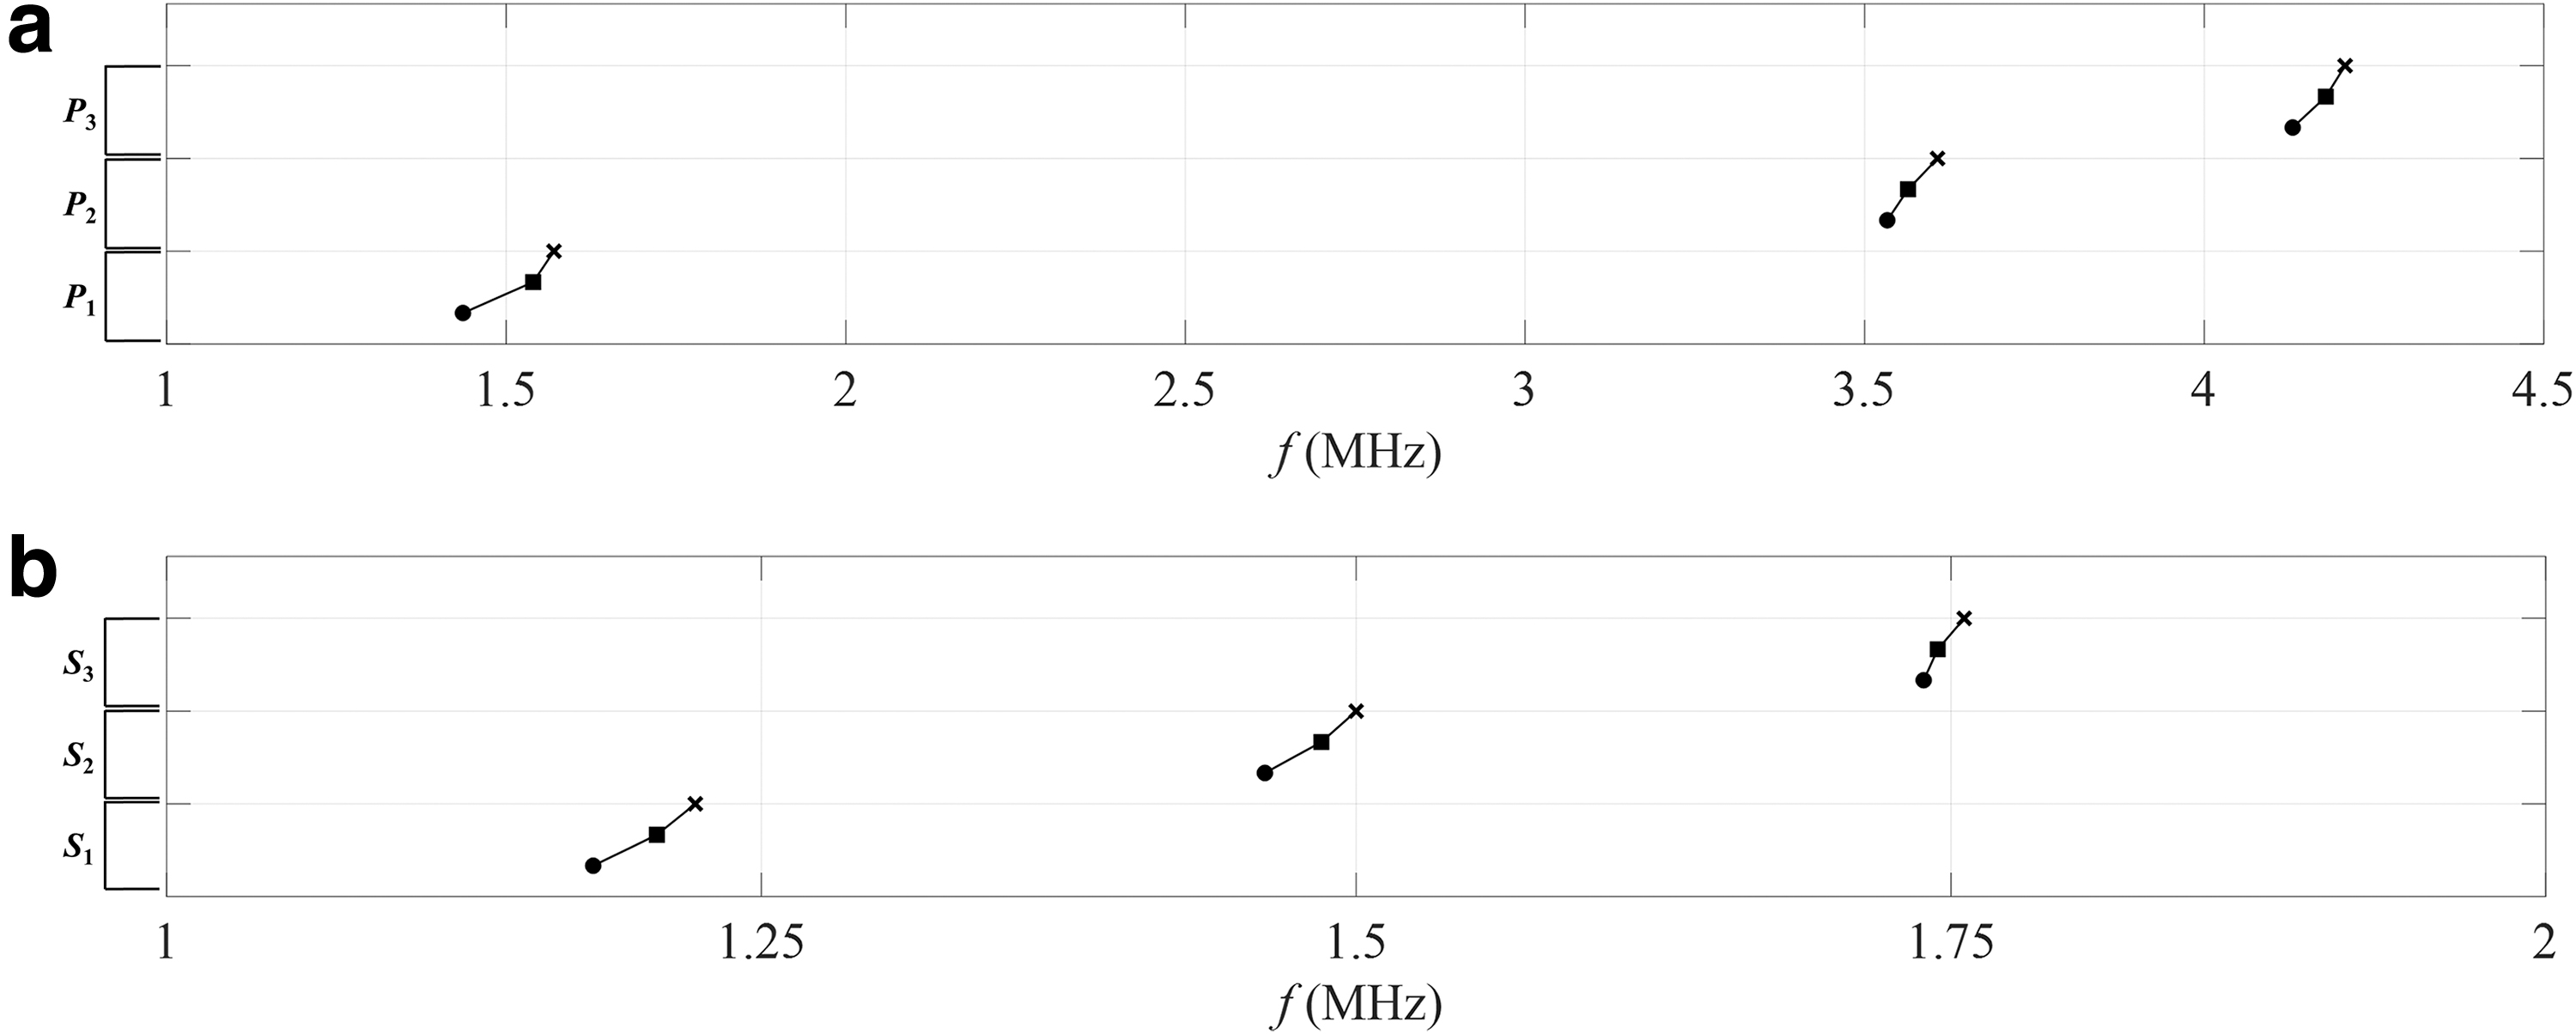
Average frequency shifts of the spectral response peaks (P1 to P3) of the mPCA sample sets at three scanning speeds (ps = 800 [●], 1000 [■], and 1200 [ ×
The peaks P1, P2, and P3 shift to the left by 7.20%, 0.87%, and 0.97%, respectively, from the scanning speed ps = 800–1000 mm/s, and 9.33%, 2.10%, and 1.69%, respectively, from ps = 1000 to 1200 mm/s (Fig. 6a). Similarly, the peaks S1, S2, and S3 monotonically shift to the left by 2.27%, 1.62%, and, 0.34%, respectively, from scanning speed ps = 800–1000 mm/s, and 3.64%, 2.63%, and 0.98%, respectively, from ps = 1000 to 1200 mm/s (Fig. 6b). Hence, the peaks observed at lower frequencies (P1 and S1) are more sensitive to the laser scanning speed (ps) than those observed at higher frequencies (P3 and S3) of the spectral responses for both pressure and shear waveforms.
The extracted mechanical properties and the frequency shifts change monotonically with the changing laser scanning (printing) speed. This consistent directionality in variations indicates that the proposed monitoring parameters are good candidates for the implementation of a monitoring strategy. As the control system of an ultrasonic in situ real-time monitoring system can extract these parameters from PCAs without affecting the process parameter of actual builds on the fly, the proposed approach has the potential to be used in a quality control program.
Conclusions and Remarks
AM/3DP offers a flexible fabrication modality to manufacture a complex build directly from its digital design representation. However, severe shortcomings of the AM/3DP processes related to the build quality and process repeatability are frequently reported in the literature. As a result, an unfulfilled need for an effective real-time quality monitoring system exists. The effects of various process parameters, such as laser scanning speed in SLM, must be acquired and utilized in the closed-loop control unit of a printer as input. In the reported work, as a model problem, the sensitivity of the spectral properties of 3D-printed mPCA samples to the printing (laser scanning) speed is evaluated and demonstrated using an ultrasonic NDE technique.
Because of the periodicity in its internal structures, a PCA causes its traveling ultrasonic wave pulses to disperse, leading to the formation of the PBs and SBs in its spectral response, which are sensitive to the variations in its process and material parameters. The role of a PCA in AM/3DP is similar to that of a witness coupon since it is printed alongside a build. However, in the proposed framework, the PCA is interrogated and monitored with ultrasound during processing in real time. For powder-based AM/3DP techniques, the reported relationship between the scanning speed and the mechanical and spectral features of mPCAs is among the critical parameters for the development of a monitoring strategy.
In a practical in situ monitoring system based on the proposed approach, this relationship as well as the sensitivities of these mPCA features to other process parameters (e.g., laser power and bed temperature) can be explored in real time and quantified without affecting the build properties in a systematic manner.
In the reported experiments, it is experimentally evaluated and quantified that the laser scanning speed (ps), as one of the significant process parameters, has a strong relationship with the mechanical and spectral properties of the mPCAs. It is observed that the apparent Young's modulus (EA), shear modulus (GA), and Poisson's ratio (ν) were modulated by the increase of the laser scanning speed (ps). With a 50% increase in the scanning speed (ps), the average apparent Young's (EA) moduli and shear (GA) moduli, and Poisson's ratio (ν) increased by about 5.97%, 3.75%, and 1.42%, respectively. Moreover, the unidirectional shifting of the frequency peaks in the spectral responses of the pressure and shear waveforms demonstrates their sensitivity to laser scanning speed.
It is obtained that the peaks P1, P2, and P3 are shifted by 9.33%, 2.10%, and 1.69% in the spectral responses of the pressure waveforms, and peaks S1, S2, and S3 are shifted by 3.64%, 2.63%, and 0.98% in the shear spectral responses with a 50% increase of the scanning speed (ps). The peaks at lower frequencies in the bandwidth are more sensitive to the laser scanning speed than those at higher frequencies for both pressure and shear waveforms. These frequency shifts are easily measurable. The corresponding changes in the mechanical properties due to the scanning speed and other process parameter variations can be utilized in a closed-loop control system.
The current study focuses on metallic powder-based AM with SLM. However, the applicability of the proposed in situ real-time framework with PCAs is broad and could apply to various other AM/3DP modalities and materials for quality monitoring objectives. Process optimization is outside the scope of our current study; however, it is noteworthy that in situ real-time monitoring of build materials in AM/3DP is critical for achieving stable and sound process optimization, as the presented ultrasonic monitoring framework provides a means to monitor and interrogate the effects of process parameters on the build mechanical properties in a noninvasive manner to take continuous or disruptive corrective actions.
Footnotes
Authors' Contributions
E.H.R.: Formal analysis, investigation, visualization, and writing—review and editing. T.S.: Formal analysis, investigation, visualization, and writing—review and editing. H.T.: Resources, formal analysis, investigation, and writing—review and editing. C.C.: Conceptualization, methodology, data curation, writing—original draft, funding acquisition, project administration, and supervision.
Author Disclosure Statement
The authors disclose no conflict of interest.
Funding Information
The authors acknowledge funding from New York State Energy Research and Development Authority (NYSERDA) (Award No. 133598) for the reported experimental study.