
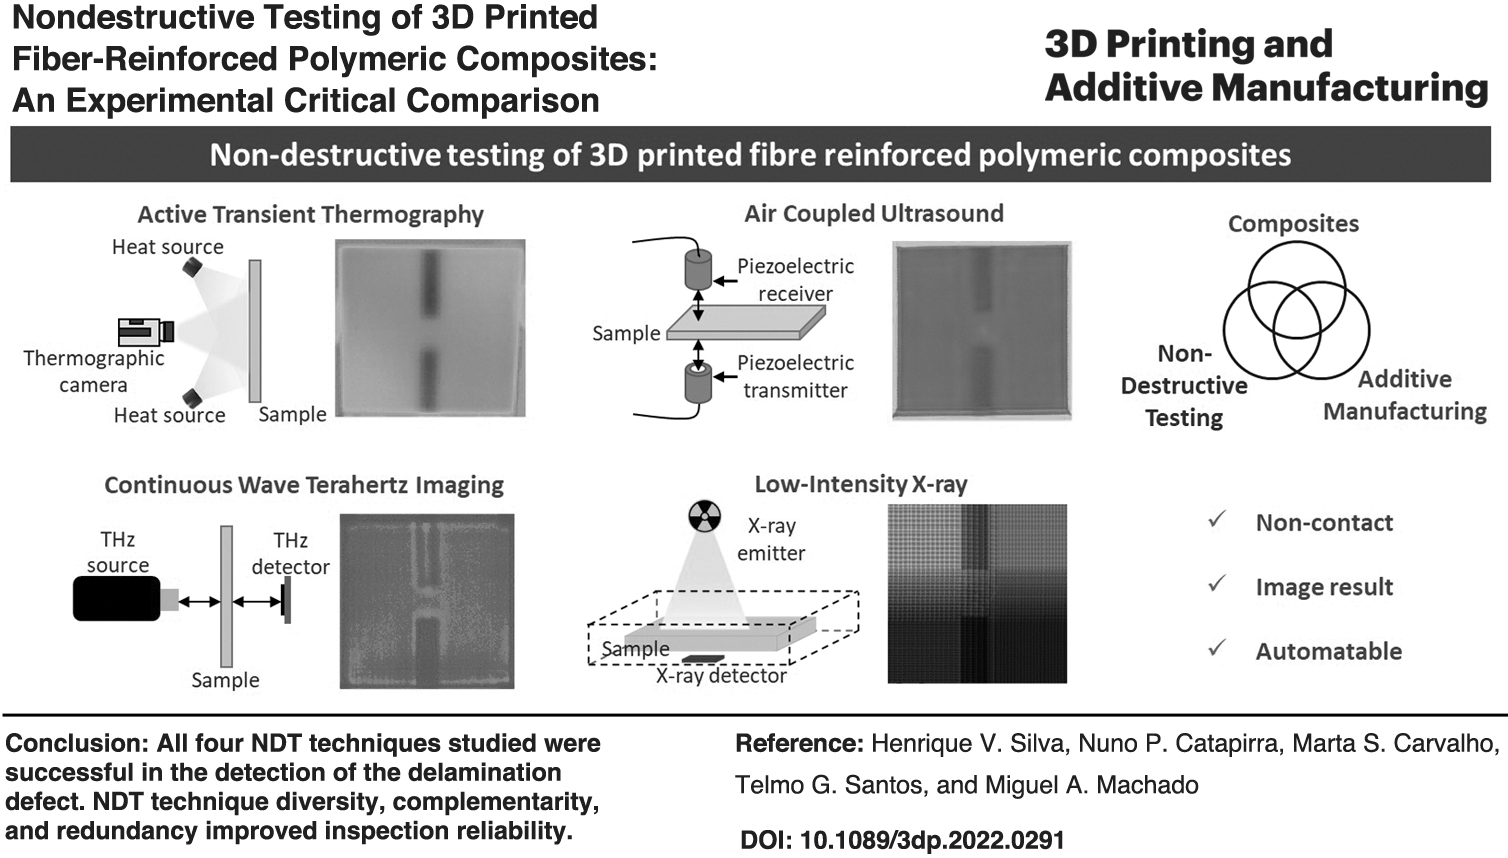
Abstract
Polymer matrix composite (PMC) materials produced by additive manufacturing are a promising solution with several applications in industry. The presence of defects due to fabrication could undermine the performance of the component structure. PMC performance has been extensively studied using destructive tests, but reliable nondestructive testing (NDT) techniques are essential. In this study, PMC with unidirectional fibers were 3D printed with an adapted conventional fused filament fabrication printer. The matrix material was polylactic acid, and three different reinforcement fibers were used: Kevlar®, carbon, and glass fibers. The samples were 3D printed with artificial defects, to simulate delamination's 0.5 mm thick. Four NDT techniques were explored, benchmarking the inspection of PMC envisaging an automated noncontact imaging inspection for easier result interpretation. Active pulse thermography, air-coupled ultrasounds, continuous wave terahertz, and digital X-ray were the techniques chosen, and a critical comparison is presented, evaluating the performance of each technique in the detection of defects. NDT technique diversity, complementarity, and redundancy improve inspection reliability, as there is not a single inspection technique that can cover all material defects or characteristics.
Introduction
Mass customization, waste minimization, the ability to generate components with a complex shape, and their rapid construction are the main benefits of additive manufacturing (AM). Of all the different AM technologies, fused filament fabrication (FFF), or to use the trade name, Fused Deposition Modeling (FDM®), is the most widely used in polymer AM owing to the process simplicity. There is no need for special tools and it has the ability to be reinforced in different ways1,2 allowing the production of polymer matrix composites (PMCs). In particular, continuous fiber reinforcement shows promising results with a variety of mechanical tests, demonstrating the importance of process parameters and ensuring that it complements other manufacturing techniques for these materials.1,3–6
PMCs present an added challenge when produced by AM due to the diversity of defect that may occur, which may directly affect the structure performance. 7 Due to its high specific strength (strength per weight), there is an increasing use of PMCs. Therefore, there is an urgent need to ensure a high level of quality control and that the appropriate response of products and services remains as intended over extended periods. Its application is present in several industries, including aerospace,8,9 construction,10,11 and electronics. 12 The development of new materials has driven the expansion of its use in other areas, reducing costs and increasing the useful life and safety of components.13–15
There are several techniques for producing long fiber-reinforced polymer matrix parts. Although they have the same goal and produce similar results, they differ in the way the fiber and the matrix are joined; in their ability to produce more complex specimens; and even in fiber preprocessing. The double extrusion has two extrusion nozzles that can be mounted on two independent extrusion heads or in only one. 16 The manufacture of the component may occur alternately and in different phases. Co-extrusion, when implemented, allows the continuous deposition of fiber and matrix layer by layer, like double extrusion, although it features only one extruder head and one extrusion nozzle.4–6,17,18
In this system, the dry fiber is typically pretreated through a process that wraps it in polymers compatible with the matrix of the part to be produced (e.g., polyvinyl acetate can be used with polylactic acid polylactic acid [PLA] filament), and then it is cured before being used for printing. 19 Chaudhry et al. proposed a different strategy based on a drilled extrusion nozzle with a 1 mm diameter opening, avoiding the direct passage of the fiber through the heating block. This opening was drilled at 45° to facilitate the passage of carbon fiber and to prevent the melted filament from leaking. This approach resulted in a higher printing efficiency, with simple monitoring and no disintegration of fibers. 20
Process parameters, materials characteristics, or even the computer-aided design files may result in defects. The presence of such heterogeneities can affect the component's performance, which is a major concern. Therefore, nondestructive testing (NDT) techniques play a key role in detecting and characterizing defects on the surface or within the interior of materials.21–23 A comprehensive understanding of applications of different methods, such as its physical principles, material composition, and defect characterization, or even access problems, is crucial for the correct application, efficiency, and accuracy of the inspection.24,25
In the literature, it is evident that there is a lack of studies around the inspection of 3D printing PMC with NDT techniques. Most of the testing done is mechanical.1,3–6,16,17,20,26 Siegel et al. 27 worked on the automated online inspection of polymer FFF with thermographic signal reconstruction; however, PMCs have not been tested yet. The technique identifies faults due to incidental environmental effects, equipment wear, and tool failures, and also malicious faults resulting from compromised firmware, geometry files, or G-code. As such, from the diversity of NDT methods available, for this study, the four most suited noncontact techniques in industry were selected: active transient thermography, air-coupled ultrasound, continuous wave terahertz imaging, and low-intensity X-ray, which share two important features: can be automated and produce an image that can be easily overlapped with the inspected component for easier interpretation of results.
Several studies have been carried out in the inspection of PMC using Thermography, especially on laminated composites.8,27–32 Active Transient Thermography is used to measure or map surface temperatures based on the infrared radiation emitted by a body as heat flows to or from it. 33 The heat emanating from the surface of a body is affected by its internal defects, which will cause different temperature gradients on the surface over time by changing the thermal properties of the material, allowing its detection using a thermographic camera. 34
As for defect depth characterization, Kalyanavalli et al. 35 and Sun 36 refer in their work the existence of a direct proportionality between the instant of maximum thermal contrast and the square of the defect depth, in reflection mode. Other studies as Manohar et al.,37,38 Peeters et al.. 39 and Kalyanavalli et al. 40 aboard this important problem of defect depth estimation with different numerical and non-numerical models.
The air-coupled ultrasound NDT technique, also known as contactless ultrasound, investigates materials by studying the propagation of ultrasonic waves, 41 and it is highly efficient in the inspection of laminated structures during quality control of delaminated areas, because of the ability to concentrate ultrasonic waves in small regions. 42
The frequencies used, from 50 to 400 kHz, are usually lower than the conventional contact ultrasounds owing to the high acoustic attenuation of air. Owing to the very different acoustic impedance between the air and the solid material, this technique is mostly limited for low-density materials, such as polymers and PMC. Previous works have shown that air-coupled ultrasounds allow the detection of delaminations in polymer parts produced by FFF with a good spatial resolution. 43 The contactless operation facilitates the automation of the inspection process. Two piezoelectric transducers are usually employed, operating in transmission mode, which requires access to both sides of the part being inspected.
Radiographic testing exposes a test sample to penetrating gamma or X-ray radiation so that part of the radiation is absorbed or scattered and part of it is transmitted (captured by a digital detector or photographic film).21,44 The presence of discontinuities in materials may change its attenuation, which causes a change in the radiation absorbed along with the density and composition of each area. The attenuation of the signal that passed through the sample results in a two-dimensional gray shadowgraph. While the process itself has not evolved over the years, new technology developments allowed an inspection with higher quality images, safety, versatility, and portable equipment.45–48
In the scope of additive manufactured composite inspection, computed tomography X-ray has been used for void detection and fiber distribution in carbon fiber/polyamide and polyamide plies 49 and carbon-fiber/polyether ether ketone (PEEK) composites. 50 Surface characterization has also been studied for direct FFF 3D printing of PEEK/hydroxyapatite composites, which allowed to demonstrate that FFF can deliver bioactive hydroxyapatite on the surface of PEEK biocomposites in a one-step 3D printing process. 51
The inspection with Terahertz radiation has been evolving in recent years since the technological limitation in generating theses waves has been overcome. 52 This technique uses the electromagnetic radiation comprised between the frequencies of 0.1 and 10 THz, and unlike X-rays, do not have any ionizing effect and are generally considered biologically innocuous. Continuous wave THz imaging has proved capable of detecting delamination defects in polymers and water infiltration as the humidity absorbs THz radiation. However, metals or conductive materials reflect the THz radiation. 53 Studies have been reported for the inspection of polymer parts as PLA, 53 PEEK, and polyamide 12 (Nylon), however, have been targeting sizing, surface, and volume rendering to be compared with targeted dimensions. 54 The terahertz imaging is an alternate and complementary technique to the well-known X-ray tomography, which is costly for routine controls and unsafe to the operator.
This study presents a noncontact NDT multicriteria comparison for the inspection of PMC to bridge the research gaps in these fields and contributes to its application in industry. Samples were produced with a PLA matrix and with three different reinforcement fiber materials: Kevlar®, carbon, and glass fibers. The NDT techniques explored envisage an automatable noncontact imaging inspection for easier and faster interpretation of results.
Materials and Methods
Materials
The composite test specimens were produced with PLA matrices. The PLA feed filament had a diameter of 1.75 mm, and it is recommended to use it with the nozzle at a temperature between 200°C and 230°C and the printing platform heated between 50°C and 60°C. 55 Three types of long fibers were used as reinforcement: Carbon, Glass, and Kevlar, all commercialized by Markforged®. All fibers have a 0.4 × 0.35 mm rectangular cross-section.
The fact that in long fibers the crystals of their structure are aligned with their axis gives them greater stiffness and resistance than it would in block form, as well as fewer internal defects. It should be noted that more than the values of properties mentioned are the ratios
Mechanical and Thermal Properties of Reinforcement Fibers and Polylactic Acid Matrix
PLA, polylactic acid.
Sample production
Samples with artificial defects were produced using a BLOCKS ONE 3D printer, with a brass nozzle through an original extrusion diameter of 1 mm. As depicted in Figure 1, a 1 mm hole in the nozzle was drilled at 45°, to allow simultaneous extrusion of the filament with the fiber.

Polymer matrix composite 3D printing strategy;
The samples have a square surface with 120 mm sides and 5.5 mm thickness (Supplementary Material). Two rectangular delaminations of size 12 × 50 × 0.5 mm centered on the Y-axis (the largest side of the defect oriented with the fiber direction) were artificially introduced as shown in Figure 2. One defect is located at the half-thickness and the other at 1.38 mm from the top surface of the last deposited layer.

Technical drawing of produced samples with the artificial defects simulating delaminations;
The defects were created during the printing by laying Teflon between the third/fourth and the fourth/fifth layers, this being easily removed after cooling the specimen, due to its low friction coefficient. 57 These defects are intended to mimic delaminations, but its production, with repeatability, is not easy. The used approach allows repeatability of the morphology of defects to keep the comparison condition valid. In fact, the thickness of defects is higher than the typical real delamination. However, the main purpose is to compare the reliability of different NDT techniques, under the same conditions.
Four samples were produced in these conditions. Three samples with different fibers as reinforcement: a carbon fiber-reinforced polymer (CFRP) sample; a Kevlar fiber-reinforced polymer (KFRP) sample; and a glass fiber-reinforced polymer (GFRP) sample. For comparison purposes, an additional sample was produced with no reinforcement fiber (PLA only), which will be denominated fiberless sample (FS).
The arrangement of two defects relative to the available area of the specimen allows uniformity of the heat flux imposed during the NDT between the ends of the specimen and the edges of the defect. For thermography inspection purposes, the specimen was rotated 180°, around the Y-axis, converting the outer defect into an inner type one. The following nomenclature was adopted for the three types of defects: outer, middle, and inner type defects, as shown in Figure 2. This defect arrangement was planned mainly for Thermography.
Per layer, there are 11.16 m of unidirectionally oriented fiber in a total of 44.64 m, resulting in a fiber volume fraction of 9.4%. The cross-section of different composites manufactured is shown in Figure 3, where the fiber and matrix are distinguished.

Specimen's cross-section with
The transversal section presented in Figure 3, shows that fiber cross-section shape suffered some modifications, acquiring different shapes from region to region. This happens because the fiber bundle is also composed of a binder resin that partially melts when crossing the interior of the nozzle and joins the PLA (both at a high temperature). From a general perspective, defect width was increased 42% and height was reduced 30%. The variation on size and small declination in cross-section is attributed to factors difficult to control. When the extrusion block changes its direction, the fiber being pulled from the nozzle hole adapts to this new direction. Even when the fiber is coming from the material reel, some torsion can be added. Despite the distortions verified, generally, the rectangular shape is present.
Experimental setup
Active transient thermography
The active transient thermography experimental setup was carried out in reflection and transmission mode and consists of a specimen, a heat source, and an infrared camera. The surface of the specimen was uniformly heated by four 175 W lamps, placed perpendicularly, and distanced 500 mm from it, for 20 s. The data acquisition of the thermal response was performed with a Fluke Ti400 infrared camera with a thermal sensitivity noise equivalent temperature difference of less than 0.05°C (50 mK) operating at an infrared spectral band between 7.5 and 14 μm. The temperature measurement ranges from −20°C to +1200°C with an accuracy of 2%.
The instantaneous field of view or spatial resolution is 1.31 mRad. All these components were placed in a robust aluminum structure. Each experiment was recorded for 2 min at a frame rate of 9 Hz. The specimen was set to cool for 40 min before repeating the experiment. The software SmartView® was used to analyze the thermographic information. This software creates, for each video frame, a text file with the temperature value information of three independent zones for each defect in specific regions to mitigate borders' temperature effects. The defect contrast was obtained subtracting the average temperature value from the defect area by the average temperature value of the two adjacent nondefective areas (these areas can be seen in the Supplementary Material).
Air-coupled ultrasound
The equipment used for the air-coupled tests was a DIO 1000 LF Flaw Detector from Starmans™. A transmission mode was employed using two piezoelectric probes operating in pulses of 200 kHz wave packets and both the attenuation and time of flight could be measured. Unlike the thermography technique, to obtain an image as a result, a C-scan must be performed. This requires a scanner to move the probes along the area of samples. An XYZ table with double Y-axis was used to allow the synchronous movement of both probes (no relative movement between them) along the horizontal plane X0Y. A resolution of 0.1 mm was used in the X direction and 0.5 mm for the Y direction. The 11 mm diameter piezoelectric probes were placed on opposite sides of the sample and the distance between each probe and the sample closer surface was 40 mm.
Continuous wave terahertz imaging
The continuous wave terahertz imaging was performed in transmission mode with a transmitter and a detector, both from TeraSense™. The transmitter used was 0.1 THz with 80 mW, corresponding to a wavelength of 3 mm in air. A terahertz detector was used with a response of 10 V/W of incident power. The detection area is a 7 × 7 mm single pixel square with a response time of 1 μs. As for the inspection setup, the same scanner employed in the ultrasound tests was used with the same scanning resolution.
Low-intensity digital X-ray
The inspection was performed using a Kodak 2100 digital X-ray System with a 60 kV tube voltage and 7 mA current. A detector with a 22 × 30 mm area and 32-bit grayscale with a spatial resolution of 30 μm was used. The exposure time was 63 ms and to reduce the health hazard of X-ray exposure, a 30 × 30 × 10 cm X-ray lead shielding device was used.
Figure 4 presents the schematic representation of the experimental setup used for the NDT. And pictures of setups can be seen in the Supplementary Material.

Experimental setup for the nondestructive testing;
Results and Discussion
Active transient thermography
Figure 5 depicts the thermograms for the selected time, which corresponds to the maximum contrast time for middle type defect, all defects being visible in every sample. When analyzing the different experiments, it was concluded that the maximum thermal contrasts for the defects appeared over time in the following order: outer type, middle type, and inner type. However, the thermal contrast values decreased in the same order. It was also observed that outer type and middle type defects are very similar because the former already had time for the temperature to decrease following the peak temperature.
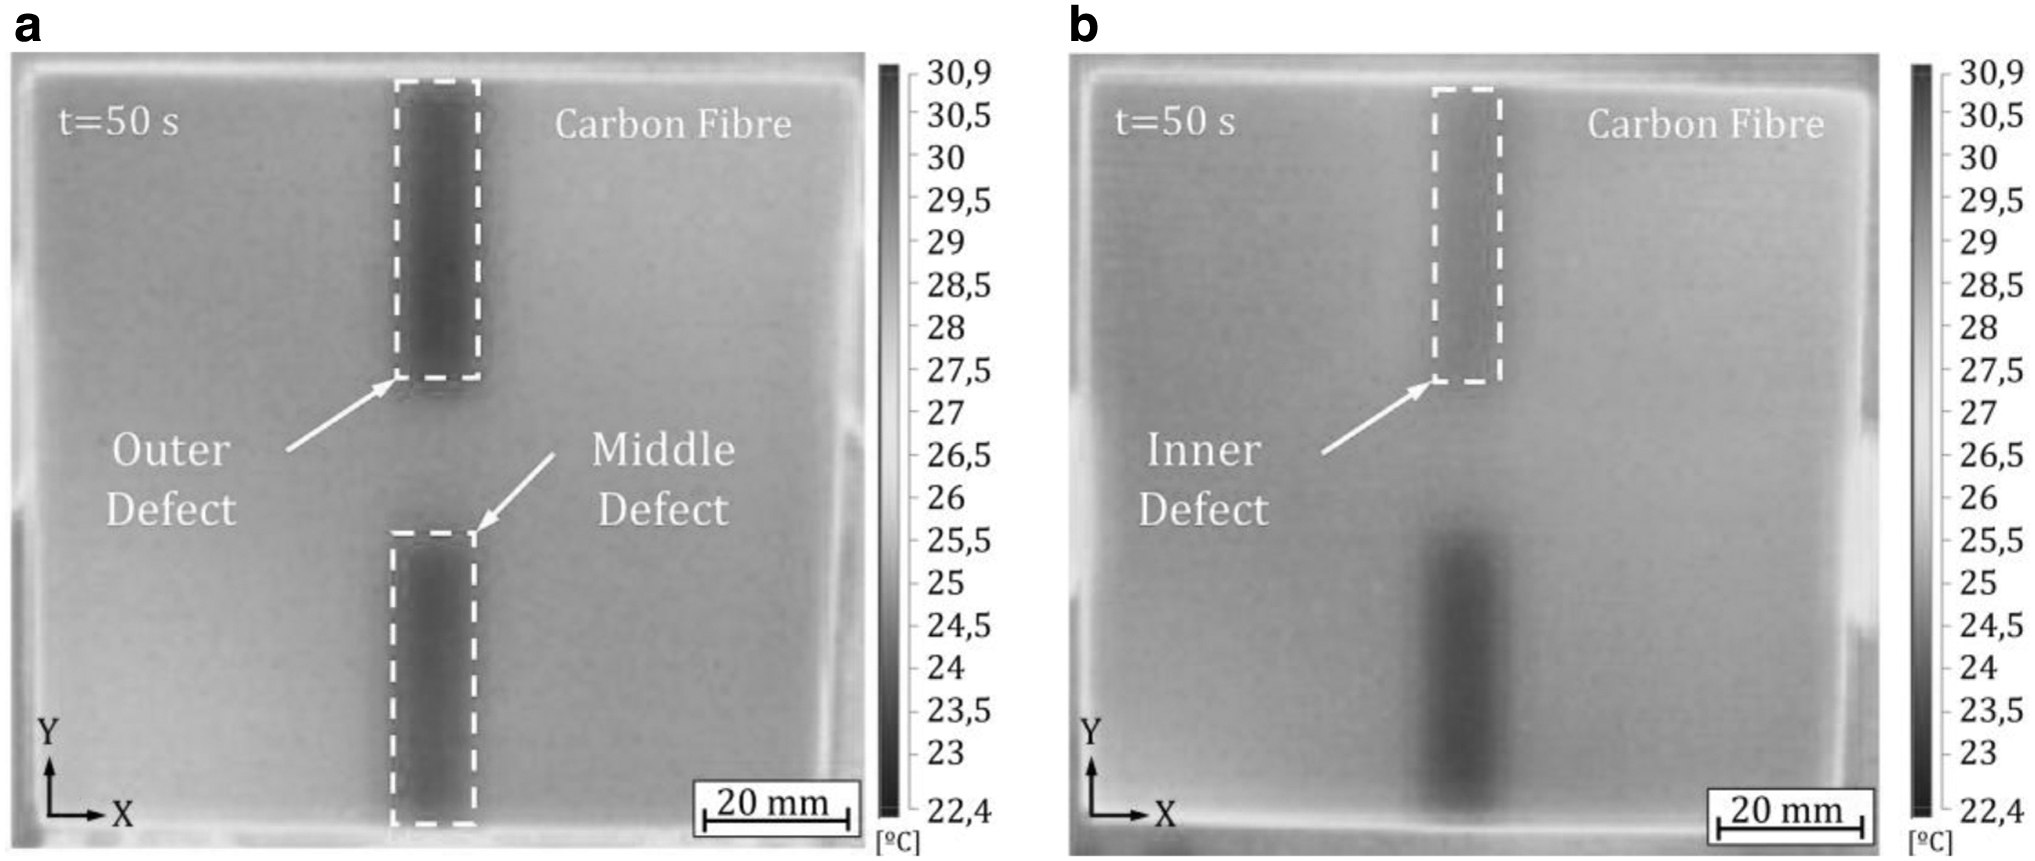
Heated surface thermograms in reflection mode for
Also visible in Figure 5 is nonuniform heating in the regions without defects, probably due to the printing platform of the 3D printer not being exactly leveled or the heating lamps not being at equal distance from the sample. It is also noted that the size of detected delaminations is very close to the real dimensions of the Teflon inserts.
It is possible to distinguish different defect depths by examining the area above the defects. In reflection mode, the map temperature performed by the thermographic camera corresponds to the heat flow reflected at the interfaces of internal heterogeneities. For this reason, a defect closer to the heated surface will be detected sooner since the heat flow (emission and return) has a shorter distance relative to any deeper defect. For this reason, there is less heat dissipation in the composite and there is a greater return of heat to the heated surface, causing it to heat up more intensely and showing, consequently, a greater thermal contrast.
The 4 manufactured samples, each with 3 types of defects for investigation, resulted in 12 scenarios for experimental testing. For each scenario, a set of six experiments was carried out. In Figure 6, the average of maximum thermal contrasts for each test set is illustrated, these values being summarized in Table 2.

Relation between time and contrast for maximum thermal contrast in outer, middle, and inner defects.
Instants and Maximum Thermal Contrasts for Different Samples and Defects
CFRP, carbon fiber-reinforced polymer; FS, fiberless sample; GFRP, glass fiber-reinforced polymer; KFRP, Kevlar fiber-reinforced polymer.
The maximum thermal contrast obtained by the composites decreases in the following order for any type of defect: CFRP, GFRP, FRP, and KFRP. In the same order, the correspondent peak time increases, that is, occurs later, due to thermal properties of each fiber in relation to the FRP thermal properties. Note that Kevlar is the only reinforcement with a thermal conductivity lower than PLA, unlike CFRP and GFRP, which present conductivities higher than PLA.
In all samples, the maximum thermal contrast value duplicates from the middle to the surface defect. An increase of the same value from the outer to the middle defect is also evident. Also, it can be noticed that from outer to inner defect type, the difference between the thermal contrasts is more tenuous and the peak times more dispersed.
It is interesting to observe that from outer to middle defect, the range of results in peak time increases, while the opposite happens in the maximum thermal contrast. The presented data were obtained for samples with a 9.4% fiber volumetric fraction. However, it is expected that the value of thermal contrast becomes higher if the fiber volume increases due to faster conduction of heat resulting in larger temperature differences at the surface.
It was shown that specimens with CFRP and GFRP always resulted in higher thermal contrasts than FRP because their fibers have higher thermal conductivities than PLA, unlike Kevlar. This happens for any of the three defects.
Figure 7 depicts the time history of the thermal contrast for each sample. The thermal contrast was obtained from the thermographic video made, which monitors the temperature changes over time. Some temperature values were taken from the defect area and from the defect-free area. For each frame, the mean value of each area was subtracted, obtaining the temperature contrast for each moment in time. The shadowed area represents the range of experiments, and the solid lines the average of each set of experiments. It demonstrates the higher thermal contrast occurring earlier for defects closer to the heated surface. The earliest peak time was recorded for CFRP at 35 s with a contrast of 3.16°C for an outer defect. The later peak time was recorded for KFRP at 85 s with a contrast of 0.60°C for an inner defect.

Experimental temperature contrast time history for each sample according to the defect type:
The overall thermal conductivity of the composite will depend on the type of reinforcement used, owing to the way heat transfers between the different constituents. 36 An increase in the overall thermal conductivity of the material led to an increase in the maximum thermal contrast and to an earlier peak time. This occurred with the inclusion of continuous long carbon and glass fibers contributing to a general increase in the thermal conductivity of the material. The same does not happen for the specimen with Kevlar fiber, which had an exactly opposite effect when compared with the FS.
Air-coupled ultrasound
The air-coupled ultrasound results for the four samples are depicted in Figure 8. The results consist of C-scans showing the ultrasound (US) attenuation suffered. As observed, the reinforced fibers cannot be distinguished, as they are uniformly placed over the sample matrix forming a homogenous material at a macro scale, compared to the wavelength of the sound in 3D printed PLA, which is around 9.3 mm, 58 meaning that the ultrasounds will mainly diffract and not reflect on the reinforcement fiber, which has around 1 mm spacing. Although the fibers are indistinguishable, the delamination defects are clearly represented with either reinforcement fiber used, or where no reinforcement is used.
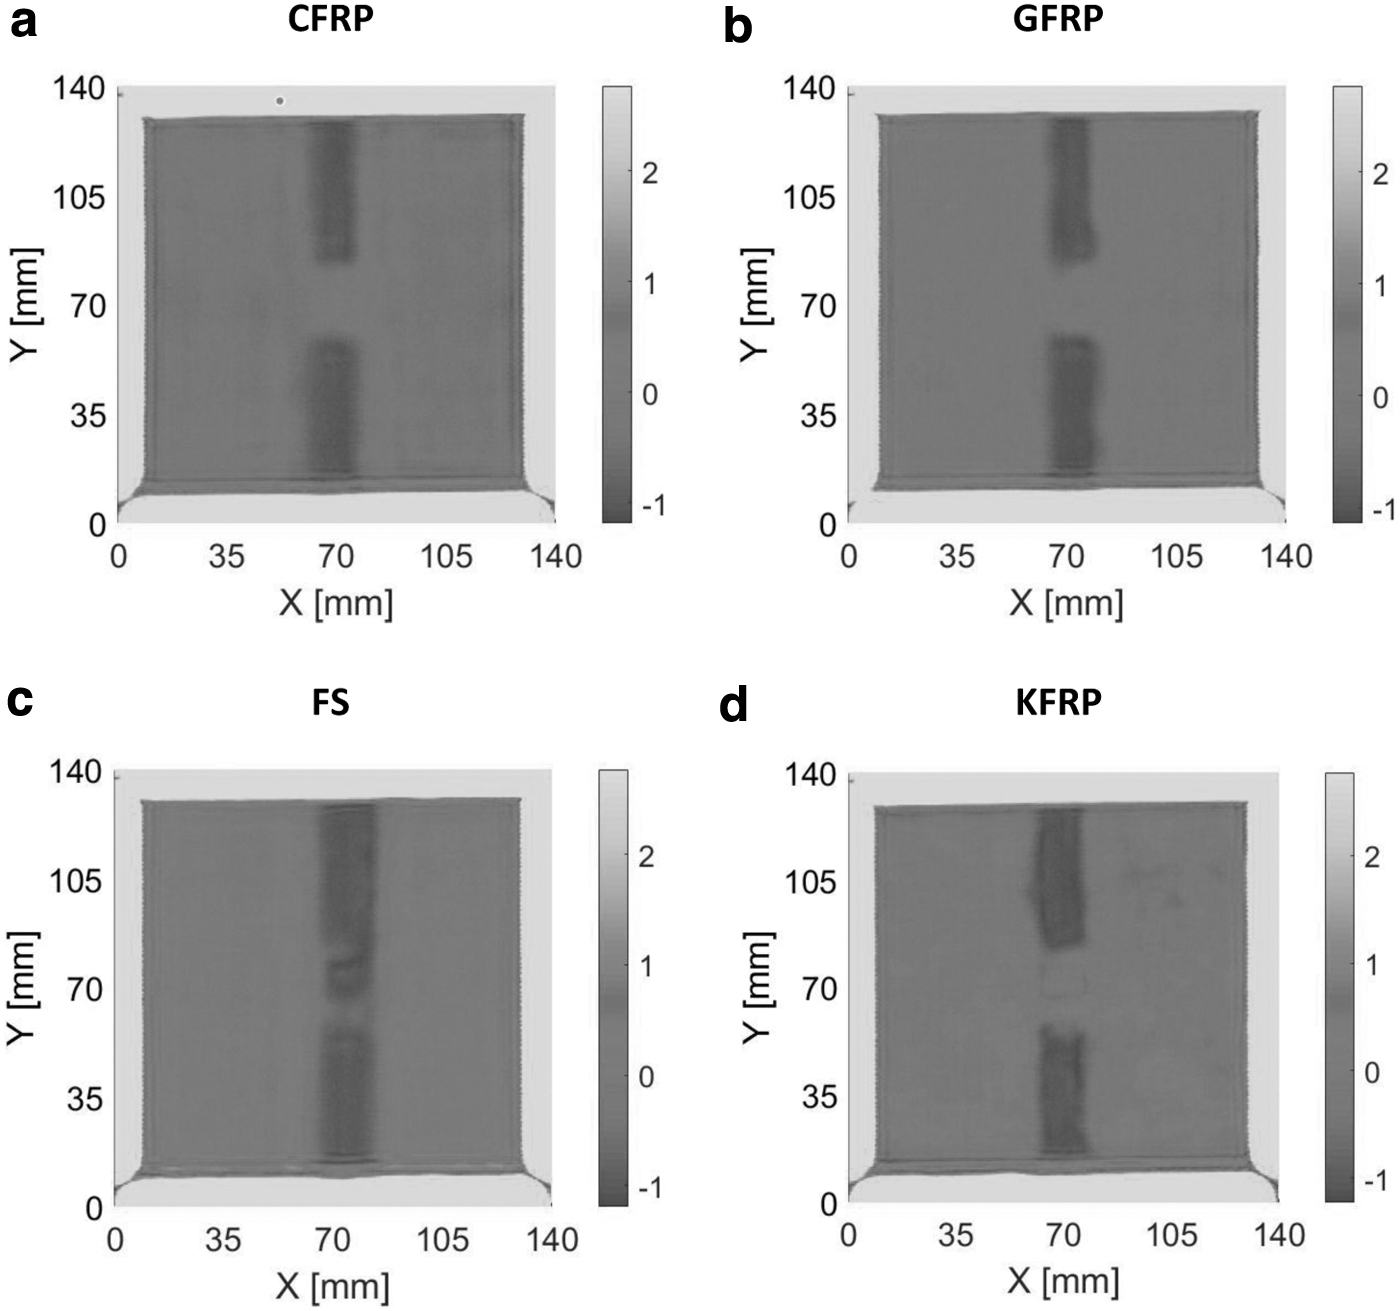
Images acquired from the air-coupled ultrasound C-scan showing the attenuation suffered;
Contrary to the thermography technique, air-coupled ultrasound does not distinguish defects at different depths. If the defects have the same thickness, as it happens, they will be equally represented even if they are at different depths, since what is being measured is the sound attenuation along the thickness of the sample. If the defect has the same thickness, the attenuation caused by the defect will be the same. However, the attenuation caused by the matrix will also be the same since it will also have the same thickness, although with different ratios (over and under the defect). The outer defect of the FS seems to be longer than it should be, which means that the adhesion of material in that zone was not adequate (Fig. 8c). This is also observed in the thermography results, although not as clearly.
In Figure 8d, the KFRP sample depicts a higher heterogeneity in the nondefective area, which is justified by the lower density of the reinforcement fiber, resulting in a smaller change of attenuation between the defective zone and the nondefective zone.
Continuous wave terahertz imaging
Figure 9 depicts a THz C-scan of the CFRP sample. It is possible to recognize the edges of the sample as well as the fasteners at each vertex. However, it is not possible to identify the delaminations, which is expected since carbon fibers are conductive and therefore reflect almost all THz radiation. This is a physical characteristic and a limitation of the inspection using THz: the radiation is almost all reflected under an electric conductor material, preventing its use in such CFRP parts.

Terahertz C-scan of the CFRP sample.
The THz results for the remaining nonconductive samples are shown in Figure 10. Due to the Fabry–Perot effect, 53 three different sample heights toward the THz source were used, with a spacing of 0.5 mm between each position to evaluate the response at different signal amplitudes. As seen in Figure 10b, d, and g, the two delamination defects are clearly represented with similar contrast, as it happens in the air-coupled ultrasounds, which could indicate similar defects and similar depths.

Terahertz C-scans done at different distances between the THz source and detector with the sample in mid distance:
However, taking advantage of the Fabry-Perot effect, using different positions in the Z direction allows one to observe that they are at different depths, as seen in the remaining images from Figure 10. THz testing allows one to differentiate the positioning of the defect in relation to one another, but not to measure this position or even to understand which is closer to the surface and which is further away from it. The same effect also shows that the specimen might be slightly inclined in relation to the horizontal inspection plane, since a gradient from bottom to top is clear, mainly in Figure 10a, f and g. As it happened with the other techniques, the THz testing also detected something in the FS between the two delamination defects, mainly in Figure 10d and f. It should be noted that in each sample vertex, the fastening is also noticeable.
Low-intensity digital X-ray
The results obtained by low-intensity digital X-ray are shown in Figure 11. The delamination defects were successfully detected in all four samples for both defect types. As it happens with the air-coupled ultrasounds, the X-ray testing is unable to discriminate between defects at different depths if their thickness is the same as it is based in the X-ray absorbed.
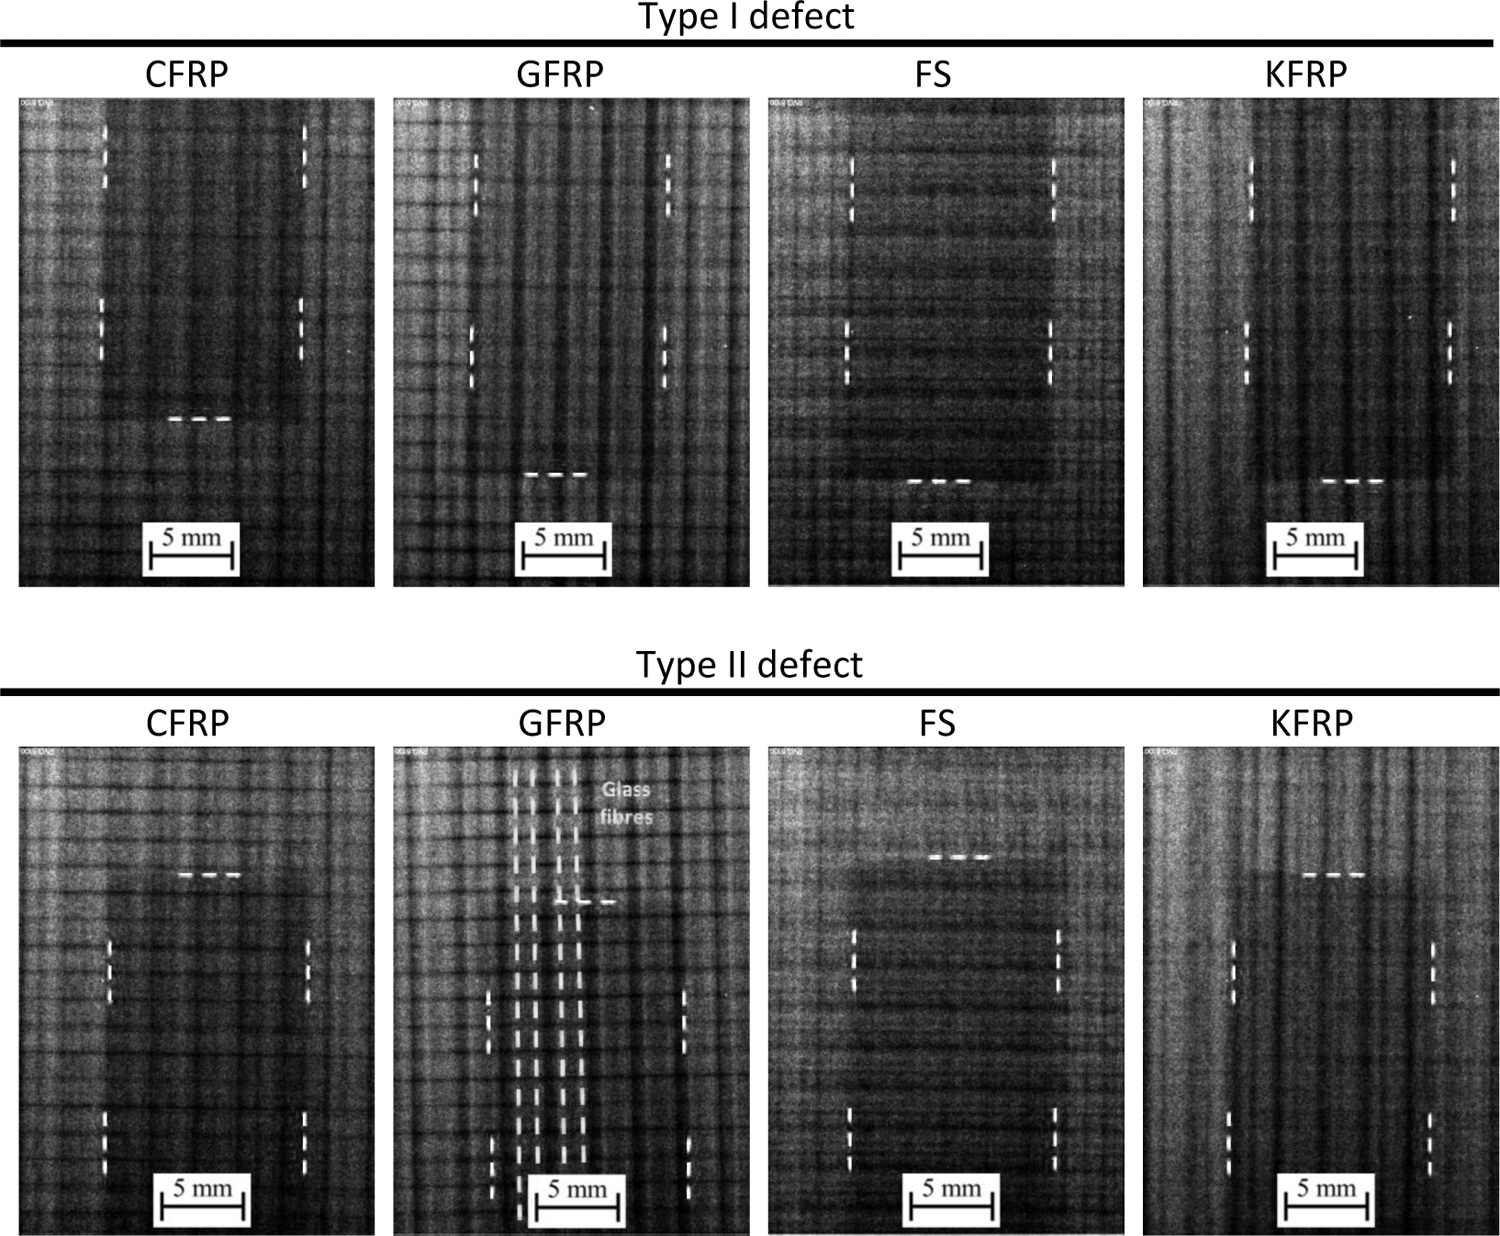
X-ray results obtained for each sample targeting each defect edge. The dotted lines represent the edges of the delamination defect in the X-ray result.
However, unlike the other techniques, the X-ray is also able to detect heterogeneities not caused by the delamination. It is sensitive to the layer's direction deposition and also to the reinforcing fibers, although not as clearly. All fibers are unidirectional and are arranged vertically (in relation to the X-ray results from Fig. 11), the glass fibers being the most easily identified. They are represented as lighter, and it is possible to see that they are grouped in pairs. For example, in the defect area, there are 4.5 pairs, that is, 9 fibers in each layer.
Critical comparison
All four NDT techniques studied in this work were able to detect the 0.5 mm thick delamination defect successfully. Although all four techniques meet the goal, each one has specificities that must be considered when a PMC needs to be inspected.
One very important aspect concerns the accessibility of the part to be inspected. Often, access to both sides of the component to be inspected is not possible, so it is not feasible to use methods that work in transmission mode. Thermography has a great advantage in this respect as it is the only technique explored in this study that requires access to only one surface. However, this is only true, considering thermography in reflection mode as employed in this work.
The size of the specimen is an important factor for its inspection. A large inspection area implies greater inspection times, in techniques like air-coupled ultrasound and terahertz Imaging, where the part area must be scanned (C-scan) and, depending on the resolution required, the increased time can be significant. For thermography inspections, the main limitation of the method concerns the infrared (IR) camera that needs to have a field of view that is large enough to capture the entire surface of the specimen. The field of view of the camera is limited by the lens and detector size, and the distance between the camera and the specimen. Thus, increasing the inspection area is not as detrimental to the test, but it is always necessary to ensure a uniform a heat application.
However, inspection areas can be critical; the points at which the temperature is obtained to calculate the maximum thermal contrast should be in a region where the defect and specimen borders do not affect them. An increase in specimen thickness can raise concerns about the technique's performance due to difficulties in energy flow: for the air-coupled ultrasound method, because the sound waves can be attenuated or absorbed by the material as they travel through it; and for Terahertz imaging, since the electromagnetic radiation in the terahertz range is absorbed by the material as it travels through it. The X-ray technique is more tolerant to this variation since the radiation can penetrate these materials with great efficiency.
Regarding the defects' characterization, and more specifically in relation to delamination-type defects, all four techniques manage to provide precise information regarding the defect geometry in the XY plane. THz technique, depending on the position of the sample, between the sensor and the transmitter, can lose spatial resolution due to the diffraction of borders.
As for thermography, the detection and resolution of the defect geometry are intrinsically linked to the distance from the defect to the surface to be inspected. The closer the defect is to the surface, the greater the temperature contrast, which improves resolution.
Defects further away from the inspection surface cause a lower contrast, which in turn causes a loss in resolution or even no defect detection at all. This may be seen as an advantage since comparing with another defect, it may show if the defect is deeper or not. THz testing can also differentiate defects at different depths, but cannot specify which defect is closer to the surface. As for the other techniques, they cannot determine if the defects are at the same depth of not. As for the defect thickness, neither technique can quantify this, but the reliability of tests will increase with the thickness since it is the most determinant parameter.
As for the reinforcement fiber material, there was no significant change in either technique apart from the thermography and the THz for carbon fiber composite, which, for being electrical conductor, reflected almost all THz radiation. The reinforcement material thermal conductivity in the thermography tests revealed a direct relationship with the maximum contrast's gains and peak times. The higher the thermal conductivity of the fiber, the higher was the contrast obtained and the faster it was reached. It is also worth noting that the contrast effect was prevalent when defects are closer to heated surfaces.
All techniques explored produced an image that can be overlapped with the component; however, for the THz and the US techniques, the results had to be plotted to form an image. On the other hand, inspection automation is possible for all the studied techniques, but the THZ and US techniques are easier to implement since it requires only a simple XYZ scanning table.
Concerning the inspection time, the techniques applied differ significantly. The X-ray inspection is the fastest, almost immediate, although safety measures must be taken and may increase the setup time. As for thermography, deeper defects take a longer time to obtain the highest contrast, but it usually happens in less than 1 min. The US and THz inspection require a scanning movement to produce an image result, so will depend on the speed of the scanning device. Nevertheless, the inspection time will be far superior to the other two techniques. In this specific work, they took 34 min.
Consumables are not required for any of the techniques being explored except for electricity. Therefore, the most significant cost difference between the techniques will be the cost of acquiring the NDT equipment.
Thermography can be used for greater inspection areas and in different locations as it only requires a thermographic camera and a heat source. Since only one surface is required, it can perform inspection in assembled components. The other techniques are mainly limited to laboratorial testing since it requires nonportable equipment such as XYZ scanning tables or X-ray machine (although the US and THz inspection equipment is portable). Table 3 summarizes the critical comparison of the studied NDT methods.
Value Proposition of Different Nondestructive Testing Methods for Additive Manufacturing Composite Inspection
 , True;
  , partially true or true with exceptions;
  , partially false or false with exceptions;
  , false.
ATT, active transient thermography; US-AC, ultrasounds air-coupled.
Cost wise, the equipment's cost can vary depending on the specific manufacturer and model. In techniques where the results are presented in C-scans, a scanning device is necessary. The cost of this device will depend on factors such as size, required resolution, and travel speed, which can add up. The thermography, beside the IR camera, requires a heat source such as a flash lamp or a heating coil.
Conclusions
In this article, an NDT benchmarking for PMC produced by 3D printing with unidirectional fiber reinforcements was performed. Artificial defects simulating delaminations in the matrix were produced with a thickness of 0.5 mm. Four NDT techniques, aiming for a noncontact and automatable inspection process, which can produce an image for easy results interpretation, were selected. Active pulse thermography, air-coupled ultrasounds, continuous wave terahertz, and digital X-ray were the techniques selected.
Although all four NDT techniques studied were successful in the detection of the delamination defect, there are some complementarities, specificities, and limitations worth exposing:
Thermography technique is the only one that does not require access to both sides of the part to perform the inspection. This can be a great advantage when the other surface is inaccessible. Both thermography and X-ray techniques generate a picture result or even a video, while the terahertz imaging and air-coupled ultrasound require a scanning device and the image results must be constructed later. Thermography technique is sensitive to the position of defects in the thickness direction, reducing its resolution for defects further away from the inspected surface. On the other hand, this resolution loss gives a rough indication of the defect distance to the surface and enables differentiation of delaminations at different depths. Air-coupled ultrasound and X-ray techniques are indifferent to the delamination position in the thickness direction if the delamination thickness remains the same. As for the terahertz imaging, the same is true, but due to the Fabry Perot effect, inspection with a differing distance between the emission and the inspected part can enable this differentiation. The fiber reinforcement materials did not significantly affect the inspection reliability. In fact, the only technique able to represent the fibers was the X-ray and this, very faintly. For inspection of big surfaces and in remote areas, which require portability of the inspection system, the thermography has great potential. The Terahertz inspection of PMC reinforced with electrically conductive fibers may be unfeasible if the defect is not in the fiber itself. The carbon fibers, being electrical conductors, reflect the radiation, making it impossible for it to pass through (interact with) the sample to the sensor.
Footnotes
Acknowledgments
Authors acknowledge FCT-MCTES for its financial support through the project UIDB/00667/2020 (UNIDEMI).
Authors' Contributions
H.V.S.: data curation, investigation, software, validation, visualization, and writing—original draft. N.P.C.: investigation. M.S.C.: formal analysis, methodology, supervision, and writing—review and editing. T.G.S.: conceptualization, formal analysis, funding acquisition, methodology, project administration, resources, supervision, and writing—review and editing. M.A.M.: conceptualization, data curation, formal analysis, investigation, methodology, project administration, resources, software, supervision, validation, visualization, investigation, and writing—original draft.
Author Disclosure Statement
No competing financial interests exist.
Funding Information
Marta S. Carvalho, Telmo G. Santos, and Miguel A. Machado acknowledge the funding of Project POCI-01-0145-FEDER-016414 (FIBR3D), cofinanced by Programa Operacional Competitividade e Internacionalização and Programa Operacional Regional de Lisboa, through Fundo Europeu de Desenvolvimento Regional (FEDER) and by National Funds through FCT-MCTES. The authors also acknowledge FCT-MCTES for its financial support through the project UIDB/00667/2020 (UNIDEMI).
References
Supplementary Material
Please find the following supplemental material available below.
For Open Access articles published under a Creative Commons License, all supplemental material carries the same license as the article it is associated with.
For non-Open Access articles published, all supplemental material carries a non-exclusive license, and permission requests for re-use of supplemental material or any part of supplemental material shall be sent directly to the copyright owner as specified in the copyright notice associated with the article.