
Abstract
Heat accumulation due to repetitive simple laser processing paths during building up a three-dimensional structure is a well-known issue that needs to be settled to reduce the excessively high residual stress and thermal deformation in a powder bed fusion (PBF) additive manufacturing process. Because of the dependency of laser path on the thermal dispersion, it is essential to analyze the heat accumulation phenomenon during laser processing. A computational fluid dynamics (CFD) analysis based on the volume of fraction method is used to optimize the laser path for minimizing the local heating up in the PBF process. In this work, a novel spiral laser path with optimal rotation angle is proposed and compared with the commonly used scanning paths. As the results, the accumulated temperature of the optimal spiral path shows a 200.9 K less compared with that of the general repetitive path. The thermal deformation of a cantilever structure made by the optimal spiral path is experimentally evaluated. From the experimental test, we verify that the spiral laser path reduces thermal deformation by 52.3% compared with the one made by the general one-directional laser path. This work based on numerical simulations and experiments utilizes the proposed spiral laser path to obtain higher precision, less residual stress, and more uniform microstructure of an additive-manufactured structure.
Introduction
Powder bed fusion (PBF), one of the most widely utilized processes in additive manufacturing (AM), has been primarily used in manufacturing three-dimensional structures for industrial applications.1–3 It is distinguished by its ability to produce much more complex geometries than conventional manufacturing processes such as casting, milling, and many others.4–6 Although the PBF process offers significant advantages for fabricating products, defects such as rough surfaces, porosity, residual stresses, microcracks, and thermal deformation can easily occur.7–10 Especially, residual stress of local thermal accumulation is the most serious problem in additively manufactured products,11,12 and typical examples of the deformation include thermally stored deformation,13–16 dimensional size errors, 17 and layer delamination. 18
Many researchers have analyzed residual stress and heat accumulation by applying numerical analysis methods that can provide effective insights.19,20 The temperature generated by laser melting of the powder and plate materials during the PBF process has a significant impact on the resulting residual stress. The melt pool flow of composite heat transfer, which occurs due to random distribution of powder, significantly influences temperature gradient after solidification.21,22 The micro- and mesoscale heat accumulation and residual stress characteristics were analyzed based on the PBF process.23–25
Finite difference method (FDM) can confirm the thermal distribution history and residual stress at the macroscopic scale, and finite volume method (FVM) can use the microscopic analysis of the actual phenomena and increase the accuracy of the obtained thermal distribution history in the manufacturing process.26–28
Although numerical analysis to investigate residual stress and thermal accumulation seems informative, additional process research is imperative to effectively mitigate residual stress and manage local heat accumulation during the PBF process. This can be achieved through a comprehensive approach combining experimental investigations and numerical simulations. In addition, research about minimizing the anisotropic behavior of molten pool and mitigating uneven heat accumulation that occurs during the PBF process is necessary.
As is well known, the melt pool generated during the PBF process exhibits a directional stress distribution along the scan direction, with increasing residual stress and differential temperature.29,30 Also, a distribution of persistent unbalanced temperature can lead to nonuniform residual stresses and thermal deformation. Therefore, rather than stacking layer-by-layer in a single direction, the rotational stacking is applied to eliminate excessive temperature build-up. 31
Furthermore, an effective scanning strategy that aligns with the direction of gas flow can not only mitigate defects arising from heat accumulation but also efficiently remove spatter generation. 32 Also, thermal accumulation and anisotropic characteristics emerge according to the laser scan of rotation angle. When thermal accumulation occurs, it can lead to a high temperature gradient, causing a molten pool formation in the keyhole and subsequently resulting in defects such as porosity and microcracks. 33
Till now, to reduce anisotropic properties of build-up parts, diverse rotation stacking angles of 67°, 90°, 105°, 120°, 135°, and 150° have been analyzed.31,34 However, when the rotation angle is not a prime number, such as 90°, 120°, 135°, and 150°, an intermediate layer having the same layer pattern per few accumulated layers is often generated. 31 This means that local temperatures may rise in a build-up area. So, the rotation angle with the prime number is important for reduction of local heating during the AM process.
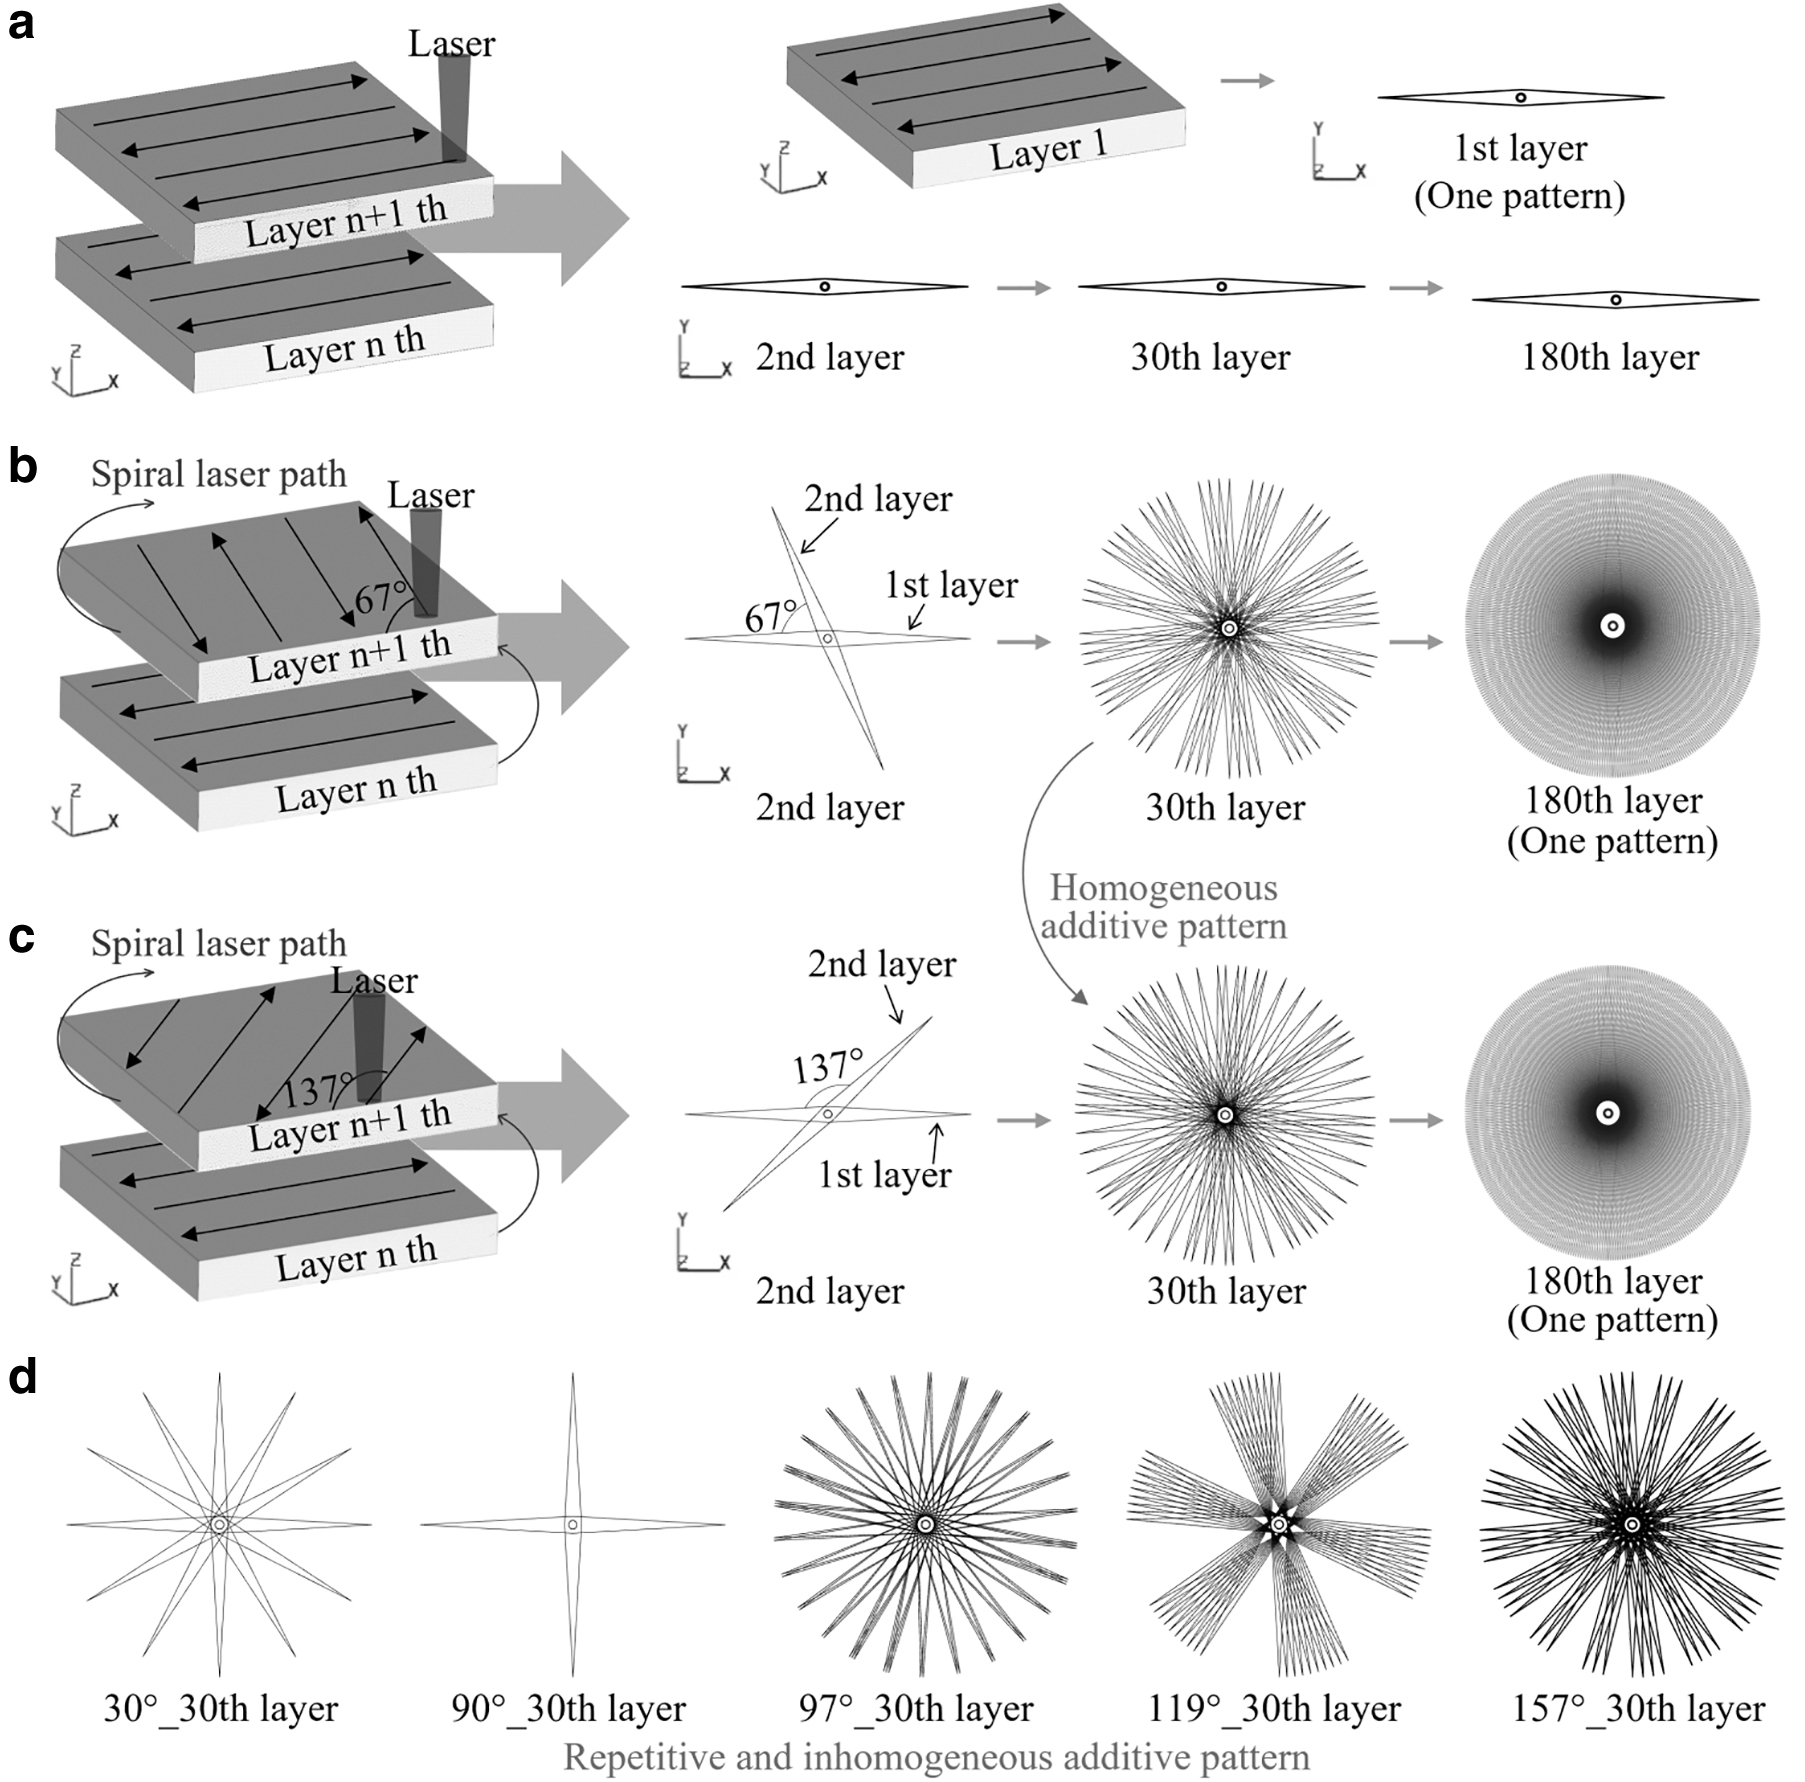
It is common to use a large prime number to avoid overlapping of neighboring layer patterns in the rational additive process, because heat accumulates between adjacent layers when a small prime number such as 7, 17, and 23 is used for the rotation angle. Generally, the 67° rotation angle of the spiral strategy was applied for reduction of unbalanced thermal accumulation.34,35 However, its rotation angle can lead to complex thermal field due to narrow hatching distance in a layer. As depicted in Figure 1, the rotation angle with a prime number of 137° shows a wide range of patterned area during accumulation of 30 layers, which resulted in a more uniform thermal distribution compared with that of 67°, 97°, 119°, and 157°.
Scan patterning according to laser scan rotation;
In this study, a new spiral path of 137° rotation was proposed, compared, and analyzed with the repeated and spiral laser path (0°, 67°) to effectively reduce the phenomenon of local heat accumulation and anisotropic melt pool behavior with numerical analysis. The heat accumulation according to the rotation angle was analyzed based on geometry to obtain a suitable scanning path for the layers. The temperature accumulation distribution according to the scan path was compared through numerical analysis.
The residual stress was compared using the numerical analysis of inherent strain and hole drilling measurement according to scanning paths. In addition, the thermal deformation and microstructure of the cantilever were analyzed according to scanning paths, and the effect on the reduction of heat accumulation was investigated.
Numerical Analysis Methods
Material and analysis method
Typically, the PBF process involves layer-by-layer manufacturing using laser melting. PBF processes can easily manufacture complex shapes with internal structures. 36 The product is manufactured using a laser melting process with a laser controller (laser source, scanner system), a powder platform, and a build platform. The manufacturing process for each layer is as follows: the powders from the powder platform are transferred to a coater, then deposited onto the plate, and melted with a laser. The DMP Flex 350 (3D SYSTEMS) equipment was used. Argon was used as a shielding gas during the PBF process. The specifications of the PBF process and powder properties of Ti–6Al–4V are listed in Tables 1 and 2.24,35,37
Powder Bed Fusion Process Parameters and Ti-6Al-4V Material Properties
Thermo-Physical Properties of Ti-6Al-4V
RS-200 Milling Guide with Air Turbine Assembly (Vishay), a drilling machine, was used to measure the residual stress. Vickers hardness measurements (Mitutoyo) were performed. Specimens for residual stress and hardness tests were manufactured in a block size of 20 × 20 × 20 mm according to the scanning rotation path.
Complex physical phenomena occur during the PBF. Examples include melting, heat transfer, and recoil pressure of metal evaporation, surface tension.23,24 Therefore, partial differential equations combining the mass conservation, momentum, and energy equations must be solved simultaneously to examine the temperature field generated in each layer and the flow pattern in the melting region. The FVM model was used to analyze complex physical phenomena in this analysis. In addition, the heat accumulation was analyzed using the commercial software FLOW-3D (FLOW SCIENCE, Inc.). 38
In the case of the bidirectional path, one pattern is obtained when 180 layers are additively manufactured. Each additive-manufactured layer showed a different pattern filled according to the laser rotation angle. Figure 1 shows the filled patterns when continuously stacked at each angle of 0°, 67°, and 137°. As shown in Figure 1a, 0° is additively manufactured in one direction without rotation, as shown in Figure 1b and c, 67° and 137° scan rotation are additively manufactured in multiple directions with spiral rotation.
When stacking 30 layers with other prime numbers of rotation angle such as 67°, 97°, 119°, and 157°, the coverage area is localized rather than full. Also, the difference in coverage area according to various spiral angles after 30 layers of stacking is compared in Figure 1b–d. Sixty-seven degrees and 137° are prime numbers, but 137° is more effective at covering the entire area in additive manufacturing.
The phenomenon of thermal distribution was analyzed and compared for scanning paths for 0°, 67°, and 137° up to layer 2 using the numerical analysis. As all rotating laser paths were used with a fixed rotation angle, a specific layer pattern is formed at each rotation angle. Therefore, a two-layer stacking analysis model having different rotation angles can be utilized to predict the initial trend of heat accumulation relatively. Since the numerical analysis of the same pattern is repeated from layer 3, additional computational fluid dynamics (CFD) analysis was omitted.
Governing equations
In the numerical analysis, this model of material was assumed to be a Newtonian and incompressible fluid. In addition, a laminar flow model was used under the assumed condition that the spatter does not occur. The governing equations of the conservation equations of mass, momentum, and energy to be solved are as follows:
19
Here,
where c is the specific heat, L is the latent heat of melting, and
The solid phase fraction was assumed to be a linear interpolation of the temperature during the phase transition, ranging between the solidus temperature (Ts) and liquidus temperature (Tl). The solid phase was modeled using a viscosity-based approach. In Equation (5), the material viscosities are calculated as a function of the solid fraction
where F is the fluid fraction (0 ≤ F ≤ 1). F = 0 is void, F = 1 is liquid, and 0 < F < 1 refers to the interface cell of fraction of void and fluid. A laser beam applied to the powders and substrate was used as the volumetric heat source of PBF process.
40
where P is the laser power, Ap is the absorptivity of laser beam, η is the laser optical penetration depth, R is the laser radius at which the energy density is reduced to 1/e 2 at the center of the laser spot.
The heat flux loss, the evaporation heat, the recoil pressure, and the Marangoni shear stress were also applied in numerical analysis.23,38,41 In addition, the Discrete Element Method (DEM) was implemented to obtain the distribution of the powder layer on the base plate and the subsequent solidified layers (layers 1 and 2) using the FLOW-3D DEM module. 38
In the case of cantilever specimen, ANSYS Additive Science (ANSYS) of inherent strain method was applied to numerically analyze the residual stress distribution according to the rotation angle of AM.42,43
Numerical analysis model
The powder used in the PBF process was analyzed using scanning electron microscopy (SEM, JSM–5800; JEOL) to determine the size distribution and shape of the powder suitable for numerical analysis (Fig. 2a). As shown in Figure 2b, spherical powders with diameters of 20, 30, and 40 μm were set to 10%, 60%, and 30%, respectively, and randomly distributed on the substrate. The numerical analysis domain had the dimensions of 500 μm (length), 500 μm (width), and 110 μm (height). The mesh size was 3.5 μm, and 1 million elements were generated. The thermal accumulation varies depending on the numerical analysis domain size. 44
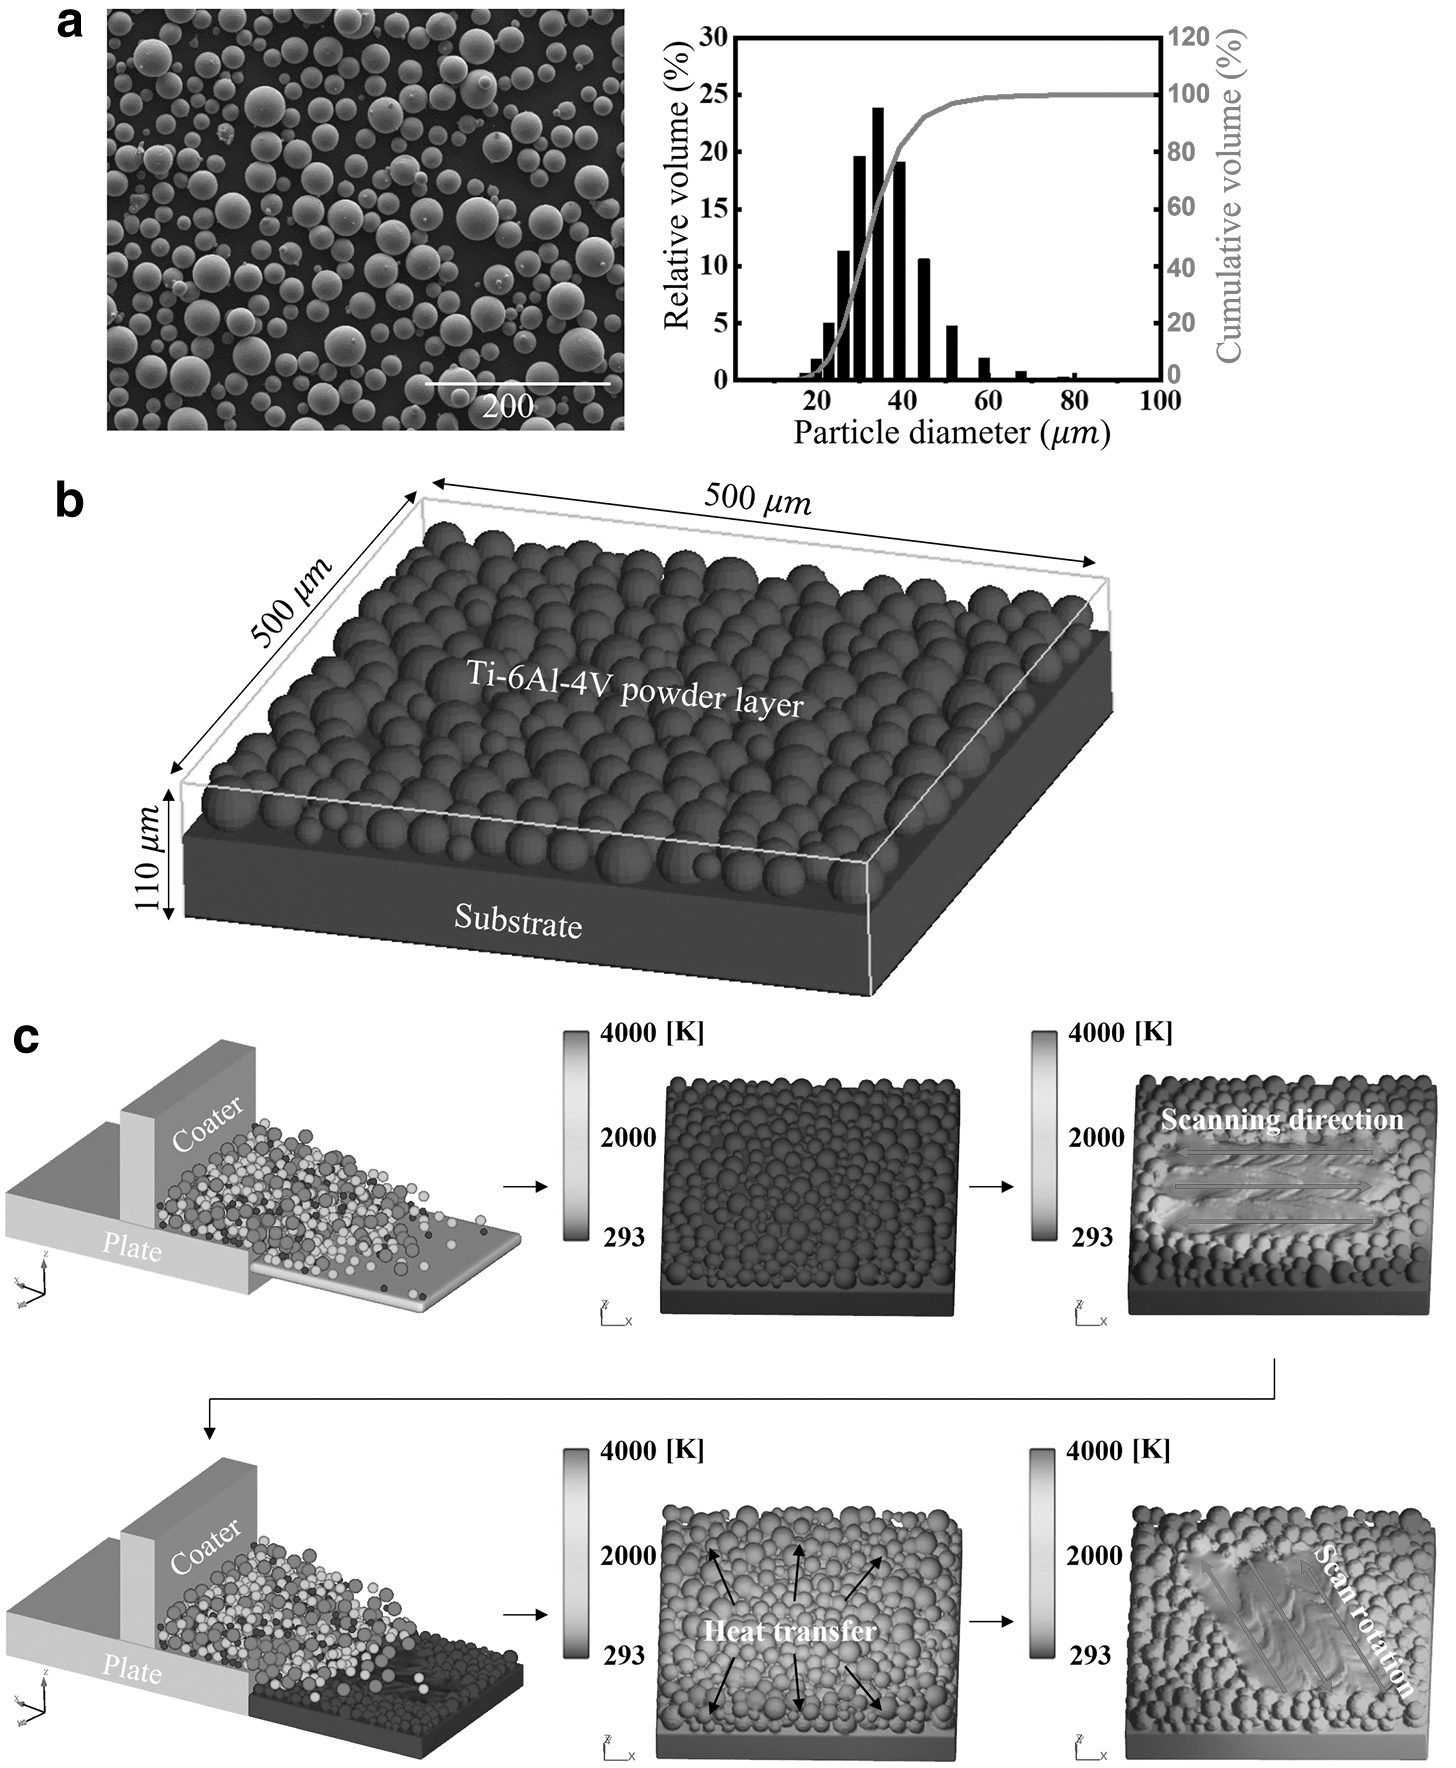
Ti–6Al–4V powders, numerical analysis domain and process.
As the melting area and the height of the additively manufactured part increase, thermal accumulation occurs, leading to an increase in the part temperature. 44 This study conducted a numerical analysis to examine the effect of thermal accumulation on the local area while considering the simulation time for FVM. Figure 2c illustrates the overall numerical simulation process of powder layering and melting. During the powder-layering step, DEM was used to determine the random distribution generated by the repulsive force against the coater.
The CAD file containing the powder layer using the DEM results was extracted and imported as a fluid region into the powder model. For layer 1, the heat accumulation phenomenon for the adjacent molten pool in the laser scanning path was analyzed. After melting layer 1, the molten area model was exported as a CAD file, and a powder-packing simulation using DEM was performed. CAD data of random powder distribution were imported into layer 2. The melting process was resumed with the stored thermal distribution data after the cooling process. For layer 2, the heat accumulation phenomenon for repeated and spiral scanning paths was compared.
Results and Discussion
Model validation
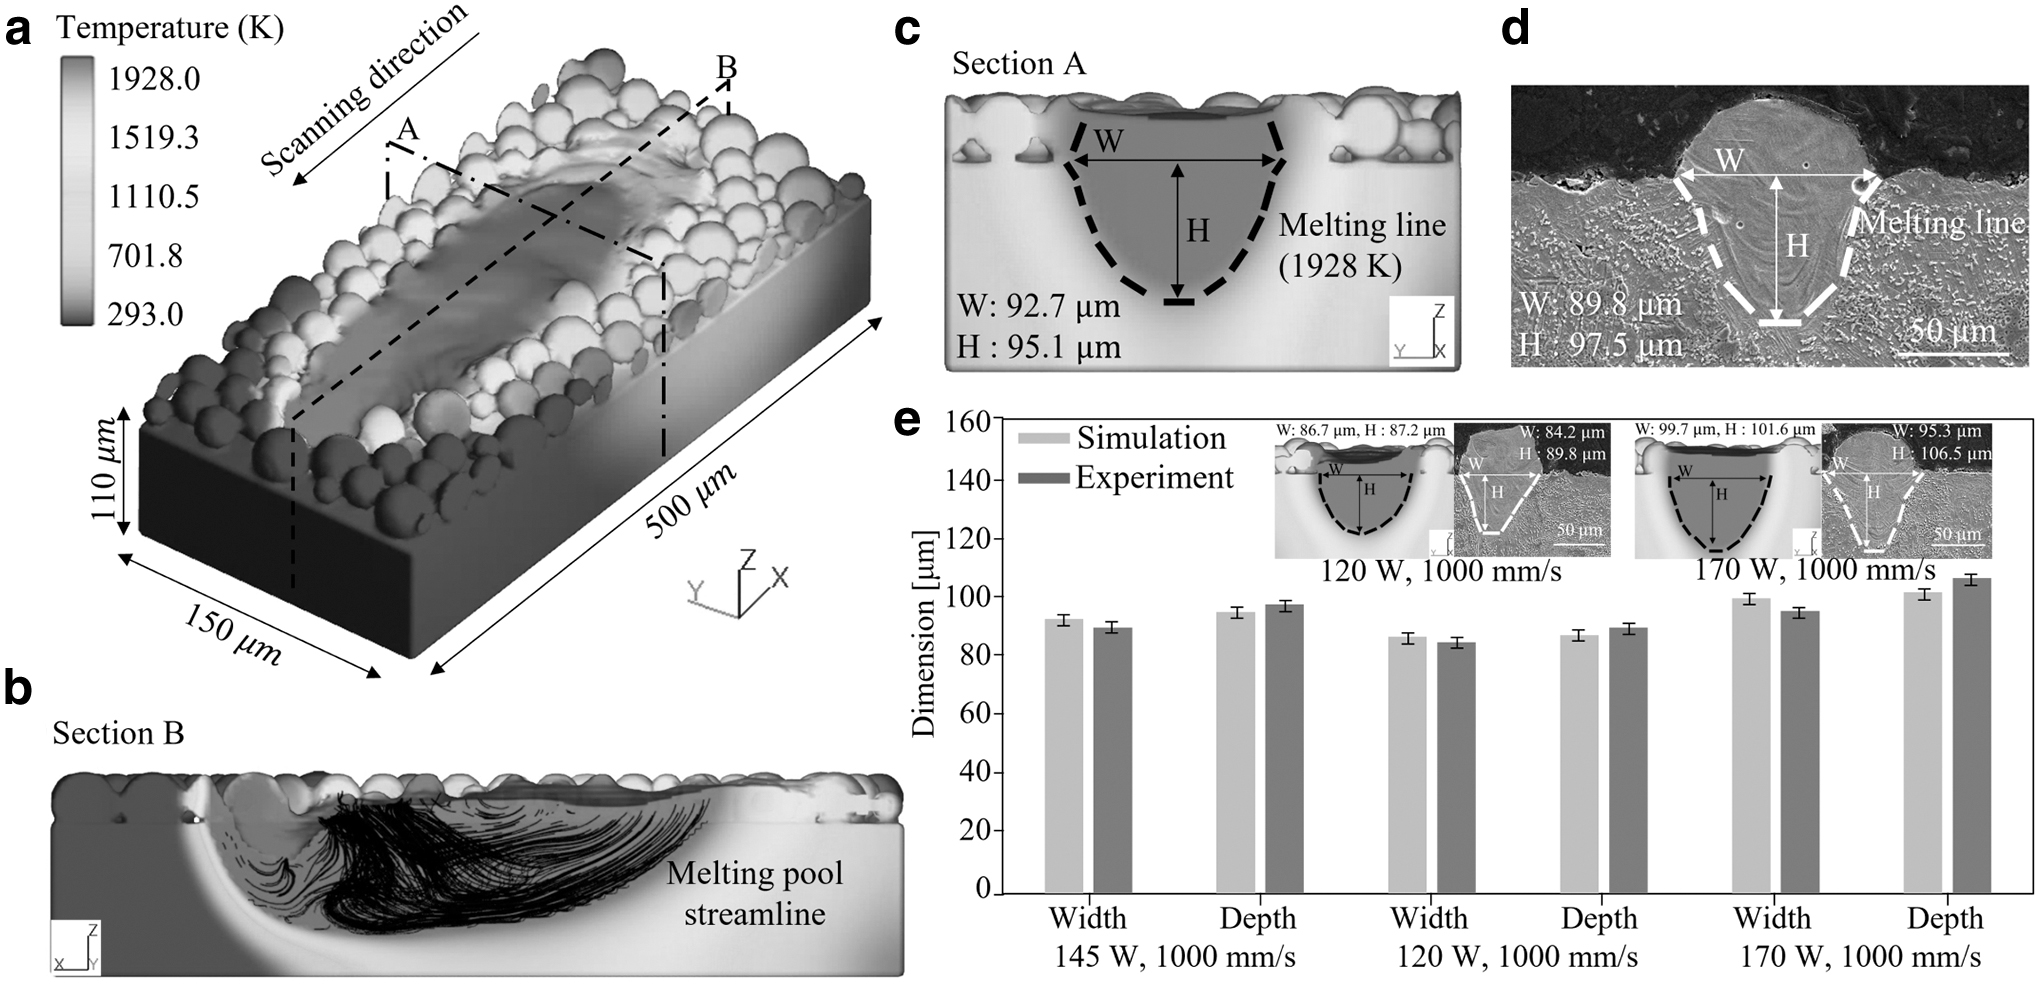
The numerical analysis and experimentally measured single-track dimensions were compared. Figure 3a shows the results of the single-track simulation. As shown in Figure 3b, the single-track molten pool morphology exhibits a Marangoni effect due to the laser-induced evaporation pressure. Furthermore, the evaporation pressure causes the molten pool to flow in the opposite direction to the laser. A vortex-like movement appears due to the change in surface tension caused by the temperature difference. The flow of the molten pool maintains a steady shape under the influence of ambient temperature. As shown in Figure 3c and d, the experimental and numerical analysis results were quantitatively compared.
PBF numerical analysis of single track.
In addition, other process parameters (120 W, 1000 mm/s and 170 W, 1000 mm/s) were compared with increase in the reliability of numerical analysis (Fig. 3e and Table 3). Differences in bead width and depth obtained through simulations and experiments were in good agreement within an error of 3–4% depending on the process parameters. It shows that the numerically simulated molten pool geometry is in good agreement with the experimental molten pool.
Comparison of Simulated and Experimental Single-Track Dimension
Analysis of local heat distribution on PBF layers
Figure 4a and b show the analysis results for the bidirectional scanning path of layer 1 and the temperature graph depending on the time at the end of each track. The peak temperatures of each track in Figure 4b were 2220.3 (point A), 2326.7 (point B), and 2512.7 K (point C). The difference between the temperature graphs shows the temperature change when the adjacent track is melted.

Numerical analysis results on Layer 1,
In the case of Figure 4b, since laser melting proceeds in a reverse direction, the adjacent region is immediately melted, and heat is transferred after the peak temperature. The peak temperature difference of tracks 1, 2, and 2, 3 was 106.4 K (
The analysis of layer 2 was performed using the temperature data considering the cooling time, after placing the powder layer based on the temperature data during the melting of layer 1. To analyze the effect of thermal accumulation, 0° rotation, 67°, 137° rotation scan paths were compared. Figure 5a and b show the numerical analysis results and temperature history at the end of each track, depending on the time for the repeated and spiral scanning paths. The peak temperatures of tracks 1, 2, 3 were 2424.1 (track 1 of 0°), 2620.6 (track 2 of 0°), 2876.5 (track 3 of 0°); 2322.7 (track 1 of 67°), 2502.4 (track 2 of 67°), 2772.3 K (track 3 of 67°); and 2258.3 (track 1 of 137°), 2437.6 (track 2 of 137°), 2675.6 K (track 3 of 137°).
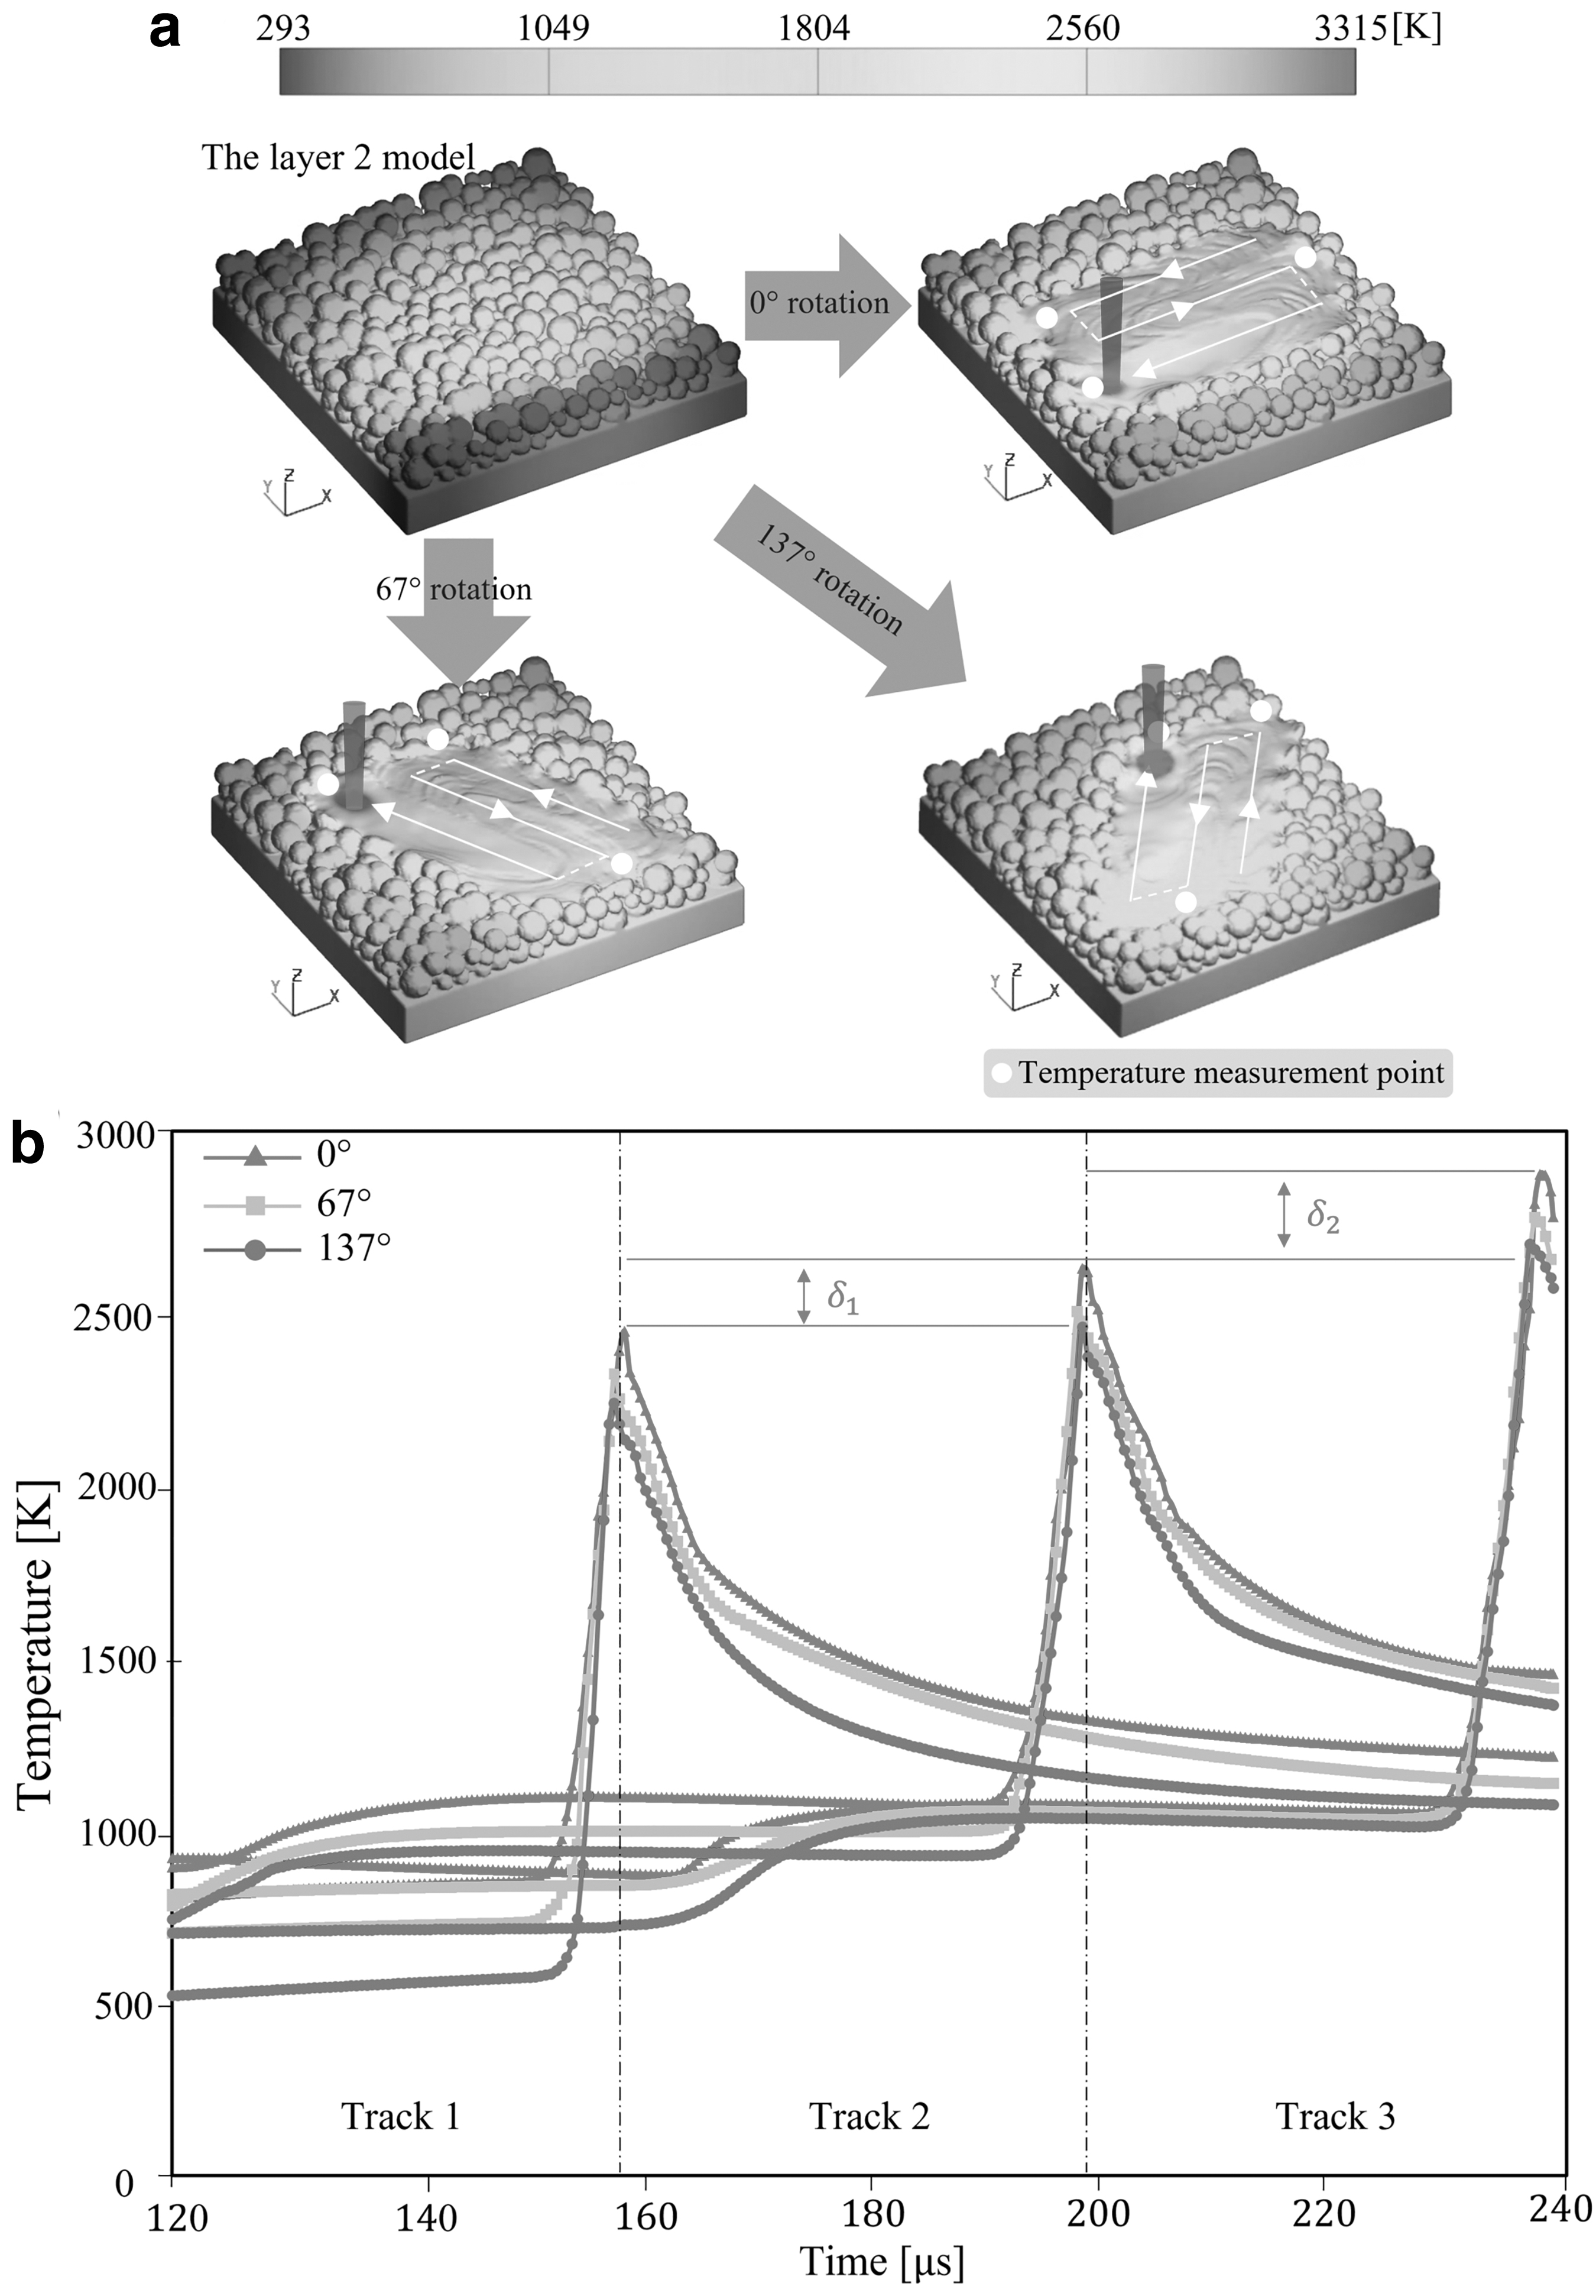
Numerical analysis results on Layer 2,
In the case of 0°, the peak temperature difference of tracks 1, 2, and 2, 3 was 196.5 K (
The peak temperature of 137° rotation was kept lower than those of 0° and 67° due to the preheat. The 0° rotation took 20 × 106 s, 30 × 106 s longer time to decrease from the peak temperature of track 1 to the melting temperature of 1928 K than the 67° and 137° rotations. It can be seen that the higher the heat accumulation, the longer the retention time in the liquid metal. By adopting a larger scan angle, the 137° rotation enables diagonal laser scanning than 67° rotation, reducing preheat and peak temperature during the PBF process.
As shown in Figure 6, the molten pool shape was modeled based on the scan path in layer 2. Zero degree rotation produced anisotropic molten pool in one direction, whereas the spiral scan path (67° and 137° rotation) created a molten pool along the angle of rotation. The 0° rotation (Fig. 6a) and 67°, 137° rotation (Fig. 6b, c) were analyzed in layer 2 (each melting area of 246 × 246
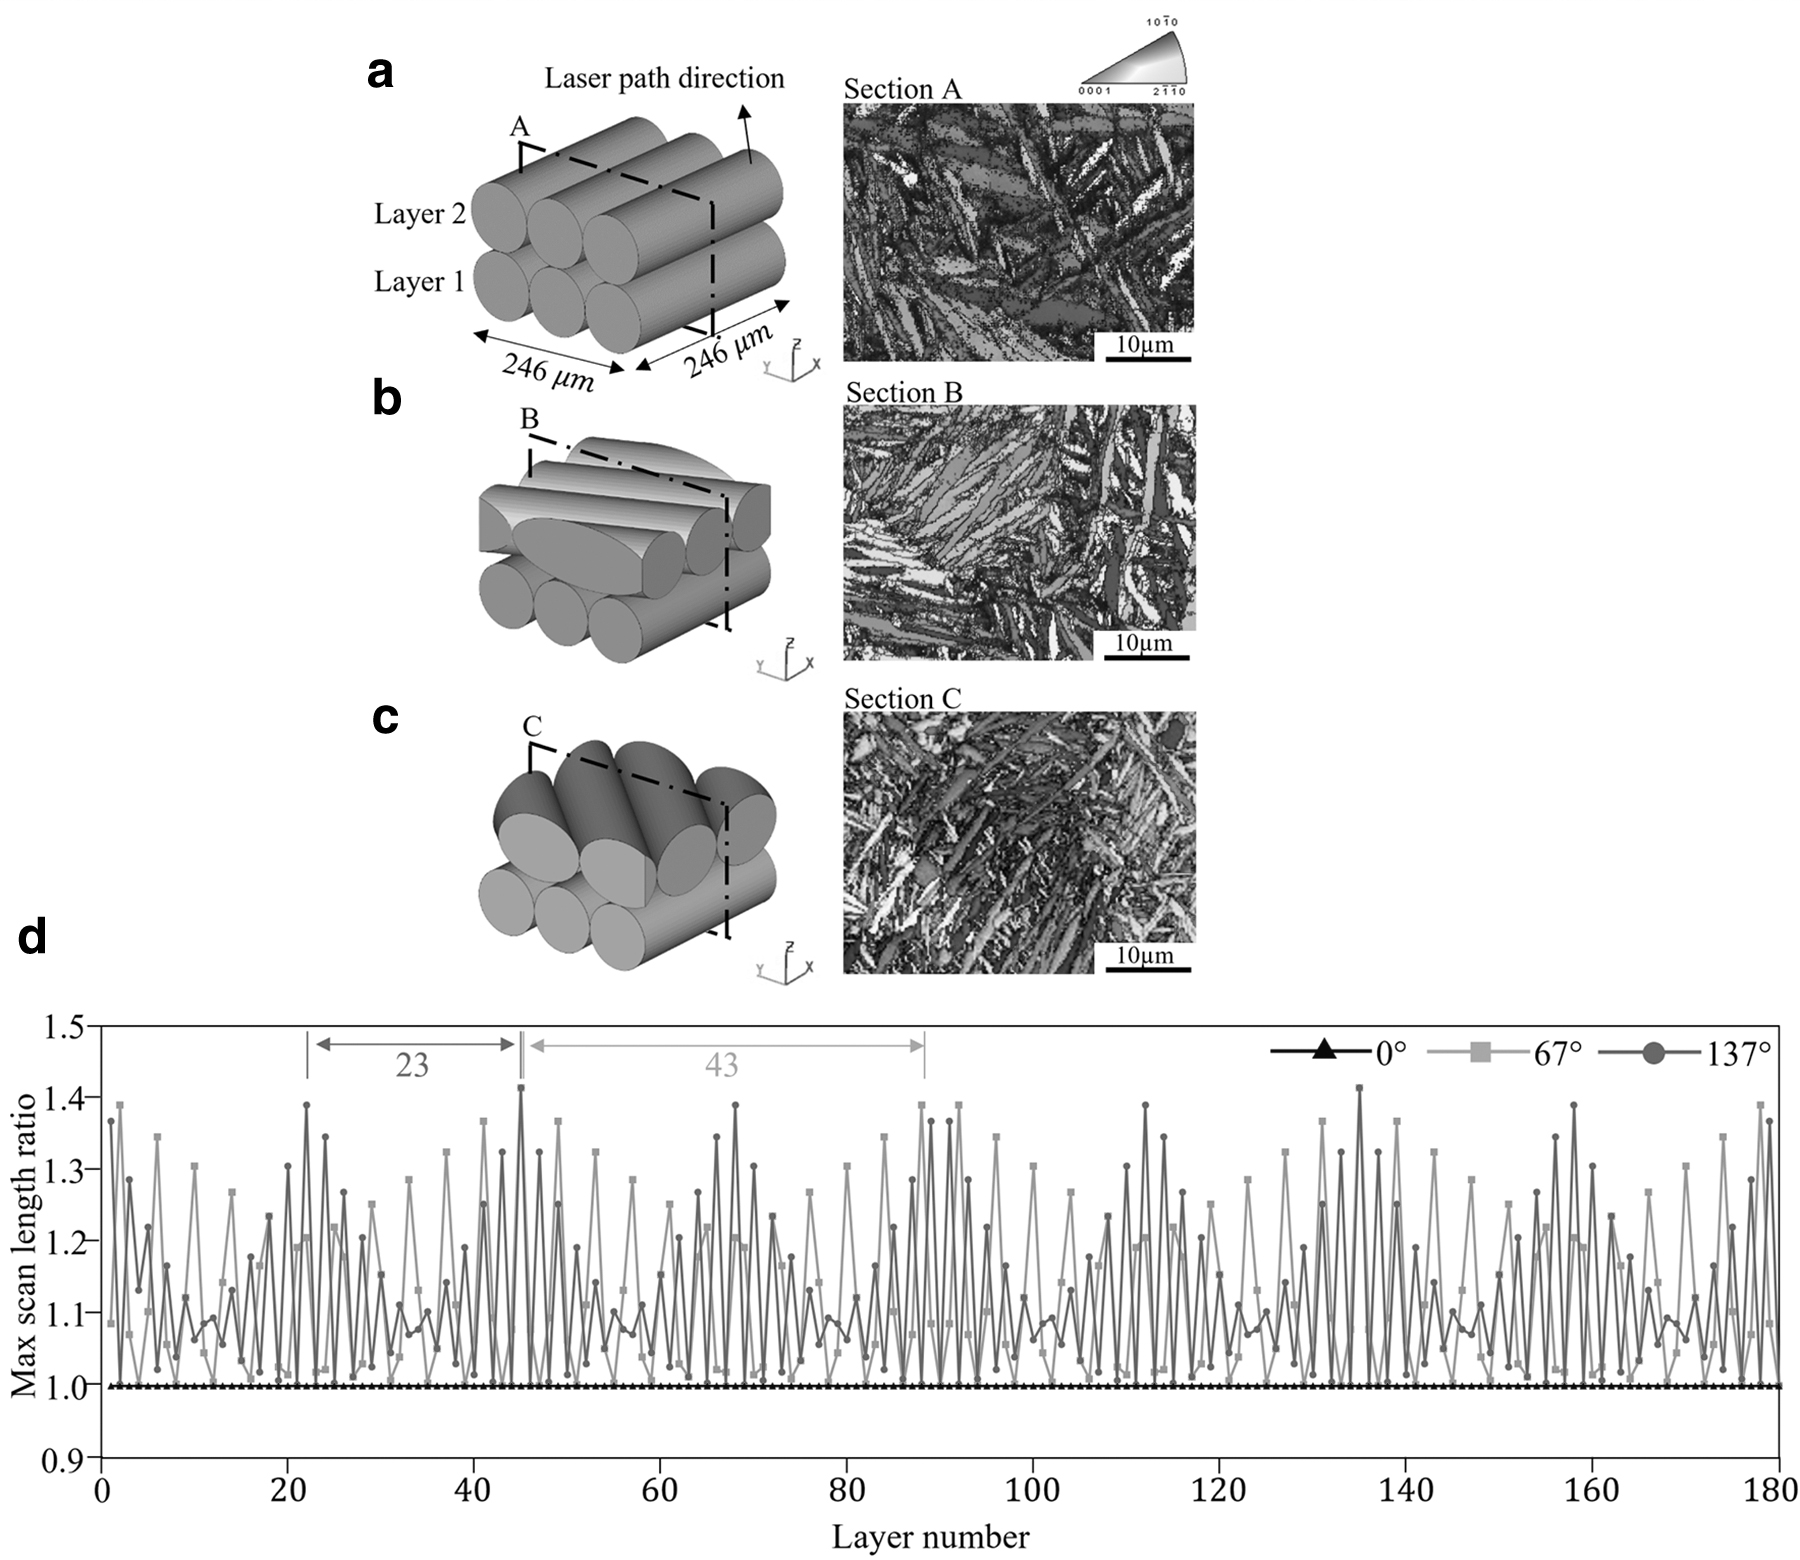
Scan path model on layer 2, SEM image and max scan length ratio.
The microstructure size of the spiral scan path of 137° rotation was 0.2, 0.1 μm lower than that of 0° and 67° rotation. The max scan length of 67°, 137° rotation was longer than 0° rotation. The maximum scan length produced at a given rotation angle is determined through the application of trigonometric functions. When assuming a scan length of 1 in a square area and a 0° rotation, all the scan lengths become equal to 1. However, in the case of 67° and 137° rotation, when the scan length of layer 1 is 1, the maximum length of layer 2 increased to 1.086 and 1.367. The heat accumulation phenomenon could be reduced by having a long scan length on center area.
In addition, the scan rotation at each layer facilitates efficient dispersion of heat distribution. As shown in Figure 6d, the maximum length of each layer can be calculated whenever the layer increases. A peak pattern at 137° rotation appears every 23 layers, whereas a peak pattern at 67° rotation appears every 43 layers. One hundred thirty-seven degrees rotation can create a more homogeneous pattern by pulling the peak period by 20 layers than 67° rotation. The heat distribution of the molten pool can be varied, and the anisotropic behavior can be reduced by reducing the pattern period. Therefore, it was caused to reduce the temperature difference so that as the scanning path rotated, the heat of molten pool dissipated. As a result, the spiral scanning path shows less temperature accumulation than the repeated scanning path.
As shown in Figure 7, PDAS size of the 0° rotation (average 4.2 μm) is larger than PDAS of 67° and 137° rotation (average 3.9, 3.8 μm). The PDAS size measured in the 20 × 20 × 20 mm cubic was found to be larger than that in Layer 2. This resulted in a difference in microstructure due to a change in the temperature gradient difference and an increase in heat accumulation caused by the larger melting area. In addition, it can be seen that the microstructure boundary of the repeated laser path exhibits vertical anisotropy compared with the microstructure of the spiral laser path having complex and equiaxed shapes.
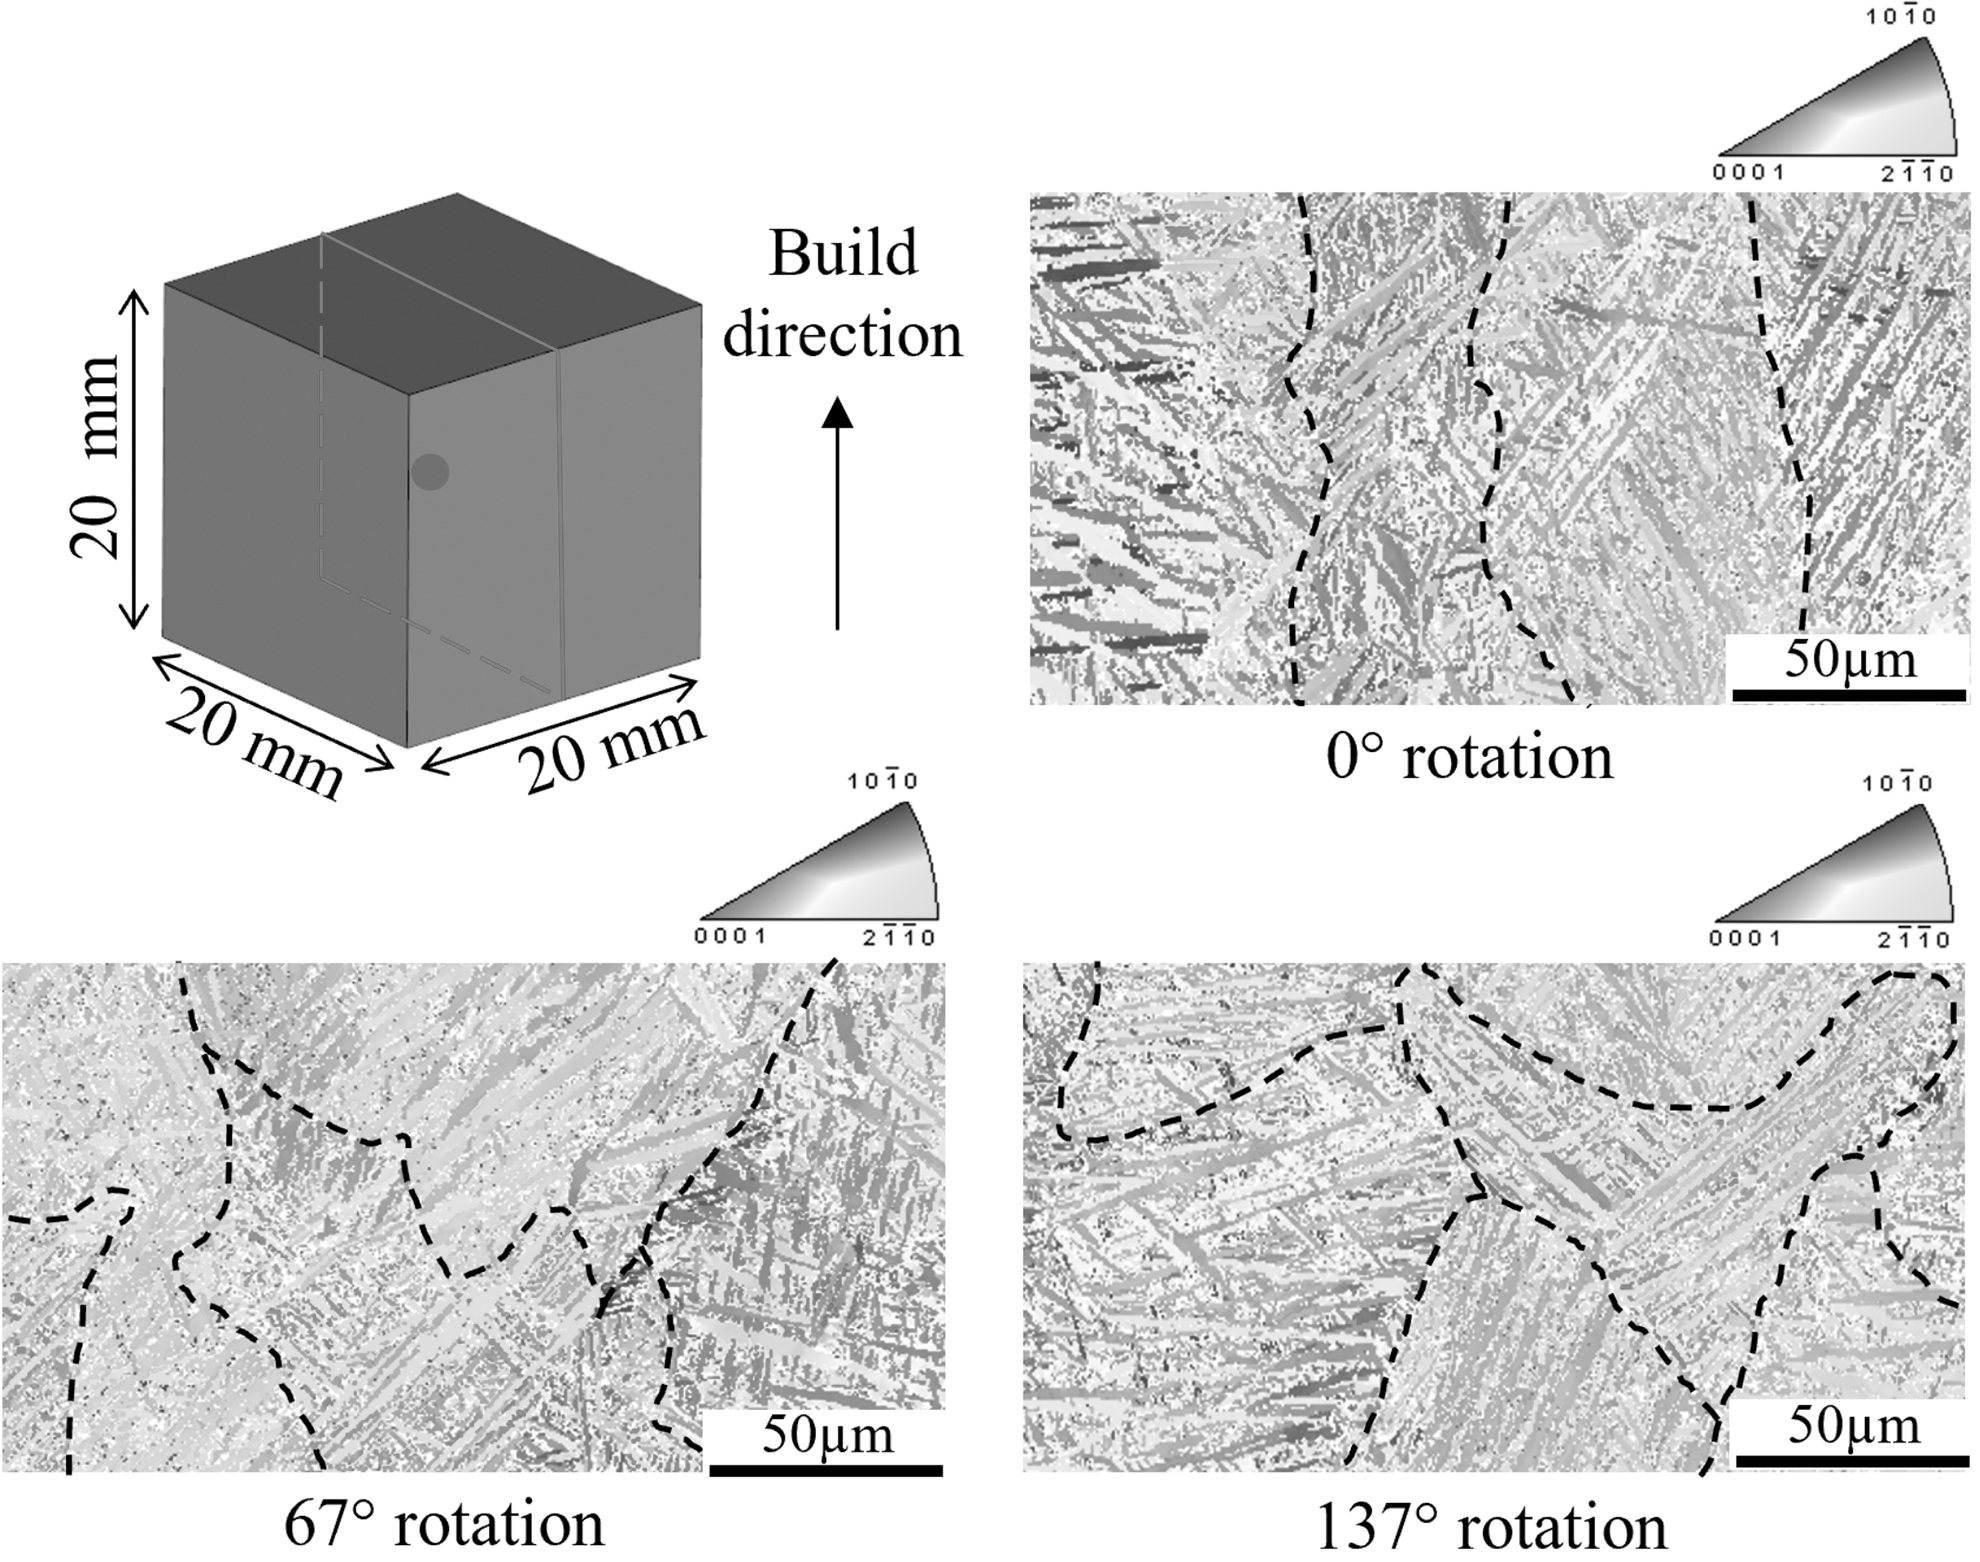
SEM image of section of cubic specimen (0°, 67°, 137° rotation).
The microstructure of the Ti–6Al–4V specimen appears primarily as columnar dendrites due to the rapid solidification of the laser process. 22 This is an important microstructural parameter because it determines the material properties as the size of the particles becomes finer. In addition, the amount of heat accumulation is different depending on the laser path, which causes a difference in the microstructure size due to the difference in cooling rate. 22 When additively manufactured in the same direction, the size of the microstructure increases due to the increase in temperature gradient, and slow solidification is observed due to heat accumulation in the accumulated preheated area.
Also, due to the melt pool generated in one direction, the grain boundary appears elongated in one direction. In contrast, when additively manufactured in a different direction, the size of the microstructure decreases due to less heat accumulation in the accumulated preheated area than in the same direction. In addition, by changing the pattern, it was possible to make the microstructure smaller by reducing the accumulative amount of thermal distribution. Also, it is possible to create grain boundaries of the isotropic shape.
Analysis of residual stress, thermal deformation, and hardness
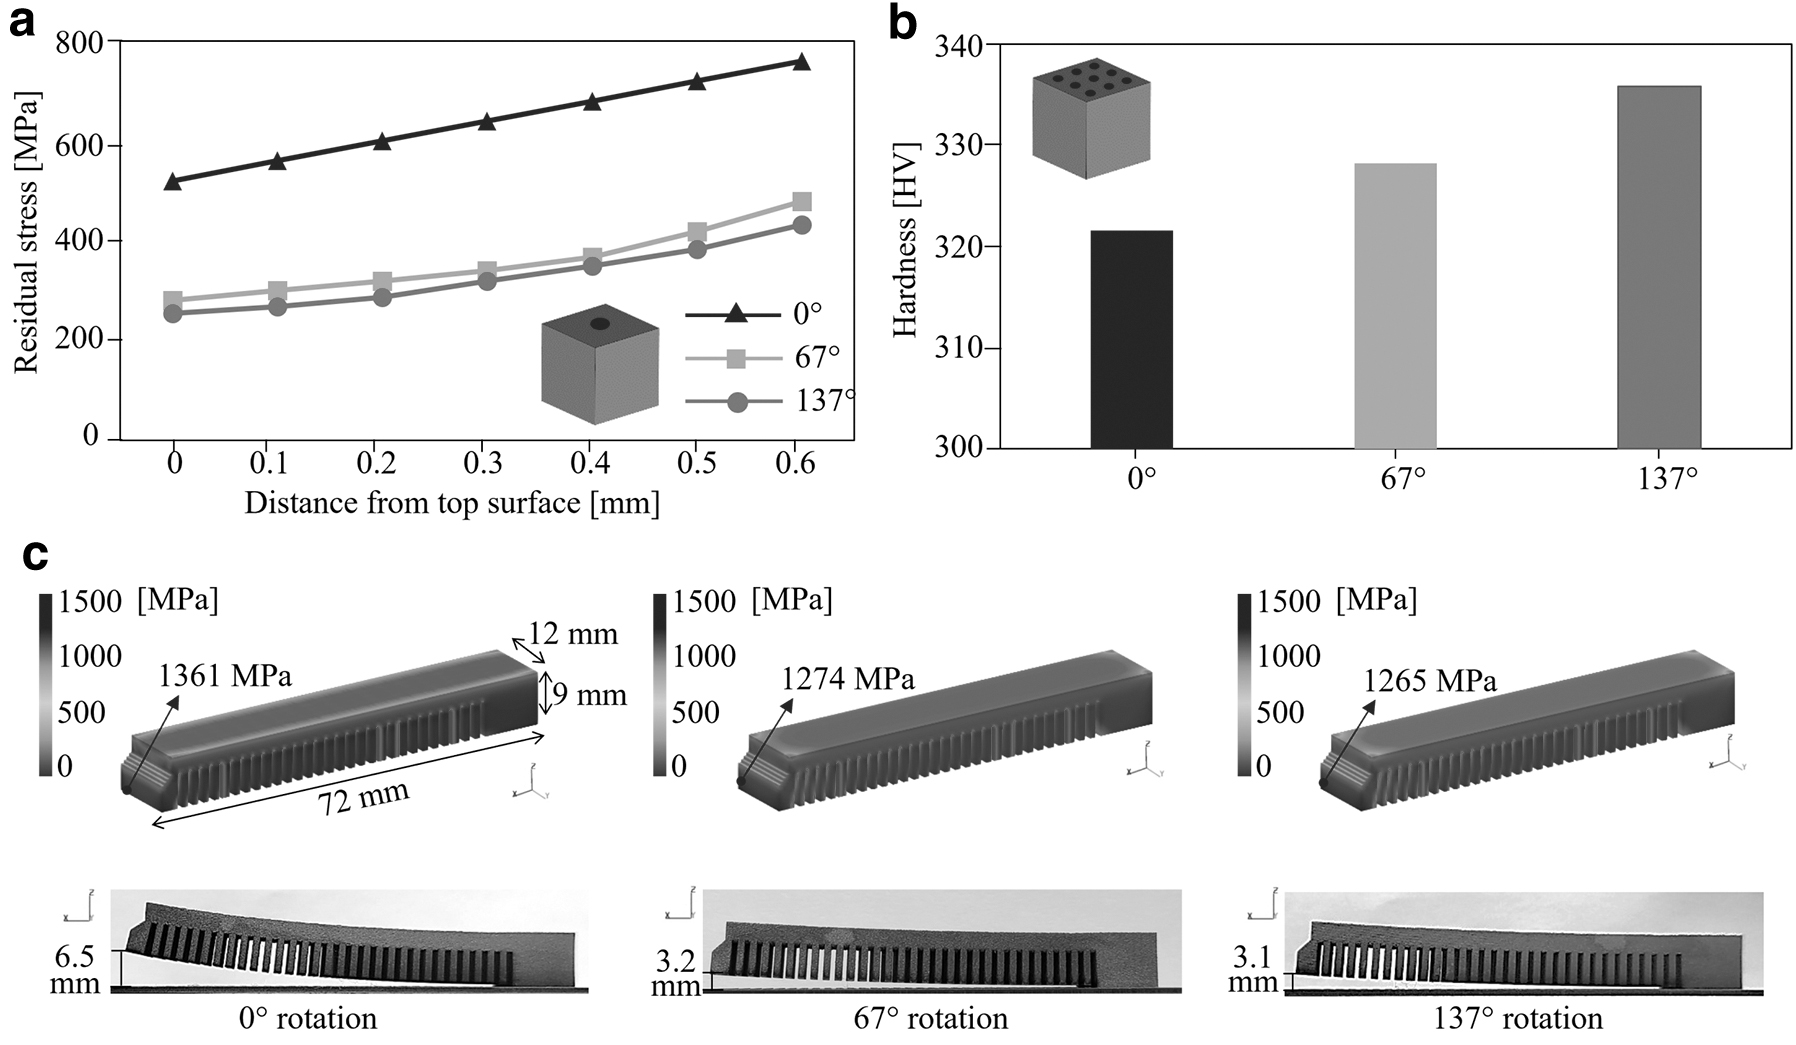
As shown in Figure 8a, the specimens were fabricated according to the scanning path, and the residual stress and hardness were measured. The residual stress was measured from the top surface to 0.6 mm in the depth direction (measurement at intervals of 0.1 mm). In the repeated scanning path, residual stress of 390 MPa was measured at the top surface, and the residual stress was higher as the depth increased, and at a depth of 0.6 mm, 570 MPa was measured. In the spiral scanning path, the residual stress increased in the depth direction; a residual stress of 210 MPa was measured at the top surface, and 360 MPa was measured at a depth of 0.6 mm.
Hardness and residual stress analysis,
In addition, in the 137° rotation, the residual stress increased in the depth direction, 191 MPa was measured at the top surface, and 324 MPa was measured at a depth of 0.6 mm. Therefore, the residual stress of the spiral scanning path (67° and 137° rotation) was 36.9, 43.2% lower than that of the 0° rotation. In addition, the measurement of the residual stress of 137° rotation was reduced by 9.05% compared with 67° rotation.
As shown in Figure 8b, the hardness was measured at nine locations on the top surface. The average hardness of the specimens (0°, 67°, and 137° rotation) was measured to be 321.6, 328.2, and 335.8 HV. Because the 137° rotation yields a fine microstructure, the hardness of the specimen using 137° rotation was 14.2, 7.6 HV higher than those of 0° and 67° rotation.
As shown in Figure 8c, the thermal deformation of the cantilever was measured by 0° rotation, 67° and 137° rotation. The numerical analysis of residual stress was performed using inherent strain method of ANSYS Additive Science (ANSYS). 42 The maximum residual stress of the 0° rotation was 1361 MPa, and the maximum residual stress of the 67° and 137° rotation were 1274, 1265 MPa. The numerical analysis of residual stress of 0° rotation was 87, 96 MPa higher.
In addition, numerical analysis of residual stress of 137° rotation was 9 MPa reduced compared with those of 67° rotation. The cantilever was manufactured according to scan rotation, and then wire cutting was performed to compare the amount of thermal deformation. The cantilever thermal deformation of the 0° rotation was 6.5 mm. The cantilever thermal deformation using the spiral scanning path was 3.2 (67°) and 3.1 (137°) mm.
The thermal deformation was reduced by 50.8, and 52.3% using the 67° and 137° rotations. In addition, the thermal deformation of 137° rotation was decreased by 3.13% compared with those of 67° rotation. The use of 137° rotation improved the mechanical properties by creating a fine microstructure, and effectively reduced the residual stress and anisotropic behavior, thereby preventing thermal defects.
Conclusions
The new spiral scanning path was applied to reduce heat accumulation. The PBF process was numerically analyzed using the FVM and Finite Element Method, which can simulate the temperature distribution and residual stress in micro- and macroscale analyses. The heat accumulation and melt pool formation were analyzed through simulations using 0° rotation, 67° and 137° rotation. The peak temperature of the 137° rotation path was 200.9 K lower than 0° rotation. In the case of a repeated scanning path, it was observed that a molten pool was formed in one direction in every layer, and in the case of a spiral scanning path, the molten pool was formed according to the rotating angle in each different layer.
We verified that the heat accumulation was dissipated depending on the angle of the scanning path. As a result, the microstructure size of the 137° rotation was 0.4 μm lower than that of the 0° rotation. In addition, thermal deformation and residual stress were reduced. The new spiral scanning path was able to reduce local heat accumulation, thermal deformation, residual stress, and defects.
Footnotes
Authors' Contributions
J.Y. contributed to conceptualization, methodology, visualization, experiments, investigation, formal analysis, software, writing—original draft, review and editing. S.J.P. performed visualization, experiments, formal analysis, investigation. S.H.K. carried out experiments, formal analysis, investigation. S.M.Y. and K.I.K. designed methodology, investigation, and formal analysis. Y.S. performed methodology, investigation, writing—review and editing. P.K. assisted with methodology, investigation, formal analysis, writing—review and editing. J.P. and S.-H.P. contributed to conceptualization, supervision, funding acquisition, project administration, writing—original draft, review and editing.
Author Disclosure Statement
The authors declare that they have no known competing financial interests or personal relationships that could have appeared to influence the work reported in this article.
Funding Information
This study was supported by the Technology Innovation Program funded by the Ministry of Trade, Industry & Energy (MOTIE) of Korea (1415188196, Development of 3D printing digital transformation platform technology based on process metadata), the KITECH internal project (JE230027, TSV Metrology and Inspection for Vertical Stacked Microchip Manufacturing) and the National Research Foundation of Korea (NRF) grant funded by the Korea government (MSIT) (No. 2019R1A5A8083201).