
Abstract
Microfluidic channel systems can be used for various biomedical applications, including drug administration, wound healing, cell culture research, and many others. A 3D microfluidic channel system has enormous potential over conventional microfluidic channel systems, including the capacity to simulate biological events in a laboratory setting. This system has the ability to recreate biological phenomena such as concentration gradient generators (CGGs). Microfluidic CGGs have complex fabrication when built into a 3D channel system. These complex systems can be built with complicated processes such as plasma bonding, which requires expensive setup and fine equipment. Therefore, in this study, a smart additive manufacturing technique is applied for an enormous review of the design and fabrication process, which is optimized for different operating conditions. This study employs a 3D printed removable channel mold to avoid the complex fabrication technique of microfluidic channels, allowing the direct casting of polydimethylsiloxane without extra bonding stages. The proposed design comprises dual mixing stages, incorporating a 3D mixer configuration and a converging output to attain the desired gradient outcome. Optimization is performed to achieve the best operating conditions by using response surface methodology, with channel dimension
Introduction
Microfluidics refers to the scientific and technological field that handles small amounts of liquids. 1 Microfluidic devices are typically composed of miniaturized components, such as microchannels,2,3 microvalves,4,5 micropumps,6,7 micromixers, 8 and microseparators, 9 designed to manipulate fluid and control its flow. Fluidic channel systems have made significant progress in the past two decades and have emerged as adaptable and dependable solutions for various fields of study, 10 especially in the biomedical field. These microfluidic systems 11 distinguished themselves from others with their nature of simplicity, low cost, and broad application systems. 12
With decades of research and development, microfluidics has become a significant subject of influence for many fields such as chemicals, physics, bioanalysis, and organ-on-a-chip.13–15 In the field of chemistry, microfluidics has been employed to improve material synthesis, especially for the production of nanomaterials and nanostructures, due to the more extensive interface between the reagents compared to their volume. 16 In the field of biology, 17 microfluidics has proven to be valuable for molecular analysis, cell analysis, and sorting.18,19 Microfluidic components have been integrated into neural probes and implantable devices to deliver precise amounts of drugs to specific locations within the body. 20
Microfluidics has also been used to create wearable systems that serve as sensors for electronic gadgets. 21 In recent years, 22 there has been a growing demand for fast, accurate, and precise outcomes in the field of biomedicine, particularly during the COVID-19 pandemic in 2019. 23 This trend has spurred increased research activity and created a new challenge: to make these technologies more widely accessible to users. Microfluidic systems have emerged as leading solutions to this problem, serving as point-of-care testing devices 24 capable of detecting coronavirus infections with high accuracy and speed, even outside laboratory settings.
Microfluidics are microfabricated structures for liquid handling with cross-sections ranging from 1 to 500 μm with a modest volume capacity. 12 Microfluidic devices have been fabricated using a diverse range of materials, with glass and silicon historically serving as the primary options due to their wide availability and advanced micromachining processes.25,26 Nevertheless, these materials were associated with certain drawbacks, including high processing costs, brittleness, and a lack of self-sealing properties. Consequently, polymers can be hard, brittle, flexible, or elastic depending on their structure, synthesis method, and preparation techniques. Thermosets, thermoplastics, elastomers, and thermoplastic elastomers are the most prevalent polymers utilized in microfluidic applications. 27
Siloxane elastomers, also known as silicone rubbers or silicone, are synthetic polymers with a dimethylsiloxane repeating unit ((Si(CH3)2O)n) along their backbone. Poly(dimethylsiloxane) (PDMS) is the most widely used material for microfluidic fabrication due to its high flexibility, elasticity, and optical transparency. 28 PDMS can be easily bonded to other substrates and exhibits durability and gas permeability. Ecoflex rubber is another commercial brand for siloxane elastomers used to make microfluidic sensors to obtain more flexibility and stretchability. 29 Siloxane elastomers can be utilized in three different ways in flexible microfluidics, including a layer containing microchannels, a substrate for electrodes to be deposited on, and a sealing layer. 30
Thermoplastic polyurethane (TPU) is a versatile material that has gained popularity in microfluidics due to its low cost, transparency, and flexibility. With the advancement of 3D printing technology, fused deposition modeling (FDM) has emerged as a rapid and cost-effective method for producing complex microfluidic structures. 31 The ability of TPU to flow easily through the printer nozzle and solidify upon deposition allows the fabrication of microchannels with dimensions as small as 50 μm in a relatively short amount of time. Moreover, TPU-based microfluidic devices offer excellent elasticity, enabling the devices to bend and deform without breaking under mechanical stress. These unique properties of TPU make it an attractive material for the development of flexible microfluidic devices with a wide range of biomedical applications.
Over the past few years, the field of microfluidic systems has grown significantly, resulting in a diverse range of fabrication techniques. Among the most common methods are micro-milling 32 and injection molding, 33 which provide high resolution and precise fluidic channels. However, these methods pose significant challenges when dealing with 3D fluidic channel layouts 34 and require expensive cleanroom environments. Creating a traditional microfluidic device through photolithography requires significant capital, including a clean environment, an ultraviolet exposure system for contact lithography, and expenses for photoresists and solvents. Replicating the lithographic master into PDMS and activating it with an oxygen plasma cleaner add to the costs. 35
In response to these challenges, 3D printing has emerged as a promising solution due to its low cost and independence from cleanroom environments. 36 Specifically, stereolithography (SL) 37 offers excellent channel precision and resolution at an affordable price, although developing a biocompatible resin 36 for biomedical applications remains challenging. Alternatively, FDM 38 is a cheaper and faster method than SL 3D printing, providing rapid and low-cost fabrication. 39 As 3D printing continues to develop and gain popularity, it may soon become the dominant method for fabricating fluidic channel systems, replacing other available methods.
Concentration gradient generator (CGG) systems are a critical type of microfluidic system that has gained popularity due to their ability to recreate various in vivo biological phenomena in vitro with precision. 40 These systems can generate multiple concentration gradients in fluidic channels, making them ideal for various fields such as drug delivery, cancer research, and cell culture.41–43 CGG systems have also been employed to simulate and artificially engineer microenvironments, enabling researchers to study and recreate in vivo phenomena with accuracy and control.44,45 Several design methods for CGG systems have been presented in previous studies, as outlined in Table 1, making them valuable tools for researchers across multiple disciplines.
Methods of Concentration Gradient Generator Systems
In CGG flow, the Navier-Stokes (N-S) equation serves as the governing equation, assuming that the flow is Newtonian and incompressible. Incompressible flow refers to a state where changes in fluid volume due to pressure variations within the system are disregarded. Similarly, the Newtonian fluids utilized in the CGG system do not have viscosity values that fluctuate with hydrodynamic shear. The Eq. (1) below displays the complete N-S equation used in the CGG system. This equation is an essential tool for accurately modeling and predicting the fluid dynamics within the CGG system.
Where
The above Eq. (2) relates the inlet volumetric flow rate u and characteristic length l of the fluidic channel to determine the relative significance of inertial and viscous forces. The Reynolds number, which indicates flow velocity in mass transport analysis, is used. Since the CGG system relies on pure diffusion with a low Reynolds number and no external force applied, the convective term is excluded, resulting in a simplified N-S equation shown by the Eq. (3).
The Hagen–Poiseuille equation can be derived from the Navier–Stokes equation. The laminar flow through a pipe of uniform (circular) cross-section is known as Hagen–Poiseuille flow. The equations governing the Hagen–Poiseuille flow can be derived directly from the Navier–Stokes into the following equation:
Where
The CGG system is design to produce precise, reproducible concentration gradients, enabling quantifiable measurements. Its potential applications span drug delivery, 49 cell culture study, 50 and tumor study.48,51,52 However, the system's complexity and lack of clarity in the fabrication process represent significant obstacles. 53 This article presents the creation and advancement of a novel prototype for a 3D microfluidic CGG. The innovation lies in the utilization of additive manufacturing techniques to fabricate a distinctive 3D microchannel. This article introduces an innovative 3D microfluidic CGG prototype, utilizing additive manufacturing techniques to create distinct microchannels. This approach aims to deliver reproducible and controllable concentration gradients, benefitting various applications such as drug delivery, cell culture studies, and tumor research. The main challenge remains in the complexity of the fabrication process.
In this research study done for the master thesis, 54 we have comprehensively analyzed the design, fabrication, and optimization of microfluidic channel systems fabricated using 3D printing. The response surface methodology (RSM) will be employed to generate the design of experiments (DOE) and optimize the system's performance. RSM, a powerful statistical technique, enhances accuracy in predictions and identifies critical factors influencing system response. These findings address current fabrication challenges, promoting technology advancement for diverse biomedical applications.
Materials and Methods
Materials
PDMS, also known as polysiloxane, is the most common material used in the fluidic channel system. 55 There are many reasons why PDMS is a quite popular material to use for numerous applications: its ease of development, simplicity, affordability, and swift fabrication process.. With plenty of benefits, this material also possesses excellent flexibility and extreme temperature resistance, while being chemically stable. 56 One of the most commonly used printable thermoplastics is acrylonitrile butadiene styrene (ABS). 57 Its applications had a wide range from houseware utensils, toys, and figurines to medical applications.58,59
The wide range of applications surely came with some promising reasons. ABS material possessed reliable and excellent properties, such as high tensile strength at almost 37 MPa 60 and Young's modulus reaching up to 1524 MPa, 61 which is the highest among all other printable thermoplastics available. One of the unique properties of ABS material is that it can be “melted” by exposing it to an acetone solution. These unique properties are generally used in surface treatment for some parts that have a poor surface finish. The method of chemical vapor smoothing or cold vapor treatment is used to improve the surface finish of ABS products. The acetone vapor will improve the surface finish and the mechanical properties62,63 as the “melted” materials fill in the poor layers during the smoothing process.
Design and fabrication of mold for 3D microfluidic channel
The channel design consists of two separate inlets with a diameter of 2 mm, connected perpendicular to the square cross-sectional main channel, which was illustrated by the computer-aided design (CAD) of the channel section in Figure 1. This channel design avoids the fluid clogging and leak possibilities with its Y-type junction. Each junction connects the channel to the various stages of mixing. These mixing stages are configured in a 3D channel layout and function as a fluid mixer for combining two fluids merging from the source. With two mixing stages in this design, four fluids, each with a different composition, are expected to converge into the outlet, creating a fluidic gradient. The outlet of the design is modified in such a way as to get a better visualization of gradient results. The complete design specification is shown in Table 2.
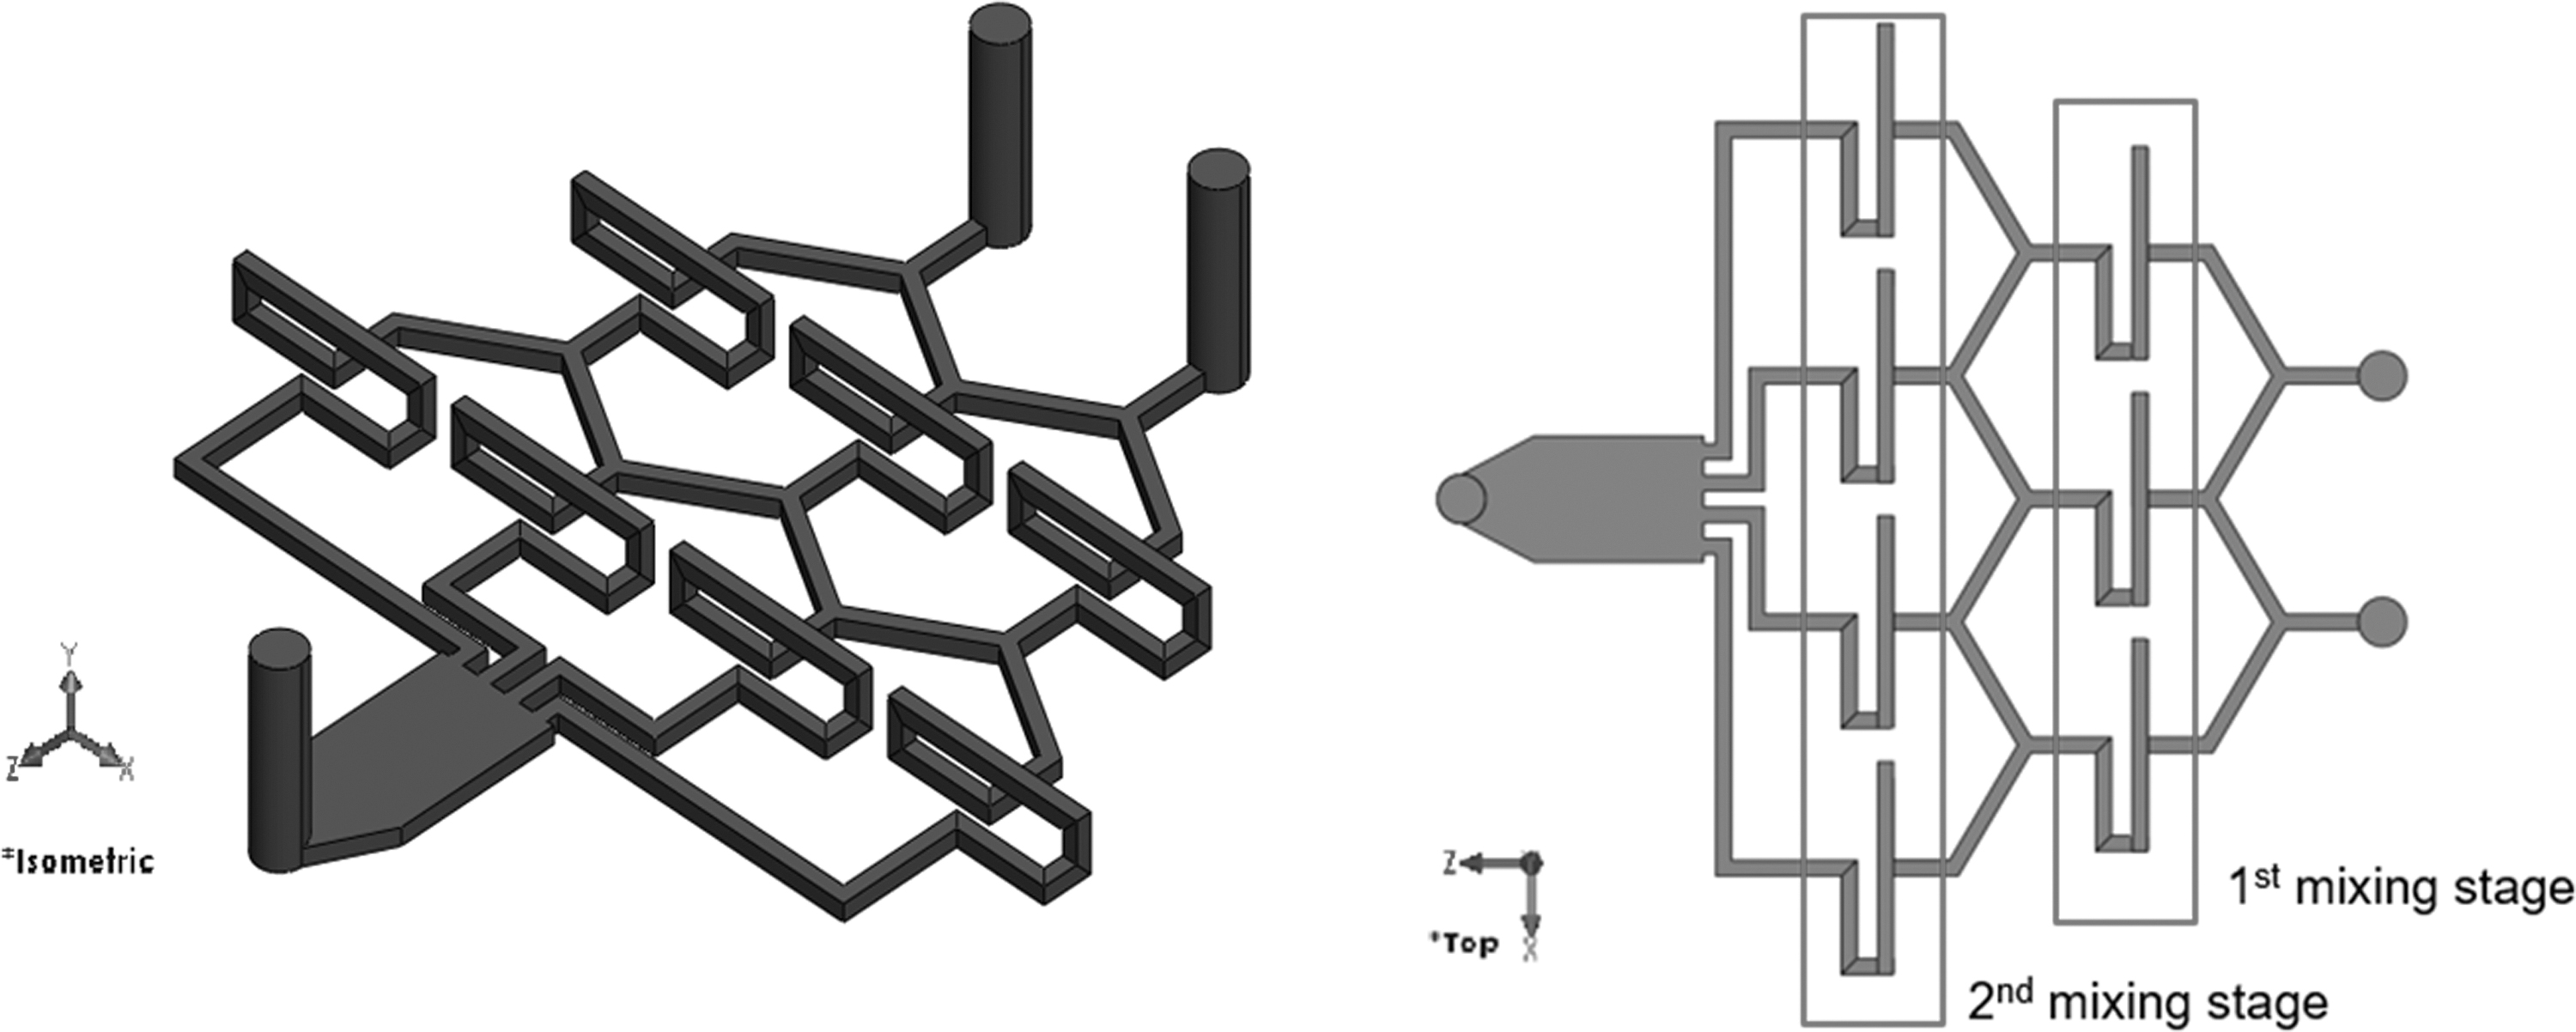
CAD of 3D channel section (isometric and top view). CAD, computer-aided design.
Channel Specification Summary
The printing process utilizes FDM, a renowned 3D printing technology that constructs designs using thermoplastic materials. This method employs a heated nozzle to melt the supplied materials, which are then extruded. Subsequently, the molten materials solidify, forming individual layers that gradually assemble the entire 3D structure.
Once the CAD is meticulously prepared, incorporating the specified design parameters, it progresses to the stage of being 3D print-ready. The material used for this process is ABS filament, selected for its suitability in 3D printing applications. The final design is then saved in the STL file format, serving as the foundation for subsequent processing within the 3D printer slicer software. Upon completion of the slicing process, wherein the design is divided into manageable layers, the resulting configuration is stored in the g-code file format. This file, containing the intricate instructions for the 3D printer, is then employed with the FlashForge Creator 3 3D printer. The specific printing settings tailored for the ABS filament are outlined in Table 3.
Parameter Setting for 3D Printing
ABS, acrylonitrile butadiene styrene.
Once the printing process was done, the raft build plate was removed, and further, the process for polishing the mixing outlet was done using microgrinding. All the processed 3D printed channel section used as mold is illustrated in Figure 2.
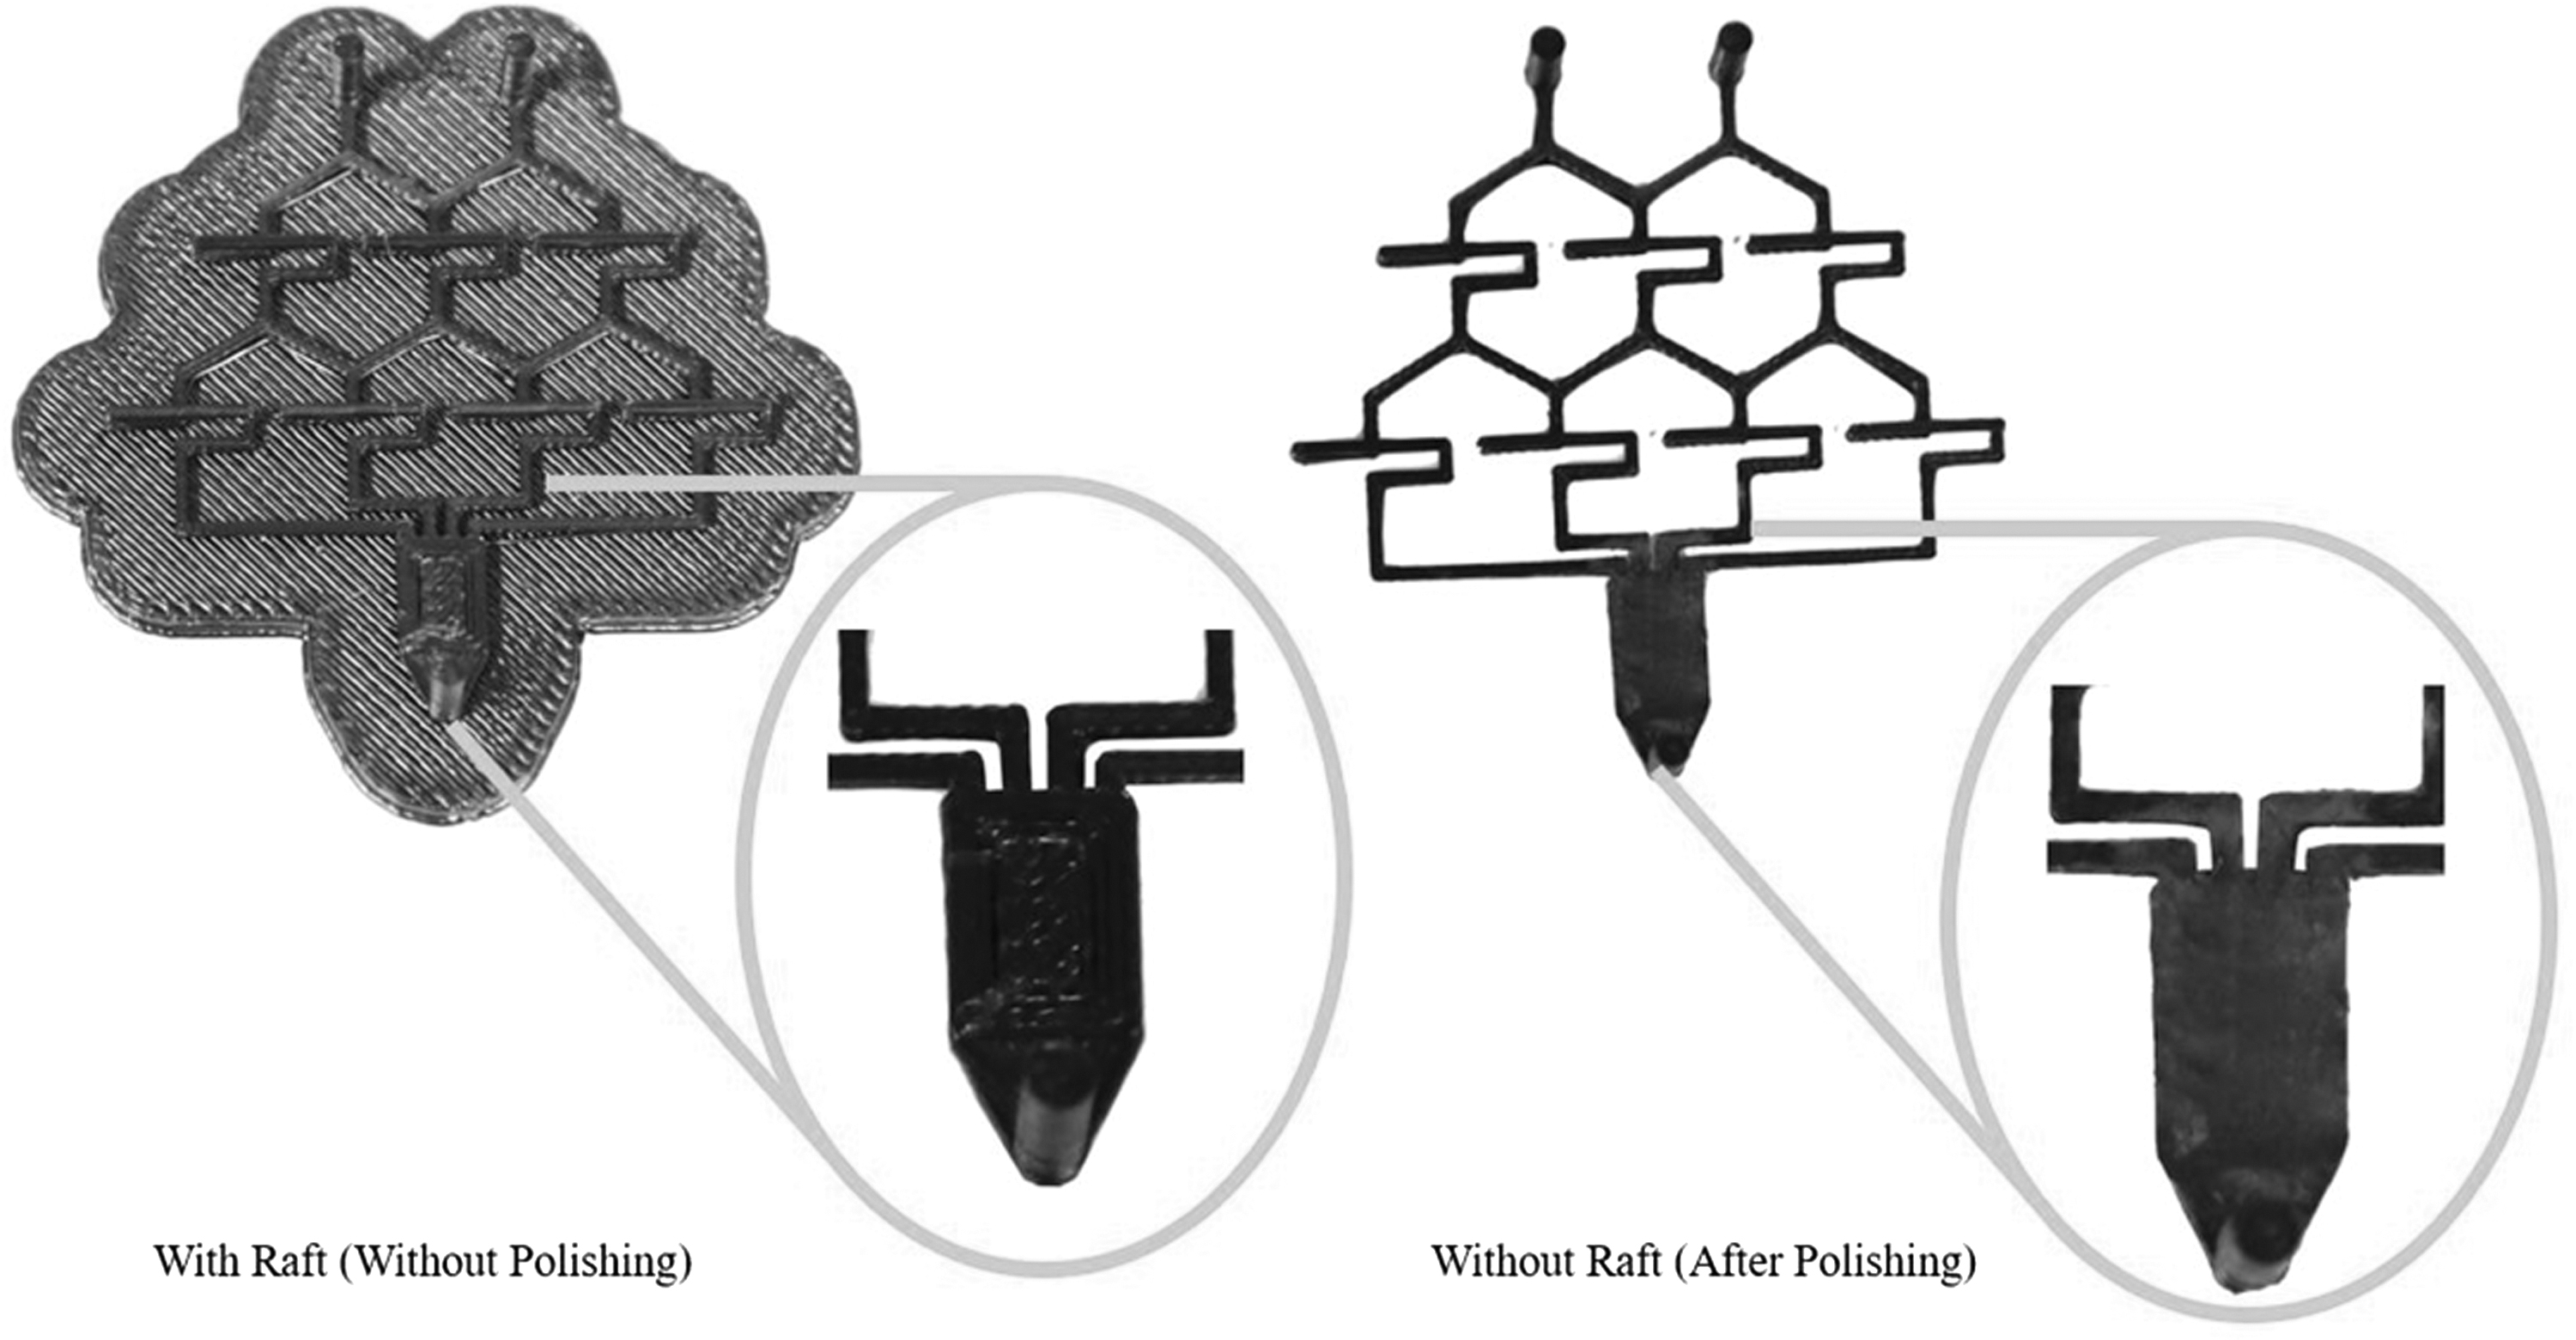
3D printed channel section (polished and unpolished).
Fabrication of PDMS-based microfluidic channel
This study used the 3D printed ABS channel as a mold to fabricate the PDMS-based microfluidic channel. Initially, two solutions are required for PDMS preparation, which are silicon elastomer 184A and 184B. These materials are mixed in a ratio of 10:1, and it is stirred well for proper mixing. This mixing process will cause air bubbles in the mixture, So to fix the air bubble issue, the mixture is put into the vacuum oven for 10–15 min. After the PDMS solution is prepared, the PDMS solution is poured into a square die containing ABS channel mold. To solidify the solution, the case is placed in a vacuum oven set to 80
To remove the ABS channel mold, the solidified PDMS is put into the acetone solution for 6–12 h. This acetone immersion dissolves the ABS channel mold, allowing it to be flushed away without damaging the PDMS outside layer. A thorough inspection has determined whether defects, such as cracking, blistering, distortion, or other defects, are discovered in the PDMS outside layer. The complete steps for fabricating a microfluidic channel fabrication are illustrated in Figure 3.

Fabrication steps for the microfluidic channel.
After the microfluid channel was fabricated, the pattern of the microfluidic channel was examined for channel dimension under the microscope. The PDMS channel was sliced into a cross-sectional area to get the exact channel dimension, as shown in Figure 4. The measurement was done by calculating the pixel-by-pixel channel layout, and then compared with the microscopic scale bar provided by the microscope software (Keyence VHX-6000 Microscope). The value of each pixel can be translated to the magnitude of the actual dimension in micrometers using the scale bar that represents the exact dimension.
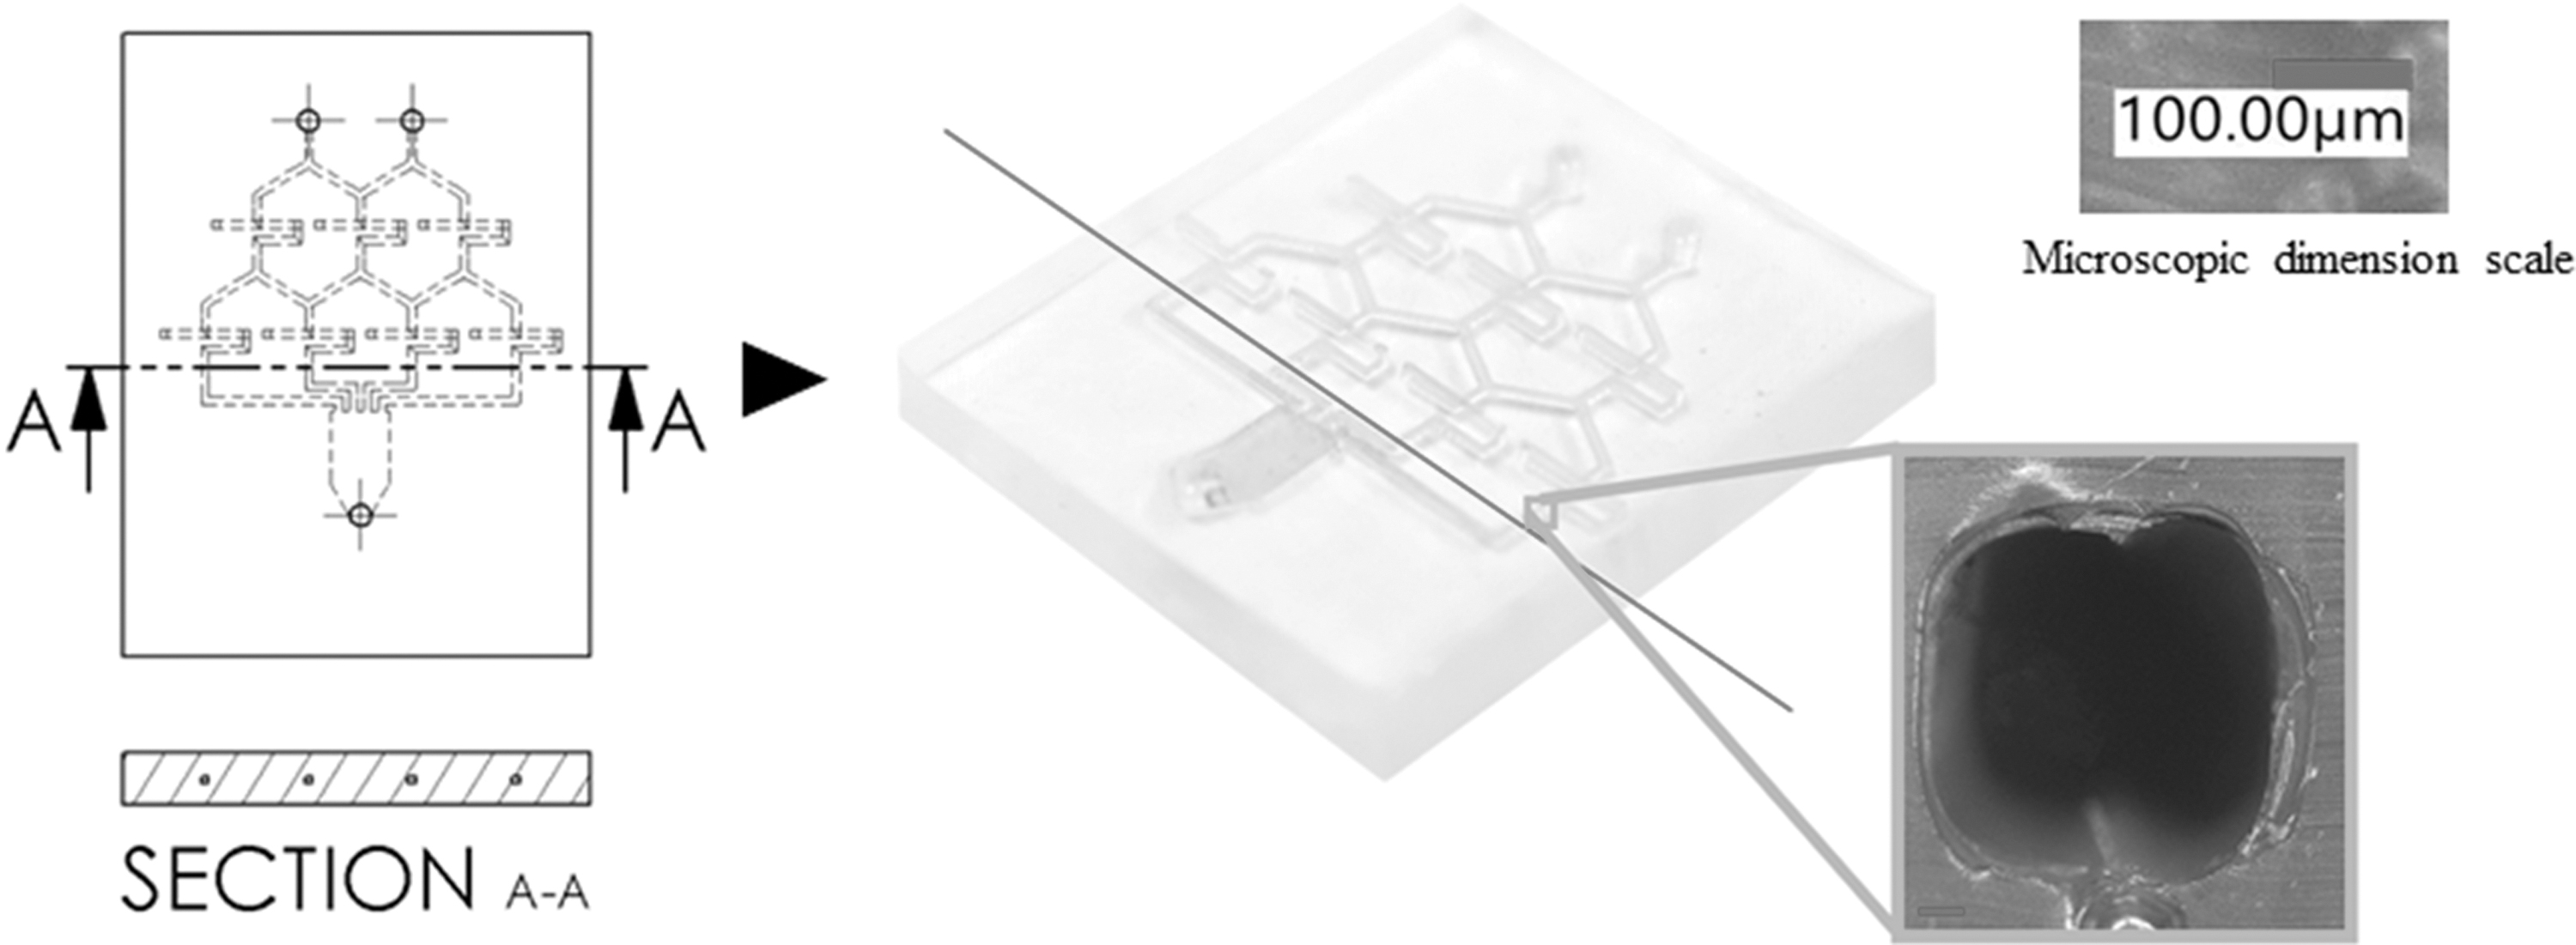
Microscopic view of the cross-sectional dimension of the microfluidic channel.
A different channel diameter was fabricated, ranging from 640 to 1065
Fabricated Microfluidic Channel Dimensions
Microfluidic channel flow control using a syringe pump
In this experiment, fluid flow control was performed using a syringe pump. This syringe pump (New Era NE-1200/NE-1600/NE-1800) is a programmable multisyringe pump with a two to eight syringe configuration. A Terumo 30 mL syringe is used for this pump. The syringe is mounted on the pump, and the operational parameter is set, as shown in Table 5. The experimental setup using a syringe pump for fabricated microfluidic channel flow control is shown in Figure 5.
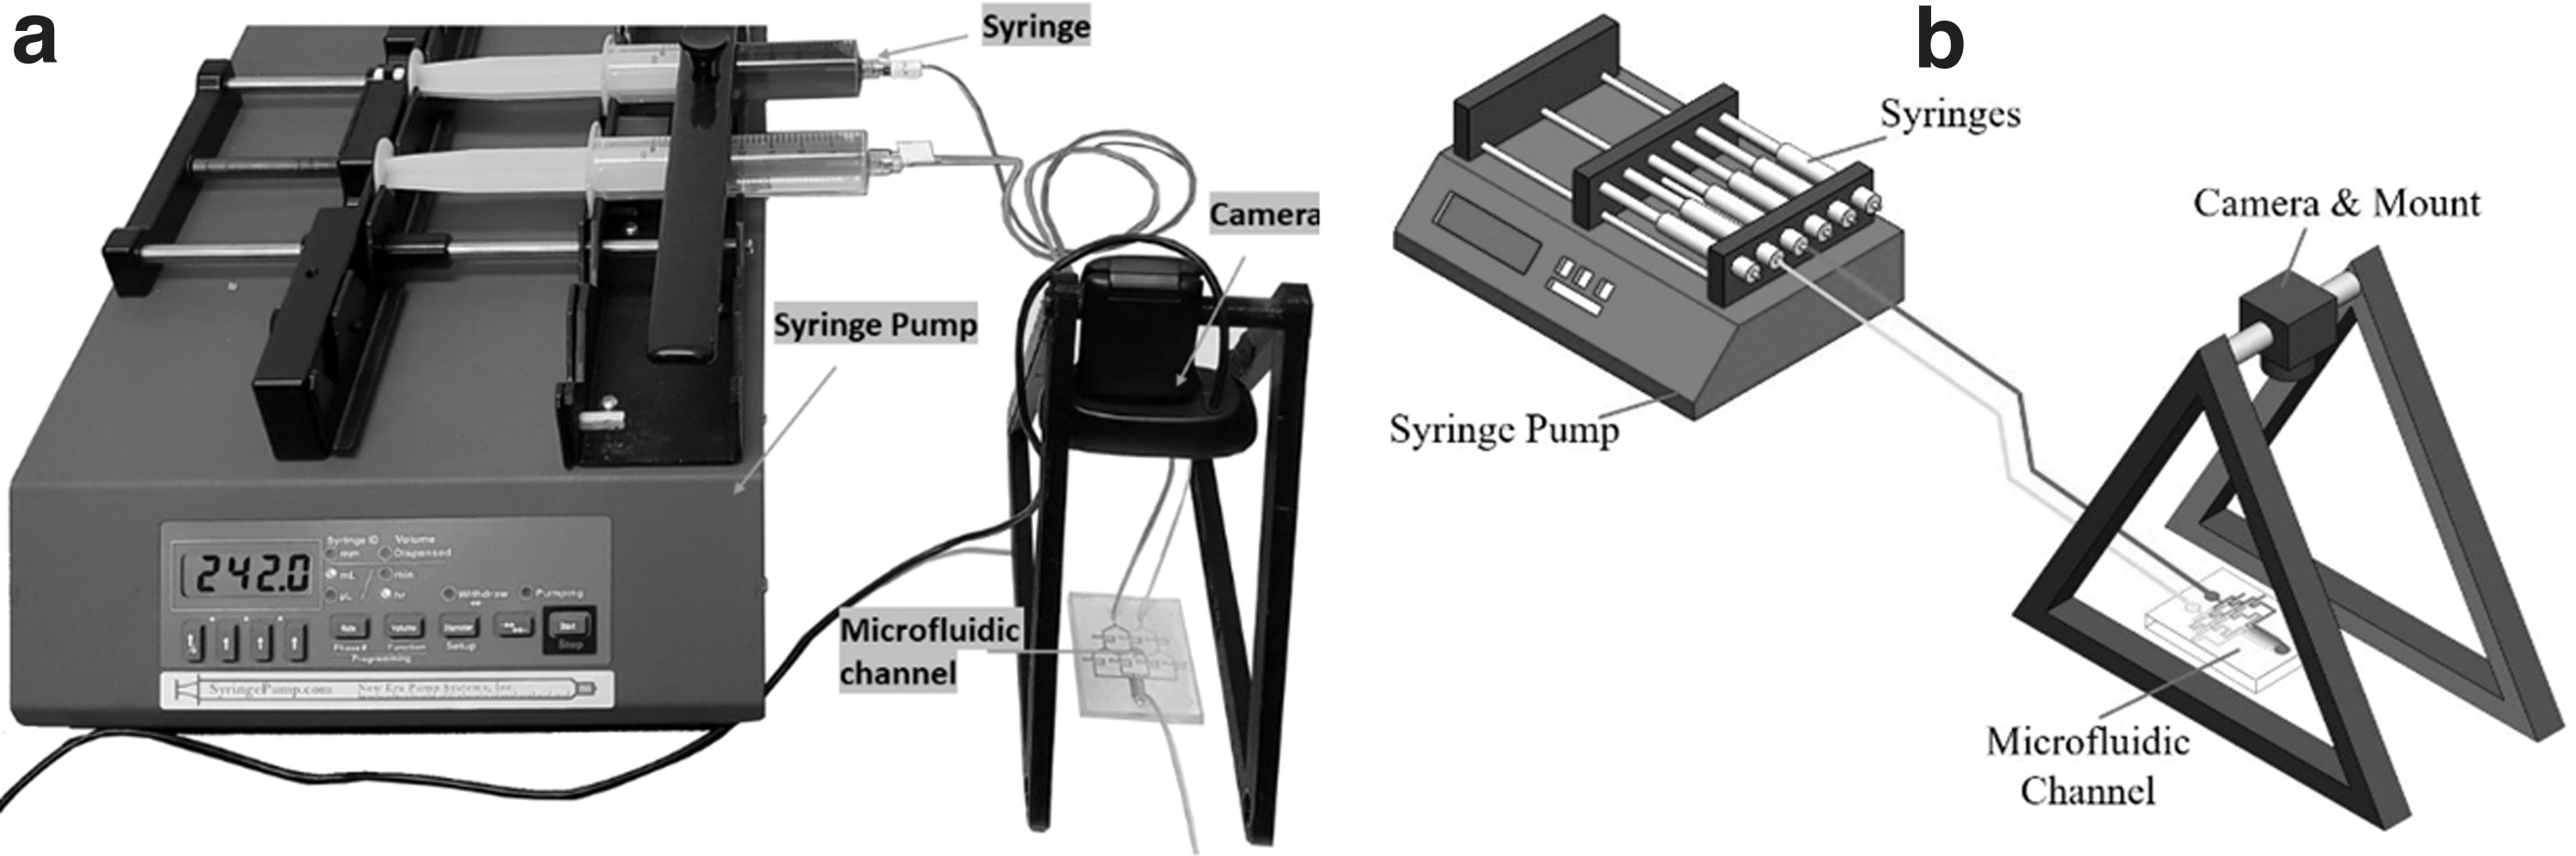
Experimental setup for a flow control analysis of microfluidic channel,
Operational Parameter of a Syringe Pump
Design of experiments
The initial step in this experiment's optimization is to establish the problems, objectives, and constraints. The following equation represents the optimization problem:
Where Y represents the response, which has a gap value
Factor Selected for an Experiment
The two factors
The gradient value is extracted for this experiment by measuring the color intensity of each gradient layer from each outflow. This study aims to get the linear value raised from each gradient. The linearity, as shown in the Figure 6, which shows the gap between outlets 1 and 2
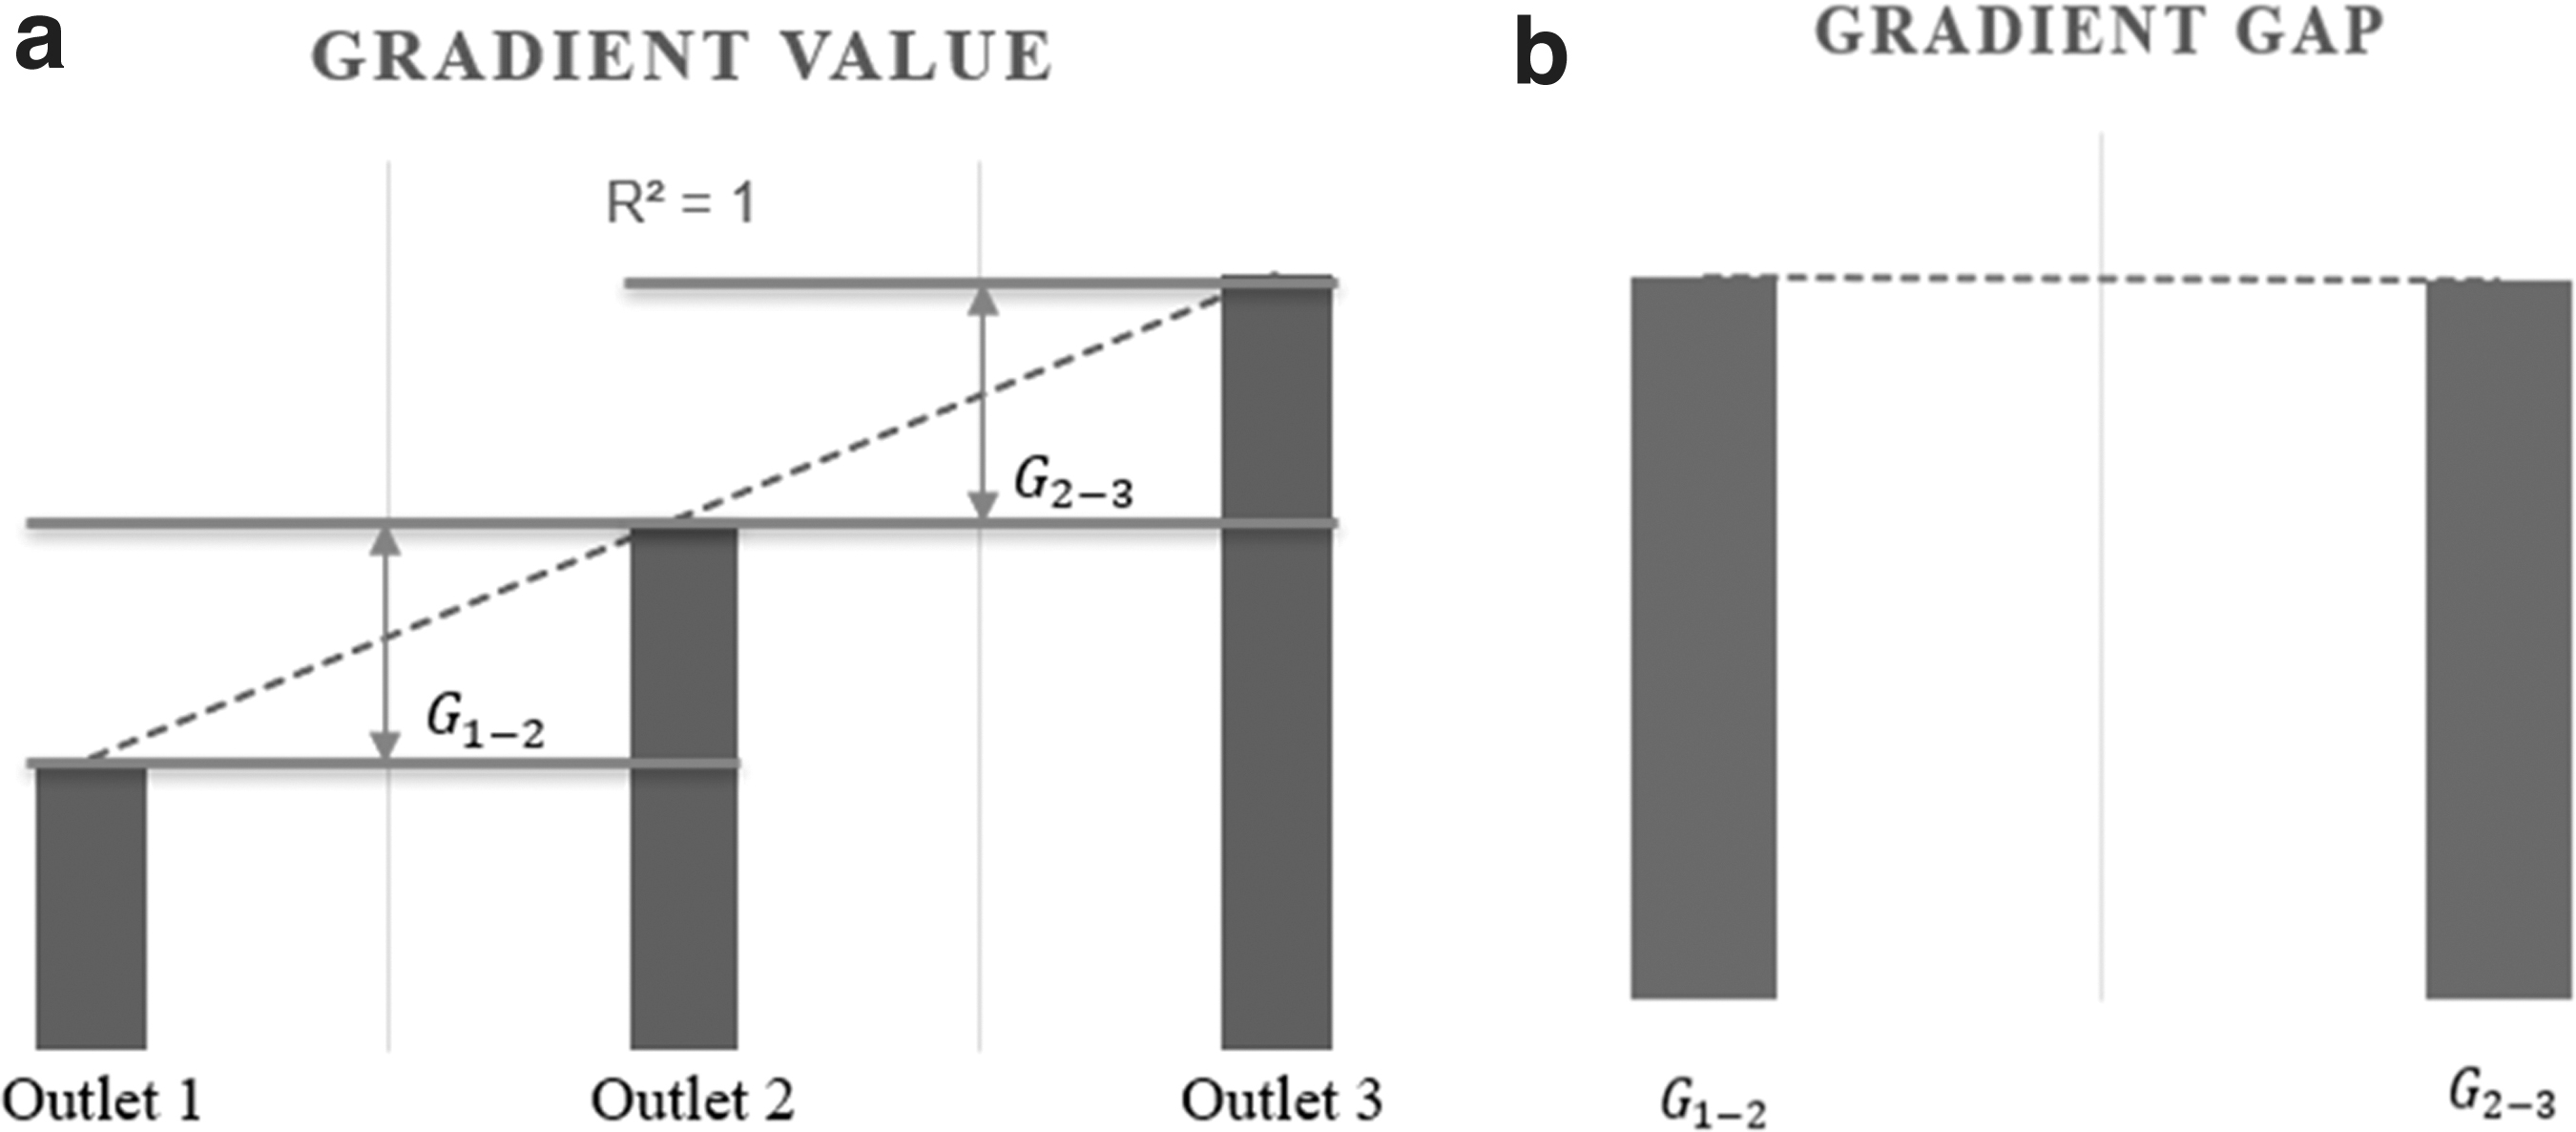
Gradient value visualization for linear rise,
To quantify the size of each gap in terms of a numerical response, such a gap between outlet 1 and 2
Similarly, the gap between outlets 2 and 3
Finally, an overall gap can be calculated using the Eq. (8),
The linearity rise value was calculated using the overall gap value. It is established that a lower overall gap value results in a better gradient, and an increase in linearity indicates that the gradient generated is stable. There are many nonlinear cases of gradient value rise, as illustrated in the Figure 7.
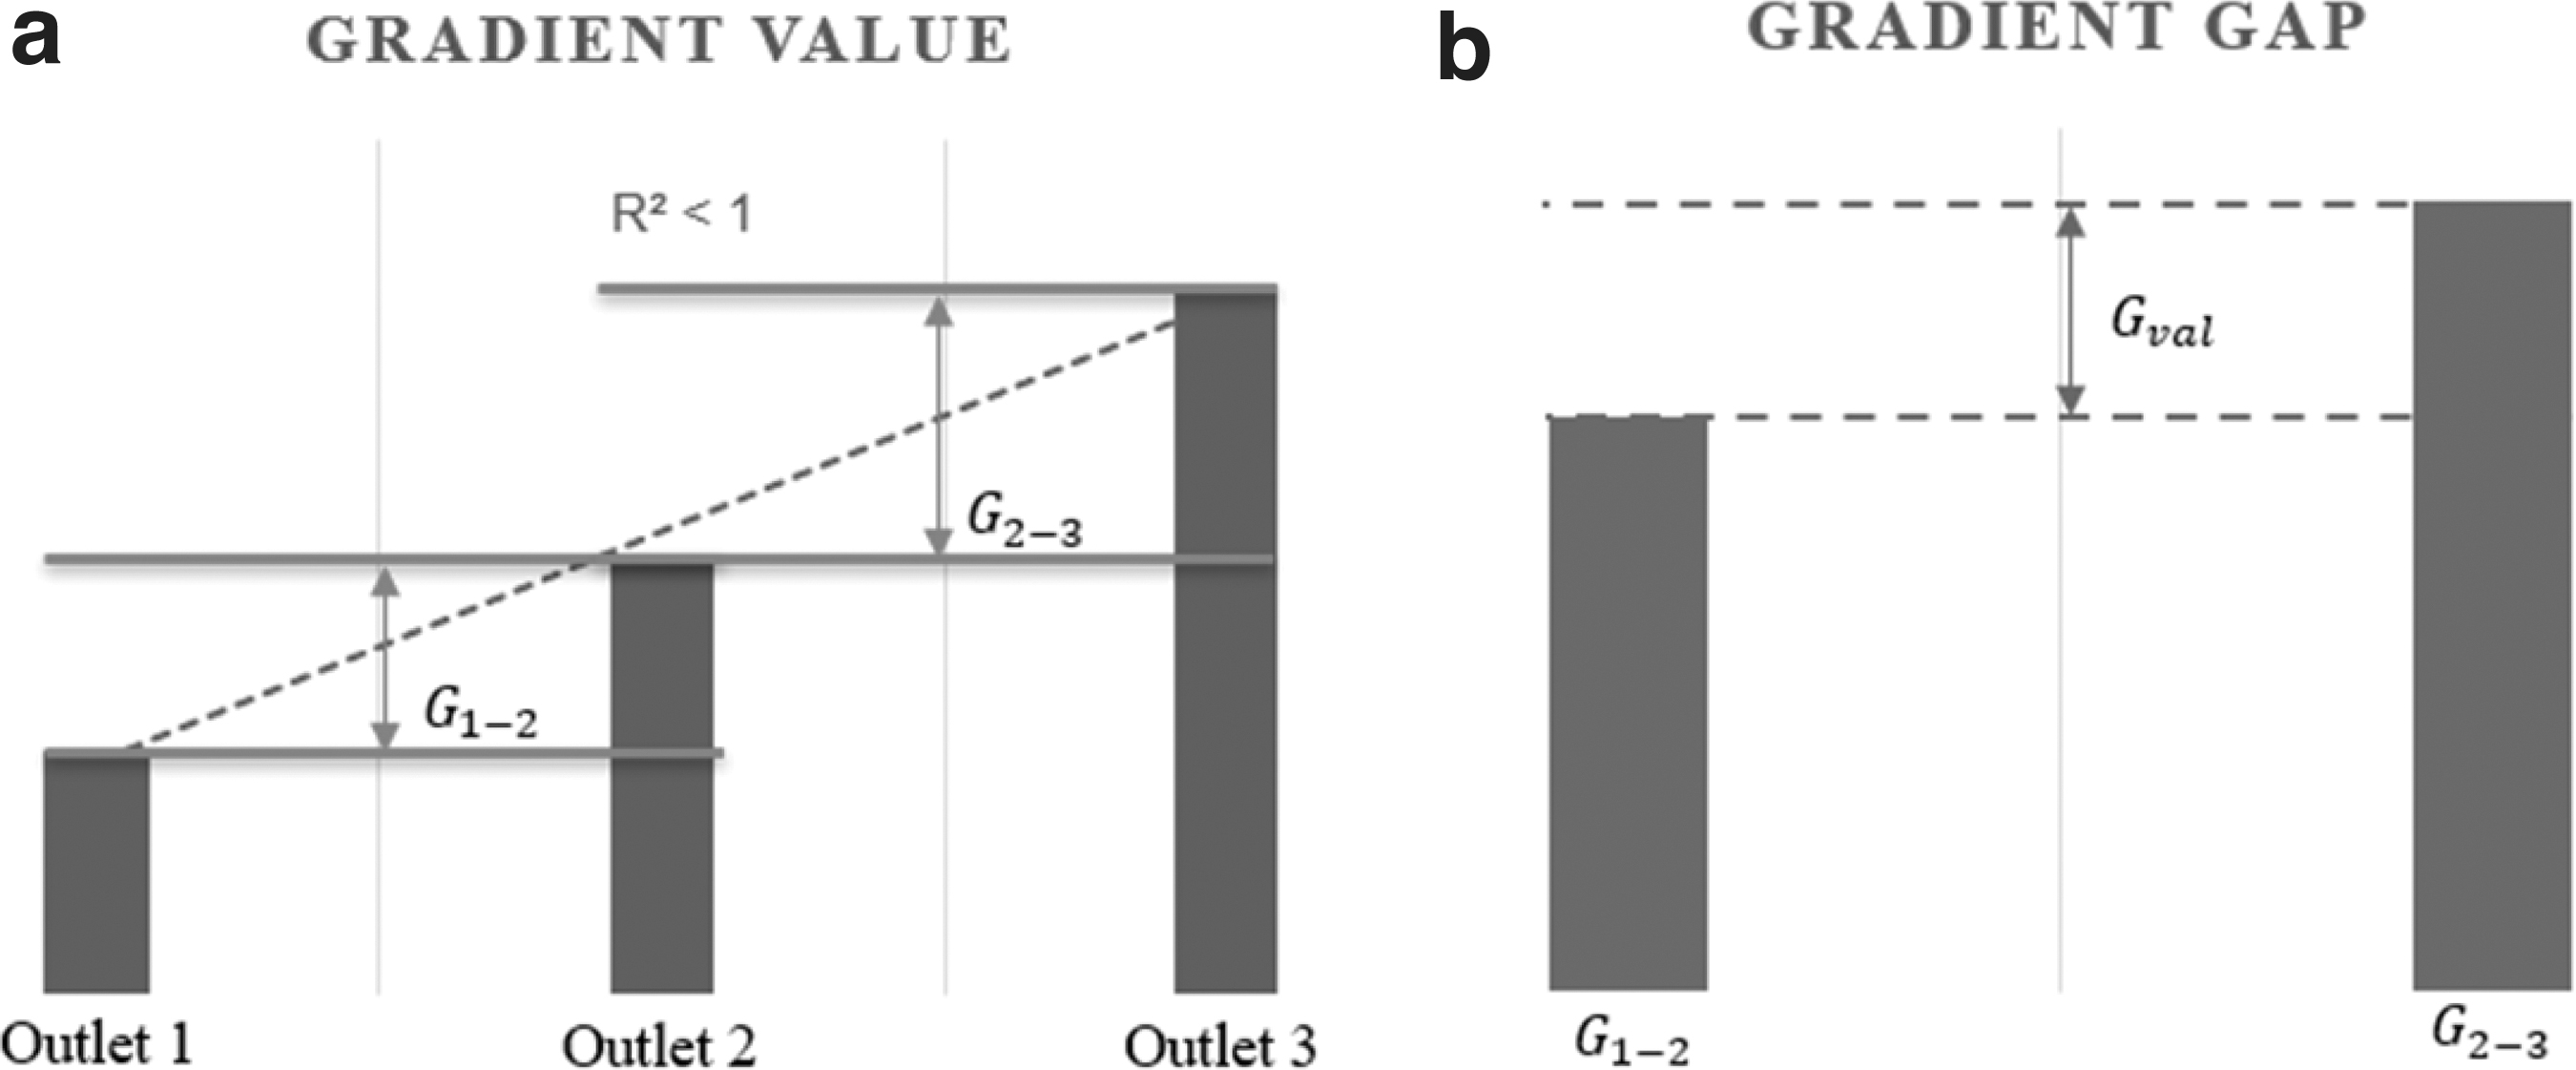
Gradient value visualization for nonlinear rise,
To enhance the validity of the response outcome, the orthogonal matrix generated for this experiment comprises a total of 13 experiment runs with one combination replica. The results of this experiment are shown in the Table 7.
Experimental Response
Results and Discussion
Optimization results using responsive surface method
After completing the experiment, a run is required for the response data, as shown in the Table 7. The regression equation for the gradient value gap
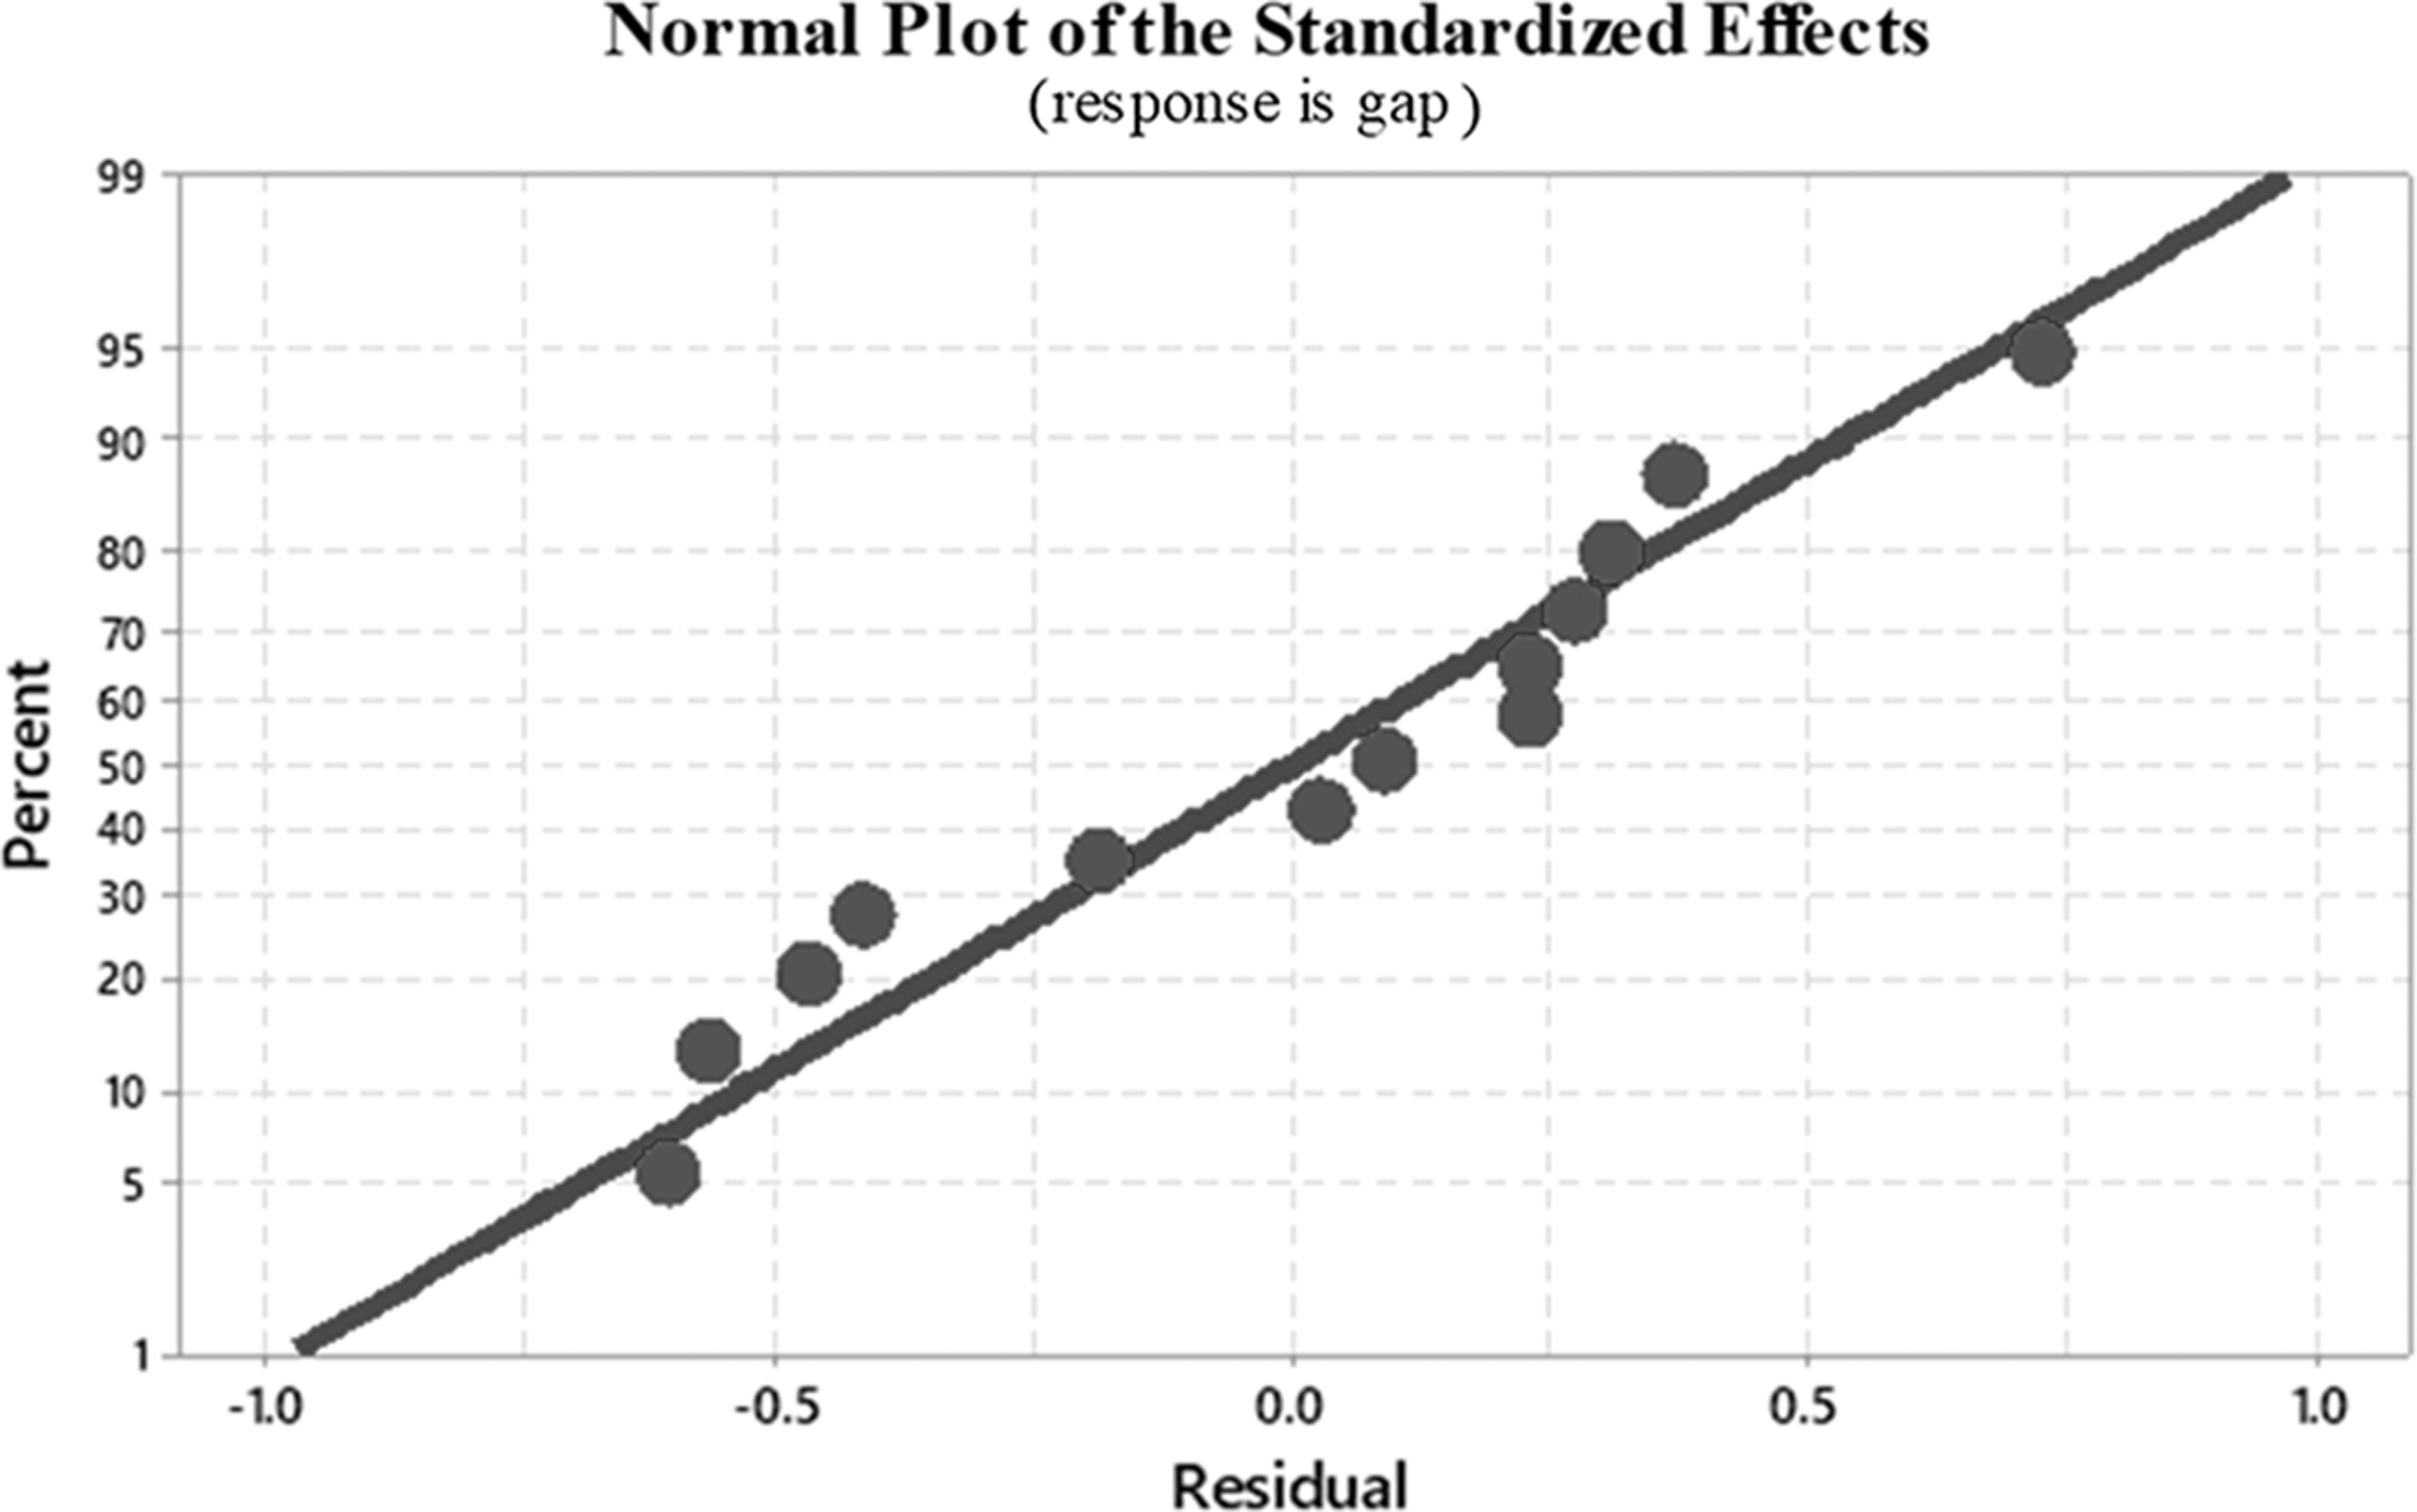
The significance of the selected factors (Dimension, Volume Flowrate, and Square of Dimension) is to demonstrate their magnitude of influence on the response based on the data received from the experimental run using the syringe pump setup. The influence of the selected factors was demonstrated through the Normal Plot of the Standardized Effects and Pareto Chart. The normal plot of the standardized effect, shown in Figure 8, indicates that the points far away from “0.0” are significant to the response. Dimension (A) and Volumetric Flowrate (B) are statistically significant and have positive standardized effects on the response. Meanwhile, Dimension (AA) squared is statistically significant and has a negative standardized effect on the response.
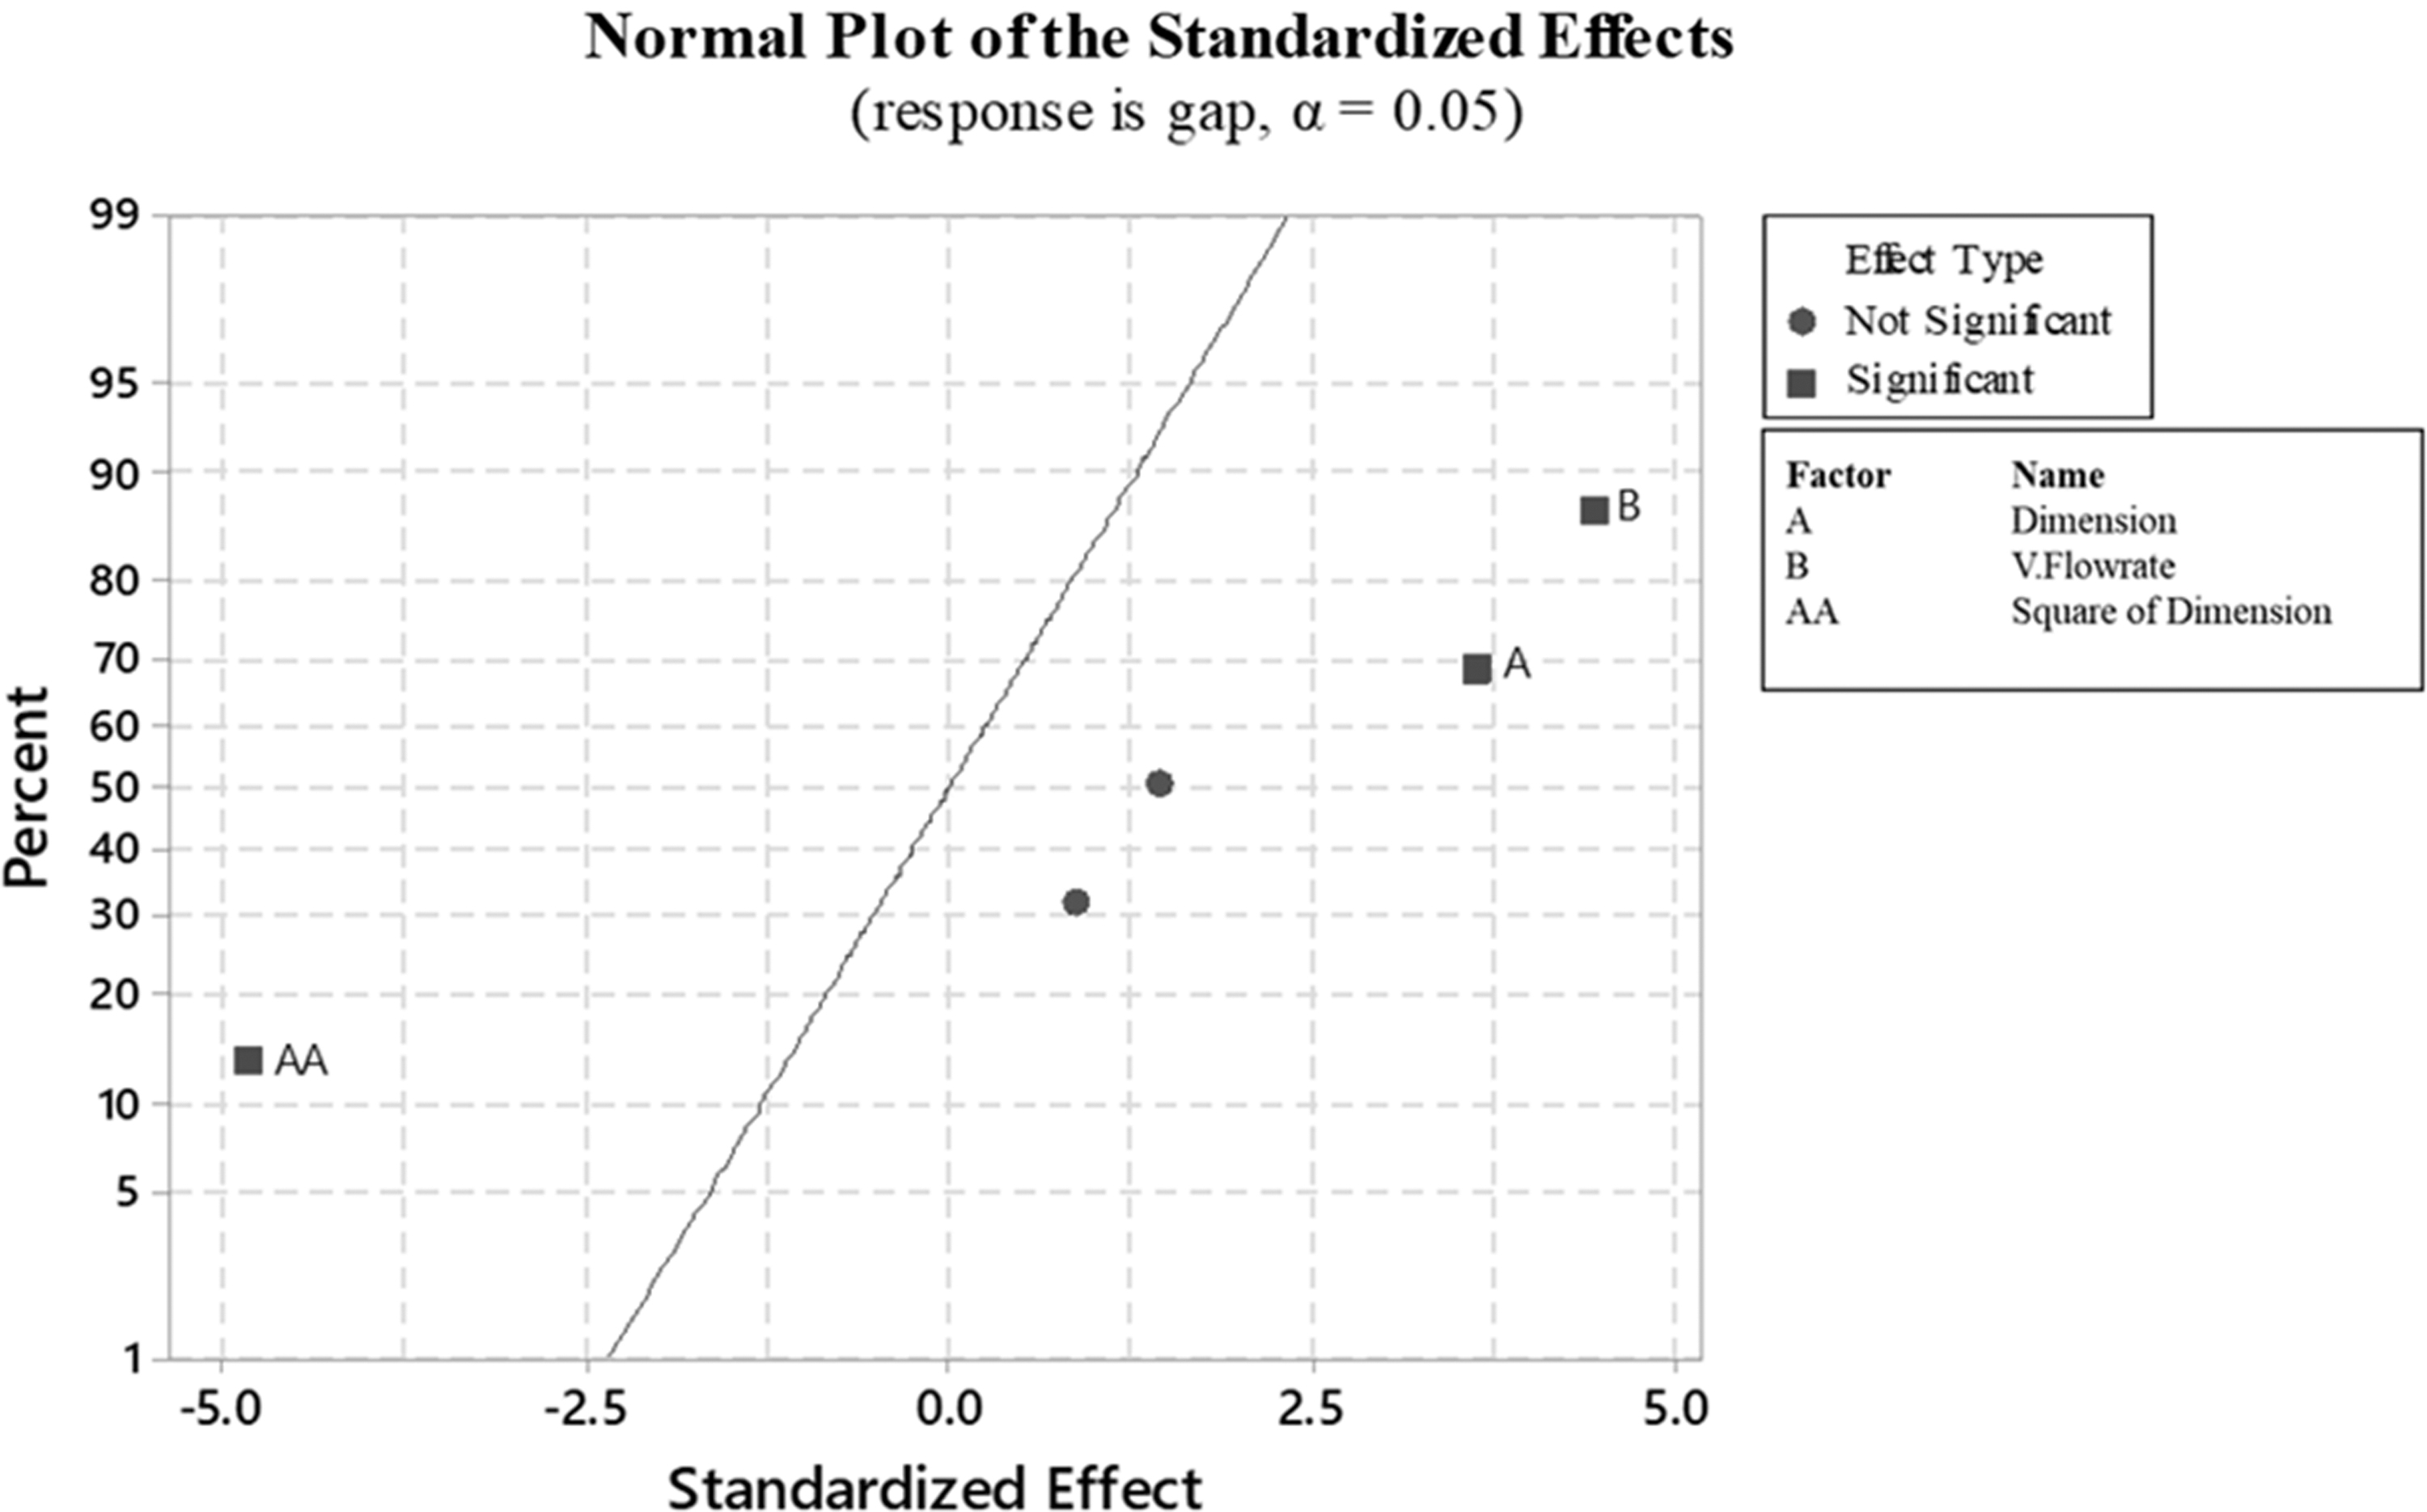
Normal plot for positive or negative standardized effects on the response of selected factors.
The importance and magnitude of factors used in the experiment are shown through the Pareto Chart illustrated in Figure 9. The reference line is shown in the dotted red line with a value of 2.365, and each bar that crosses the reference line indicates that it is statistically significant to the experiment's response or result. The residual dots remain in close range with the standard line illustrated in the Normal Probability plot shown in Figure 10, which means no problem arises with the experiment's model.
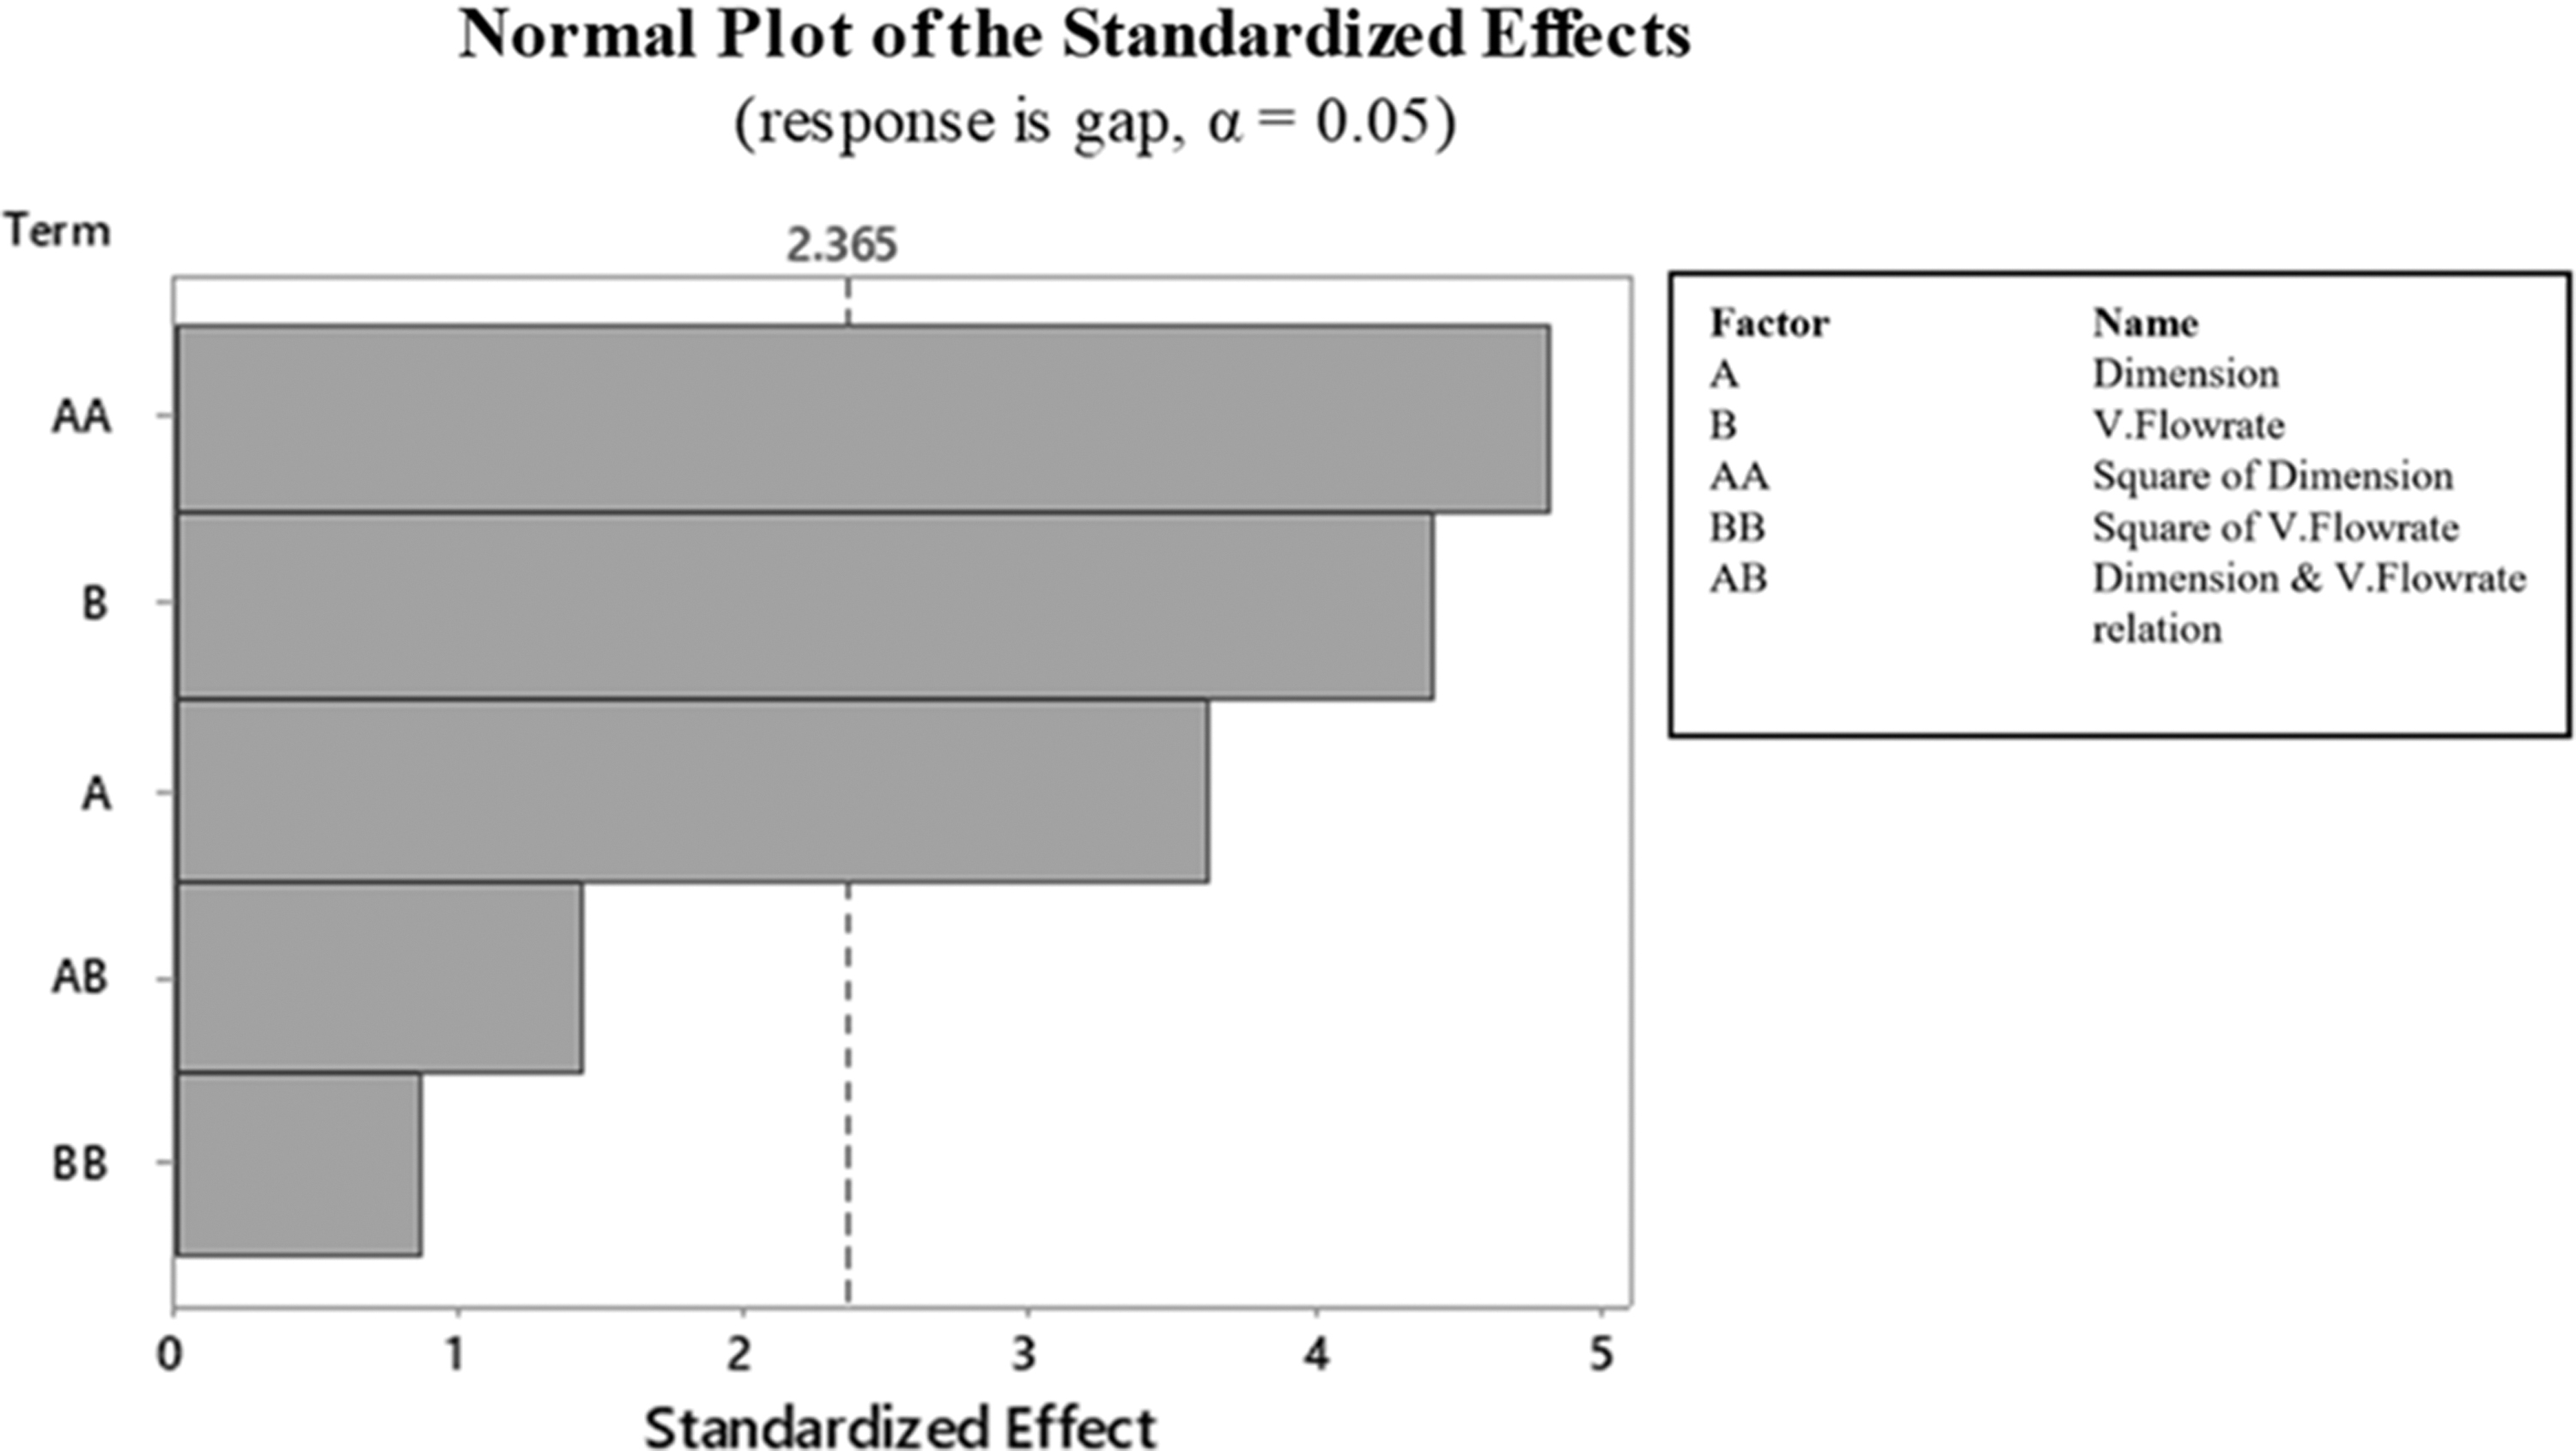
Pareto chart for evaluating the magnitude of selected factors of the experiment.
Normal probability plot of residuals.
The contour and the surface plot are shown in Figure 11, representing the channel dimension in the range of 635–680
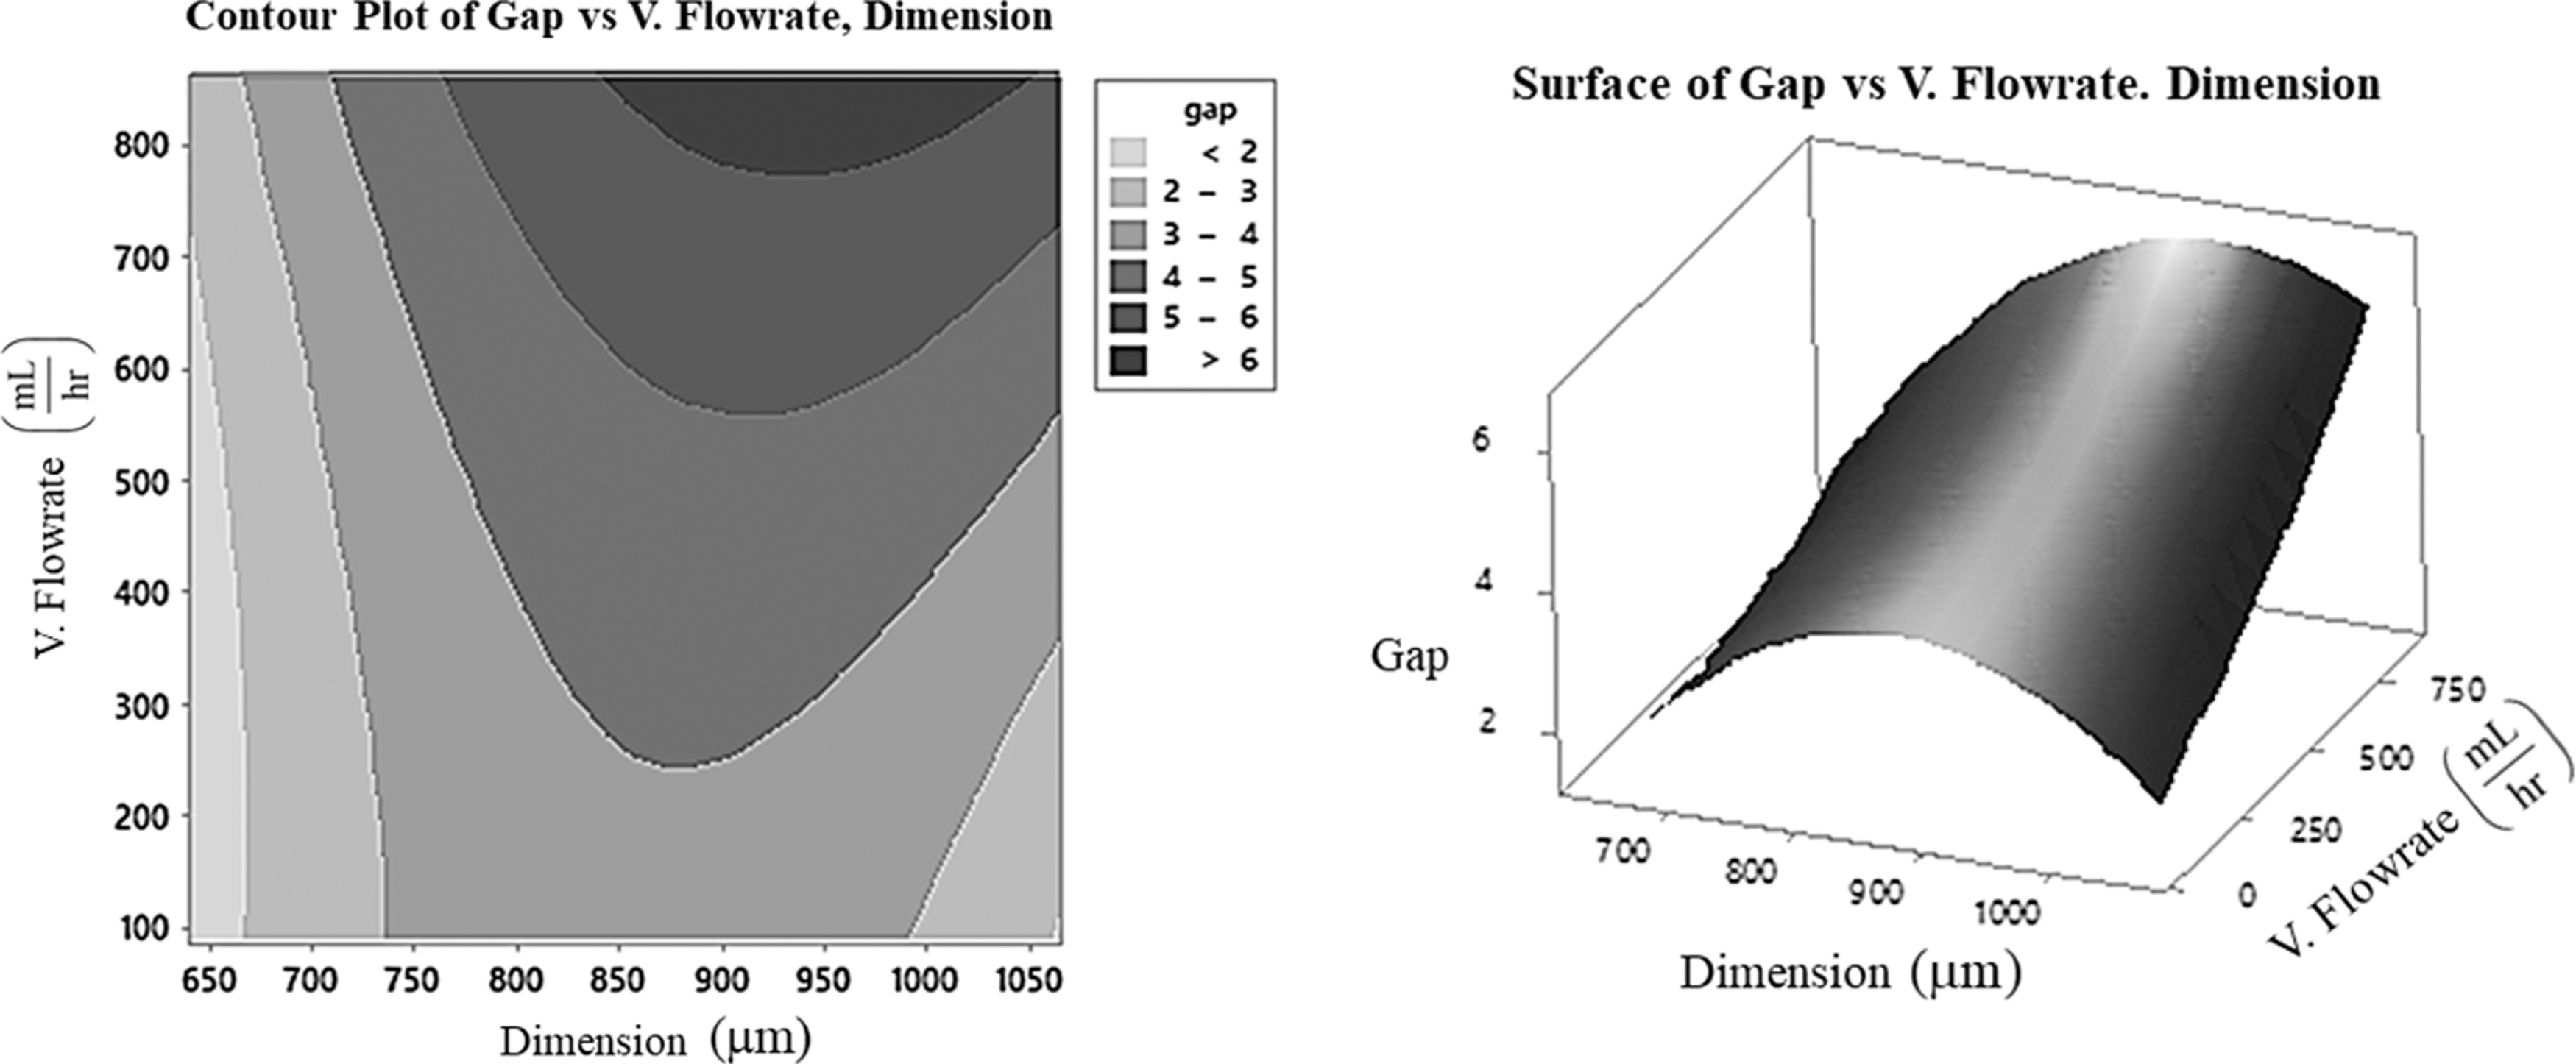
Contour plot (right) and surface plot (left) represent a combination of volumetric flowrate with channel dimensions for the gap value.
The response optimizer tool in Minitab software is utilized to attain optimal design for this experiment. The response variable

Minitab response optimization results to attain optimal design.
Optimal Experiment Conditions
Gradient results and analysis
After obtaining the optimal parameters using Minitab response optimizer tools, a 14th experiment run is performed to validate the optimization process's results. Figure 13 shows the color gradient image produced by the CGG design using optimal parameters from each outlet indicating the color gradient. Figure 13 was taken with an open chamber outlet design to improve image quality. Figure 14 shows the result of the CCG design using optimal parameters with converging outlets.

Experimental outlet color gradient results of CGG design using optimal design parameters. CGG, concentration gradient generators.

Experimental outlet color gradient results of CCG design using optimal converging outlet design parameters.
From the result of the 14th experiment based on the combination factor, the gradient value shows the possibility of a linear value rise, as shown in Figure 15. The linearity is measured using the

14th experiment outlet gradient value using optimal design parameter.
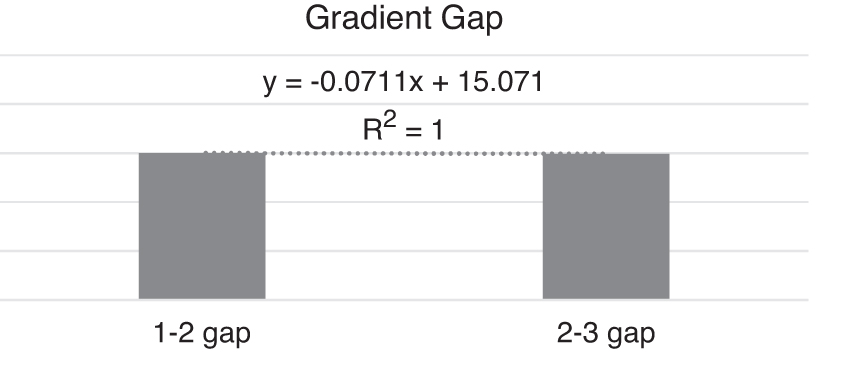
14th experiment outlet gradient gap results using optimal design parameter.
Computational fluid dynamics simulation results
The optimal parameter obtained through RSM is then analyzed through computational fluid dynamics (CFD) to determine the hydraulic resistance in the microfluidic channel system. After simulating with Fluid Flow analysis (FLUENT) in Ansys, the velocity vector results are shown in Figure 17. According to the simulation results, the velocity vector is distributed evenly throughout the mixers in the first and second mixing stages. The effect of a Y-type junction can be seen in the image above, which shows that it can adequately separate the fluids from contaminating each other. The pressure drop can be seen at the entrance to the mixing stage through the pressure contour results shown in Figure 18. The pressure drop caused by the mixing stage shows the hydraulic resistance in the fluidic channel system.

Result of CFD simulation for velocity distribution in a channel using ANSYS. CFD, computational fluid dynamics.

Result of simulation of pressure contour in a channel using ANSYS.
The hydraulic resistance present in the fluidic channel system is different to one another. The hydraulic resistance analyzed through the CFD results was computed as shown in Table 9. The first mixing stage generated 6.435E+09
Computation of Hydraulic Resistance Using Computational Fluid Dynamics
Cost Analysis
This experiment's material cost was divided into three parts: ABS filament for 3D printing, PDMS solution, and acetone for mold removal. The overall material cost of this experiment for the fabrication of a microfluidic device alone is shown in the Table 10, with total costs estimated to be around $20 USD. This means that the cost of a single channel made using this method was only about 1.42 USD. Compared to the other previously used method, the above cost per channel is relatively lower. For example, a plate of PMMA glass widely used for microfluidic chips (device only) costs about 55–70 USD. 66 With a similar dimension to that material, the cost per design of the system is around 55 USD.
Overall Cost for Fabrication of 3D Microfluidic Channel
PDMS, polydimethylsiloxane.
Conclusion
This research focuses on two aspects, the first of which is the design and fabrication of a 3D microfluidic channel using a 3D printing technique, and the second aspect is determining the best design for generating a stable concentration gradient suitable for biomedical applications. The fluidic channel was fabricated using the FDM 3D printing method. This method allows for fabricating a 3D channel layout without a complicated bonding process and is used as a removable mold without damaging the outer structure.
The experiment was conducted using the central composite design with two chosen factors (channel dimension and operating volumetric flow rate) for 13 experimental runs and an additional experiment for validation. The response from the experiment with both factors was analyzed using the RSM, resulting in the stable gradient generation with the combination of 640
In this study, we conducted a cost analysis using various methods previously used and discovered that the channel cost with this method is significantly lower when compared to others. In the future, the mold removal process could be improved by using an ultrasonic machine to reduce the time required to completely melt the ABS channel mold and allow much more complex channel designs to be made with this fabrication process. While this study lays a solid foundation for applying 3D printed microfluidic devices, there is ample room for further innovation and advancement. The future work outlined in this study aims to extend the capabilities of the CGG for applications such as antimicrobial susceptibility testing or more real-world applications and exploit its potential in microfluidic domains.
Footnotes
Authors' Contributions
R.T.A.S: Methodology, investigation, and software. B.P.: Writing—original draft and visualization. Y.-S.H.: Conceptualization and visualization. H.-Y.T.: Formal analysis and supervision. P.T.L.: Conceptualization, methodology, supervision, and project administration.
Author Disclosure Statement
No competing financial interests exist.
Funding Information
This article was supported by the National Science and Technology Council (NSTC), Taiwan (grant nos. MOST 110-2221-E-002-022, MOST 110-2923-E-011-006-MY3 and MOST 111-2221-E-002-001), and Intelligent Manufacturing Innovation Center and High-Speed 3D Printing Research Center at National Taiwan University of Science and Technology (NTUST), which are Featured Areas Research Centers in Higher Education Sprout Project of Ministry of Education (MOE), Taiwan.