




Abstract
Direct sound printing (DSP) is a recent development in additive manufacturing processes using sound waves, in which cavitation bubbles created by a focused ultrasound field polymerize the liquid resin via the sonochemistry route. This article presents the first attempt to create functional parts, such as cantilevers and millifluidic systems in polydimethylsiloxane using DSP. The numerical simulations of acoustic propagation in the DSP and possible high-pressure zones in different media during the process are presented. The printed parts were characterized, and porosity analyses of the printed parts and postprocessing of the ultrasound source motion were performed.
Introduction
Direct sound printing (DSP) 1 has recently been introduced as a new class of additive manufacturing (AM) processes for polymers and polymer composites based on sonochemical reactions. Parameters that govern chemical interactions are defined by the energy per molecule, interaction time, and pressure; these are the control parameters in the realm of chemistry.2,3 Common AM energy sources, such as light and heat, do not fully harness the potential of these chemistry control parameters. Sonochemistry pushes these parameters to their utmost limits. The extraordinarily high temperatures, high pressures, and rapid heating and cooling rates experienced inside the active cavitation bubbles induced by sound waves and surrounded by liquid at ambient temperature are the driving factors for sonochemical reactions. DSP has unlocked the potential of sonochemistry in AM processes, paving an unconventional path for printing materials that were previously deemed unprintable using traditional energy sources.
In DSP, chemical reactivity is driven by highly short-lived but extraordinarily high-temperature and high-pressure1,2 zones in the acoustic cavitation bubbles in printing materials. Highly focused ultrasound waves create localized cavitation bubbles in high-pressure zones in the printing material. The micrometer-sized high-pressure regions of the ultrasound fields generate chemically active cavitation bubbles, which transform the liquid heat-curing resin and polymerize it into a solid or semisolid.
Analogous to laser beams that cause photochemical reactions in photosensitive printing materials in stereolithography (SLA),4,5 the printing spots in DSP are called ultra-active microreactors (UAMRs) 1 generated by ultrasound fields. On-demand curing of the printing material is achieved by acoustic cavitation via the sonochemistry route instead of thermochemistry or photochemistry at these chemically active spots.
The applications of ultrasound in standard AM technologies are limited to droplet generation in inkjet 3D printing,6–10 improving the internal structure of the fabricated parts during the 3D printing process11–13 and preparing a composite printing filament for a (fused deposition modeling) printer. 14 In all these applications, the ultrasound field helps improving the printing processes and/or change the physical properties of the printing material to be printed by the common AM technologies without driving any chemical reactions. However, in DSP, ultrasound energy drives the chemical reactions, which results in the polymerization of the printing material, 1 similar to photopolymerization by a light source in SLA.
Heat-curing polymers such as polydimethylsiloxane (PDMS) are difficult-to-print materials. PDMS is an elastomer with good optical, electrical, and mechanical characteristics, making it suitable for various engineering applications. 15 PDMS is frequently used in biological applications owing to its biocompatibility. 16 There are three main methods for printing heat-curing PDMS. In the first method, PDMS viscosity is increased17–19 by an additive so that the deposited material maintains its shape when exposed to the heat source. This process is time-consuming, and an additive is required, which changes the material properties of the desired printed parts.
In the second method, PDMS is deposited in a supporting bath medium.20–22 The supporting bath helped to maintain the shape of the deposited PDMS. Once the release was complete, the bath and trapped liquid PDMS were exposed to heat for the curing step. This process requires a supporting bath, which needs to be removed afterward; therefore, it increases the postprocessing time. The third method utilizes the plasmonic heating effects of gold nanoparticles.23,24 Gold nanoparticles were added to the heat-curing PDMS system to provide on-demand curing of PDMS. Then, the mixture was exposed to a light source, where plasmonic heating in nanoseconds increased the polymerization rate. This method uses gold nanoparticles as an additive, which are difficult to extract after curing. 24 None of the aforementioned three methods can print the heat curing system of PDMS directly, and all of them require an additive or a support structure.
This study attempts to use DSP to print PDMS to create functional structures such as cantilevers or millifluidic systems. Cantilevers have many physical, biological, and chemical sensing applications, ranging from measuring fluid viscosity 25 to biomolecular interaction detection. 26 In this study, cantilevers were printed in PDMS by DSP and characterized and compared with similar cantilevers fabricated using molding methods. Fluidic systems, such as microfluidic devices, are dominated by the soft lithography of PDMS. 27 In this study, a millifluidic system was 3D printed using DSP for the first time. In addition to these applications, the finite element analysis of the acoustic propagation in DSP, postprocessing involved in the ultrasound source motion, structural porosity, and effective parameters are also discussed.
Process and Theoretical Studies
3D printing process
The 3D printing process is performed through layer-by-layer polymerization of the printing material using high-intensity focused ultrasound (HIFU) inside a printing cavity filled with the printing material. Figure 1 shows a schematic of the printing setup, including the HIFU transducer (H148; Sonic Concepts, Inc.), a pulse generator (TPO-102; Sonic Concepts, Inc.), computerized numerical control (CNC) machine, water tank, and printing cavity. The HIFU transducer is a spherically focused piezoceramic device with biomedical applications 28 that requires water submersion to transmit waves to the target medium. Using the HIFU transducer, 3D printing of the objects is performed at the transducer's fundamental frequency of 2.15 MHz with various driven powers in the range of 67–218 W and different duty cycles, including 30%, 60%, and 100%.
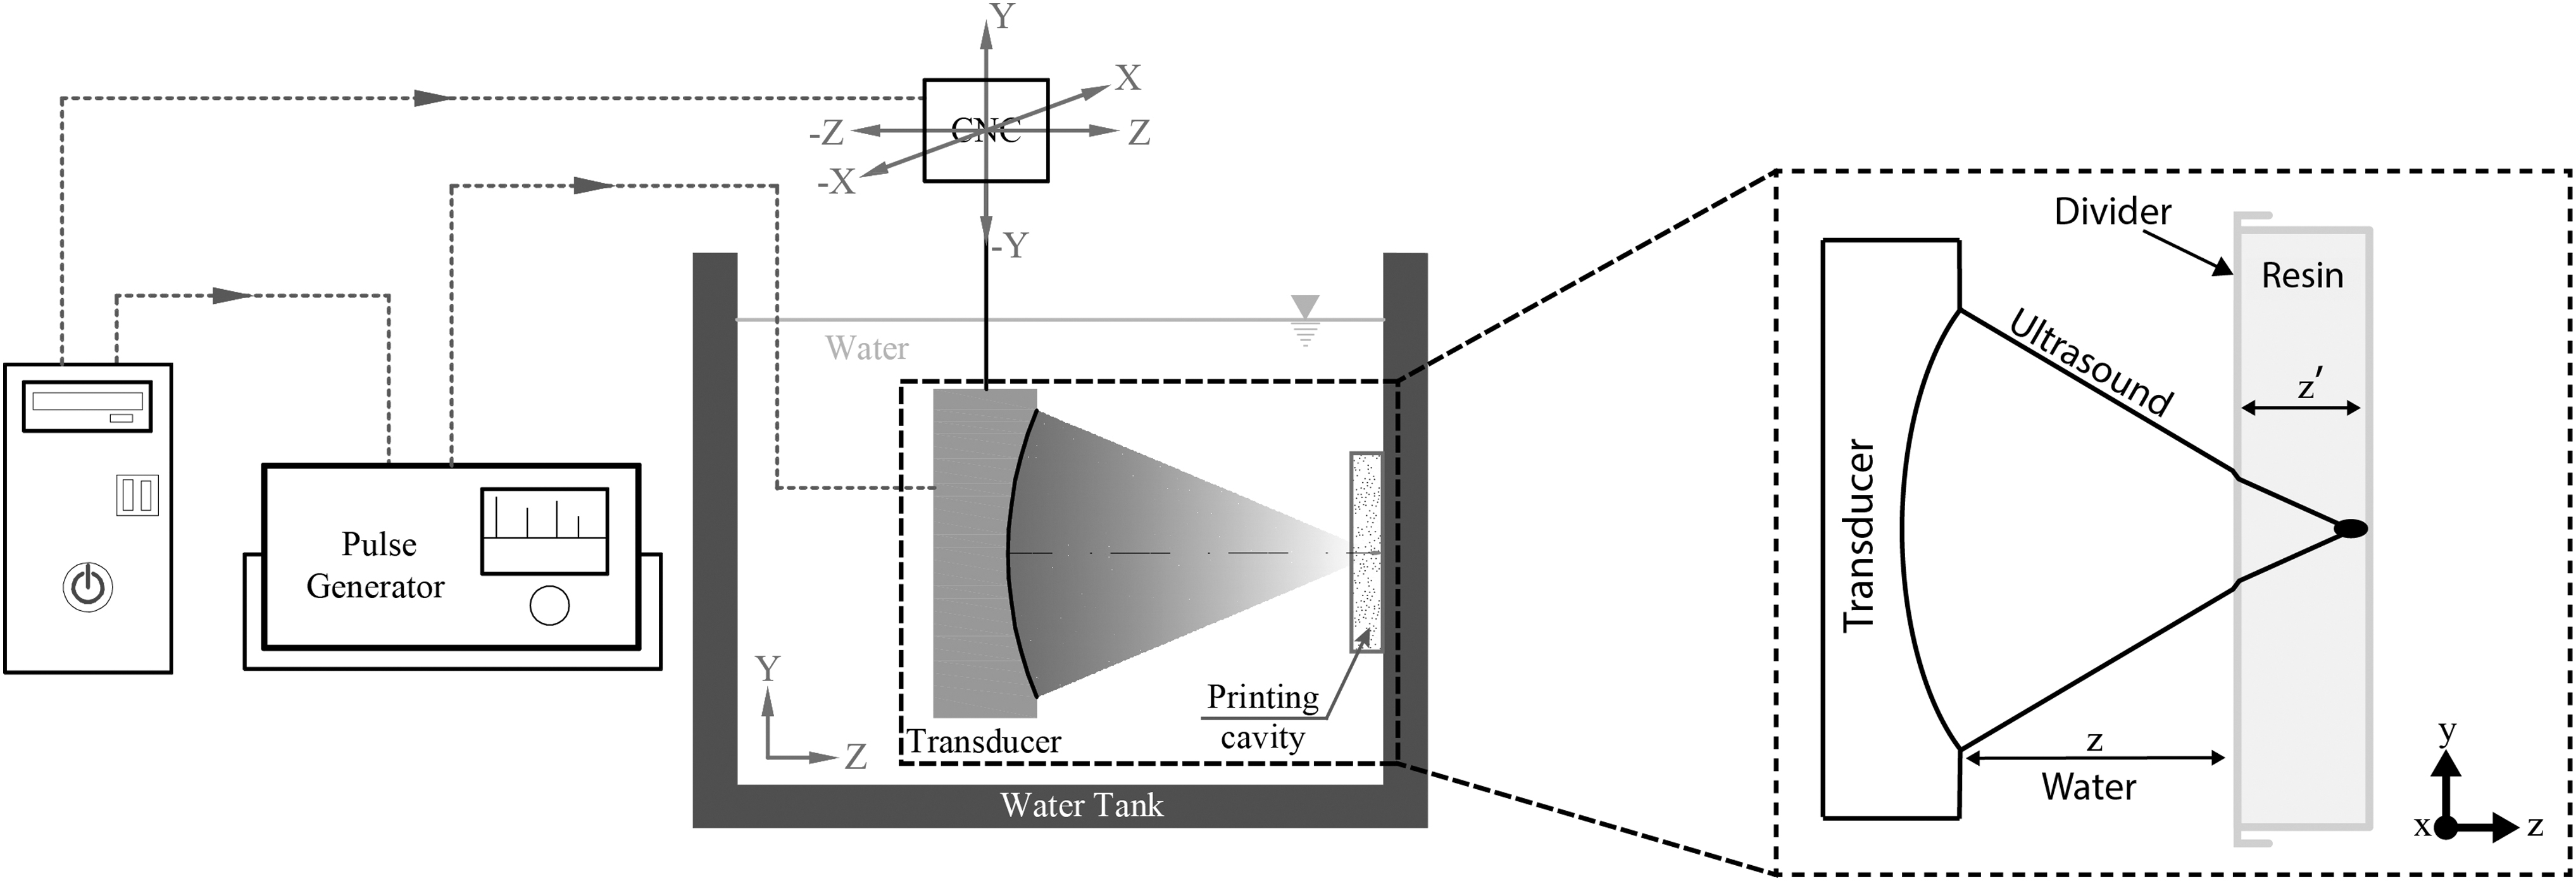
Schematic of printing setup and refraction of the acoustic beam in the printing cavity.
In the experiments, the printing material (PDMS) is prepared at different mixing ratios 5:1, 10:1, 20:1, and 30:1. It is important to note that the mixing ratio affects the structure of the printed objects, a topic that is explained in more detail later on in the Results and Discussion section.
HIFU wave interaction with printing cavity
In the DSP process, ultrasound waves are subjected to reflection and refraction at an angle when they pass through a resin-water separator, called a divider. While reflection reduces the energy of the transmitted ultrasound beam, refraction alters the direction of ultrasonic waves as they enter the printing cavity. Therefore, refraction can displace the focal point and move the focus near or far from the geometrical focal point. As a result, the 3D printer was calibrated for each divider material and various thicknesses.
The location of the transducer controlled by CNC with respect to the resin container dictated the location of the focal region in the printing material. To include the refraction effect on the location of the focal in the printing material, a postprocessor was developed to determine the relative position of the transducer and the focal region inside the resin cavity. The displacement of the focal region along the z-axis (shown in Fig. 1) inside the resin cavity is not equal to the transducer movement in the same direction because of the refraction of the acoustic waves.
The theoretical formula
Numerical analysis
To identify the locations of the critical high-pressure zones in the experimental setup, linear acoustic numerical simulations were conducted to include reflections and refraction from the printing cavity (the acoustic simulations have been validated with experiments in Ref. 1 by measuring the acoustic pressures with hydrophones).
Linear acoustic theory
Linear acoustic theory may be applied if the density variation is infinitesimal during the isentropic propagation of focused ultrasonic waves. Hence, the linear acoustic equation in the absence of a nonlinear acoustic effect is used and solved numerically in the frequency domain to determine the acoustic pressure distribution and location of the focal region inside the printing cavity. Equation (1) displays the frequency-domain representation of the linear acoustic equation:
where 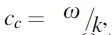 where the complex wave number k is expressed as
  and
and  where
where
HIFU wave propagation simulation
Simulations were performed in COMSOL Multiphysics 5.2 by solving the acoustical pressure field in the frequency domain. Figure 2 illustrates the numerical model. This simulation determined the position of the focal region inside the printing cavity and the impact of using numerous dividers on the acoustic pressure field. The model consists of two main components: a sound propagation medium and the HIFU, as shown in Figure 2. The generated ultrasound propagates into the water, passes through the plastic divider, mimics the front face of the printing cavity, and eventually propagates inside the printing material. The location of the focal point inside the cavity can be changed by adjusting the distance between the transducer and the divider.
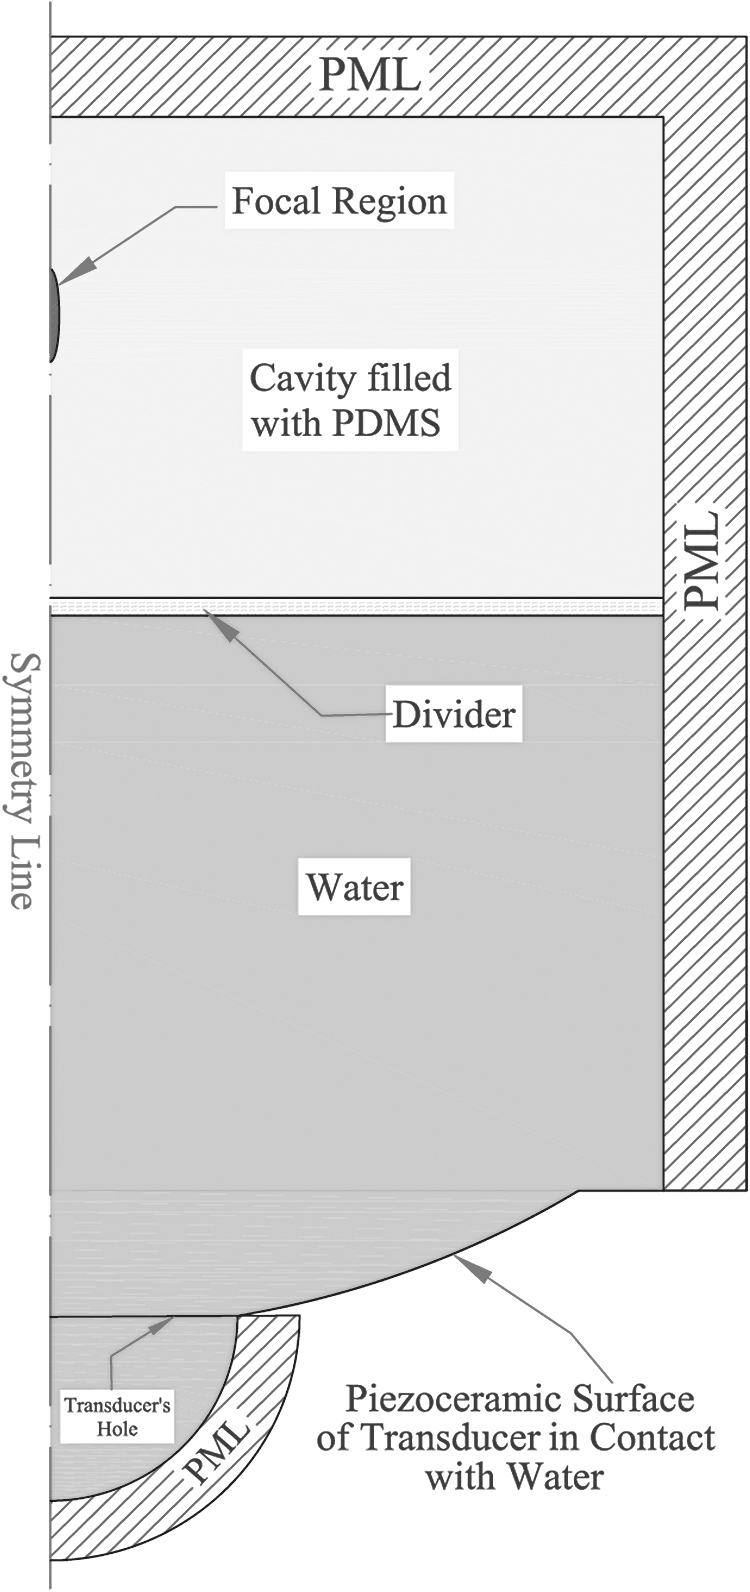
The 2D axisymmetric model used in the COMSOL simulation. 2D, two dimensional.
It is assumed that the water medium has homogeneous acoustic properties and that the geometry of the model's components is symmetrical. Owing to the shorter computing time, the two-dimensional (2D) axisymmetric assumption for the acoustic field model provides a good approximation. The model assumes that the 5 mm perfectly matched layer (PML) region absorbs the emitted acoustic waves. The model assumes that the 5 mm PML region absorbs the emitted acoustic waves. For minimizing the computation time and cost, a subset of the actual experimental setup, including the focal region and printing cavity, is studied. As a result, the PML serves as a robust approximation for simulating the extension of the medium by effectively absorbing propagating waves without introducing reflections from the interface between the PML and the physical domain.
In addition, our published results in Ref. 1 demonstrate a good agreement between experimental and simulation acoustic pressure results when utilizing the PML boundary condition.
The dimensions of the rectangular liquid cavity and divider in Figure 2 are 42 × 35 mm (width × height) and 42 × 1.1 mm (width × height), respectively. The transducer model had a 63.2 mm focal length, an aperture diameter of 64 mm, and a 22.6 mm hole at the center. The normal displacement boundary condition with an inward normal displacement amplitude of 21.22 nm is applied to the transducer. This simulates the scenario where the transducer operates at its maximum power of 218 W, achieving 85% acoustic power efficiency and resonating at its natural frequency of 2.15 MHz.
Mesh configuration
Fine triangular meshes with a size of
Material properties
Tables 1 and 2 list the properties of the materials used in the COMSOL simulation.
Divider Material Properties
Source: Ref. 29
Properties of Liquids Used in COMSOL Model
PDMS, polydimethylsiloxane.
Numerical analysis results
Figure 3 shows the results of acoustic simulations of the domain shown in Figure 2 when two materials (polystyrene and acrylic) are used for the divider. Figure 3a.i illustrates that the minimum pressure in the cavity is enough to initiate cavitation, as observed in Ref. 1. It is interesting to observe from Figure 3a.i and ii that the highest pressure happens in front of the cavity in water, not inside of the cavity, due to the effect of reflection from the divider surface. The reflection of the waves reduced the pressure at the focal point inside the cavity of PDMS. Compared with polystyrene, acrylic has a higher acoustic impedance, allowing less energy to travel through it.
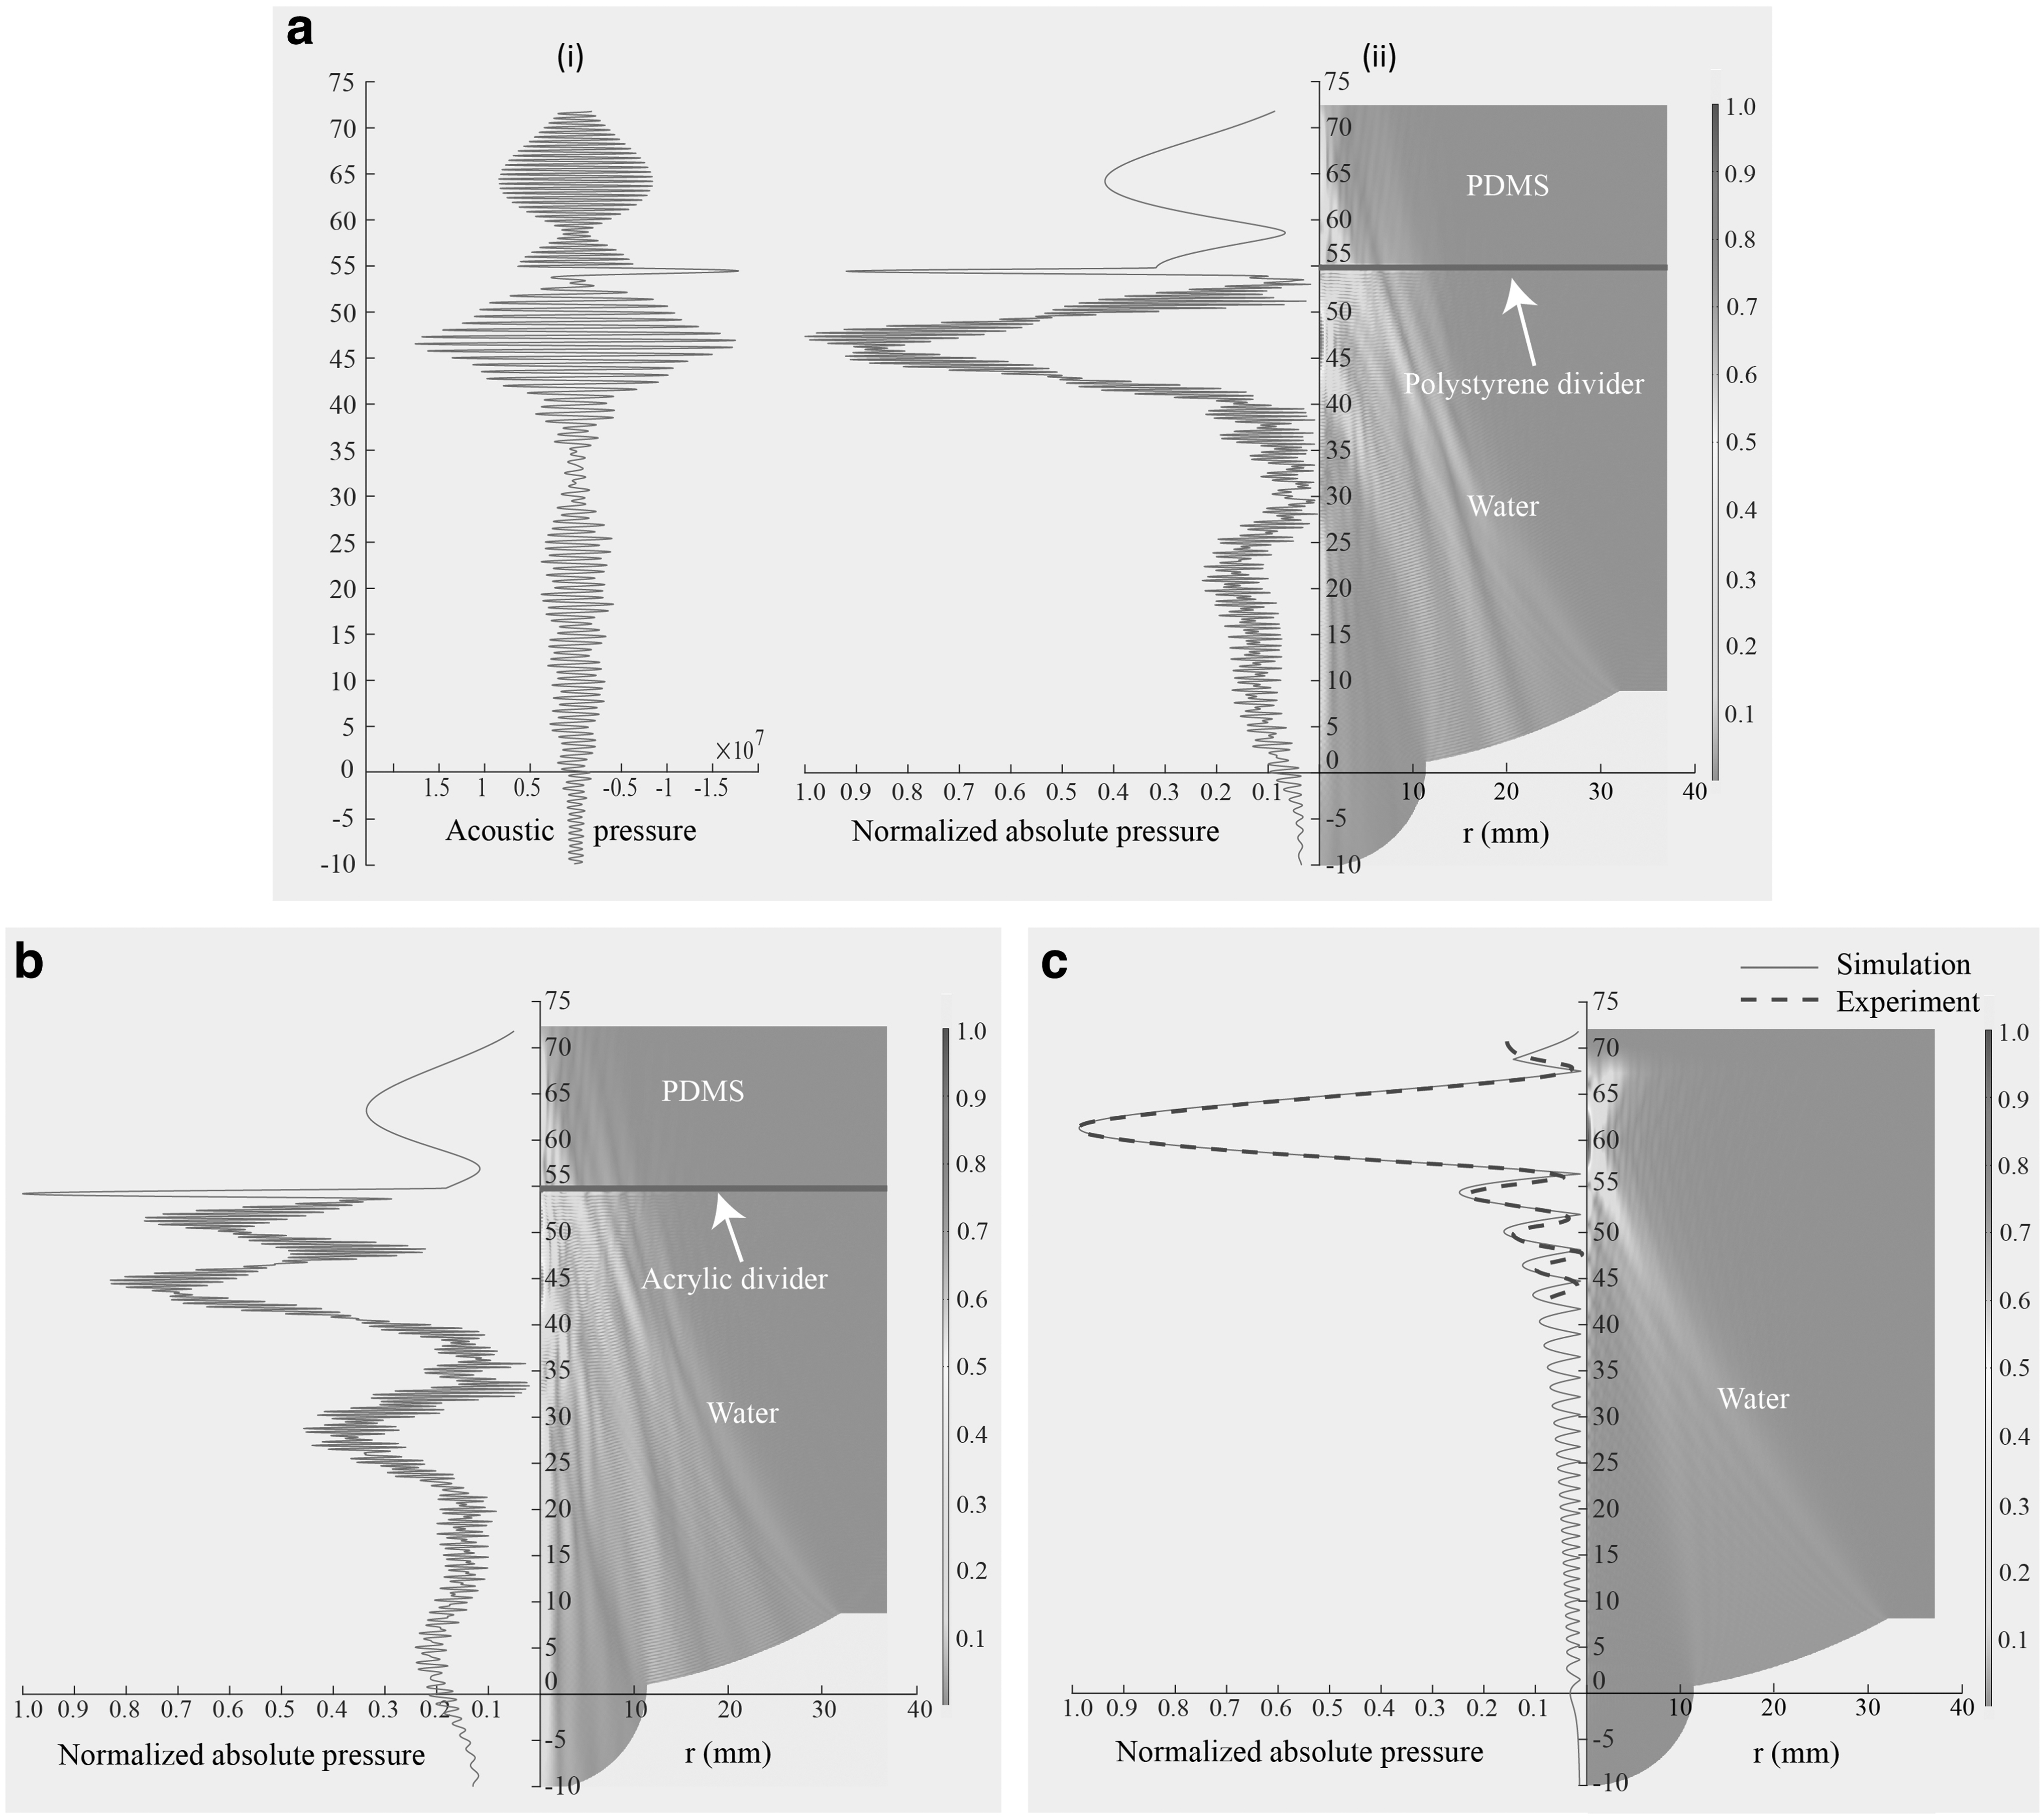
Axial wave pressure graph and acoustic pressure field propagated through
As a result, the magnitude of the acoustic pressure inside the PDMS cavity with the acrylic divider is lower than that of the polystyrene divider, as shown in Figure 3a and b. Figure 3c displays the axial normalized pressure graph inside a water medium obtained from the numerical analysis and experiment provided by the transducer manufacturer (Sonic Concepts Co.). 34
In addition, Figure 3 illustrates that due to the lower speed of sound in polystyrene compared with acrylic, the high-pressure zone within the polystyrene cavity is narrower. This zone forms ∼3 mm closer to the rear of the cavity compared with the acrylic one. A narrower high-pressure focus aids in achieving smaller feature sizes.
Figure 4a displays the normalized pressure at the geometric focal cross section (XY), which was reproduced using the test report provided by the transducer manufacturer (Sonic Concept Co.). 34 Figure 4b–d illustrates the normalized pressure at the geometric focal cross section (r plane) computed from the numerical analysis.

Lateral normalized pressure graphs at the geometric focus inside the
The axial and lateral pressure graphs presented in Figures 3 and 4, respectively, were used to calculate the size of the focal region based on the −6 dB drop-off point criteria.
1
Using the computed pressure distributions, the length (Lf) and the width (Wf) of the ellipsoid focal regions are determined (
Cavitation and its effect on 3D printing process
The propagation of HIFU waves through a liquid medium can cause cavitation, which is associated with the emergence, expansion, and collapse of bubbles. Cavitation is the result of subjecting the fluid in the focal region to negative and positive pressure amplitudes. Cavitation can be classified into two forms: stable and inertial cavitation. When a bubble is exposed to a low acoustic pressure field, stable cavitation occurs, causing it to oscillate steadily without bursting. However, inertial cavitation occurs when a high-exposure pressure field causes violent bubble collapse. The bubble expansion and rarefaction result in the generation of short-lived local high temperature, pressure, and free radicals.35–37
Cavitation bubble dynamic and geometric characteristics depend on ultrasound wave modulation parameters such as duty cycle, frequency, pressure amplitude, and propagation medium. 38 The occurrence of cavitation during the DSP process results in the fabrication of porous and nontransparent objects. In this study, the internal structure of printed objects was examined using image processing to characterize pores geometrically as a function of the input power, duty cycle, and mixing ratio.
Materials and Methods
Material preparation
PDMS preparation for the 3D printing tests was performed using SYLGARD 184, a PDMS kit (Krayden). The PDMS components, including the monomer and curing agent, were mixed in ratios of 5:1, 10:1, 20:1, and 30:1. The prepared mixture was then degassed for approximately an hour.
3D printing and postprocessing
The numerical studies indicated that a narrow focal region forms close to the substrate when utilizing a polystyrene divider. In addition, polystyrene is one of the common materials that PDMS is typically cured in contact with. 39 As a result, the DSP printing process is carried out inside the polystyrene cavity with a constant wall thickness of 1.1 mm, filled with PDMS. Initially, the results from the theoretical studies and the equation introduced in the HIFU Wave Interaction with Printing Cavity section were used to determine the transducer's location with respect to the cavity. However, a slight adjustment was made to precisely place the focal point at the backing surface of the cavity, which is called the substrate.
After the printing process, the objects were washed with isopropanol (IPA) to remove any remaining uncured PDMS. The parts were then placed in an oven at 50°C for 30 min to vaporize the IPA residue.
PDMS mold fabrication and casting a PDMS cantilever
Mechanical property tests are performed on printed and molded PDMS cantilevers with identical geometries to study the performance of the 3D printing process. The conventional molding process is used to fabricate a copy of the 3D-printed objects. The mold is made of Sylgard 184 using the following process. First, the printed object is washed with IPA and placed in an oven at 50°C for 10 min to vaporize the IPA residue. The dried part is silanized using fluorinated silane (Trichlorosilane; Sigma-Aldrich, Inc.) for 4 h at 65°C to ease the removal of the beam from the PDMS mold. Next, the object was fixed inside a container prepared for casting. The container is filled with degassed PDMS at a 10:1 ratio and placed in an oven at 70°C for 2 h to complete the curing process. Finally, the object is removed and the mold is used for casting.
The casting process begins by silanizing the mold for 4 h at 65°C. The degassed PDMS is then transferred into the mold, and the set is placed in an oven at 70°C for 2 h. Finally, the cured PDMS object is removed from the mold to perform the tests.
Stiffness measurement of cantilevers
A precision-balancing method is used to determine the linear stiffness of the 3D-printed and molded PDMS cantilevers from the induced force caused by the applied deflection at the tip of the cantilevers. A schematic of the setup is shown in Figure 5. Each 3D-printed and molded cantilever was individually mounted on a positioner. As shown in Figure 5, to transfer the generated force from the cantilever to the balance, a solid attachment is glued to the surface of the balance (Ohaus Scout Pro Portable Electronic Balance, 200 g capacity, 0.01 g accuracy). The attachment tip was placed 1 mm ahead of the cantilever tip. A sample mass is placed in the center and out of the center on the tip of the attachment to examine the impact of out-of-center inaccuracy caused by the attachment. 40

Schematic of the force balance setup for calculating the force at the cantilever's tip.
The test was repeated five times. According to the obtained results, the out-of-center error for this system was disregarded, because the observed deviation from the out-of-center error was 0 g.
The stiffness measurement experiment is carried out as follows. While zero force is displayed on the balance screen, the micropositioner is gradually lowered until the tip of the cantilever touched the attachment. This location is regarded as the starting point of the measurement. Then, the cantilever is moved downward in the step of 0.25 mm until reaching a total displacement of 2.5 mm. The force variation (F), shown by the balance, is recorded at each step against the total applied displacement (d). This procedure is repeated thrice for each beam.
Scanning electron microscopy imaging
The internal structures of the printed objects are studied using scanning electron microscopy (SEM). A Hitachi SEM S-3400N (Hitachi) is used to capture the pore distribution images inside the fabricated parts.
To prepare the SEM samples, thin films are extracted from the 3D-printed objects by crosscutting them at different locations. A 60 nm of the gold layer is deposited on the surface of the films after being fixed on the SEM sample holder.
Image processing
The MATLAB code 41 is used to analyze the SEM images and determine the size of the pores on the film surface.
Experiments and Applications
To investigate the parameters affecting the 3D printing process, multiple walls under different printing conditions are fabricated and characterized. Then, the findings from the 3D printing of the walls are implemented in the fabrication of functional PDMS structures, including millifluidic channels and cantilevers. Finally, the functionality of the printed objects is examined through leak and mechanical tests, as explained below.
3D printing of the walls and SEM imaging
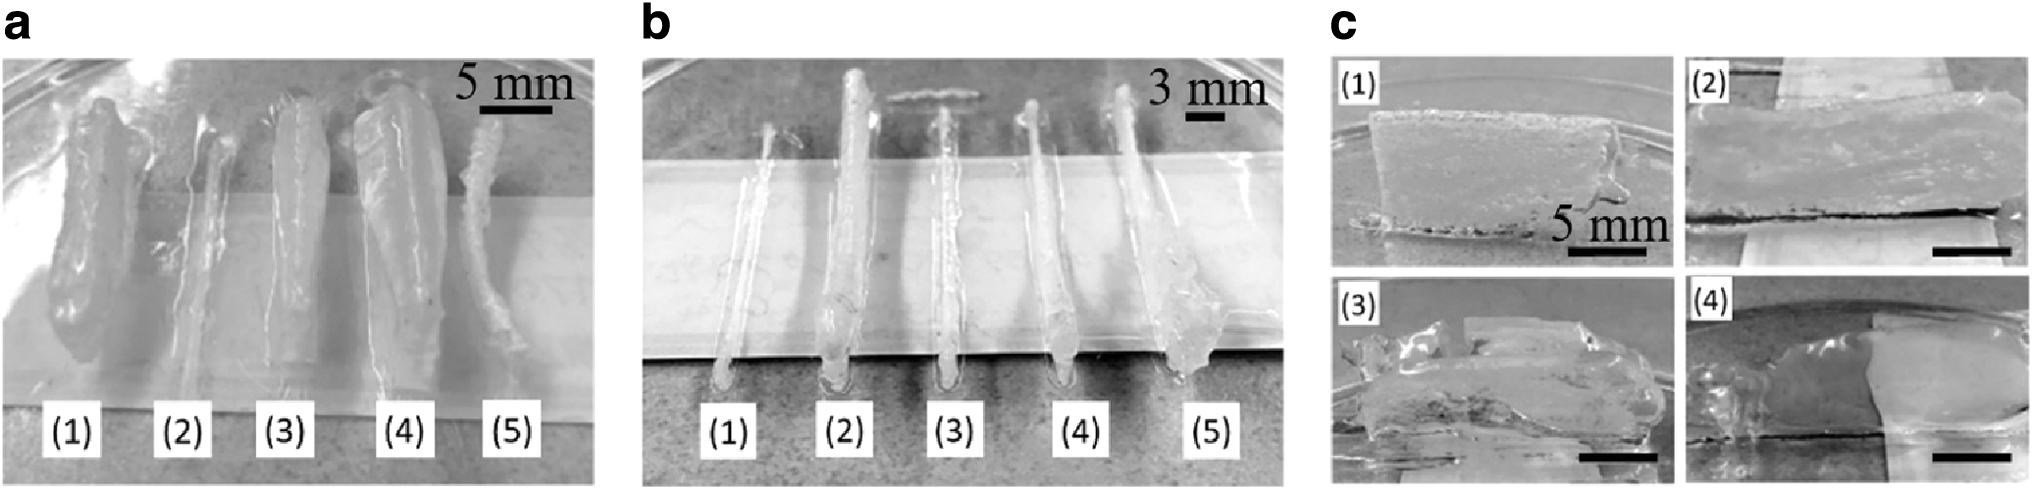
Three sets of walls with a length of 60 mm and a height of 5 and 10 mm are fabricated under various 3D printing conditions, including different powers, duty cycles, and PDMS mixing ratios, and their internal structures are studied. Figure 6 shows the fabricated objects postprocessing. The specifications of the printed walls, including the printing parameters, layer thickness of the walls, and the corresponding mixing ratio of the PDMS, are presented in Table 3. In this table, the last column presents the average measured thicknesses of the walls. The measurements were repeated three times for each printed wall. In Table 3, the Set A includes five walls printed at driven powers of 67, 70, 131, 170, and 218 W with a continuous wave (duty cycle of 100%), as shown in Figure 6a.
Summary of 3D-Printed Wall Specifications
Figure 6b shows Set B, which includes the five fabricated walls at a power of 218 W and different duty cycles. The four printed walls of PDMS with different mixing ratios, presented as Set C in Table 3, are shown in Figure 6c. Walls with mixing ratios of 5:1 and 10:1 are printed with a power of 218 W, layer thickness of 0.25 mm, and feed rate of 300 mm/s. The walls with lower mixing ratios of 20:1 and 30:1 are printed with a layer thickness of 0.25 mm and input powers of 218 and 131 W, respectively. Because the required polymerization time for mixing ratios of 20:1 and 30:1 is higher than for the others, the feed rate is decreased to 150 mm/s for the samples mentioned above. All printing is performed at a frequency of 2.15 MHz inside a polystyrene printing cavity.
The measured data in Table 3 show that increasing the input power increases the thickness of the walls. However, this effect is less significant than that of the duty cycle. On the contrary, the structures of the printed walls illustrated in Figure 6 show that increasing the power and duty cycle decreases the transparency of the objects. As a result, SEM imaging was performed to capture pictures of the pores along the walls. Images across the prepared thin films are obtained from where the pores are denser.
3D printing of millifluidic channels
Two millifluidic channels with different dimensions were 3D printed. The most popular mixing ratio for creating microfluidic devices is 10:1; hence, this ratio has also been used to create millifluidic channels. The first millifluidic model has a 4-mm-wide channel, as shown in Figure 7a. The printing path with a 2 mm gap is shown in Figure 7b. The gap between the paths was defined such that a uniform layer of PDMS was formed after moving the focal region along them due to the thickness of printing lines. 3D printing was performed layer-by-layer inside the polystyrene cavity filled with PDMS at an input power of 170 W and a frequency of 2.15 MHz. The feed rate and layer thickness are set to 300 mm/s and 0.25 mm in the G-code. Two layers were printed consecutively to create a channel with 0.5 depth.
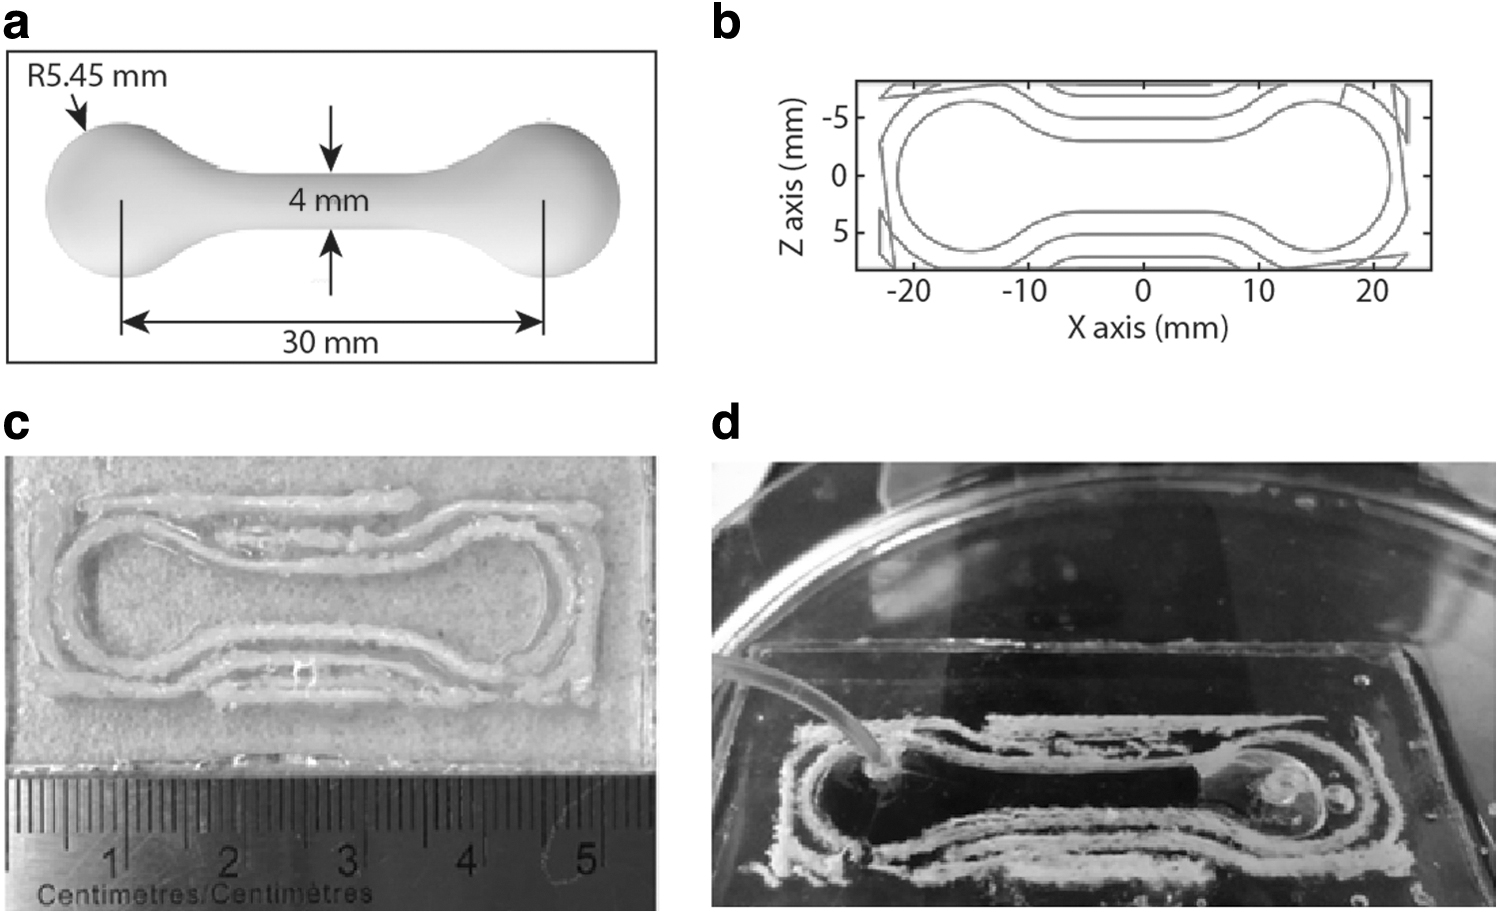
Illustration of the first millifluidic model:
Figure 7c shows an object printed on a polystyrene substrate. A thin layer of PDMS is bonded at the top of the channel to cover it and to achieve a conduit with a reduced aspect ratio, as shown in Figure 7d. Before bonding, the input and output holes are punched into the PDMS layer. Colored water is injected into the channel to examine the fabricated chip. As illustrated in Figure 7d, the fluid occupied the cavity and flowed along the channel without leakage.
Three layers, each thickness of 0.25 mm, are printed inside the polystyrene cavity filled with PDMS at a feed rate of 300 mm/s to form a second millifluidic channel. This channel comprises a narrower channel with a width of 2 mm and a total surface of 20 × 15 mm, as shown in Figure 8a and b, to provide more surface for bonding with the top cover. The gap between paths is set to 1.2 mm. A frequency of 2.15 MHz and a power of 170 W with a 100% duty cycle are used to drive the transducer.
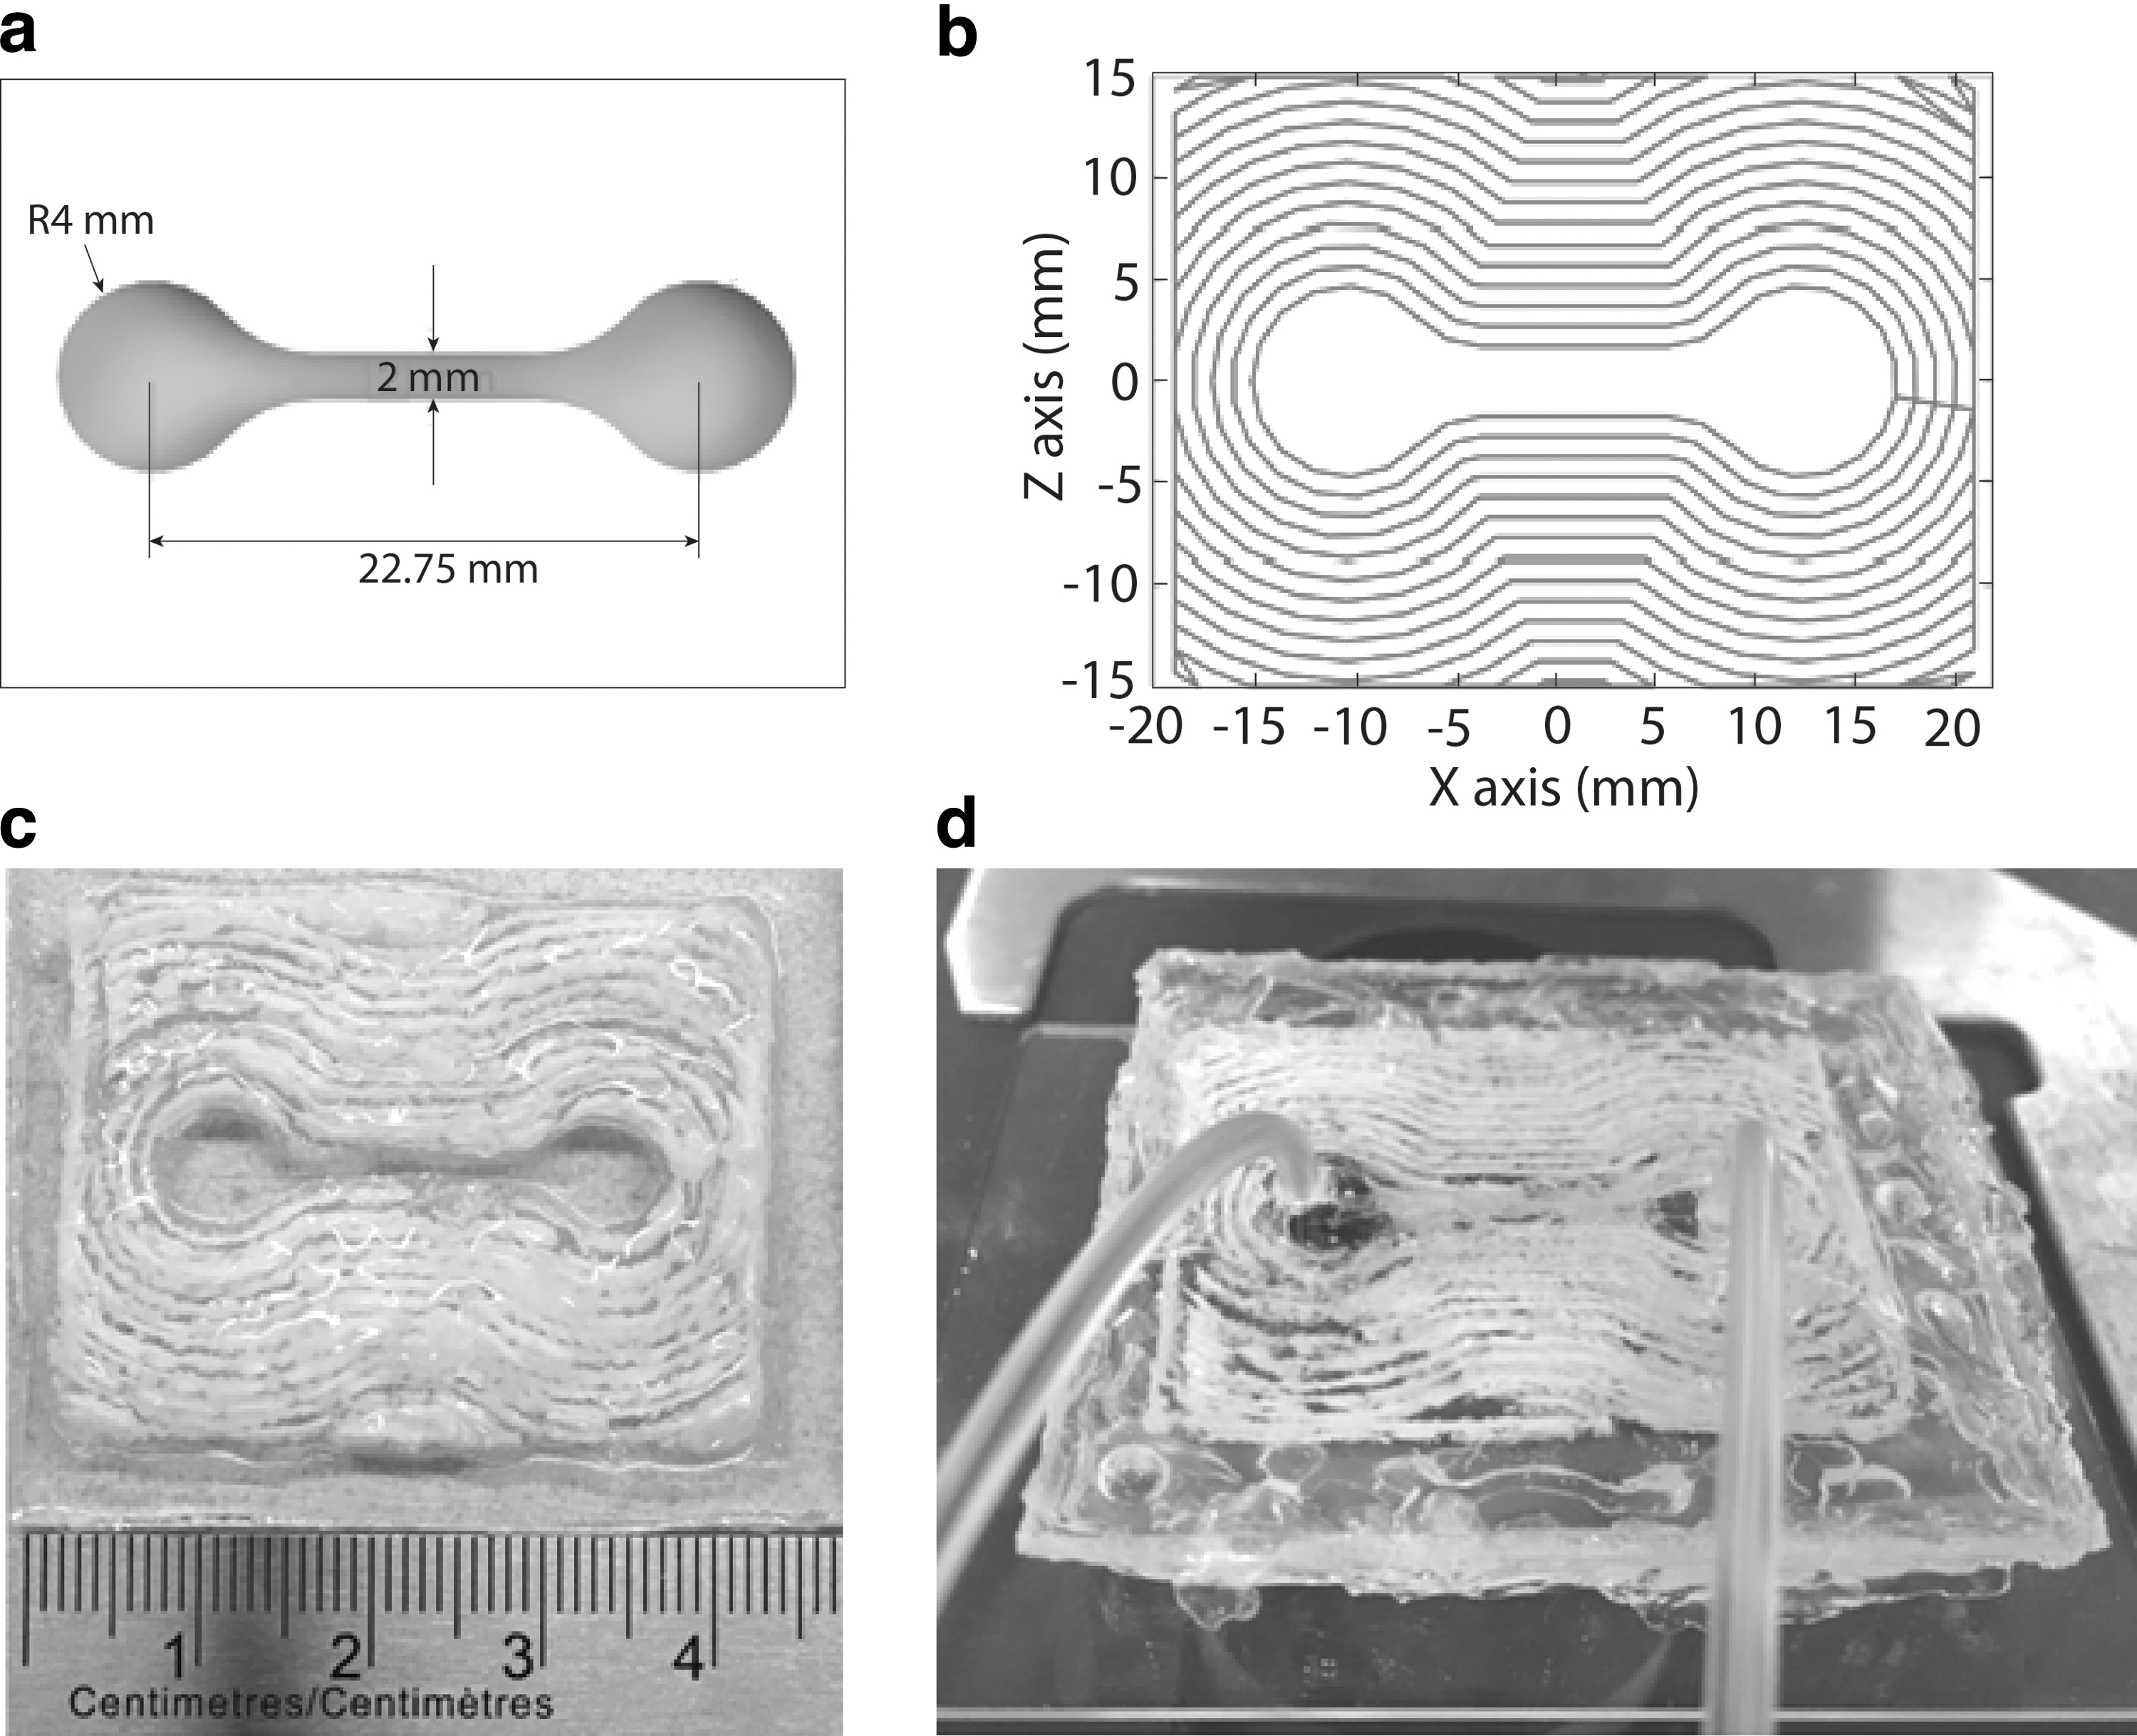
Illustration of the second millifluidic model:
The printed channel over the polystyrene substrate is shown in Figure 8c. A glass slide coated with a thin layer of uncured PDMS is used to cover the fabricated channel. After placing the glass on top of the channel, the assembly is placed in an oven at 40°C for 4 h to complete the bonding process. Figure 8d shows the final chip undergoing the leak test with dyed water. Leakage is not observed during the test. Compared with the first millifluidic channel, the wide printed surface surrounding the channel improved bonding and made chip handling easier.
3D printing of cantilevers
The 3D printing setup shown in Figure 1 is used to fabricate multiple cantilever beams. Figure 9a shows the computer-aided design (CAD) model of the designed cantilever with dimensions of length (L) = 10 mm, width (W) = 8 mm, and thickness (thk.) = 4 mm.
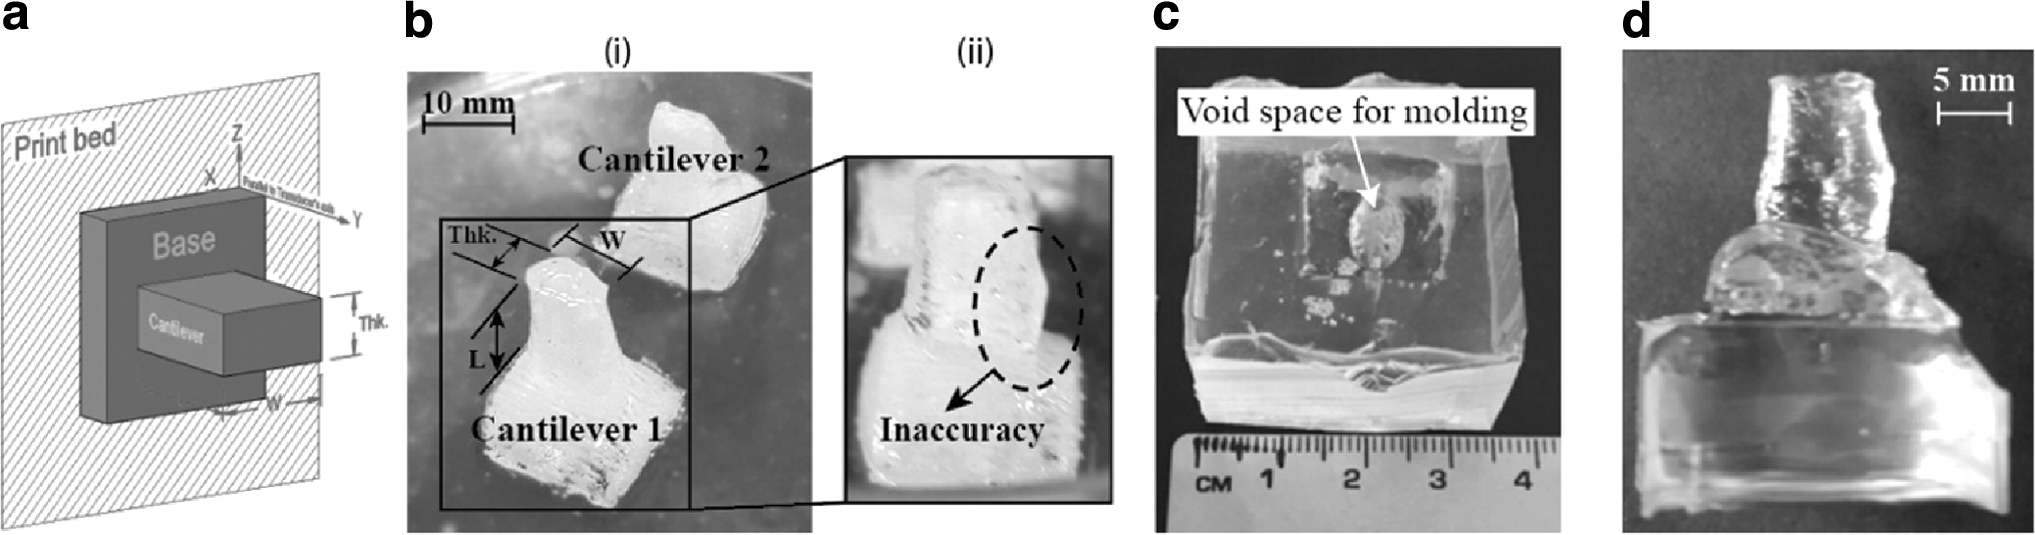
In Figure 9a, the cantilever base is designed to facilitate the handling of the object during postprocessing and characterization tests. To implement the findings obtained from the 3D printing of the walls, cantilevers made of PDMS with a 10:1 mixing ratio are printed using a frequency of 2.15 MHz, power of 218 W, and duty cycle of 100%. The CNC moves the transducer along the predefined paths with a feed rate of
Mechanical property of cantilevers
The performance of the 3D printing process was studied by measuring and comparing the stiffness of the 3D-printed and molded PDMS cantilevers using the stiffness measurement method described in the Stiffness Measurement of Cantilevers section. A copy of the 3D-printed cantilever “1” is produced following the molding process explained in the PDMS Mold Fabrication and Casting a PDMS Cantilever section. Figure 9c and d shows the fabricated mold and cantilever from PDMS with a mixing ratio of 10:1. Measurement of the dimensions of the molded PDMS cantilever confirmed the geometric similarity between the molded and printed cantilevers.
Results and Discussion
Characterization and porosity analysis of the printed walls
Effect of different powers
Figure 10 displays the selected surface topographies obtained from the SEM images of the films extracted from the walls, as shown in Figure 6a.

SEM images of the 3D-printed walls at various powers (Set A from Table 3);
Figure 6a shows that the input power affects the wall width and height. However, this effect is less significant than that of the duty cycle.
Figure 11 illustrates the variation in pore sizes in the walls, as shown in Figure 6a, 3D printed with powers of 67, 131, and 218 W.

Pore size distributions in the printed walls at different powers (Set A from Table 3) of 67 W, 131 W, and 218 W.
As shown in Figure 11, no significant change in the range of pore sizes is detected compared with walls printed with various duty cycles, and the nonuniformity is identical in all the printed walls. The pore diameter varies from 1 to 20 μm for powers of 67, 131, and 218 W. The results show that the power does not significantly affect the variation in the pore diameters.
A study conducted by Brotchie et al. 42 showed that the average size of the bubbles increases as a function of the input power up to a specific diameter of 10 μm, as shown in Figure 11.
Although lower powers lead to an increase in the printing time, it is recommended for a better resolution. In addition to the duty cycle and input power, frequency plays a crucial role in the bubble size. Higher frequencies decrease the average bubble size, narrowing the bubble size distribution. Therefore, the printing process at higher frequencies results in uniform and consistent bubbles in terms of form and size.42,43
Effect of varied duty cycles
Figure 12 presents selected SEM images of the films extracted from the samples in Figure 6b for the tested duty cycles of 30%, 60%, and 100%.

Pores at different duty cycles (Set B from Table 3);
As shown in Figure 12, the pore size decreased by reducing the duty cycle. Although the number of pores increases significantly for lower duty cycles, as evidenced by the walls shown in Figure 6, the objects printed at lower duty cycles are more transparent than the ones printed at high duty cycles due to decreasing the pore size. In addition, the shape of the pores was more uniform at a lower duty cycle than that for higher duty cycles. Figure 13 displays the probability of pore radius occurrence, measured from the SEM images using an image processing method, for samples printed at different duty cycles.
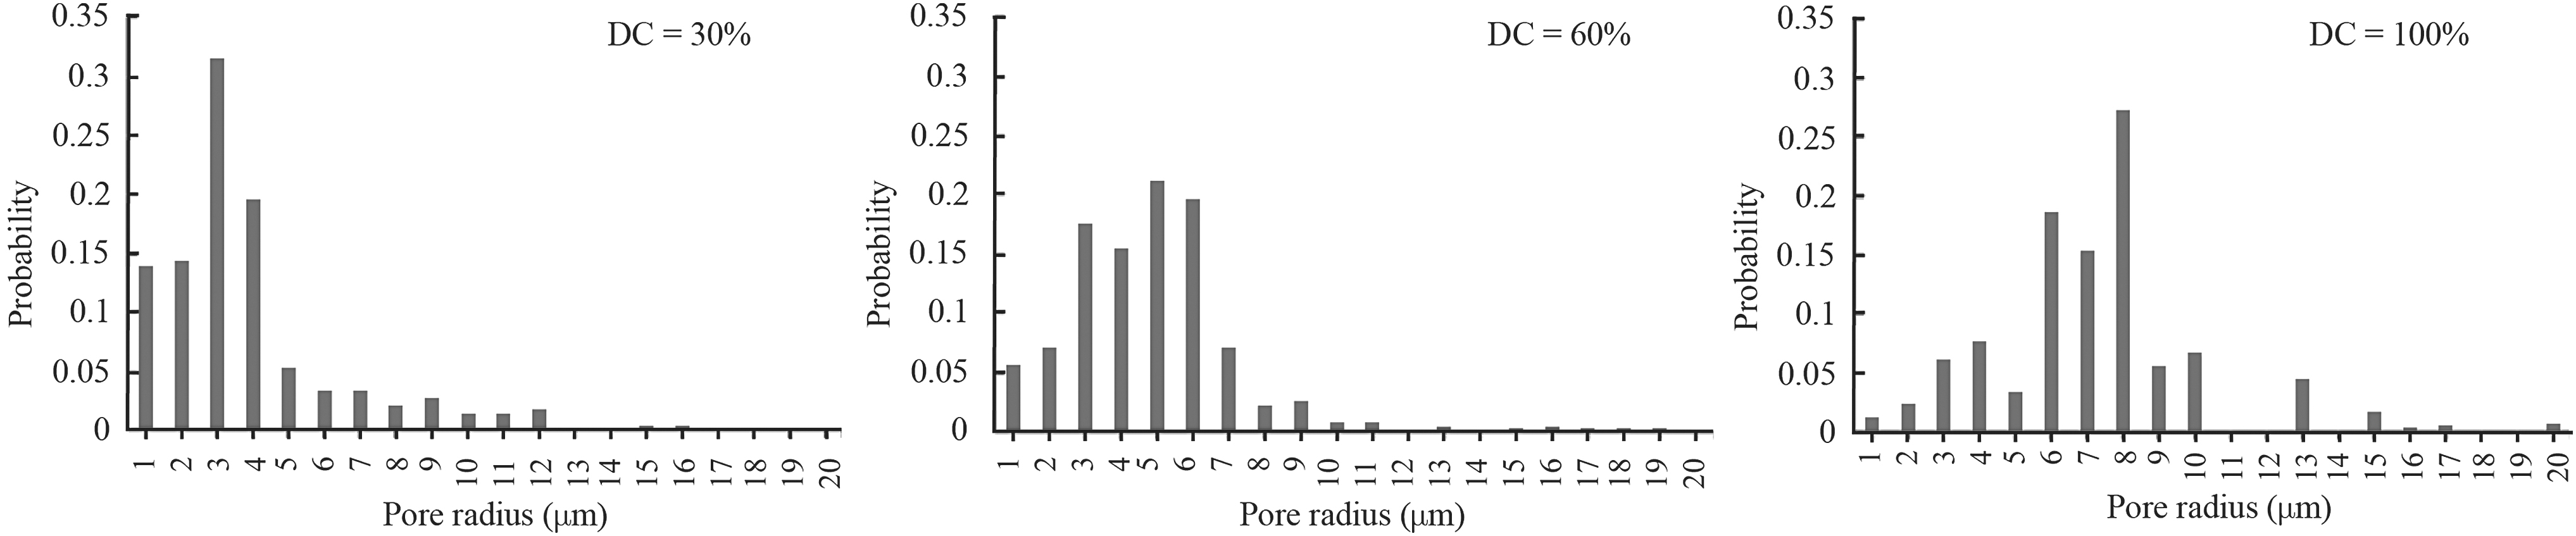
Pore size distributions in the printed walls with different duty cycles (Set B from Table 3) of 30%, 60%, and 100%.
Figure 13 shows a significant difference between the occurrences of pores with radii within the 1–20 μm range in the printed samples at different duty cycles. The diameters of the pores are mainly in the range of 1–10 μm. However, pores with larger diameters are observed in continuous waves. The pore diameters are 1–4, 3–6, and 6–8 μm for duty cycles of 30%, 60%, and 100%, respectively. Xu et al. 44 study on the size distributions of cavitation bubbles for various duty cycles observed this phenomenon as well and showed that the number of bubbles with smaller diameters increases with decreasing the duty cycle (the experiments in Xu et al. 44 are performed for duty cycles of 2.3%, 9%, and 18% 44 ).
The deposited energy was associated with the duty cycle. A higher duty cycle implies the deposition of a higher energy level, which leads to the formation of larger pores, as a result, the solidification of a larger volume of PDMS. This effect becomes apparent when examining the measured wall thicknesses presented in Table 3. The results show that thinner walls are obtained at a lower duty cycle. Hence, lower duty cycles are recommended for printing smaller features. In addition, to obtain a uniform feature, a lower duty cycle is recommended because the pores are consistent. Essentially, higher duty cycles lead to rapid and inconsistent printing with a lower resolution. Furthermore, Figure 12 shows that the transparency of the wall is affected by the pores inside the printed part.
Effect of different mixing ratios
Figure 14 shows the SEM images of the films extracted from the walls printed from PDMS with different mixing ratios. No pores are found with mixing ratios of 20:1 and 30:1 for an input power of 131 W. For a mixing ratio of 20:1, a pure transparent part is achieved at an input power of 131 W, as illustrated in Figure 14c. The transparency of the walls is shown in Figure 6c. Walls with lower ratios (20:1 and 30:1) were significantly transparent and clear compared with the other walls.
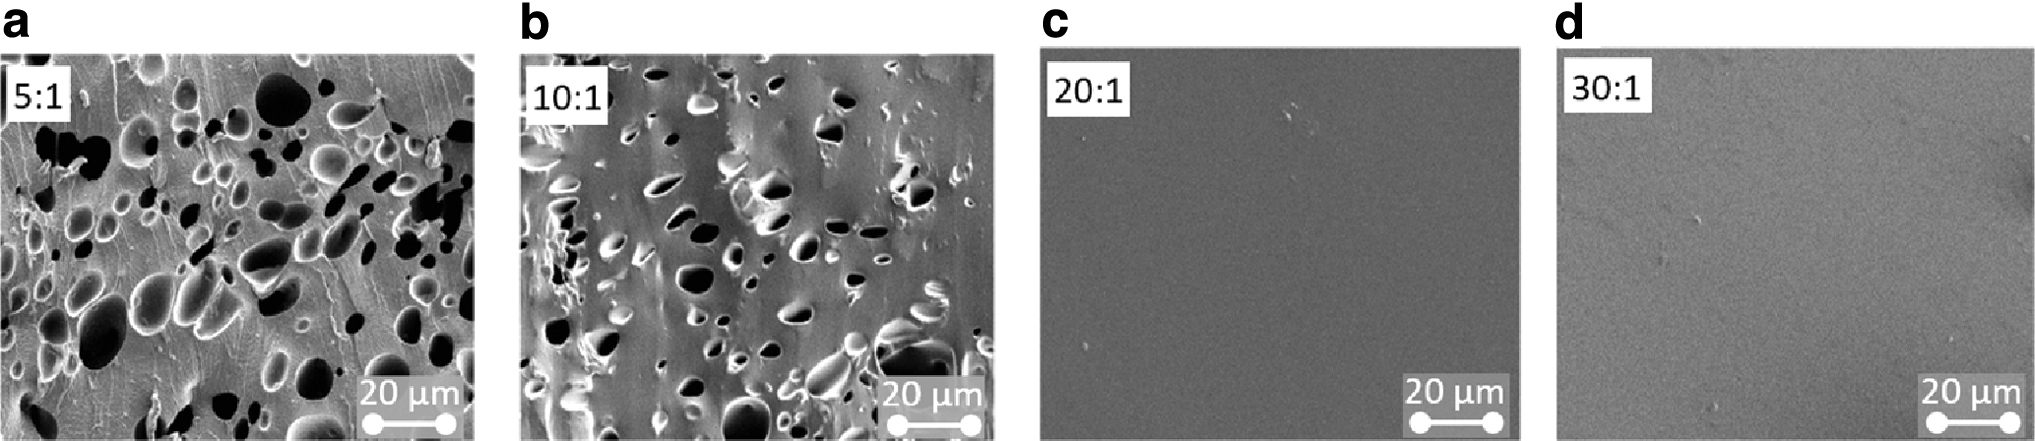
SEM images for different PDMS mixing ratios (Set C from Table 3);
The application of lower mixing ratios is recommended to obtain a transparent printed part. A possible explanation for these results is the higher viscosity of the resin due to the lower mixing ratios (high volume of the base elastomer with respect to the curing agent's volume). However, the mechanical properties of PDMS are highly dependent on the mixing ratio, and the elastic modulus of cured PDMS increases with an increase in the volume of the curing agent in the mixture.
Performance of the millifluidic channels
As illustrated in Figure 7c, some areas of the PDMS are not polymerized, which could be due to a slight misalignment of the resin cavity with respect to the face of the transducer. However, the inner printing paths of the PDMS are fully polymerized. Moreover, setting a greater space between the paths in each layer resulted in a gap between the printed paths. After printing, the measured gap and channel width were 1.24 and 4 mm, respectively.
The second printed channel, shown in Figure 8c, has a 1.68 mm width. Because of the narrower gap between paths, the resolution of this millifluidic channel is substantially better, and the paths are dense. However, the channel surface is nonuniform and rough. These results demonstrate the feasibility of fabricating fluidic devices using a transducer with a smaller focal width.
Geometrical and mechanical evaluation of the fabricated cantilevers
Dimensional analysis of the 3D-printed cantilevers
The dimensions of the four printed cantilevers were measured to examine the resolution of the 3D printing. The results are shown in Figure 15.

Dimensional variations (length, width, and thickness) of the 3D-printed PDMS cantilevers with respect to designed cantilever.
Table 4 presents the standard deviation of 3D-printed cantilever lengths, widths, and thicknesses corresponding to the data shown in Figure 15.
Standard Deviation of 3D-Printed Cantilever Dimensions
The resolution of the 3D printing process is demonstrated by the dimensional deviations of the printed beams compared with the CAD design. The size of the focal region and the occurrence of acoustic streaming inside the cavity affect the resolution. The wave propagation inside a fluid generates an acoustic streaming. Streaming inside the printing material during the printing process may cause movement of the object inside the building cavity, which decreases the resolution of the printing.
Furthermore, Figure 9b shows some inaccuracies in the printed cantilevers that can occur due to the inaccuracy of the printing setup, such as misalignment of the transducer with respect to the printing cavity, as well as the resolution of the CNC, which can be improved in further developments.
Stiffness of the cantilevers
Figure 16 shows the recorded data from the stiffness measurement tests for the printed and molded cantilevers. Based on the linear equation of

Recorded data from force-deflection tests and the corresponding linear regression graphs for 3D-printed and molded PDMS cantilevers.
Regardless of the slight differences in stiffness that may occur as a result of the cantilevers' geometrical discrepancies and the presence of pores in the structure of the 3D-printed cantilevers, the graphs show that both cantilevers behave as linear elastic beams for deflections in the range of 0.75″ 2.5 mm.
Conclusions
The present study is the first attempt to print functional structures such as millifluidic systems and cantilevers with sound waves. A numerical analysis of the ultrasound propagation in the process is discussed, and very high-pressure zones in the transmitting medium are observed. However, the high-pressure zone created in the printing medium is sufficient for DSP printing and to sustain on-demand curing and printing processes. In addition, the location of the printing spot is controlled by the postprocessing of the ultrasound source motion, considering the ultrasound refraction when it passes through different media. Moreover, the locations of the high-pressure zones that created the printing spots were numerically derived. A porosity analysis of the printed parts is also presented. This analysis showed that high frequencies lead to smaller porosities and feature sizes. In addition, the higher viscosity of the printing material results in a less porous structure.
This study paves the way for future research to utilize sound waves to print functional structures and potentially print microscale parts, such as microcantilevers or microfluidic systems, by tuning the frequency, power, and duty cycle parameters.
Data Access
The data that support the findings of this study are available from the corresponding author upon request.
Footnotes
Authors' Contributions
M.H. and M.P. conceived, designed, and supervised the study. S.F., V.K., and M.H. performed the experiments and fabrication. S.F., V.K. and M.H. wrote the article. S.F. drafted the article. S.F. and V.K. contributed equally. All authors participated in the editing.
Author Disclosure Statement
The authors declare the following competing interests: M.H. and M.P. are inventors of a patent (US20200001533A1), and M.H., S.F., and M.P. are inventors of another filed patent (US Appl. No. 63/052044). These patents were related to the topics covered in this study. V.K. declare no competing interests.
Funding Information
This work was financially supported by the NSERC Discovery and PSVT grants of M.P.