
Abstract
A printed layer of silica-enforced poly(dimethylsiloxane)-co-(diphenylsiloxane) is modeled as a two-phase system consisting of air and polymer with an interface set up during the printing process. The structural geometry changes mostly due to the action of surface tension, while all material properties are strongly temperature dependent. Polymer flow is described using equations of the extended Herschel–Bulkley model, with parameters strongly dependent on temperature and degree of curing. Parameters of the model are determined using flow sweep measurements and separate experiments with vertical structure sagging at different temperatures. The curing process is modeled using dependencies between the curing rate, degree of curing, and temperature obtained in studies by differential scanning calorimetry. The developed model is used for simulations of printed structure deformations with different initial and boundary conditions.
Introduction
Extrusion-based 3D printing offers a quick way to generate 3D polymer structures without the need for molds. Through precise control over deposition of highly engineered viscoelastic inks in the form of continuous filaments, complex 3D architectures can be additively fabricated, layer by layer, to generate parts that are directly applicable to cutting-edge technologies. In particular, 3D printed silicone structures are well suited for soft material applications, including high-performance foams and cellular solids, 1 soft robots, 2 biomedical devices and biological scaffolds, 3 and flexible and stretchable electronics. 4
For example, the direct ink writing (DIW) technology can be used create 3D structures with finer gradations in the material composition. 5 DIW functions by extruding a shear-thinning ink from a tiny nozzle onto a printing substrate. Due to its yield stress nature and rapid recovery time, the ink filament extruded from the nozzle is firm enough to retain a cylindrical shape and span small open spaces between the filaments beneath it. 6 By varying the spacing between filaments, functional gradients in material stiffness and porosity can be readily obtained. 7
Thermosetting is a popular method of fixing 3D printed structures, “freezing” them in desired shapes by gradual heating in ovens. Unfortunately, during the time between structure printing and curing, the shape of 3D structures can change (sag) due to effects of gravity, which is dominant for larger structures, and surface tension, typical for smaller scale structures.
To effectively analyze the evolution of such a complex process, a multiphysics model describing heat transfer, the non-Newtonian rheology of ink, its curing, and evolution of the air–ink interface, accounting for surface tension and gravity, has been developed. All these phenomena are essentially coupled, which results in additional numerical difficulties as the corresponding time scales are usually very different. A Herschel–Bulkley (HB) model is used to account for non-Newtonian properties of the ink. It is known to adequately describe complex viscoplastic behavior of reinforced silicone,8,9 with yield stress and consistency factor, and flow index determined in independent flow sweep tests.
The curing process is modeled using dependencies between the curing rate, degree of curing, and temperature obtained in differential scanning calorimetry (DSC) tests. 10 In all experiments, printed samples of silica-enforced poly(dimethylsiloxane)-co-(diphenylsiloxane) (PDMS-co-PDPS) with the face-centered tetragonal (FCT) structure are used.
Fluid Dynamics Model
To simulate the evolution of the interface between the non-Newtonian ink phase and air, a computationally friendly volume of fluid (VOF) method has been applied. 11 The method is based on the idea of a so-called fraction function C, a scalar function serving as a marker of the ink phase. For cells occupied by air, C = 0, while C = 1 for cells occupied by ink.
The distribution of the fraction function is governed by the transport equation as follows:
where vk represents the components of velocity and ∇k is the operator of differentiation along a spatial coordinate xk, and summation of the matching vector indices is assumed.
The system is treated as a one-phase fluid with dynamics described by equations of conservation of mass, momentum, and energy:
where ρ is the density, p is the pressure, Δ ik is the viscous stress tensor, gk is the gravity vector, λ is the thermal conductivity, T is the temperature, and e is the internal energy.
In the VOF approach, all material properties are weighted with the fraction function C. For example, local viscosity T is calculated based on the viscosity μa of air and μp of the ink:
Each of the phases is considered incompressible, although the density of the mixture varies close to the fluid interface, determined as the area of rapid change of C from 0 to 1.
In this study, the ink is a reinforced PDMS, which is a concentrated suspension of silica particles in a polymer liquid, belonging to the same class of materials as concrete and industrial slurries of various types. Non-Newtonian properties of these materials result solely from the presence of the particle phase and increase with its volume fraction. Slow motion of these fluids is commonly described by HB models. In this study, structure deformations during the sagging stage have been simulated using the biviscous HB model
9
:
where μp0 is the viscosity,  is the critical shear rate, τ0 is the yield stress, k is the consistency factor, and n is the flow index.
The parameters, τ0, k, and n, for different temperatures were determined by fitting stress–shear rate dependencies obtained in the flow sweep tests (shear rate in the range between 0.01 and 1 s−1). The critical shear rate
Effect of Polymerization and Its Modeling
In dedicated DSC experiments
10
in this work, dependence of the polymerization rate on the polymerization parameter α (fractional conversion) and the absolute temperature T was determined:
where t represents time. Depending on the mechanism of polymerization, the function f in Equation (10) can be approximated by different nonlinear dependencies, such as those of Borchardt–Daniels or autocatalytic models. In this study, the experimentally obtained dependencies f(α,T) were tabulated and used directly in the numerical model, using bilinear interpolation. To describe the rate of polymerization in moving material elements, the time derivative in Equation (10) was substituted with the material derivative, resulting in the following equation:
Polymerization strongly affects material deformation by changing its complex viscosity.
12
In this study, the following dependence for dynamic viscosity of the polymer was postulated:
where μ0 is the viscosity of the material with no polymerization, given by HB Equations (10,11). Based on our observations of effective material hardening, the value of constant kp was set to 45 so that polymer viscosity grows rapidly after it exceeds the value of 1/
Numerical Realization of the Model
The resulting model is characterized by strong coupling of effects: the fluid flow depends on heat transfer through temperature-dependent viscosity and rate of polymerization, while heat distribution is strongly dependent on the flow and shape of the interface between the polymer and air. The model has been implemented in a case file and run using the numerical package ANSYS-FLUENT (version 2022-R2).
Modeling of the nonisothermal two-phase fluid flow was based on solutions of differential Equations (2)–(6) and (11) using the extended HB model [Eqs. (8) and (9)]. The primary and secondary phases of the multiphase volume of fluid (VOF) model are air and non-Newtonian ink, respectively, with nonslip boundary conditions on the substrate, and account for surface tension at the air–ink interface. The surface tension-related stresses smooth out the interface, starting with features with the smallest radius of curvature such as areas where printed filaments overlap. For vertical dimensions of the specimen considered in this work, this is the dominant effect driving the shape change of printed structures, while the effect of gravity is negligible.
The standard Semi-Implicit Method for Pressure-Linked Equations scheme was used for pressure–velocity decoupling. Several user-defined functions (UDFs) have been developed to address the complexity of the geometry and the model:
a UDF defining the initial shape of the printed 3D structure, a UDF defining temperature-dependent parameters of the extended HB model based on measured properties (Table 1), and a UDF determining the temperature-dependent rate of polymerization f(a,T) in Equation (10).
Parameters of the Herschel–Bulkley Model for Different Temperature Values
The initial geometry of the printed layer can be effectively mimicked as an FCT structure 13 (Fig. 1). The filament diameter in the structure was close to 0.5 mm, and the distance between neighboring filaments was 1 mm. Because the horizontal (x–y) dimensions of the samples were substantially larger than the sample thickness and the pattern was periodic in both x and y directions, it was sufficient to focus on shape evolution of a representative element with dimensions of 0.5 mm × 1 mm × 5 mm (Fig. 2) and impose periodic and symmetry boundary conditions in x and y directions, respectively.
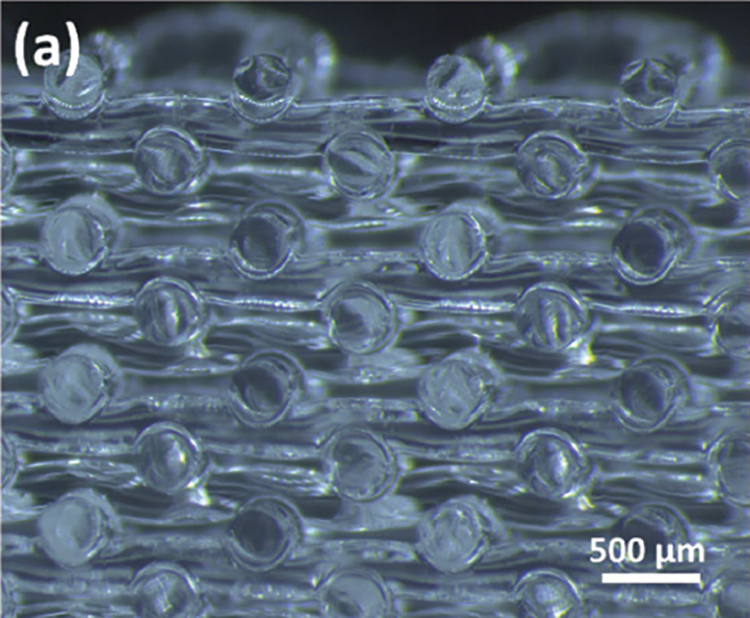
A cross-sectional image of 3D printed lattice structures printed using silicone inks. 13
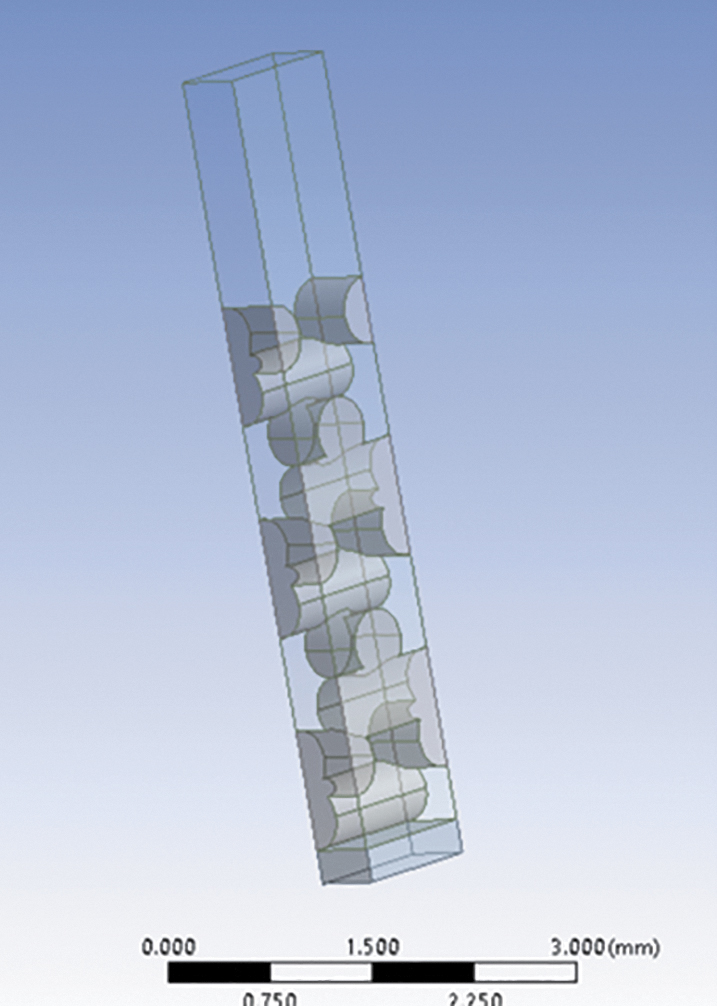
A representative 3D cell used in the simulations.
For heat transfer simulations, it was assumed that the lowest and highest layers of the structures are bound by solid isothermal walls. More detailed simulations involving runs with these boundary conditions and runs that account for convective flow over the upper layer indicated that this is a good assumption, as the airflow does not penetrate deeper than 1- to 1.5-filament diameters.
Experimental Determination of the Model Parameters
Flow sweep measurements
A 3D printable silicone ink was prepared based on a composite comprising a vinyl-terminated PDMS-co-PDPS and 29 wt% hexamethyldisilazane-treated (HMDZ) silica as a reinforcing filler to ensure the long-term stability of 3D printed components. Hydrophobic fillers are incapable of forming transient 3D networks, so a 0.73 wt% of Bluesil Thixo additive 22,646 was incorporated to impart silicone pseudoplasticity.
During the thermosetting process, the effective viscosity of the material drops dramatically, and the printed structure can be deformed (sagged) under the influence of gravity and surface tension. This process can be described using the HB rheological model [Eq. (9)], which can be also written in terms of the shear stress σ for shear rate values above the critical value:
To determine the constants, ι0, k, and n, in the rheological flow sweep measurements, a version of the ink without the catalyst was used for the analysis so that any trends observed at different temperatures were independent of the cross-linking process for this ink. This analysis was performed to determine the shear stress behavior as a function of shear rate at different temperatures. For this purpose, a 2° cone and plate geometry with diameter of 40 mm was used on a Discovery Hybrid Rheometer-3. A total of 7 separate sweeps were performed, observing the trend for this material at 25°C, 35°C, 45°C, 55°C, 65°C, 75°C, and 85°C.
Each sweep involved 15 min of soaking to heat up the material to the desired test temperature before collecting data. A logarithmic sweep was chosen under the test parameters, with a shear rate range of 1.0−5 s−1 to 10 s−1, collecting 20 points per decade. Steady-state sensing was selected for these with a maximum equilibration time of 60 s and a sample period of 30 s, with a 5% tolerance consecutive within 3 points, at different temperature values (Fig. 3). Once a sweep was finished, the tested sample was taken out and replaced with a fresh sample before performing a new sweep.
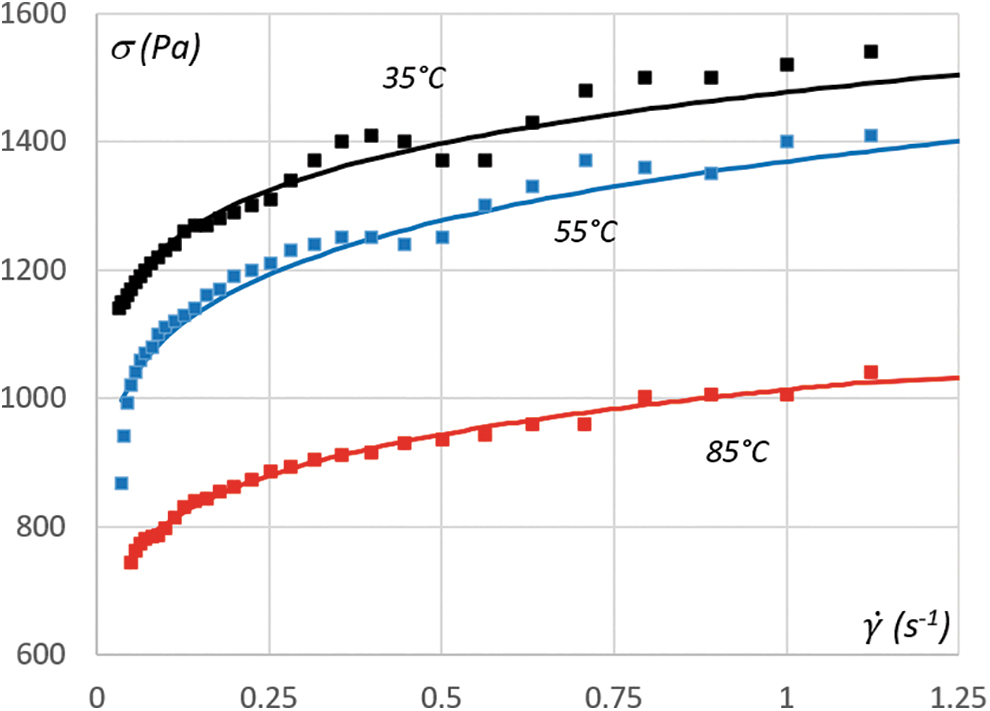
Shear stress as a function of the shear rate measured at three different temperatures (squares) and corresponding approximations using Herschel–Bulkley Equation (13) (solid lines).
To approximate the measured dependencies (shown with squares) with the HB equation and find the constants, t0, k, and n, a python code using the SciPy optimization library was developed and applied to process the measured data. Smooth solid lines show corresponding HB approximations. In this way, the HB parameters for seven different temperatures were determined (Table 1).
As expected, the yield stress values decrease with temperature, while the flow index n remains below unity. This reflects the thixotropy of the ink material whose viscosity decreases with the shear rate. In applications of this model, the material viscosity for intermediate temperature values was calculated by linear interpolation.
The behavior of ink at rather low shear rates, typical for material sagging in the curing oven, depends on the value of the critical shear rate in Equations (8–9) and (13). This range is outside of the applicability of flow sweep measurements, so additional experiments are needed to close the flow model.
Sagging experiment
This experiment measured the effect of temperature cycling on FCT structures of uncatalyzed (uncured) silicone material formed using a DIW method of additive manufacturing. A noncontact method for measuring the height of these printed structures was utilized to avoid permanent deformation.
The manufacturing motion stage consisted of an Aerotech multiaxis system and several custom-designed fixtures and hardware, with material printed using a volumetric-based extrusion system onto a nickel-coated aluminum plate measuring 300 × 300 mm in size. An on machine-mounted Micro-Epsilon chromatic confocal sensor was used to measure the print heights. First, the confocal probe rastered multiple times across the substrate in the area where the part was printed to measure its topography. The rastering pattern was repeated after the part was printed.
Second, the entire substrate, along with all prints, was then placed in a Yamato constant temperature oven that was already operating at a selected steady-state temperature in the range between 35°C and 85°C with intervals of 10°C. Each selected temperature was maintained for 16 hours; then, the entire substrate was removed from the oven and allowed to cool to a temperature that is safe to handle. Finally, the substrate was then placed on the same machine using the kinematic ball mount. The rastering pattern was repeated with the same confocal probe and the postoven thickness was determined.
An analysis algorithm was used to process data gathered from scanning the plate and the part with the confocal data to calculate pre- and postoven thicknesses, yielding a general trend of increasing sagging with temperature (Table 2). The data obtained in this experiment were used to close the rheological part of the model by determining the matching values of the critical shear rate
Measured and Predicted Sample Sagging and Corresponding Matched Critical Shear Rate
For each of the temperatures, several simulations with different values of
Curing experiment: DSC
In this study, the cross-linking reaction of silicone ink was investigated by dynamic DSC.
10
Usually, the DSC is used to determine parameters of models approximating the reaction rate function f(α,T) in Equation (10), such as the Borchardt–Daniels model
and the autocatalytic reaction model
where m and n are the reaction orders and K(T) is the reaction constant, which can be expressed by the Arrhenius equation:
where R is the universal gas constant. The pre-exponential factor A and activation energy Ea are considered independent of temperature. Determining these parameters is not a trivial task and requires application of one of the experimental methods, such as those of Flynn–Wall–Ozawa, Kissinger, and Friedman.10,14 Meanwhile, modeling of the curing process can be carried out without choosing a specific approximation, Equation (15) or (16), if the dependence f(a,T) in Equation (10) is determined directly in the DSC tests.
For the measurements, commercially available silicone reactants were purchased at Nusil as a two-part system, ply7980 and ply-7980-50. The cross-linking reaction is hydrosilylation facilitated by a platinum catalyst, and the reaction cross-links vinyl-terminated siloxane groups with Si–H groups. DSC was performed on a DSC Q-series tool (TA, USA). Samples of about 8 mg were heated from 25°C to 150°C at various heating rates (0.5, 1, 2, 5, and 10°C/min) in flowing nitrogen gas (50 mL/min).
Isothermal scans were also conducted at 65°C, 70°C, 75°C, 80°C, and 85°C to calculate dependencies, f(a,T) (Fig. 4). The results of the measurements were tabulated and used in the simulations directly, through UDFs, where values of the polymerization rate for a specific fractional conversion and temperate f(a,T) were determined using bilinear interpolation of the tabulated values for neighboring values of f(a,T).
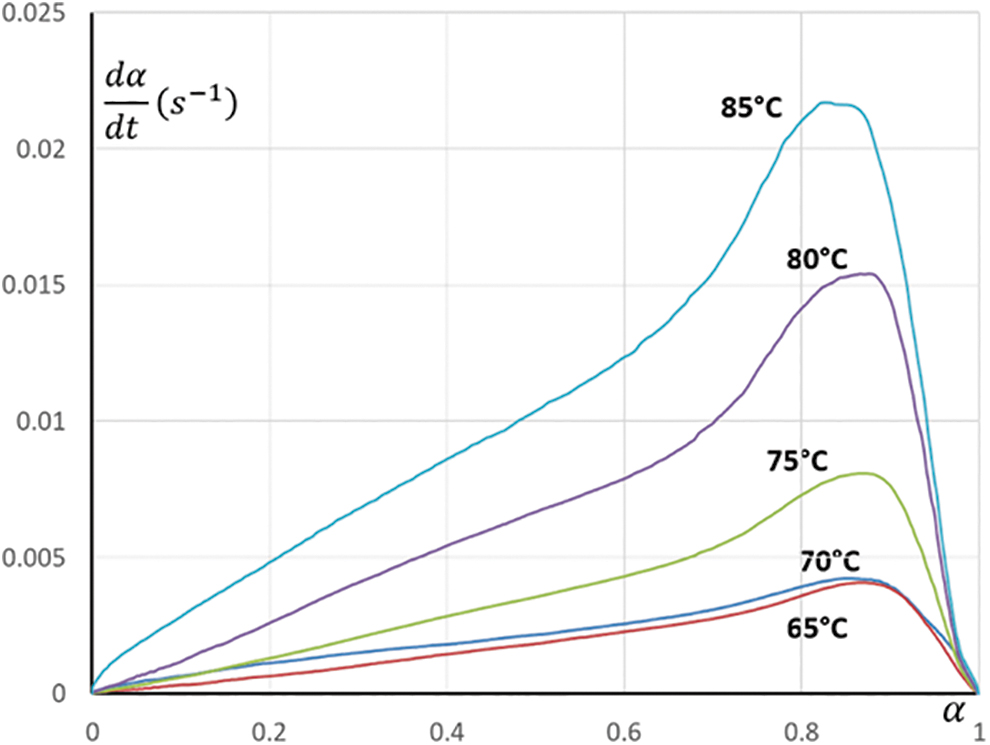
Differential scanning calorimetry-measured dependencies of the polymerization rate on the fractional conversion
Discussion
Our simulation results show that the model developed in this work is flexible and capable of effectively predicting the behavior of polymer inks during complex thermal and mechanical treatments and saving significant time and resources. It provides an insight into processes happening during polymer curing with strongly coupled physical phenomena which needs to be matched by the complexity of the model.
Each of the phenomena occurs on its own time scale and the quickest processes determine the final shape of the polymer structure. Consider the curing of a sample put in the oven at a temperature of 85°C. At this temperature, polymerization of the material used in the described experiments can take a couple of hundreds of seconds (Fig. 4). The simulations show that the temperature within the sample becomes nearly uniform between 100 and 200 s after the sample is placed in the oven (Fig. 5).
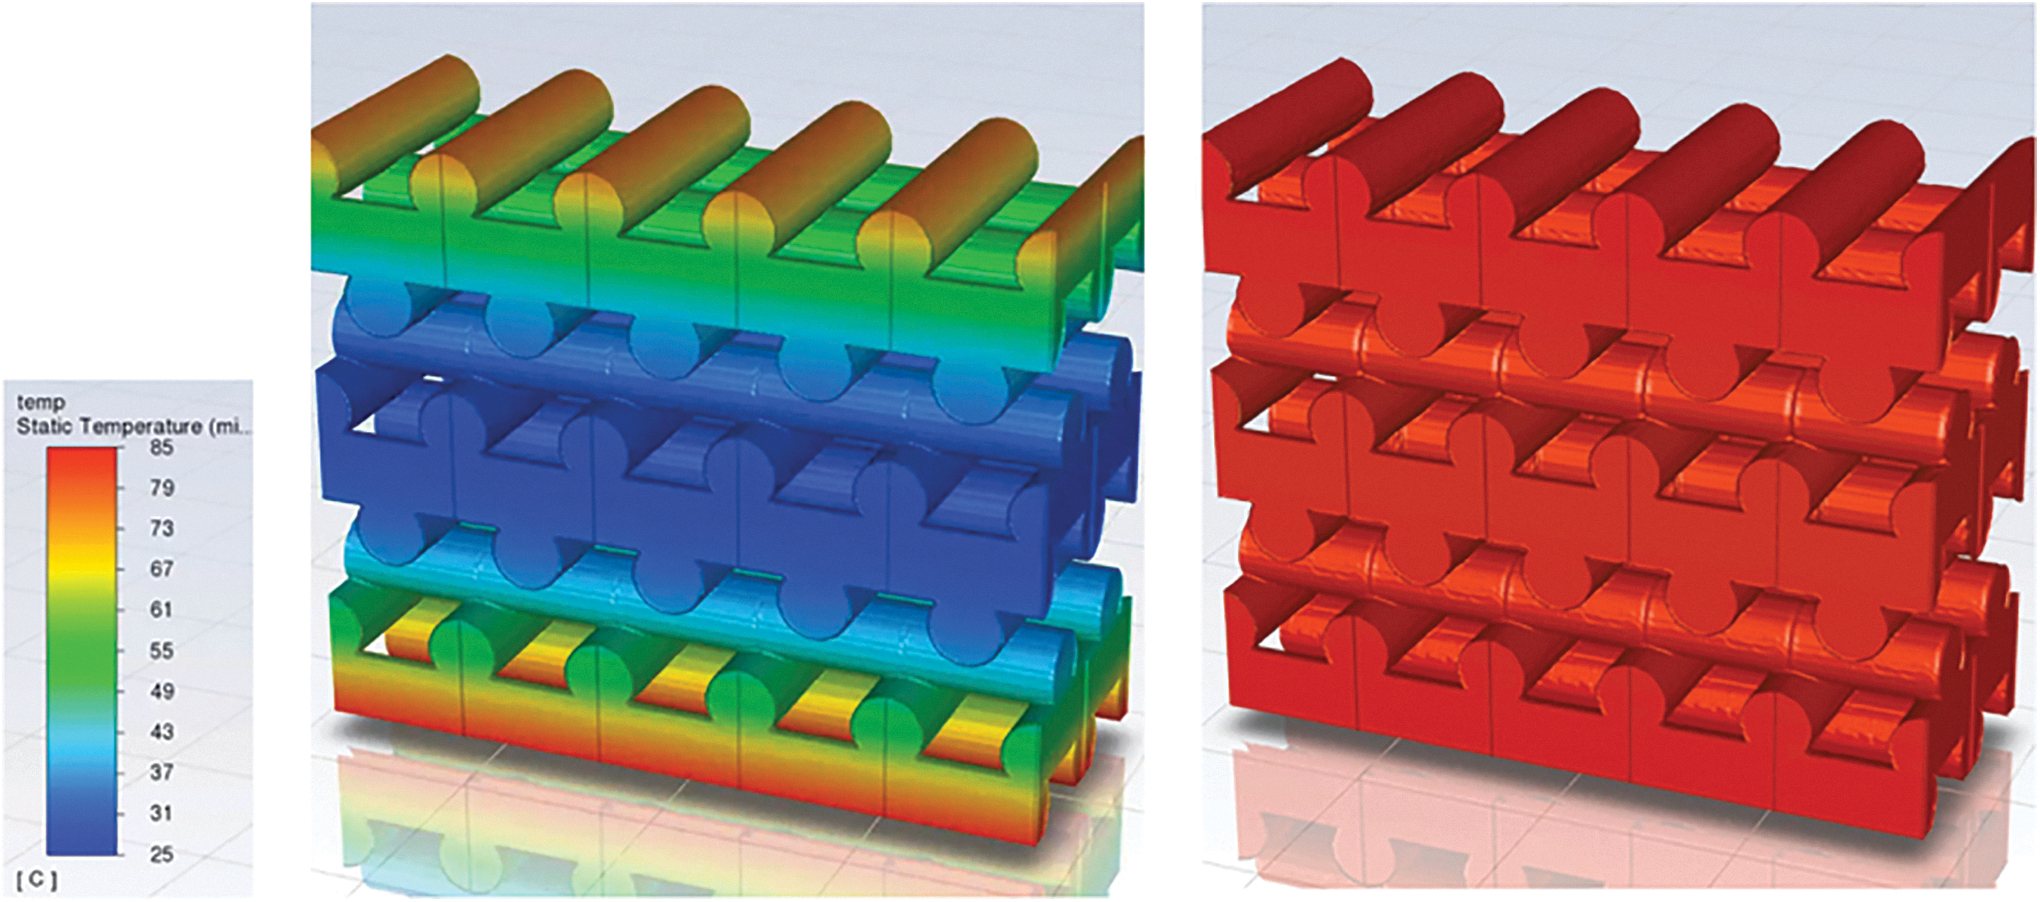
Temperature distribution in the sample at t = 10 s (left) and t = 200 s (right).
This means that the curing process at oven temperatures of 85°C or more does not take more than a few minutes. Although at t = 200 s the polymerization level still varies within the sample (this process delays the heat transfer), it is already above the value of 0.3 everywhere, meaning that the geometry is effectively frozen (Fig. 6).
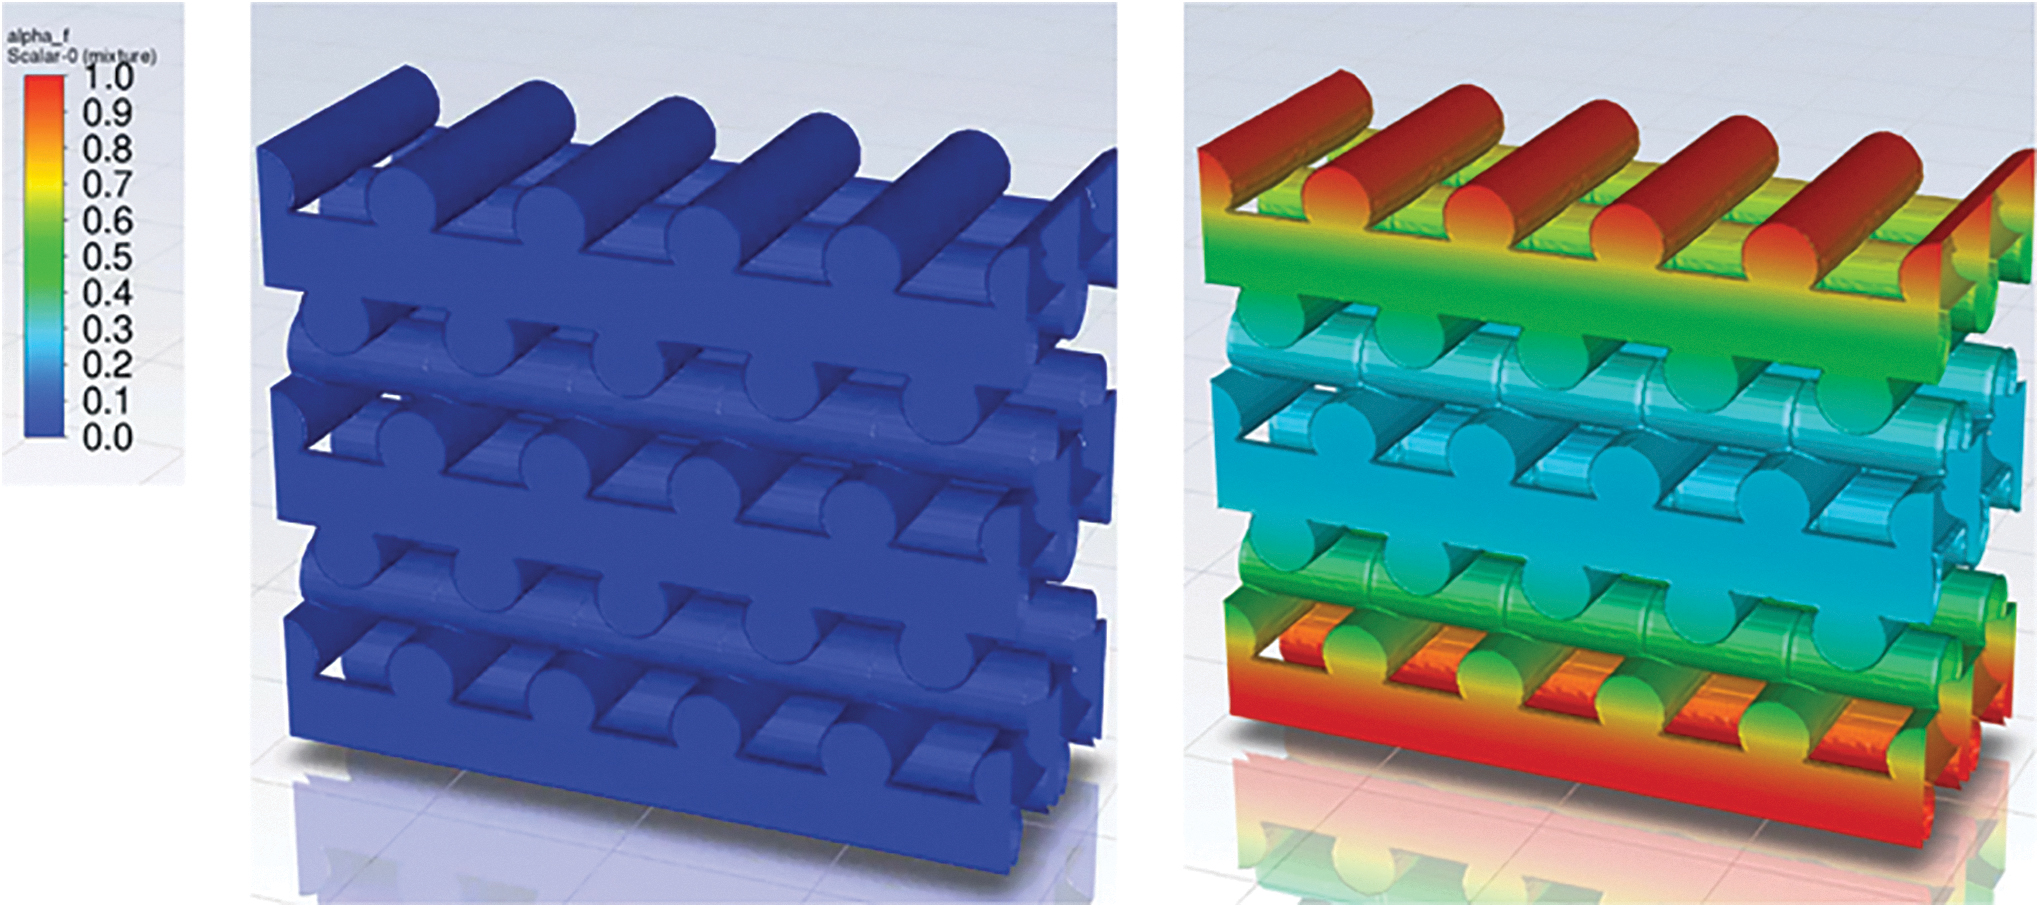
Fractional conversion
The observations show that in the absence of curing, the structural geometry changes significantly at a much longer time scale of 103–104 s. This difference between curing and hydrodynamic time scales is created intentionally during the formulation of the polymer and allows 3D printing of uniform and stable structures.
The developed model can predict what happens if the hydrodynamic time scale is comparable with or smaller than the curing time scale. Varying of the parameter
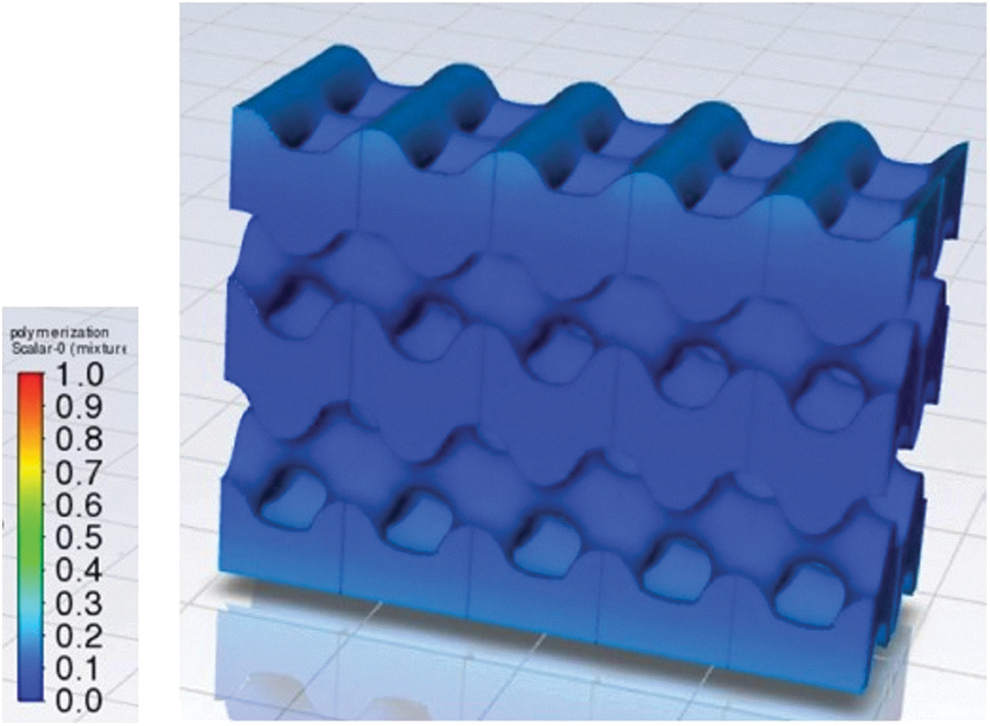
Fractional conversion
Using the periodicity of printed structures in two dimensions, plastic deformations of larger structures of very different shapes and heights can be simulated (Fig. 8). The initial undeformed geometry is the same FCT structure, but with 5 times more layers. A detailed analysis of similar computations is very helpful in designing future experiments and manufacturing processes involving 3D printing.
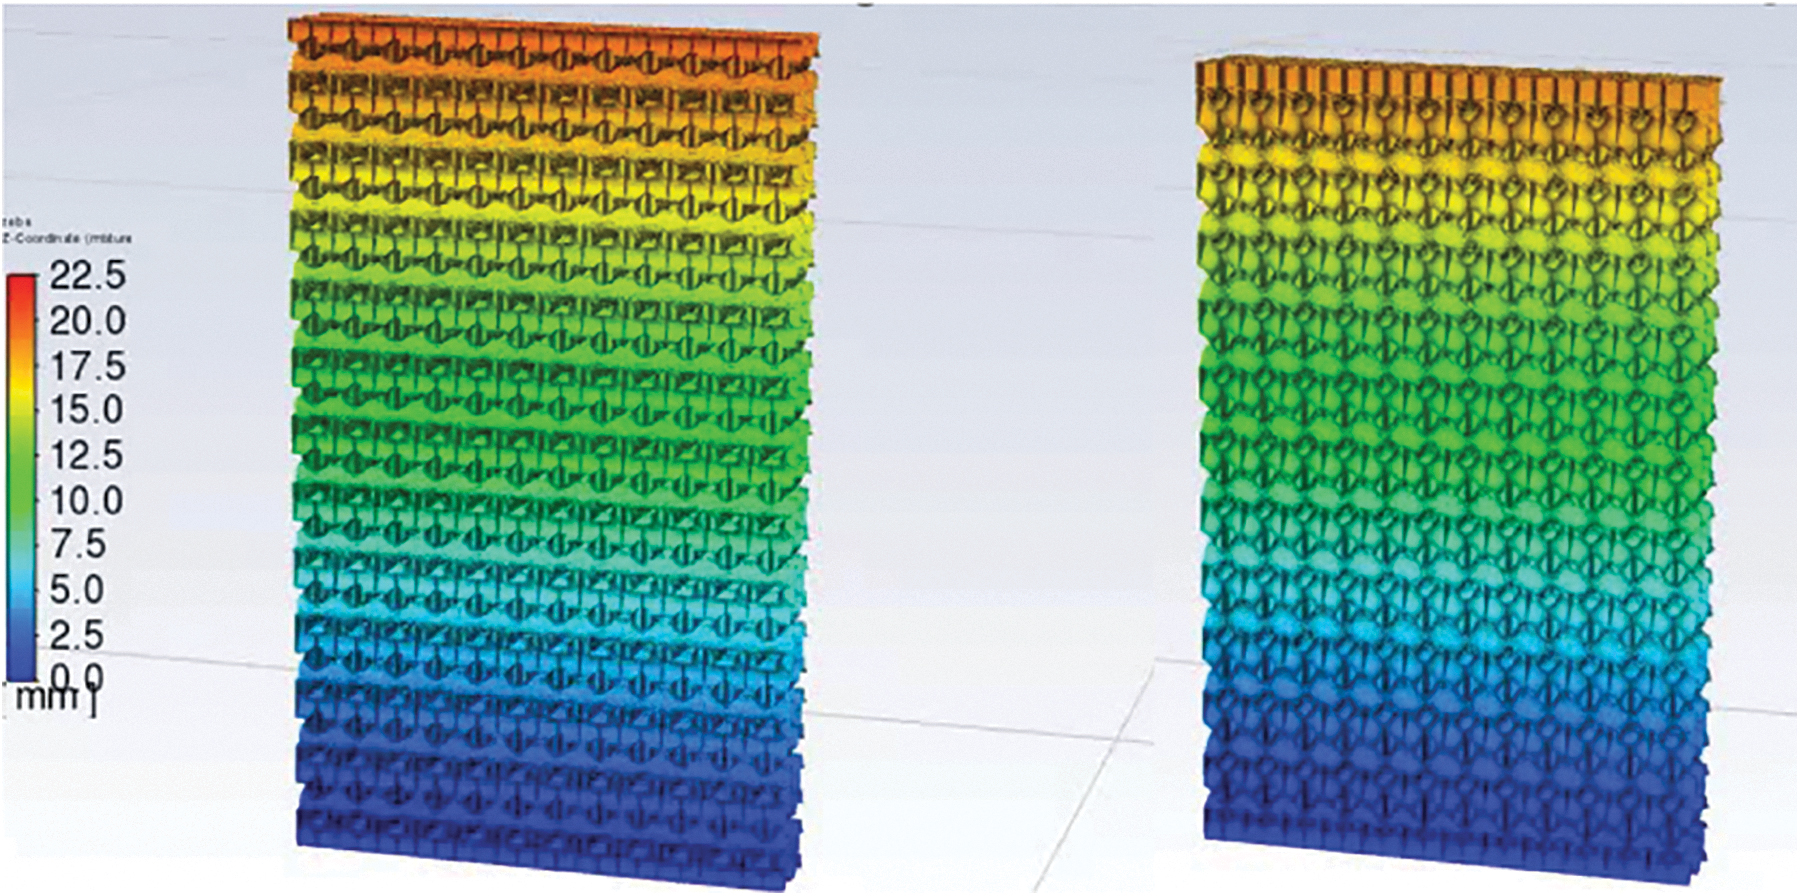
Shrinking of an uncured 50-layer structure of a material with
Conclusions
In the present study, a comprehensive multiphysics model describing heat transfer, non-Newtonian geometry of the polymer ink, its curing, and evolution of the air–ink interface, accounting for surface tension, has been developed. A biviscous HB model was used to effectively simulate the ink rheology. Rheological flow sweep experiments were used to determine the yield stress, consistency factor, and flow index.
A specially designed experiment using the DSC was carried out to determine dependencies between the curing rate, degree of curing, and temperature, which were tabulated and used in corresponding UDFs in the numerical model.
Finally, the remaining critical shear rates of the biviscous HB model values were found using results of a series of dedicated structure shrinkage experiments conducted at several different hold temperatures.
Based on the mathematical model, the numerical model was built using the commercial package, ANSYS-FLUENT, with material properties set up by UDFs. The model will be used for simulations of printed structure deformations in a variety of future applications.
Footnotes
Acknowledgment
The authors thank Dr. Thomas S. Wilson for his insightful comments and fruitful discussions.
Authors' Contributions
A.F. was involved in conceptualization, formal analysis, investigation, methodology, software, writing—original draft, and writing—review and editing. T.H.W. was involved in conceptualization and methodology. F.X., L.X.P.P., and H.Z.A. were involved in investigation, methodology, and writing—original draft. A.L.N. was involved in investigation and methodology. S.J.G. and J.M.L. were involved in conceptualization, methodology, and supervision.
Author Disclosure Statement
All authors declare that they have no competing interests.
Funding Information
This work was performed under the auspices of the U.S. Department of Energy by Lawrence Livermore National Laboratory under Contract DE-AC52-07NA27344. IM release number: LLNL-JRNL-852755.