
Abstract
Microfluidic fuel cells (MFFCs) have been attracting significant research attention in recent years, considering the wider application potential. The application of additive manufacturing to facilitate the fabrication of customized flow channel structures and achieving controlled fluid flow attributes has been demonstrated. The next step is to exploit the wider possibilities with the use of additive technologies and explore the possible implementation of carefully crafted flow pathways to achieve better flow patterns as well as closely controlled reaction sites for better ion exchange. The design, analysis, and experimental validation of three flow channel forms are presented in this article, aiming at the effective use of additive technologies and achieving MFFCs with enhanced efficiencies. The planar, interdigitated, and corrugated honeycomb structures evaluated the target utilization of the infill patterns, elongated reaction sites, and the scaling-up of the cells into multilayer variants, respectively. Numerical simulation, experimental dye-flow, and electrical characterization results indicate that all three forms perform better than the variants reported in the current literature, while the scaled-up level 2 honeycomb structure appears to be the most promising one with the maximum current and power densities at 2.17 mA/cm2 and 812.8 μW/cm2, respectively.
Keywords
Introduction
Based on the colaminar flow of two reactants in a channel, microfluidic fuel cells (MFFCs) offer several benefits, such as quick start-up, portability, high-power densities, and economic viabilities.1,2 The geometrical forms of the flow channels of the reactants are often used as a means of classifying MFFCs, and accordingly, the “T”-and “Y”-shaped channels are the most common. 3
Conventional manufacturing methods used to fabricate intricate microchannels, such as photolithography, soft lithography, and replication techniques, are often time-consuming, cumbersome, and expensive. 4 Given the greater design freedom, additive manufacturing (AM) methods, 5 selective laser sintering,6,7 and Ink-jet printing 8 have been employed to fabricate different components of fuel cells, ion exchange membranes (IEMs), gas diffusion layers, flow plates, and membranes. Overall, these AM components were reported to be outperforming the conventionally fabricated counterparts.
However, the full potential of the application of AM in MFFCs is still unrevealed as the real progress so far is limited to applications such as membrane-less prototype electrolyser, 9 microchannel mould fabrication, 10 and microfluidic chip holders. 11 Guima et al12,13 developed a reusable 3D-printed microfluidic photo fuel cell (μPFC) that harnesses pollutant power under solar energy. This μPFC produces 0.48 mW/cm2 and 4.09 mA/cm2 as maximum power and current densities, respectively. de Souza et al 14 developed low-cost, rapidly fabricated MFFCs utilizing 3D printing. These cells are fed by glycerol and sodium persulfate that developed open-circuit voltage (OCV) up to 1.0 V. Evidently, AM has proven to be a potential solution to resolve certain fabrication issues specific to components of MFFCs. Still, the full potential is yet to be exploited.
In a parallel development, paper-based microfluidic fuel cells (PMFFCs) have come to be researched as a means of overcoming several shortcomings with conventional counterparts, finding major applications in flexible electronics, wearable devices, and point-of-care diagnostics. 15 The capillary action inherent in the microporous structure of the paper, together with the capillary nature of the reactant liquids, alleviates the need to use microvalve and pump systems to maintain a natural mechanism of colaminar flow. 16 A detailed description of the PMFFC fabrication processes, creation of hydrophilic channels, and hydrophobic barriers, and the deposition of electrode zones by screen, inkjet, and wax printing was presented by Tanveer et al. 17 Further, platinum being inert to most of the acid or alkali reagents became an alternative option as the electrode material in fuel cells 18 and MFFCs. 19
Formic acid, hydrogen peroxide, vanadium, formate, hydrocarbons, borohydride, and biofuels were used as fuels, whereas hydrogen peroxide, oxygen, Potassium Permanganate, atmospheric air, and Silver nitrate were used as oxidants. 17 Further, paper was noted as flexible, lightweight, biocompatible, and offering a high surface area for reactant storages. 20 Luo et al 15 developed PMFFCs architecture using single flow delivery of fuel and electrolytes, where the anode is immersed into fuel and electrolytes while the cathode is open to the air.
Compared with conventional colaminar-based fuel cells, the performance of this cell increased by one order and achieved a very high operational lifetime. In addition, an ink-based (silver epoxy dispersed with catalyst ink) 3D printer was used to print cells on paper substrates. Fraiwan and Choi 21 employed CAD software to design a stack of four PMFCs on a single sheet of paper using screen-printed electrodes on a paper substrate. A solid-wax printer was used to pattern the wax boundaries.
Evidently, these PMFFCs were fabricated using multistep processes such as laser engraving, paper-cutting, photo engraving, screen printing, and photolithography, making them relatively costly and unsuitable for mass production. To circumvent these multistep costly processes, Tata et al 22 developed cheap, facile PMMFCs with graphite electrode-based utilizing formic acid and sulfuric acid as fuel and electrolyte, respectively, and demonstrated a maximum open-circuit voltage of 490 mV, a maximum current density of 1.51 mA/cm2, and a maximum power density of 170 μW/cm2.
Despite the numerous benefits, PMFFCs are also fragile, prone to damage easily, incompatible with various strong alkali or acid reagents, and suffer from uncontrolled diffusion of incoming reagents, resulting in material wastage and loss of efficiency. Fabric-based fuel cells developed concurrently to overcome some of the drawbacks of PMFFCs. Fabrics such as cotton and cotton–polymer mix have an inherent ability to wick through capillary action and thus can be deployed in membrane-less fuel cells. Domalaon et al 23 first developed a fabric-based (65% cotton/35% polyester blend) direct formate fuel cell, and achieved a maximum current density of 22.83 mA/cm2 and power density of 4.40 mW/cm2.
Subsequently, carbon-thread from carbon cloth, 24 woven-thread–based, 25 and cotton-thread–based 26 substrates have been tried in MFFCs. These investigations depicted the controlled colaminar flow, higher throughput, and longer operational lifetimes. However, fabric-based fuel cells are based on commercially available substrate materials with limited customized designs. In addition, scalability is not established yet. Developing the intricate design with functional architectures is not possible or has not progressed yet. Evidently, the paper/fabric-based MFFCs, though offering promising prospects, suffer from all these drawbacks, which require further investigations and developments in materials and methods.
The authors have demonstrated using AM as an alternative means to replace the paper or fabric options with thin-layer polymer printed parts as substrates or flow channels constructed by 3D printing. 19 The possibilities to build functionally graded and porosity-controlled flow channels, together with the use of controlled rasterization to customize the flow paths of the reactants, were clearly demonstrated based on different materials for the substrates. However, the possibility of extending this to building multichannel and intricately shaped flow channel substrates is yet to be extrapolated, targeting better power densities and voltages.
Influences of raster orientations at ±45°, 0°, and 90° were explored, but the role of the infill patterns that can be also controlled during printing in facilitating the capillary flow similar to the paper-based mechanisms is still an option for further performance enhancements. The scalability of single MFFCs also needs to be addressed more closely. A conventional Y-shaped flow channel has a single line of interface where ion exchange occurs, thus restricting the performance of cells. The generation of intricate multiple interfaces is not possible easily by conventional methods. There has been no evidence of any research conducted in these lines yet; hence, it forms the basis for the gaps addressed in the current research.
A scalable flow channel is possible by making honeycomb structures having multiple inlets and outlets, offering partial reuse of reagents, which the authors believe as the first attempt toward reusing reagents in MFFCs based on flexible substrates, unlike the conventional Y-shaped one with only two inlets and one outlet. For the intricate multiple interface architecture, an interdigitated structure is considered as an option.
Materials and Methods
Materials
The LAY-FOMM polymer materials commercially made available by MatterHackers, which are composed of rubber-elastomeric polymer and polyvinyl alcohol (PVA), have been finding applications in drug delivery systems, 27 tissue engineering, 28 as high elongation biocompatible polymer materials, 29 and low-cost and customized shape sorbents. 30 The foamy LAY-FOMM 60 filament (1.75 mm) polymer filament is used in this research as the raw material to print the flow channel structures. The flow channel substrates develop the necessary porosity once the printed sample is soaked in water for ≥48 h to dissolve the PVA component and leave the structure porous.
Formic acid (HCO2H) 98% and sulfuric acid 99% (H2SO4) sourced from Sigma-Aldrich are used as fuel and electrolyte, respectively. Deionized water is used to bring the concentrations of fuel and electrolytes down to 1M. The sputter coating system Hitachi E1045 Ion Sputter at the Auckland University of Technology (AUT) materials testing laboratory is used to coat a thin film of platinum on the flow channel to serve as the electrode. Picolog 1216 datalogger, a general-purpose voltage data logging device, is procured from R.S. Components and used in the current experiments.
CAD modeling, design, and fabrication of polymer-based flow channels
In a conventional Y-shaped flow channel, the incoming reactants mix in a colaminar manner, where the actual reaction occurs, and consumed species are drained out at the sink. This configuration has a single line of mixing, which gradually becomes wider as the reactants proceed toward the sink. Since the actual reaction occurs at the interface site of incoming reactants, increasing the number of interfaces leads to more reacting sites. In the past, the interdigitated architecture was employed in the proton exchange membrane fuel cell flow field, achieving increased overall current and power density values. 31
Some other applications include micropatterned interdigitated electrodes for solid oxide fuel cells 32 and electrical lysis technique based on the interdigitated electrode with a D.C. field for a microfluidic device. 33 The interdigitated architecture is designed and developed to make whole components compact, and render large reaction sites. However, the use of interdigitated architecture-based flow channels for MFFCs has not yet been reported. Consequently, the Y-shaped flow channels are modified with the interdigitated configurations in this study, achieving multiple interfaces and reaction sites coupled with highly controlled flow, targeting better performance of MFFCs.
Scaling-up/stacking is a strategy employed in energy devices to generate the required voltage or power for practical applications, by connecting single-unit cells in series, parallel or parallel-series formats. Scaling-up attempts were employed in PMFFCs in the form of either connecting individual cells or implementing origami techniques. Rewatkar et al 34 stacked four Y-shaped PMFFCs in series onto a 3D-printed platform. This setup delivered an OCV of 1.65 V with a power density of 46.4 μW/cm2.
Villarrubia et al 35 developed a quasi–two-dimensional (2D) stack of three cells connected in series in a fan shape using glucose as fuel, and this setup generated an OCV of 1.8 V to power a digital clock for 36 h. A customized stacking setup is proposed by Shitanda et al., 36 where desired output in terms of OCV and power density is obtained by connecting a number of cells in series/parallel. The four-series/four-parallel setup developed 1 mW power at 1.4 V. Unlike 2D stacking techniques mentioned before, 3D stacking employs folding 2D unit cell into stack of 3D parallel/series connected cells, by adopting origami technique.
Fraiwan and Choi 21 developed stackable two-chambered, assembled in an origami manner, four cells connected in series developing a peak power density of 1.2 μW/cm2. Although cut-stacking/fold-stacking seems promising for generation of power enough for real-world applications, none of the above literature designed and developed PMFFCs, which can reuse and recirculate the reactants. In addition, due to the repetitive folding/unfolding of origami-based stacking setup, electrode connection gets damaged and increases ohmic losses. So, a novel scaling-up strategy is proposed, where repeating the Y-shaped unit cellular structures in selected coplanar configurations to create multibranch flow channel structures is used as the strategy in this study.
The regular hexagonal honeycomb structure is an immediate option, based on inspirations from various applications in different streams of engineering, bioscience, and nanofabrication. 37 Based on these observations, a compact honeycomb structure architecture is expected to be used for the multibranch flow channels for better fuel utilization by partial reuse of reactants from lower level to upper level flow channel. Connecting the Y-shaped single-unit flow channels in series and parallel manner leads to the honeycomb multicellular structure for the flow channel. This architecture is envisioned to increase the current and power density values based on the order of architecture, and also allows one to achieve customized output by arranging the basic unit cells in various combinations in series and parallel.
A makeshift fused deposition modeling test setup available at the Additive Manufacturing Research Centre of the AUT is used for all printing tasks. Several initial trials were conducted with LAY-FOMM 60 filament, varying the critical process parameters, and the final optimum settings are identified to be print speed 20 mm/s, infill speed 16 mm/s, layer height 0.15 mm, layer width 0.40 mm, rectilinear infill pattern, infill percentage 90, nozzle temperature 220°C, and retraction speed 20 mm/s, which are applied to all the experimental flow channels printed. The CAD model of the interdigitated structure based on a conventional Y-shaped flow channel is designed using the SolidWorks software package.
The initial experiment with the split tool and extrusion tools of CAD software, which did not offer the desired result, an offset of 10−2 mm on each side of the contour was created using the SolidWorks offset tool, and the model developed based on Figure 1a; and 3D printed using the test material filaments allowed to produce the monolithic interdigitated flow channel model as shown in Figure 1b, which served the purpose of controlling the flow patterns as needed. Initially, laser cutting is tried to create the contour of separation at the interdigitated region of the flow channel.
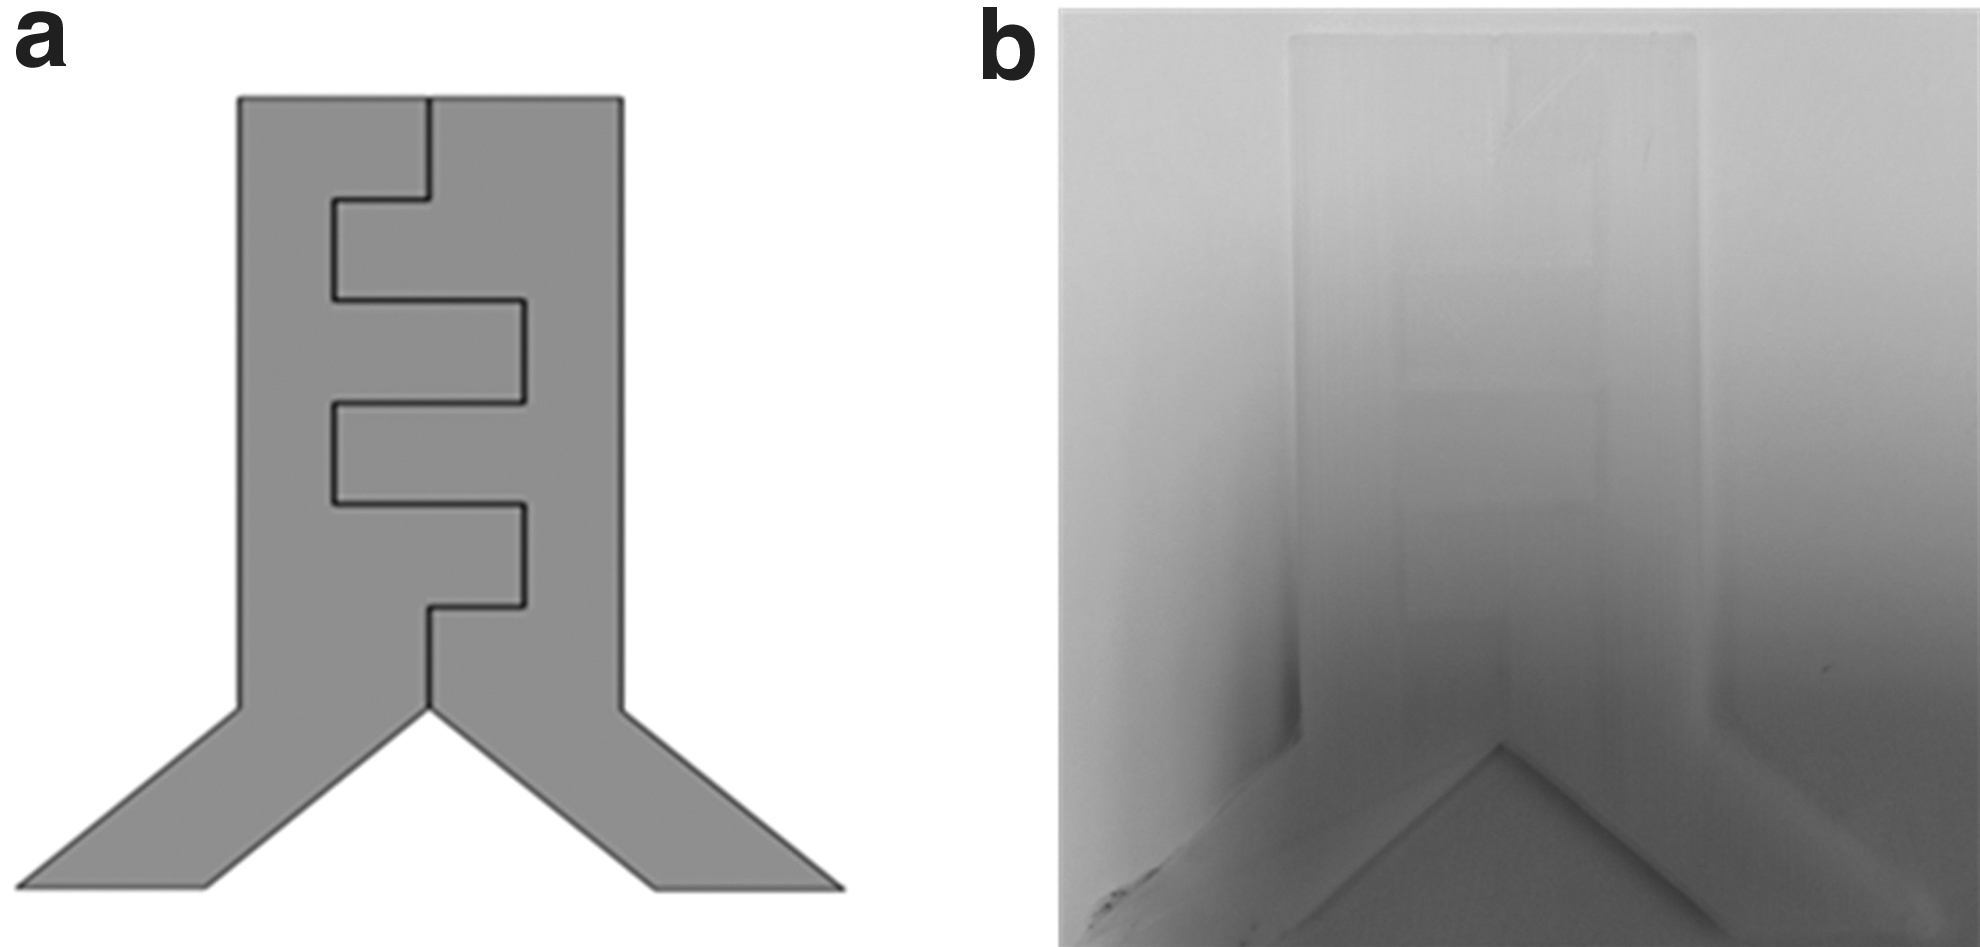
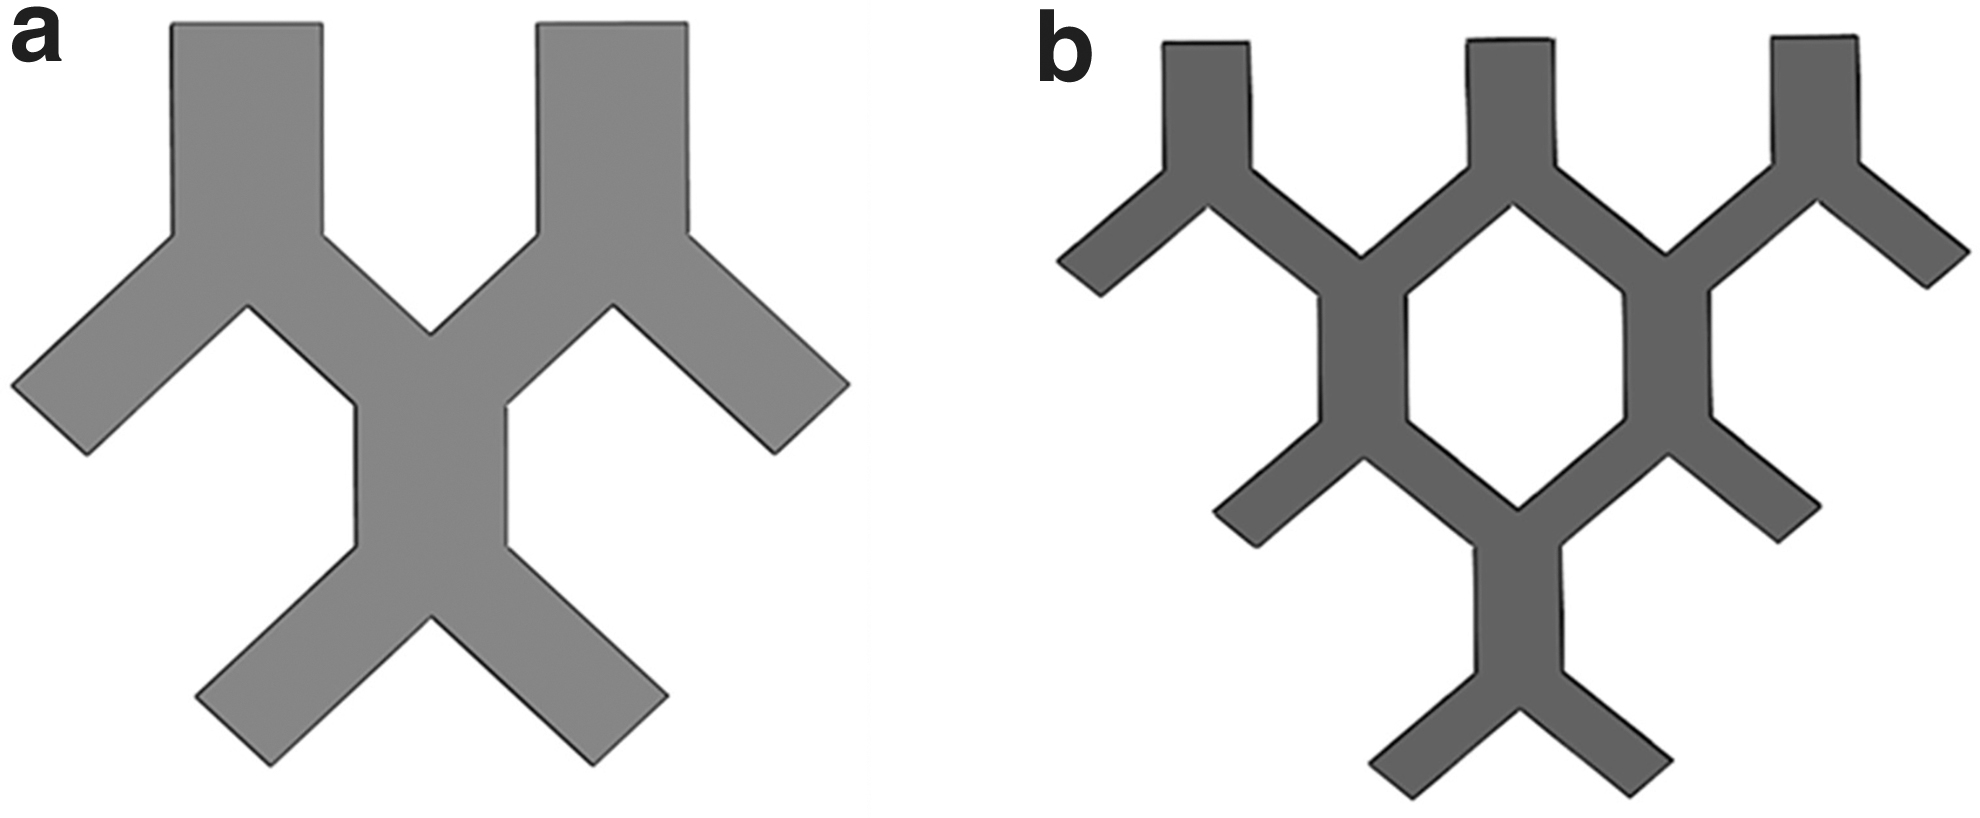
Intermittent cutting with a partially connected contour, as shown below in Supplementary Figure S1a, is developed on the printed sample. However, the dye-flow test discussed in later sections and shown in Supplementary Figure S1b showed uncontrolled crossflow at these partially connected interfaces. The CAD model design of the honeycomb structure is shown below in Figure 2, where the level represents the additional layer from the base Y-shaped microchannel (level 1). Figure 2a represents the level 2 honeycomb, whereas Figure 2b represents the level 3 honeycomb structure.
Honeycomb planar architectures at
Numerical simulation setup of the fluid flow patterns
Numerical simulation is greatly helpful in visualizing and predicting the flow behavior and mixing patterns of liquids, which eventually decide the efficiency and performance of the MFFCs. There has been considerable progress in using mathematical and computational modeling methods to analyze the flow behavior inside MFFCs. 38 In addition, numerical simulations are done to evaluate the capillary rise of water through various flow channels such as paper,39–41 polymers, 42 and cotton yarns. 43 Finite volume analysis is done using the Ansys fluent package, following the same procedures as outlined elsewhere by the authors. 19
Ansys fluent can be used to visualize the mixing of two liquids in a branched or scaled-up flow channel and the interdigitated arrangement, and rectify the design to achieve the desired flow characteristics and mixing patterns. However, numerical simulation of the flow characteristics of multiple liquids entering through multiple inlets, especially considering the wicking phenomena through paper- and polymer-based flow channels, has not yet been widely undertaken and reported.
Computational fluid dynamics models based on ANSYS fluent software are used in this work to analyze the capillary rise of the miscible fluids due to wicking in different configurations of the porous Y-shaped flow channels. Considering Y-shaped paper as a flow channel, with homogeneous and isotropic properties, with two inlets dipped into two different miscible liquids, the liquids would start to rise displacing the air present in the medium. As the liquids move upward in the two parallel flow regions, the interface region of the cross-stream diverges from a narrow to a wider area, depending on the diffusivity of the incoming liquids.
Further, the mixing zone will widen as the liquid stream moves upward. The degree of mixing is defined by the peclet number, where a higher peclet number represents a wider mixing zone. Detailed descriptions of the finite element models are reported elsewhere in a previous publication by the same authors. 19
In this work, the comparison between the numerical and experimental results is confined to paper-based experiments only and so is based on the same internal capillary structure. With the subsequent flow channel structures, the macrodesign features, such as the strands resulting from the raster scheme of printing, become predominant in driving the fluid flow, which is reflected in both the numerical and experimental dye-flow test results. The internal capillary structures resulting from these rasterized polymer consolidation mechanics are difficult to comprehend and consider in the numerical simulations. As a result, the focus is gradually shifted more toward the dye-flow results as the flow channel architecture becomes more intricate with the printed corrugated and interdigitated models.
Experimental dye-flow test
The purpose of the dye-flow tests is to experimentally visualize the mixing patterns of two miscible liquids in different configurations of the flow channels. Interdigitated and honeycomb configurations have their own significance as evaluated based on dye-flow tests and numerical analysis. The dye-flow tests for Y-shaped A4 paper and 3D-printed flow channels with various infill angles such as ±45°, 0°, and 90° were reported earlier by Kumar et al. 19 The present research used infill angles 0° and 90° combined in each printed layer, expecting the outcome mesostructure to resemble the internal structure of an A4 paper and replicate the same flow behavior.
Initial dye-flow tests are performed on A4 paper substrates considering homogeneous and isotropic structures. This test setup, thus established, is then used for dye-based tests on the corresponding printed flow channels. The dye-flow test is performed on the A4 paper-based interdigitated flow channel, as well as the honeycomb-shaped flow channel at level 2, which are developed by laser cutting for the shapes presented in Supplementary Figure S1c and Figure 3b, respectively. Dye liquids in green and red colors are taken individually in two different glass containers, which serve as the reservoirs from which the two liquids rise through the two inlets of the flow channels of different configurations.
The dyes are food colors (purchased from the local supermarket), which are diluted with deionized water before performing the experiment. The dye-flow phenomena, as well as the mixing patterns based on the different flow channel configurations, can be established through these tests, which serve the purpose of experimentally verifying the numerically predicted flow patterns.
Electrode setup and electrical characterization
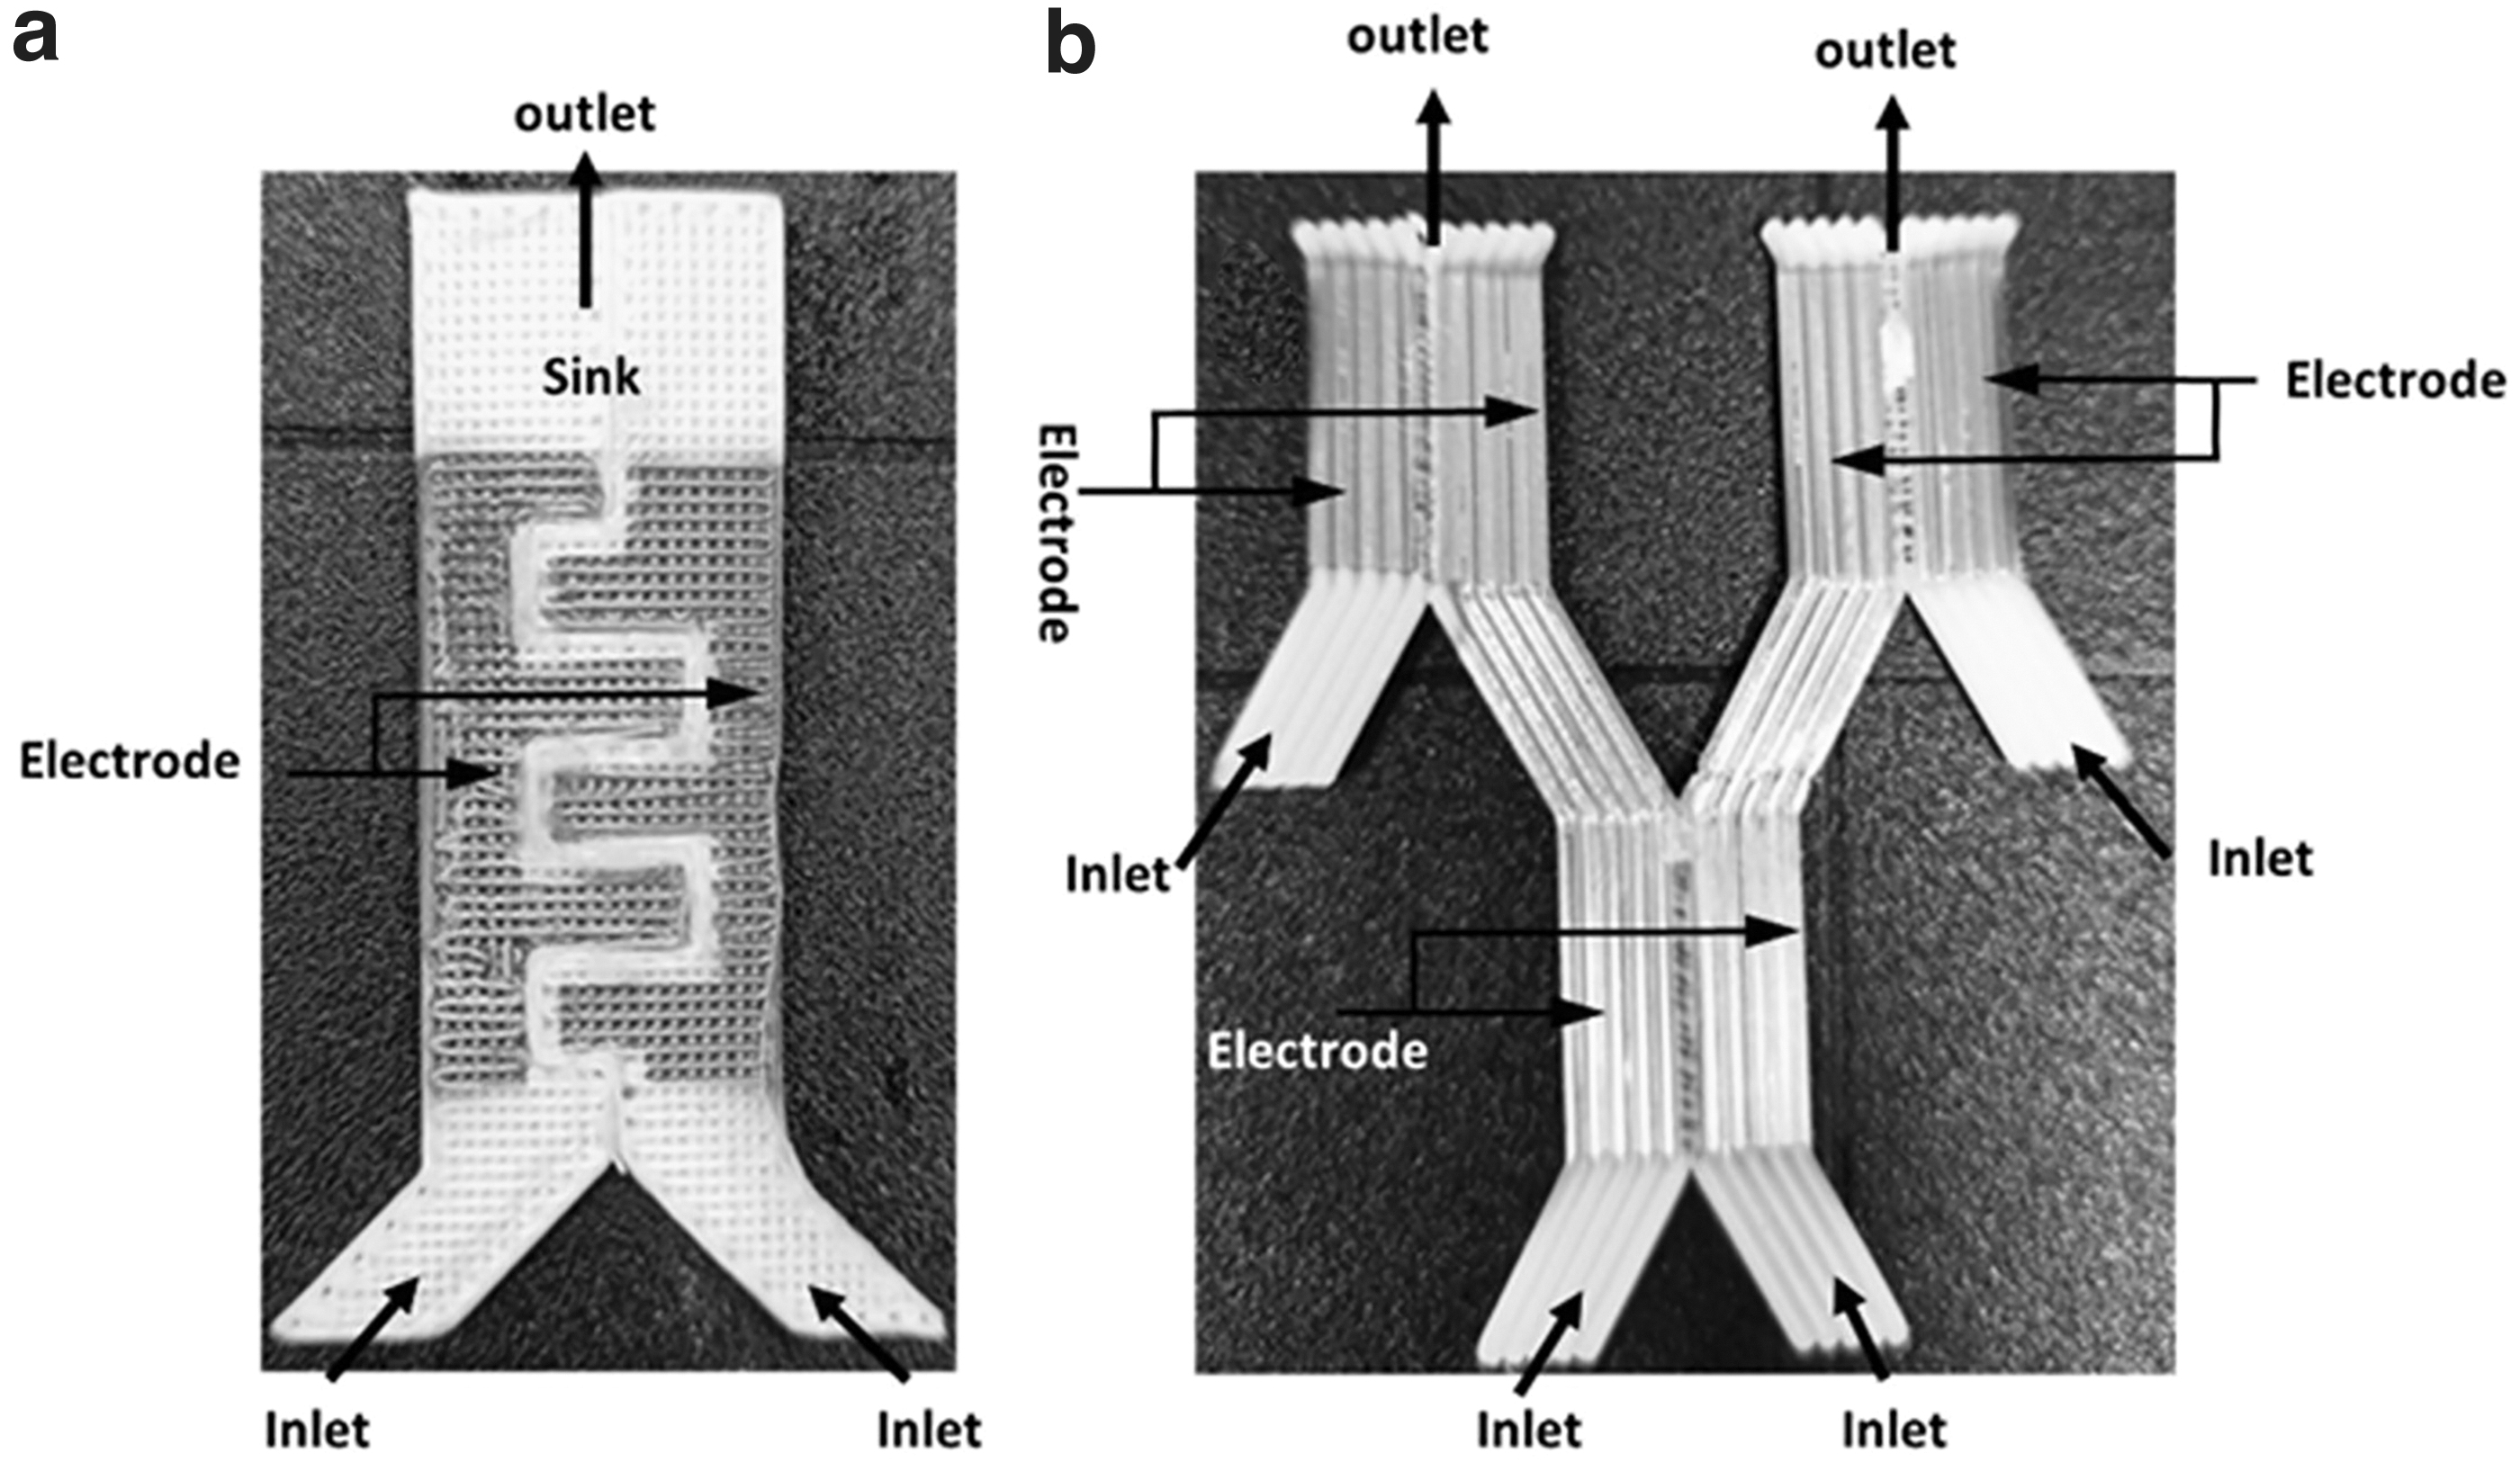
Once the flow-channel structures are printed and soaked in water to make them porous and then dried, the next step is to develop the electrodes on the flow channels. Kumar et al 19 discussed different electrode development methods as well as their drawbacks, and finally converged on platinum-based sputter coating as the best possible option. Accordingly, the current research also uses the platinum-based sputter coating method to develop the electrode zones on the printed flow channels. The dimensions of the electrode coating and flow channels, as reported by Kumar et al., 19 are used here for the interdigitated and two-level corrugated honeycomb flow channels as well, as shown in Figure 4.
Electrodes based on
In each case, the sputter coating parameters are working pressure 7 Pa, argon gas flow 30 sccm, sputtering current 25 mA, at room temperature, and for 5 min at a rate of 10 nm/min, depositing a coating of thickness 50 nm at the end, approximately. The target material used here is platinum. The gap between the electrodes for the corrugated honeycomb and interdigitated flow channel is kept at 2 mm to draw the charged ions across the electrodes. Due to the limitation of the sample size that can be placed in the Ion-beam sputter coating chamber, no sink reservoir could be printed integral to the corrugated honeycomb flow channel. So, a printed sink reservoir has been externally attached to the two outlets to serve as the sinks for the electrolyte liquids.
The portions of the substrate where the sputter coating is not required are masked with laser-cut paper forms stuck on the printed flow channels before sputter coating. This has resulted in some slight variations in the dimensions of the electrode zones and the gaps between them. The scanning electron microscopy (SEM) image of the coated printed sample is shown in Figure 5, clearly elucidating a uniform coating throughout the desired location.
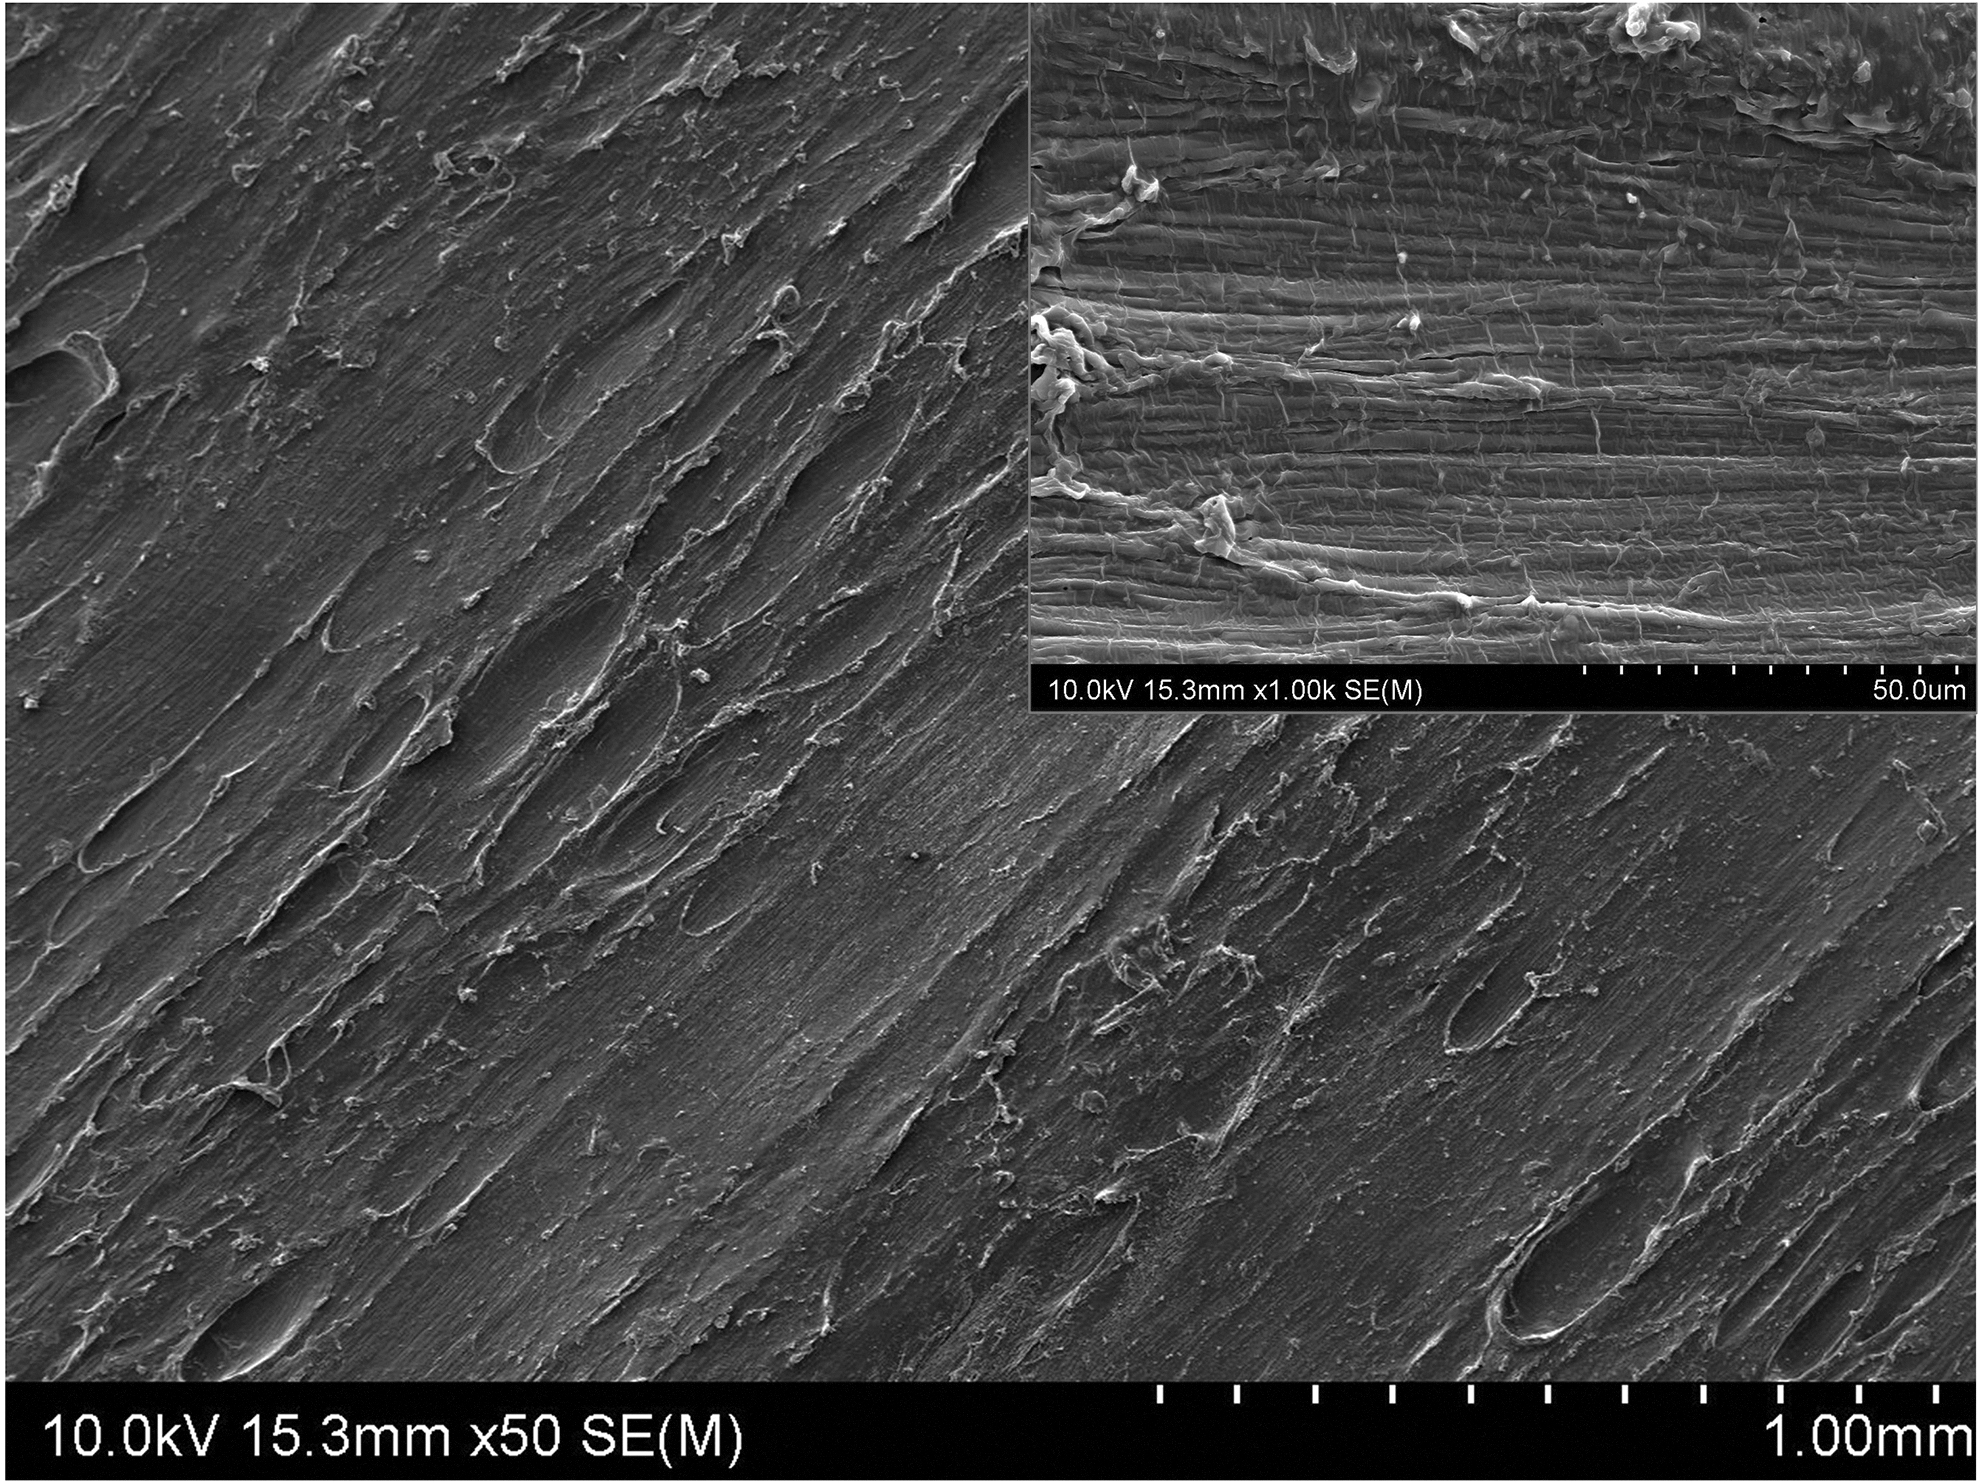
SEM image of coated printed sample, 1 kX magnification (inset). SEM, scanning electron microscopy.
OCV (mV), maximum current density (mA/cm2), and power density (μW/cm2) are the critical responses for the electrical performance characterization undertaken in similar lines to the procedures detailed elsewhere. 42 The schematic depiction of the electrical setup of the MFFC is shown in Figure 6. Essentially, the inlets of the flow channels are immersed into the fuel and electrolyte reservoirs, and the electrical measurements are made through the Fluke 179 TRMS digital multimeter connected to the electrodes.
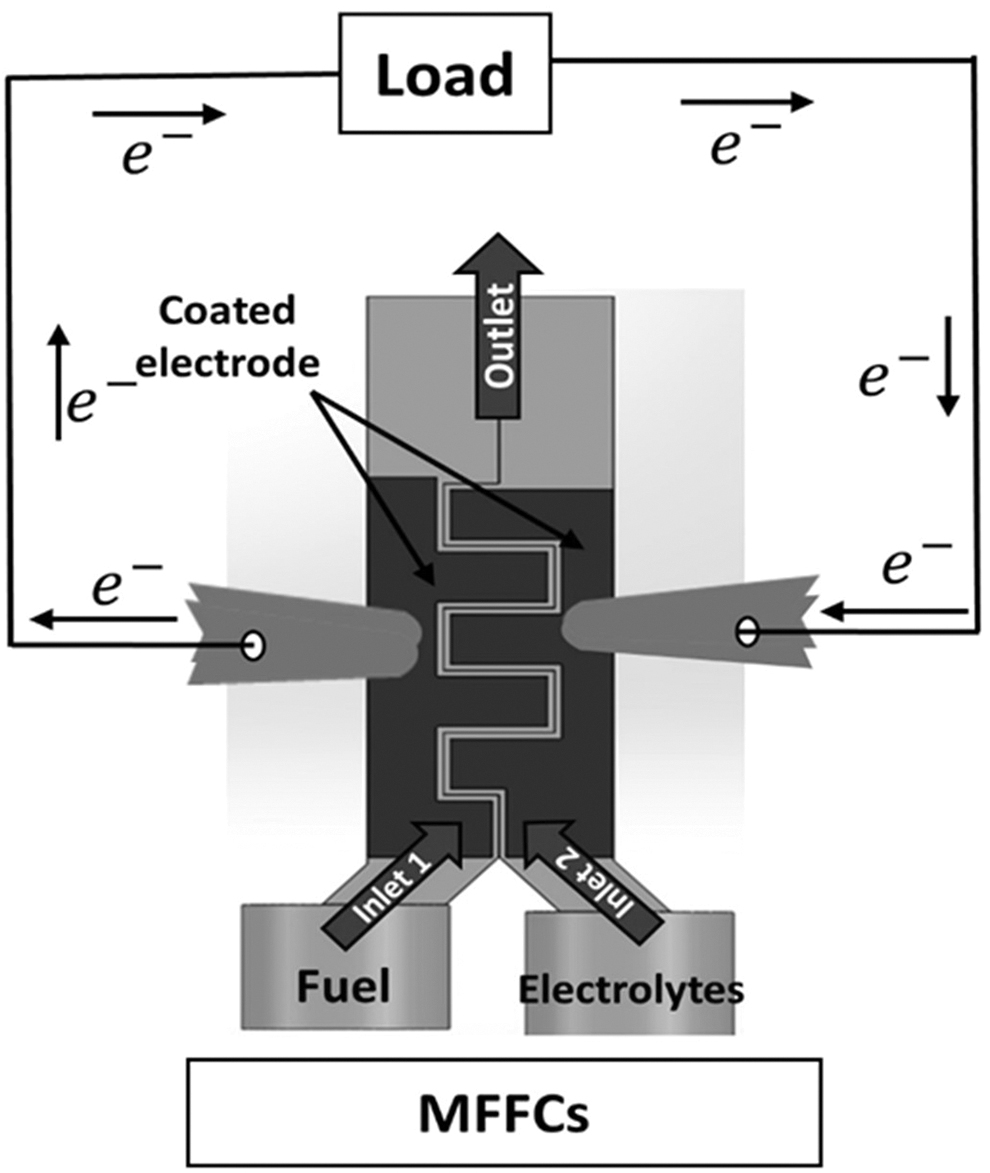
Schematic representation of the experimental setup for the electrical characterization of the fuel cells.
A datalogger Picolog1216 is connected in parallel, which communicates to software where the data transferred are converted into voltage versus time graphs. In addition, the resistance box Heathkit Model IN-3117 Decade Resistance allows one to vary the resistance values at 1, 10, 100, and 500 kΩ, leading to the construction of the load and polarization curves for different flow-channel configurations. Three replicas are undertaken with each architecture to establish the variation and the statistical significance of the experimental data gathered.
Results and Discussion
Numerical simulation for fluid flow pattern
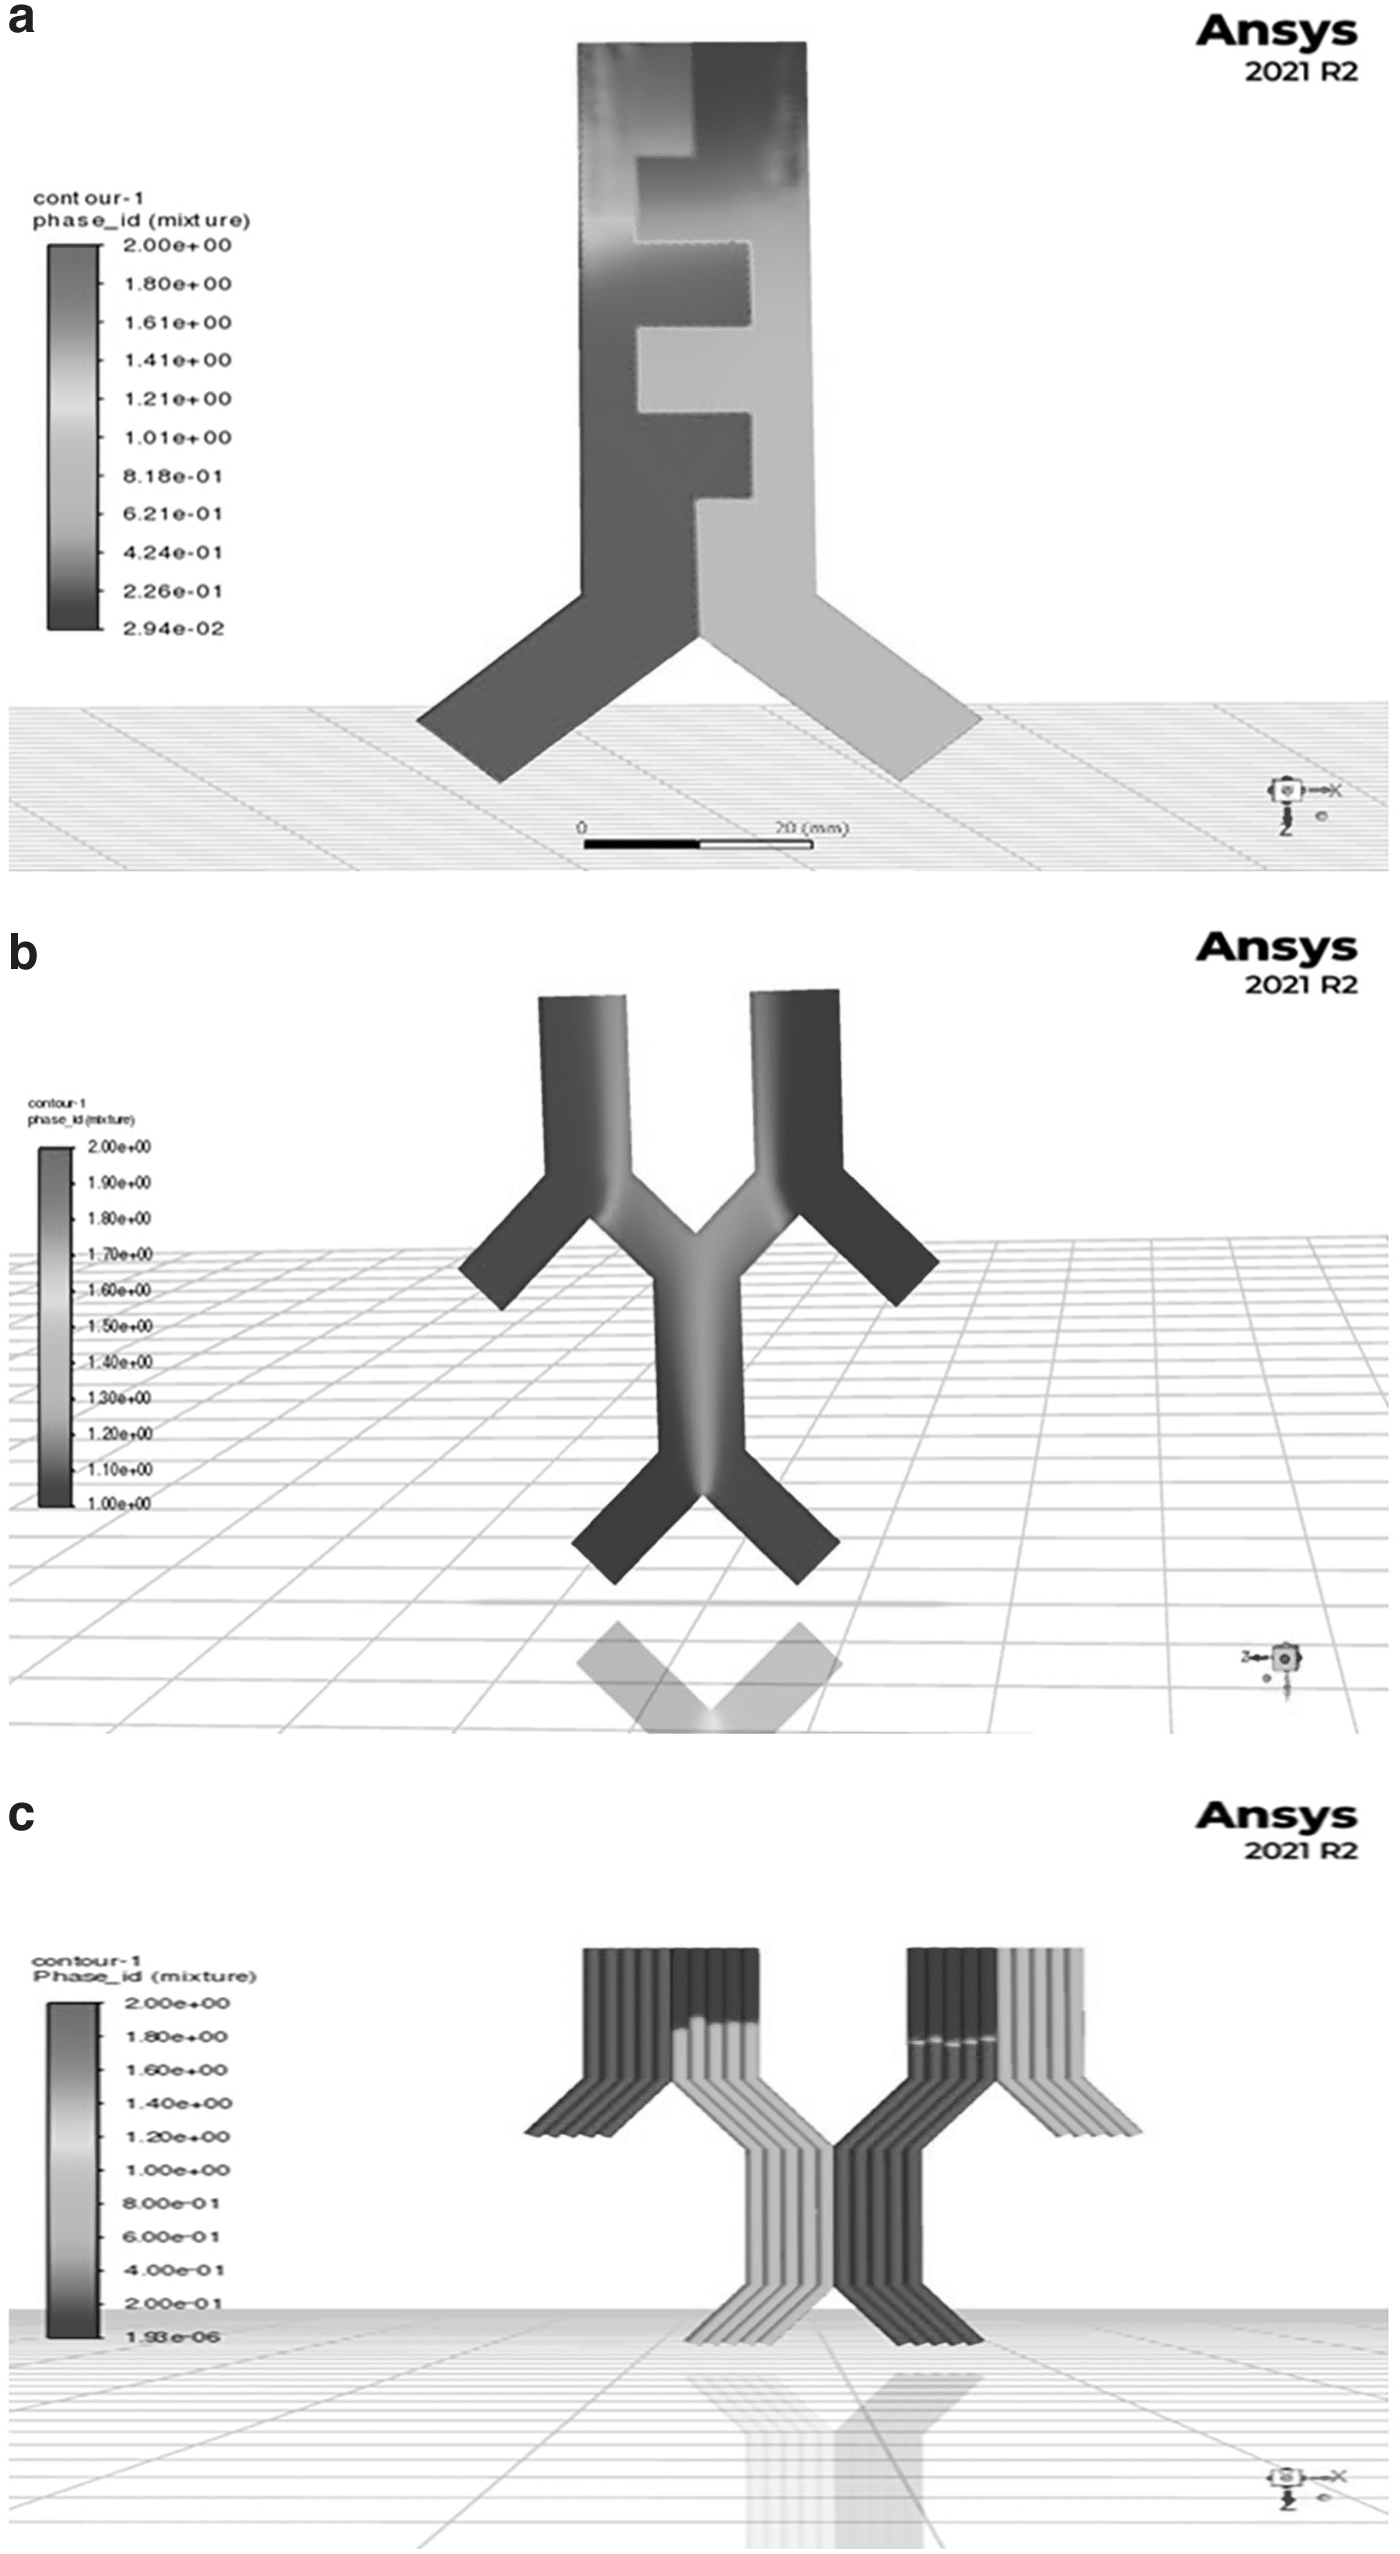
Results of the numerical simulations developed considering water (marked red) and ethanol (marked green) passing from each side of the interdigitated flow channel are presented in Figure 7a. Since the boundary conditions for mating surfaces are set as “wall,” no mixing of the two fluids is evident in this case. However, if mating surfaces are imposed with “internal” boundary conditions, the fluid surfaces will merge in ways similar to the planar Y-shaped flow channels. The simulation depicts the multimating surfaces with the reaction sites. In addition, each fluid always follows a specified channel path irrespective of the fluid properties, and a sharp interface is achieved at desired locations.
Fluid flow contour plot obtained from numerical simulation of the two-phase flow in an
Figure 7b shows the numerical simulation results of the fluid flow patterns in a planar honeycomb structure with two levels. The blue and red regions represent the water and ethanol fluid phases, respectively. As already stated, the level represents the number of additional layers added beyond the base Y-shaped flow channel. There is no limit to the number of levels that can be added, but in the current research the focus is limited to a two-level flow channel–based simulation. The base level (level 1) fluid flow pattern is the same as observed in the Y-shaped planar flow channel. 19 For the level 2 flow-channel structure, the positions of the reservoirs of the two fluids are flipped as water and ethanol are allowed to flow from the right (blue) and left inlets (red), respectively.
The contour plots of Figure 7b show water from level 1 (left) mixing with ethanol from level 2 on the left side and the ethanol from level 1 (right side) mixing with water from level 2 (blue) on the right side. By the time the two fluids from level 1 reach level 2, the corresponding liquids at level 2 already occupy their respective zones in the flow channels of level 2. This has shown the initiation of the downward flow of the level 2 fluids due to gravity. Further, colaminar flow behavior is not observed at level 1.
Based on these numerical results, it is evident that the multilevel honeycomb-type structural arrangement is not effective with planar flow channels in terms of fluid flow and dispersion across the reaction sites of the MFFCs. An improvement is possible by replacing the planar structure with the corrugated one achieved by means of controlled raster path printing used to fabricate the honeycomb structure. The corrugated raster paths will result in controlled movement of liquids at both levels 1 and 2. In addition, the liquids moving through the level 2 flow channels will not detrimentally influence the nature of fluid flow in the channels as the raster paths control the flow patterns.
A corrugated two-level honeycomb-type flow-channel structure is considered next for the numerical experiments, and the fluid flow contour results obtained are shown in Figure 7c. Highly controlled flow patterns strictly confined to the respective fluid flow zones can be observed in the numerical predictions of Figure 7c. There is also no evidence of any crossflow and formation of mushy mixing zones across flow paths. Further, it is possible to scale up these controlled flow patterns even with the multilevel expansion of the cell structures, achieving maximum fuel utilization and better performance in actual MFFCs.
Experimental dye-flow tests
The dye-flow tests are intended to experimentally validate the numerical simulation results. It may be noted that it is not practically feasible to simulate the exact flow conditions as imposed by the different raster patterns. As a result, the experimental dye-flow tests serve the purpose of clearly experiencing the true nature of flow in different cases. To establish the significant flow characteristics, both printed and paper-based flow channels are verified in this case.
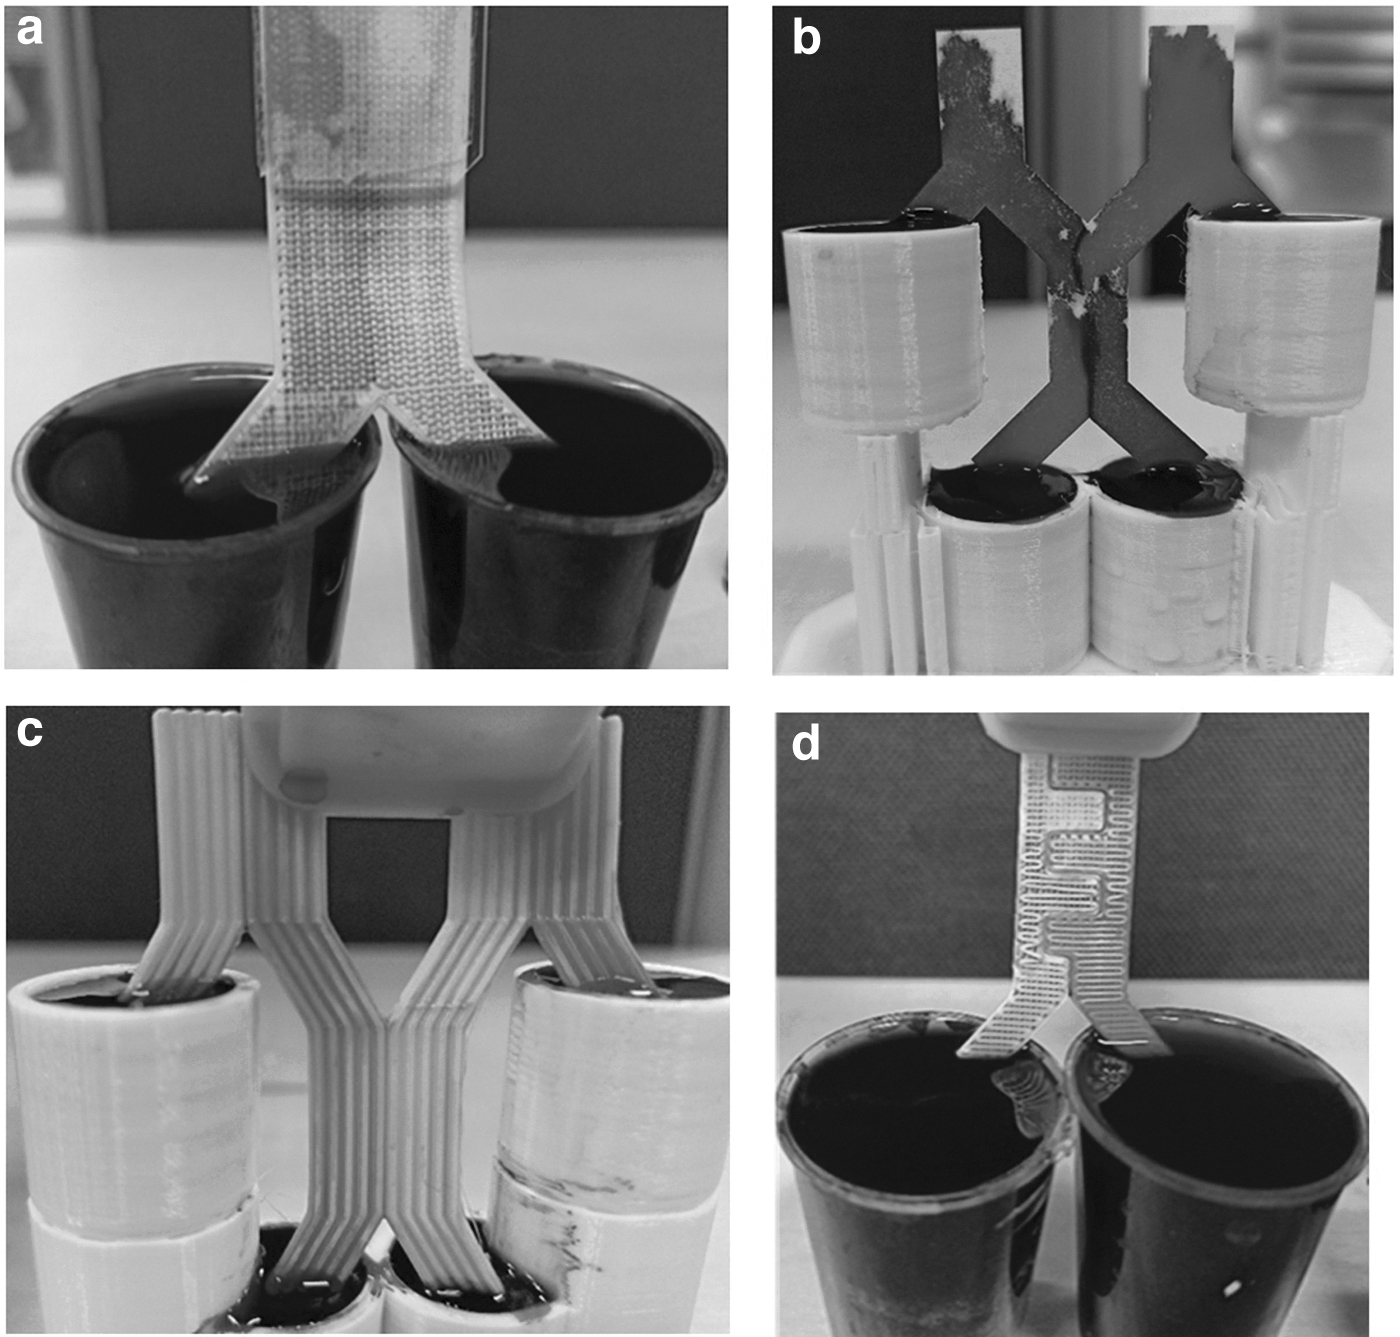
Also, in printed samples, different means of controlling the raster pathways are considered to establish their influences on the flow patterns of the dye liquids. Figure 3a represents the capillary rise of dyed liquids observed in a test performed on a Y-shaped printed flow channel with infill angles 0° and 90°in alternative layers. Flow behavior and mixing patterns closely resemble those obtained using an A4 paper with colaminar flow. This pattern of fluid flow is expected to result in better cell performance when deployed in actual MFFCs.
For the interdigitated and the multilevel honeycomb-type flow channels, an initial paper-based test is necessary to get an impression of the flow patterns, as this is the first time such models have been evaluated. The flow and mixing patterns obtained using the paper-based interdigitated flow channel produced by laser cutting of a paper are shown in Supplementary Figure S1c. The flow pattern, though better balanced, is very close to the Y-shaped channel, and the mixing zone has not followed the interdigitated separation pathway. As a result, the cell performance will be similar to that of the Y-shaped flow channel, and the expected enhancements with the interdigitated pattern may not be achieved in practice.
The numerical simulation result (Fig. 7a) predicted a sharp boundary between the two fluids along the interdigitated pathway due to the “Wall” boundary condition imposed, as already stated. If a mixing pattern is imposed, this would have given a flow path following the interdigitated pathway. However, the ANSYS Fluent module used does not have a matching interface condition readily available, and other alternative boundary conditions available are found to be unsuitable for validating the mixing zone conforming to the interdigitated pathways.
The paper-based planar two-level honeycomb structure was also evaluated for the flow of the two-colored dyes acting at the two levels simultaneously. The resulting flow patterns, as shown in Figure 3b, clearly indicate the level 2 fluids overflowing and imposing on the level 1 fluid flow with time. Evidently, scaling up the MFFCs through multilevel replication is not feasible with paper-based flow channels. The corrugated honeycomb structure is the most promising solution for controlled fluid flow through the channel, per the numerical predictions presented earlier.
In actual printing, it is possible to use different infill patterns and angular orientations for these multilevel flow channels. However, many of these fill patterns and the raster angles may lead to widely different scattering of the fluids, resulting in unfavorable flow patterns in the channels. A couple of such failed cases are shown in the dye-flow patterns obtained and presented in Supplementary Figure S2. Further to these experiences, a simple corrugated two-level honeycomb flow-channel structure was printed and put to the dye-flow test with the same flow arrangements as in the case of the paper-based case.
The dye-flow results are presented in Figure 3c. It is evident that the corrugated and stranded structure resulted in the best control over the flow of the two fluids along the different flow paths created. The physical barriers imposed across different flow regions as a result of the controlled corrugated printing helped to restrict the fluids with their respective zones, and there is also no evidence of any overflow and overlapping of the fluids from level 2 on the flow zones in level 1. These experimental flow patterns are also exactly in similar lines as predicted by numerical means. This type of structure is also easily amenable for scaling up into multilevel cellular structures later. In addition, reuse of liquids from level 1 to level 2 is clearly seen in the current arrangement.
The next step is to validate the flow pattern in interdigitated flow channels, where some initial experiments are performed, before converging to the final design as shown in Figure 3d. A case of such a failed experiment performed on an interdigitated flow channel developed by extrusion-based SolidWorks CAD tool, expecting to obtain much higher interfacing area, is shown in Supplementary Figure S4.
The flow pattern results in Supplementary Figure S4 indicate a reasonably streamlined flow in the vertical pathways on either end of the arrangement, but the horizontal ribs across the interdigitated regions suffered from the lack of fluid flow. This is due to the lack of a connected capillary structure, as the slicing software created a barrier across the vertical and the horizontal bars, imposing a thin wall of separation between the two regions.
Apparently, the horizontal flow zones need to be wider and well integrated into the vertical feeder columns through a continuous network of fine pores to impose capillary action around the bend and from the vertical feeder to the horizontal crossbars. To achieve this, an intermittently connected interdigitated flow channel structure, as shown in Supplementary Figure S1a, is produced, whose dye-flow test result is presented in Supplementary Figure S1b. The full form of the Y-shaped flow channel is printed with controlled rasterization at 90° angles (aligning the strands in the flow direction) along the two branches of the flow channel.
The printed sample is laser cut to impose the intermittently joined or cut interdigitated separation between the two flow paths. The dye-flow patterns indicate the 90° alignments of the raster paths, helping the flow of the dyes along the two flow paths relatively easily, but the mixing zone, although more prominent and wider compared with the model in Supplementary Figure S4, is still mushy and not strictly following the interdigitated pathway as expected and needed.
The 3D-printed prototype of this model, using 0° and 90° raster paths in alternate layers, is presented in Figure 1b. Closely considering the color patterns in Figure 3d, it may be observed that both the flow of the primary fluids and the subsequent intermixing patterns are per the functional needs of the MFFCs, thus projecting this as the successful model for the flow of the fluids as well as the ion exchange processes across the interdigitated boundaries. There is only one final bottleneck to be overcome. In the actual functioning of the MFFCs, the consumed species at mating surfaces need to be drained out into the sink, while the cells get replenished with a fresh supply of fluids continuously to the reaction sites.
The flow channel structure in Figure 3d leads to the stagnation of the species at the reaction sites. After a few different trials, it was found that a piece of paper laser cut to the required shape of the interdigitated boundary and integrated into a sink can alleviate this problem if it is glued to the reaction sites of the printed flow channel. The paper bridge thus produced and attached at the boundary between the two flow paths resolved the stagnation issue by successfully driving the reactants into the sink.
An image of the laser-cut paper bridge is presented in Supplementary Figure S3. It may be noted that the paper-based solution is employed here for quickly resolving the stagnation issues, but the same can also be replaced by a printed polymer counterpart with suitable meso- or microstructures to serve the same purpose and also provide the necessary service life. The electrical performance characterization and the ensuing results are presented next, and from the foregoing discussions, it may be pertinent to point out that three specific flow channel configurations are of interest, and these are referred to as planar, corrugated honeycomb, and interdigitated structures in the following discussions.
Electrochemical performance
The electrical performance characterization of MFFCs is done by evaluating the critical responses stabilized open-circuit voltage (mV), maximum current density (mA/cm2), and power density (μW/cm2) based on planar, interdigitated, and corrugated honeycomb structured flow channels as discussed above. In each case, once the cell is set up as explained in the Materials and Methods section and the inlets of the cell are immersed in the two reservoirs, the electrolyte and the fuel liquids of 1M concentration each begin to rise through the flow channel due to the capillary action within the porous structure.
The data necessary for plotting the OCV versus time graphs are first generated using the data logger as explained earlier with the three flow channels: planar and interdigitated with 90° and 0° infill in alternate layers, and the two-level corrugated honeycomb structures. For statistical purposes, three replications are used in each case. The resulting OCV versus time graphs are presented in Figure 8, where the curves depict the variation of the mean values of the OCVs, while the error bars indicate the experimental deviations at different time intervals based on the three replications.
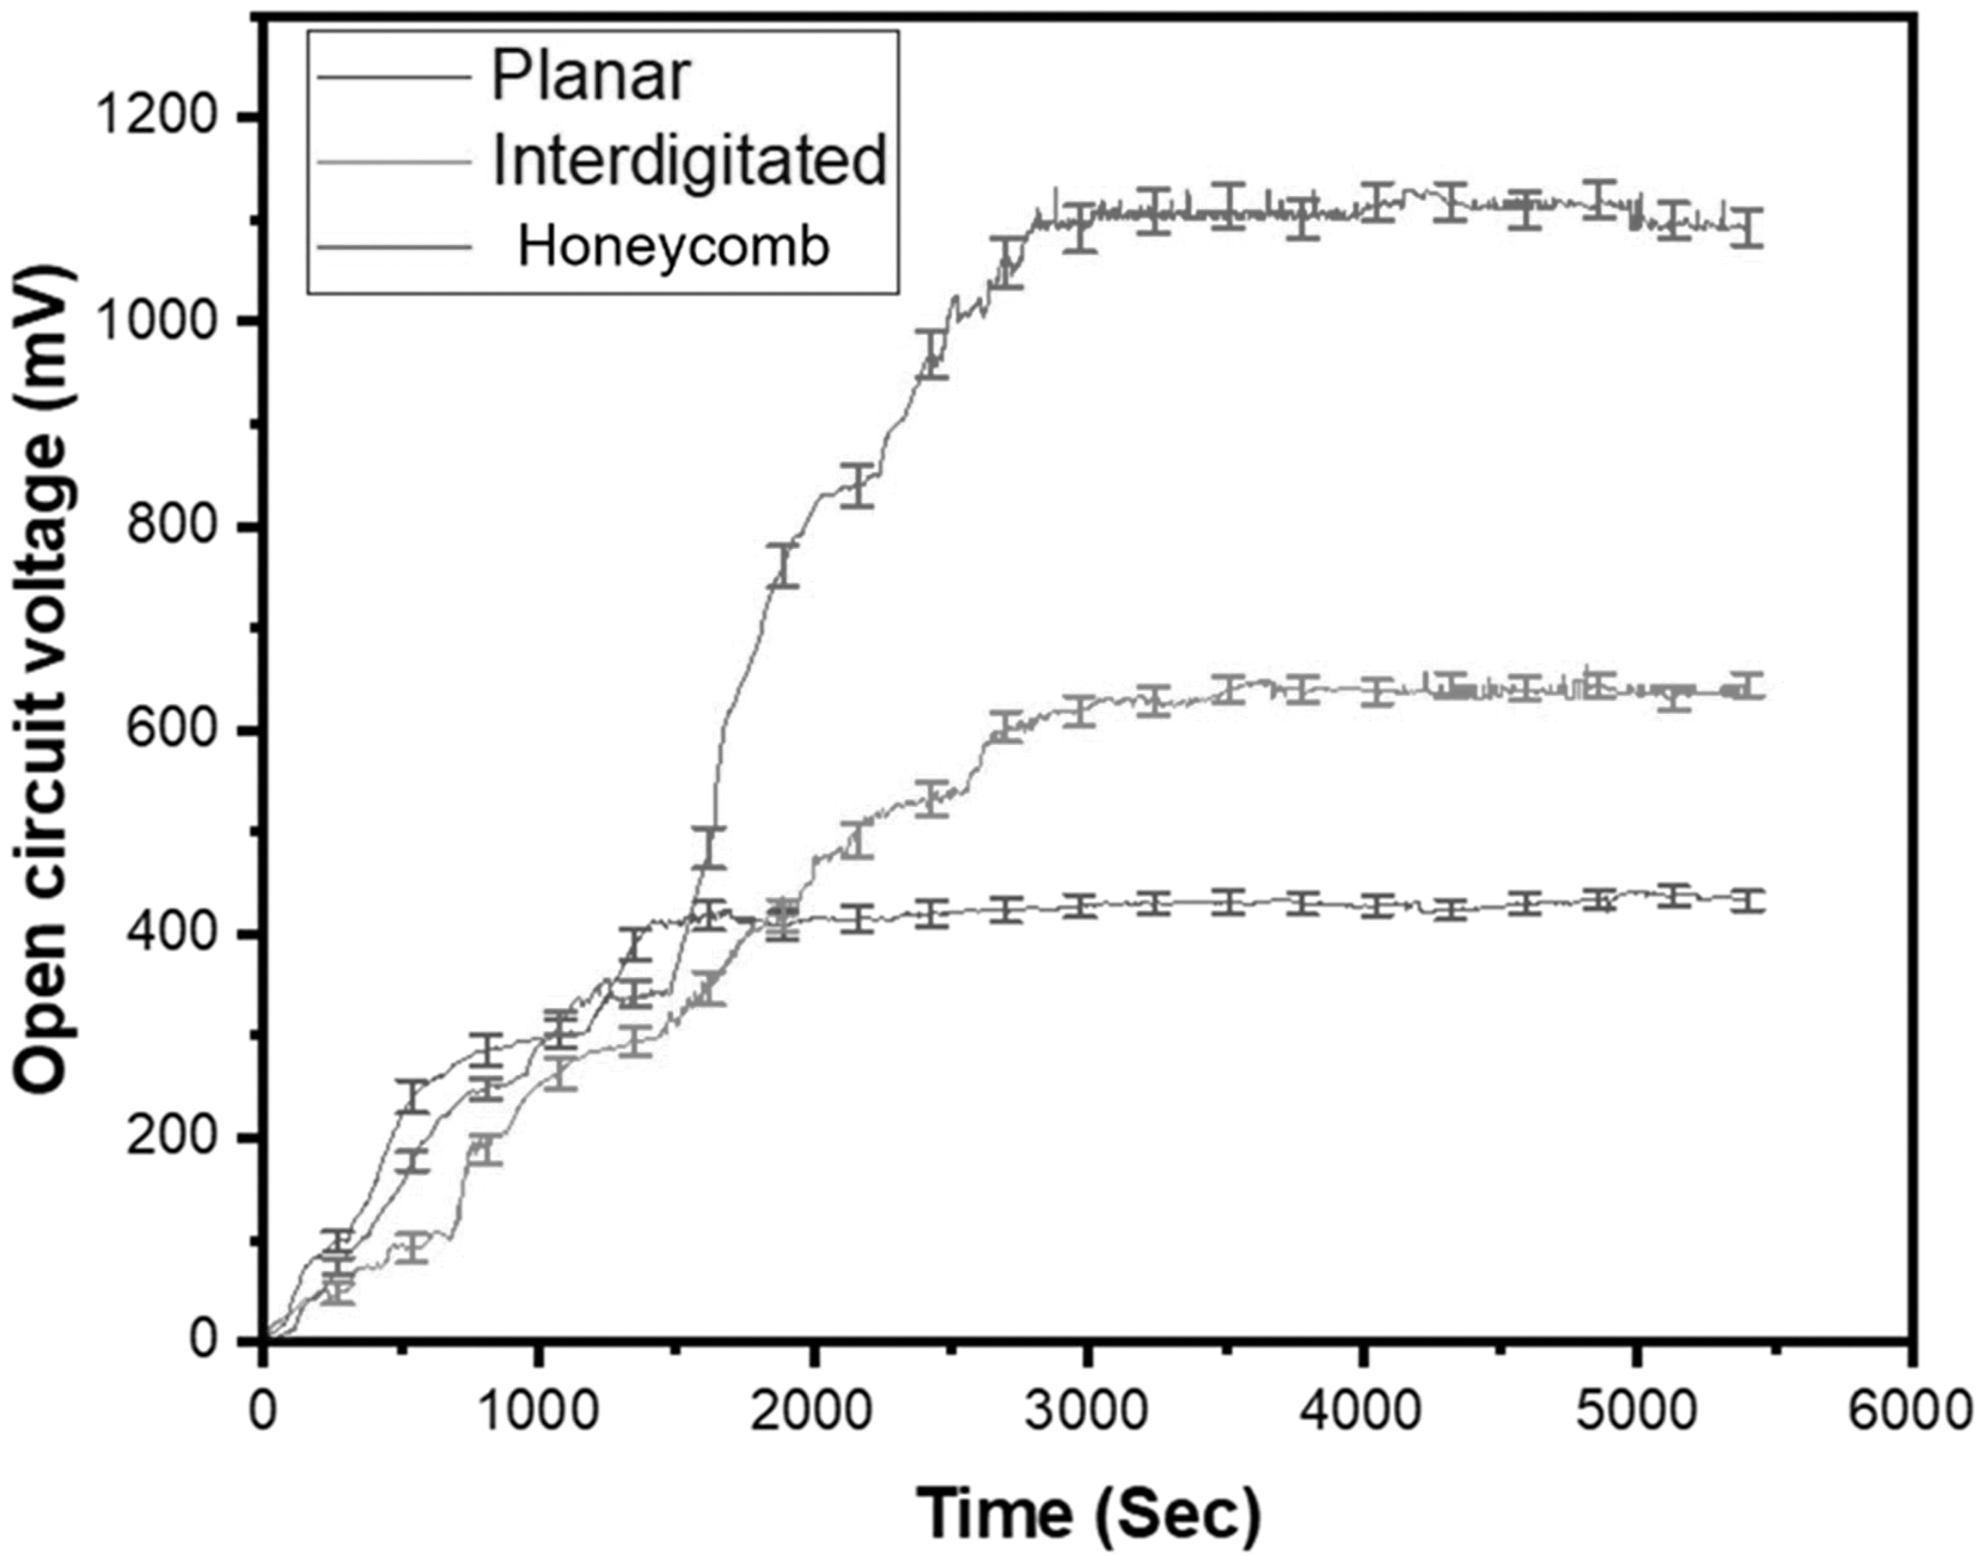
The open-circuit voltage versus time graphs for planar, interdigitated, and corrugated honeycomb flow channels.
In all three cases, it may be observed that the OCV increases initially almost linearly, and then in the case of the planar structure, it begins to be constant after reaching a maximum of ∼449 mV. The same trend is observed with the interdigitated structure, with which the curve turned horizontal after attaining the peak OCV at ∼667 mV. In the case of the corrugated honeycomb structure, there is a secondary zone with a linear rise at a much higher gradient than the initial stage, and then becoming stable after reaching the maximum limit at ∼1136 mV.
In each case, the initial rise in OCV is obviously due to the reactants beginning to rise the flow channel, picking up momentum and then forming the diffusion zone where the fresh reactants begin to interact and exchange the ions, gradually building up the charge. Further, the flattening of the OCV versus time curves after reaching the maximum values in each case is due to the fact that the reactants flow and the ion exchange rates get stabilized after a certain time as there is no much variation in the interaction rates, the OCV values remain constant. The dye-flow tests discussed earlier have also shown similar trends in the stabilization of the color contours with time, representing the saturation of the zones of dispersion and mixing of different fluids in accordance with the structural arrangements of the flow channels.
It may also be pertinent to point out that the flow channels, in these cases, have much longer life spans over the paper-based counterparts, and after stabilization, the OCV values have remained constant over prolonged periods of time in all three channels tested here. While the pattern of the OCV versus time graph obtained with the interdigitated case is quite similar to the planar one, there is a marked difference in the maximum OCV at 667 mV, as against the 449 mV with the other case. This steep rise in the OCV is due to the increased length of the reaction sites as imposed by the interdigitated pathway for the boundary between the two flow paths. The dye-flow tests showed a highly controlled flow of the reactants in the two channels, and clearly defined and localized mating surfaces (Fig. 3d), which is also reflected in the observations made from the electrical characterization tests and the resulting OCV variation with time as seen in Figure 8.
The OCV versus time graph obtained with the two-level honeycomb structure is distinctly different from the results of the other two flow channels. There is an initial increase that is almost linear with time, and after reaching a certain local maximum, there is a secondary, almost linear rise of OCV with time. This may be attributed to the geometrical arrangement of the two-level flow channel structure and the time differences between the first and the second levels in getting to the required level of ion exchange.
During the initial stages, the level 1 flow zones receive the reactants, gradually reaching the reaction sites, increasing the OCV values and then reaching the local maximum at the saturation point. Beyond this, the secondary level gradually gets the fluids to the reaction sites, and the ion exchange at the second level adds up to the first level, resulting in the secondary rise in the OCV values. Beyond the secondary saturation point, the reaction rates at the two levels stabilized, plateauing the curve at a maximum OCV of 1136 mV.
It may be observed from the results of Figure 8 that the cell potentials in all three cases remained constant after reaching the saturation levels at the reaction sites. After reaching this state, the cell is connected to an external circuit with the resistance box to vary the load, and obtain the load and polarization curves. The circuit resistances are varied as 1, 10, 100, and 500 kΩ, and the corresponding voltage and current readings are measured using the digital multimeter.
The platinum electrode areas deposited by the ion-beam sputtering method are 4.2 cm2 for the planar and interdigitated and 12.6 cm2 for the two-level corrugated honeycomb flow channels. The current values obtained are divided by the electrode areas to calculate the normalized current density levels with varying cell and external resistance conditions and plot the cell load and polarization curves, as shown in Figure 9. The average values of the voltages and current obtained from three specimens are used to obtain these results.
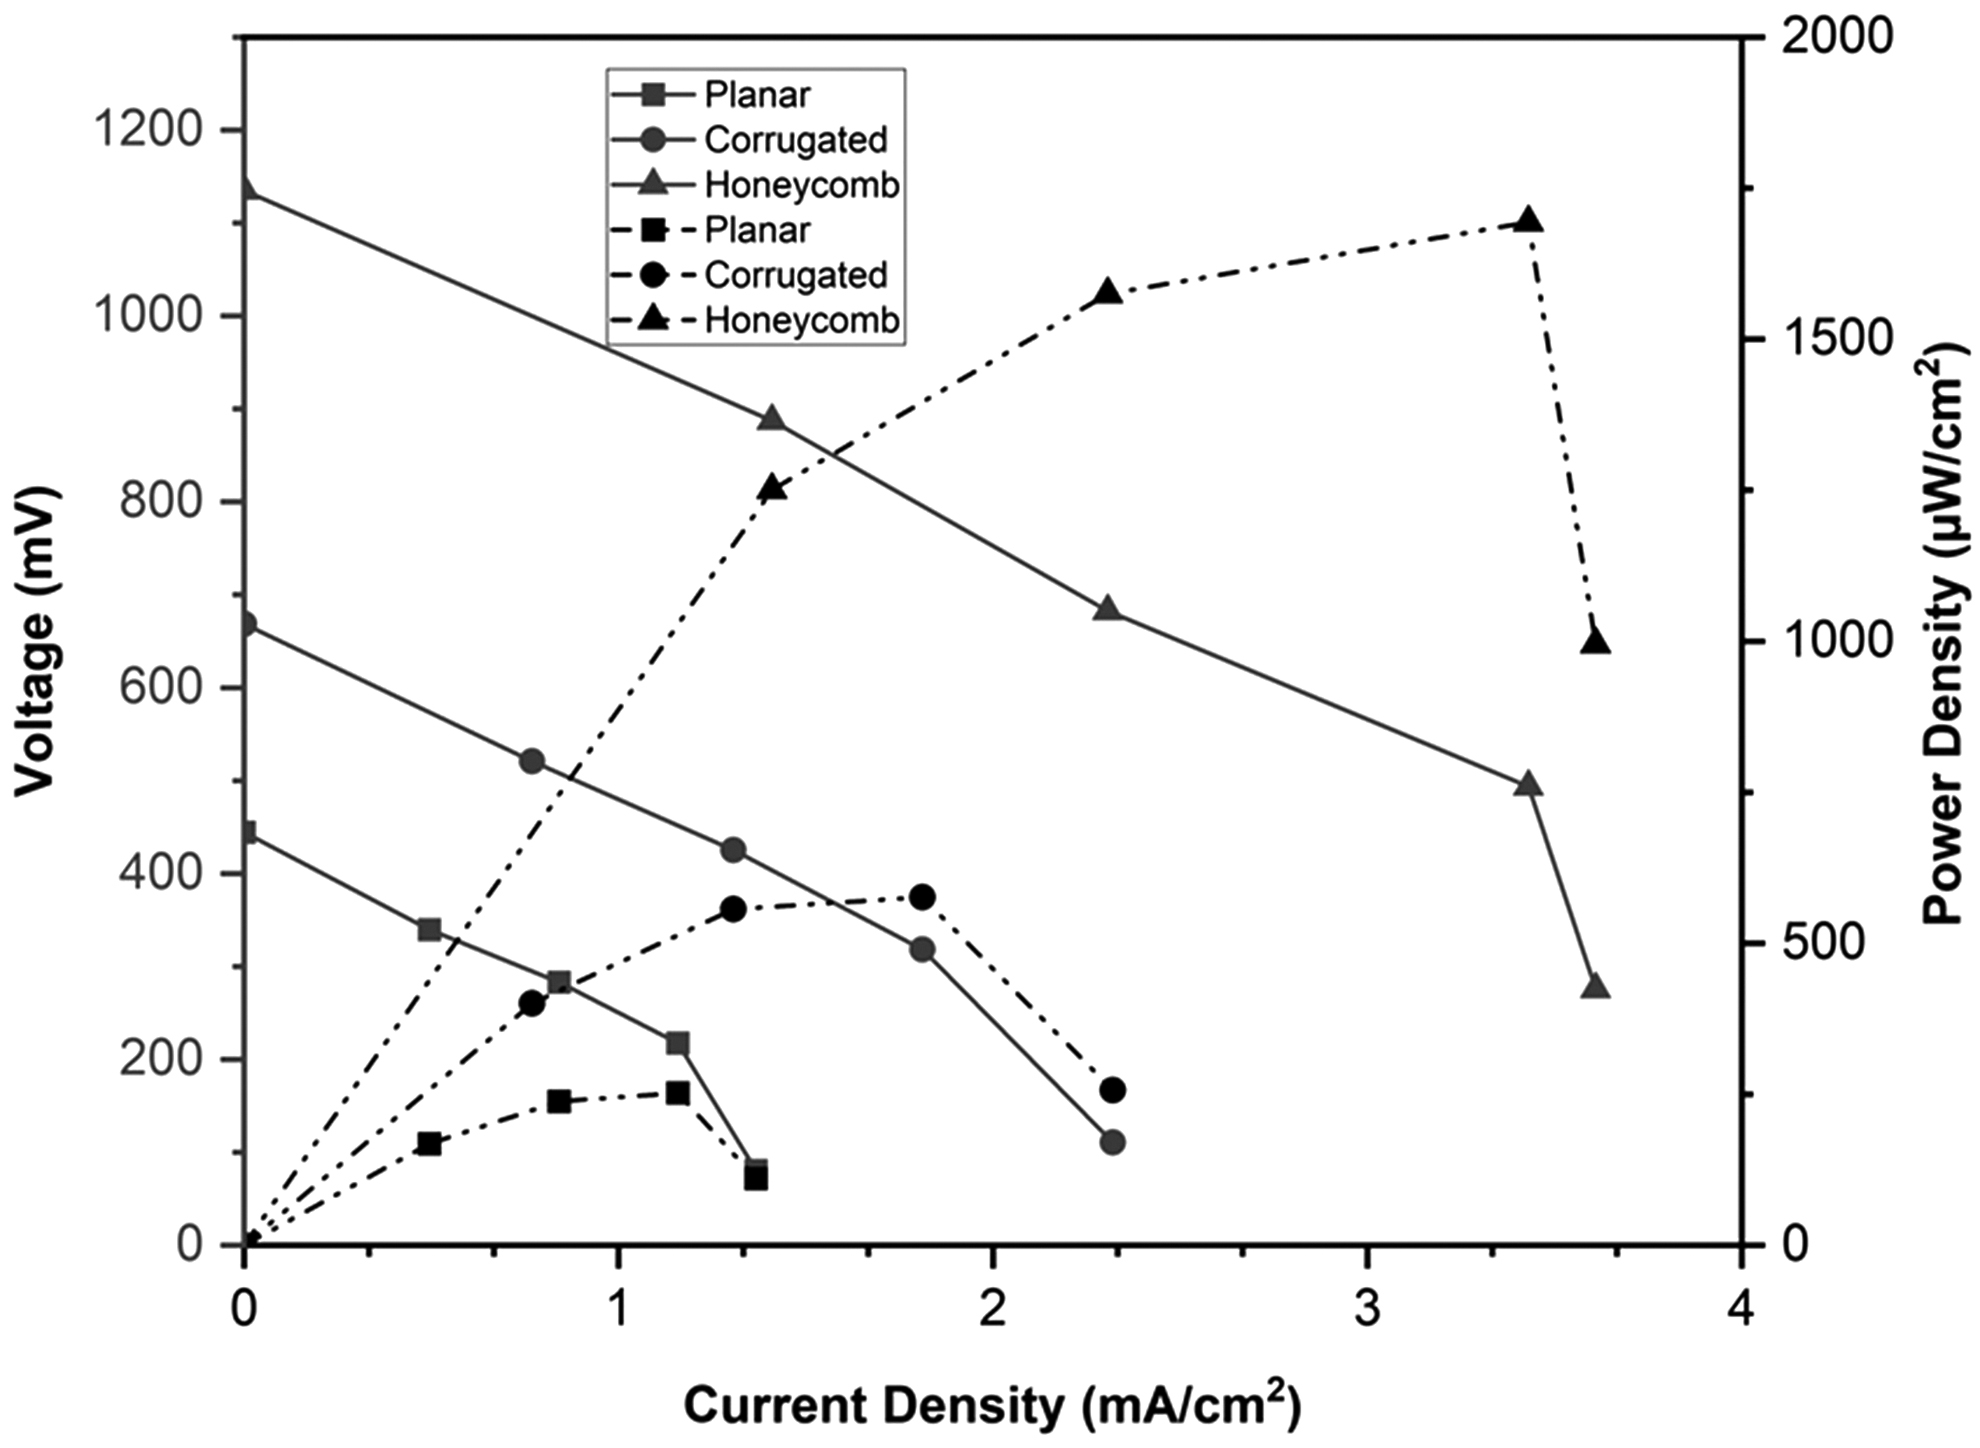
Load (continuous) and polarization (dashed) curves for planar, interdigitated, and two-level corrugated honeycomb-based flow channel MFFCs. MFFC, microfluidic fuel cell.
The variations in the load and polarization values are reflective of the variation in the OCV values, as discussed above. In both cases, the planar configuration scored the least, while the two-level corrugated honeycomb structure performed the best, and the interdigitated cell form is somewhere in between. The corrugated honeycomb flow channel-based MFFCs performed the best by far, with the maximum current and power densities at 2.17 mA/cm2 and 812.8 μW/cm2, respectively. The interdigitated flow channel-based MFFCs responded at an intermediate level, with the maximum current and power densities at 1.39 mA/cm2 and 345.85 μW/cm2, respectively, while the planar flow channel with 0° and 90° infill had the lowest of the same values at 0.82 mA/cm2 and 151.23 μW/cm2.
Again, it may be pertinent to point out that these critical cell responses are much higher compared with the previously proposed polymer flow channel-based MFFCs, where the maximum responses of the corrugated extended planar printed cells were OCV 687 mV, current density 1.235 mA/cm2, and power density 387.15 μW/cm2. 19 These functional flow channels are not possible to fabricate by conventional manufacturing processes, but AM methods have proven to pave new pathways for further research and developments in these lines.
Overall three functional flow channels, namely planar (90° and 0° infill), interdigitated, and two-level corrugated honeycomb structures, have been proposed and developed for MFFCs. The planar (90° and 0° infill) flow channel showed the flow behavior of dyes similar to paper-based flow channel, suggesting that colaminar behavior can be achieved with printed polymer-based flow channels. The interdigitated flow channel is inspired based on the conventional fuel cells, proved that multiple interfaces lead to more reaction sites, coupled with highly controlled flow, eventually achieving better performance of MFFCs.
The OCV, current and power density outputs are better compared with the planar MFFCs for the same flow channel dimensions. Finally, scaling-up/stacking is a strategy employed, which is done by connecting single-unit cells of honeycomb-based flow channels in parallel-series manner at various levels to generate better voltage or power as needed for practical applications. The modified functional structure called “corrugated honeycomb based flow channel” achieved colaminar flow at various levels also allowing for partial reuse of reactants, if not the fully, demonstrating the reuse of reactants in paper/polymer-based MFFCs for the first time.
Conclusion
The outcomes of this research prove that customized designs based on additive technologies can lead to better functionalities of MFFCs. Three flow channel forms, planar (0° and 90° infill), interdigitated, and scaled-up two-level honeycomb structural forms, are evaluated. The initial designs are based on the results of numerical simulations of two-phase fluid flow through flow channels based on both paper and printed substrates. Dye-flow tests using the printed prototypes of the flow channel designs allowed us to further validate the numerical predictions and converge on the final three flow structures and the rasterization schemes during printing.
The final electrical characterization results place all three forms of flow channels tested to perform better than the variants currently reported in the literature. Compared among the three, the planar version and the two-level honeycomb flow channels scored the least and the best, respectively, while the interdigitated model performed at the middle level. Overall, the MFFCs based on the three forms of flow channels investigated planar, interdigitated, and branched, resulted in the maximum OCV at 449, 667, and 1136 mV; power densities at 151.23, 345.85, and 812.8 μW/cm2; and current densities at 0.82, 1.39, and 2.17 mA/cm2, respectively.
Footnotes
Author Disclosure Statement
No competing financial interests exist.
Funding Information
The authors wish to acknowledge a part of the support received from the Marsden Grant number MFP AUT1901 in carrying out the research reported in this paper.
Authors' Contributions
V.K. is the scholar and the main contributor to the conceptualization, methodology, software, verification, investigation, writing original drafts, and reviewing and editing tasks. M.P.B. is currently a postdoctoral fellow at the AUT and played a central role in facilitating the experimental setups and the printing solutions and contributed to the methodology, investigation, and resourcing of the research. S.S. is a Professor in Mechanical Engineering at the AUT, and the primary supervisor of the research undertaken. His contributions include conceptualization, methodology, resources, original draft writing, review and editing, supervision, project administration, and funding acquisition tasks.