




Abstract
Abstract
The use of cyclic olefin copolymer (COC) as a material for material extrusion 3D-printing is a novel approach in additive manufacturing. Its chemical inertness and high biocompatibility emerges the potential for chemical, biochemical, and life science applications while keeping the flexibility in design and manufacturing of 3D-printing. In this study, as functionalization, an incorporation of deviating weight ratios (28–20 wt%) of carbon black into the polymer matrix through a compounding process is shown. The resulting adjustable specific electrical resistivity (0.6–17 Ωm) of the conducive COC is specified with a high-precision measuring method. The material blends are used for the fabrication of several structures utilizing the electrical conductivity. With a panel of eight different solvents, the solvent and additionally the temperature stability are compared with those of a commercially available clear/conductive polylactic acid material set. In sum, the use of conductive and clear COC in material extrusion 3D-printing may be a future game changer for laboratory environments usage or small-scale experiments where highly specialized (hybrid) structures are needed.
Keywords
Introduction
Additive manufacturing has proven to be a cost-effective and readily available approach for producing prototypes and custom components across diverse scientific domains. Material extrusion 3D-printing, in particular, has made a substantial impact on the rapid prototyping and manufacturing of specialized parts.1–3
As 3D-printing techniques continue to evolve, there is a growing demand for specialized raw materials. One effective approach to obtain the desired properties in 3D-printed objects is by enhancing the printing material (filament) through the incorporation of additives. Through this method, it becomes possible to impart features like magnetic activity, thermoresponsivity, and electrical conductivity into the polymer matrix, the filament, and ultimately the 3D-printed object.4–6
Electrically conductive filaments use different filling materials such as metal powder, graphene, carbon nanotubes, or carbon black to enable certain conductivity throughout the material.7–10 A huge advancement in this field is the widespread use of multi-extrusion 3D-printers where two independent filaments can be integrated in one and the same print. Electronic devices ranging from capacitive sensors to temperature sensors relying on the temperature-dependent specific electrical resistivity of the conductive polymers have been produced using this technique.11–16 Using the high flexibility of 3D-printed electronics has also accomplished the printing of more complex structures for mass spectrometry hardware enhancements or in case of drift tubes for standalone ion mobility spectrometers.17–20
For the use of 3D-printers in bio/chemical laboratories an inert and solvent stable polymer is of high interest.21–23 In particular, two of the most commonly used and easily processed materials, polylactic acid (PLA) and acrylonitrile butadiene styrene, often lack these specific properties. 24
Cyclic olefin copolymer (COC) has emerged as a compelling candidate for applications that require high-performance polymers across various scientific domains. 25 In the field of chemical and biological applications, COC exhibits notable properties such as high biocompatibility and robust stability when exposed to various chemicals and polar solvents.26–29 These qualities, coupled with its optical properties, render COC highly advantageous for microfluidic applications and scenarios where 3D-printed structures come into contact with reactive substances or the target analytes themselves.30–32 To harness the benefits of 3D-printing in conjunction with quasi-inert COC, the material can be effectively processed using widely available fused deposition modeling (FDM) 3D-printers. Of note, owing to the advantageous optical properties of COC, initial applications of 3D-printing have focused on optical lenses and waveguides.26–28
To enhance the features of COC, this work shows the functionalization of COC using carbon black as an additive and describes different features of this novel functionalized 3D-printing material. Owing to its good dispersion, carbon black has been used as an additive for different functionalized polymers. 29
The deviation of the carbon filler content in the polymer matrix can thus be used as another degree of freedom in equipment design. Multiple different weight compositions of carbon black and COC blends have been produced and are described in this study. As benchmark, in different experiments, the polymer blend is characterized and compared with commercially available conductive PLA.
To gain an understanding of the reproducibility and exact resistance of the material the specific electrical resistivity was determined by the use of the van der Pauw method. 33
The study also investigates the solvent stability of 3D-printed structures, which is crucial for potential chemical and biological applications, as different solvents are frequently used in microfluidic work and biological investigations, serving as reaction media or cleaning agents.34–37 Although numerous studies have explored the solvent resistance of 3D-printing materials, their primary emphasis has largely centered on quantitative metrics, including optical alterations and layer delamination.24,38,39 Using conductive 3D-printing material allows real-time monitoring of material degradation, showcasing a direct link between polymer degradation and solvent stability in 3D-printed structures exposed to various solvents.
In microfluidic applications and small-scale laboratory equipment, there is a critical need for a high degree of design and production flexibility.40,41 The functionalization of 3D-printing materials enhances this flexibility, empowering the creation of bespoke functional components like heaters or sensors tailored for specific purposes, particularly in fields like life sciences. As an illustration, the design and evaluation of miniaturized heating structures is shown to compare the thermal performance of conductive COC and PLA in a practical application.
Materials and Methods
This article does not contain any studies with human or animal subjects performed by any of the authors, thus waived from the IRB approval.
An Ultimaker 5S Pro-Bundle (Ultimaker B.V., Netherlands) was used for 3D-printing. Clear COC (Creamelt®; OST, Switzerland) has been used on printcore slot 2 (Printcore AA—0.4 mm; Ultimaker B.V., Netherlands) for the nonconductive component. The conductive components were printed by use of different COC compounds/blends on printcore slot 1 (Printcore CC—0.4 mm; 3DSolex, Norway). As reference, clear PLA (EasyFil PLA; FormFutura, Netherlands) and conductive PLA (Proto-Pasta Conductive PLA; Protoplant Inc., Canada) were printed on the same printer. The 3D-printing settings are given in Supplementary Table S1.
Compounding and extrusion
Matrix material
To meet the material requirements of the planned application, such as high solvent stability, high dimensional stability, and low moisture absorption, the decision for a suitable matrix material fell in favor of COC (TOPAS® 8007S-04; TOPAS Advanced Polymers GmbH, Germany). This material has already been successfully processed into 3D-printing filaments and printed in previous trials.42,43 It shows a favorable amorphous character as it is known that crystallization has a negative influence on the percolation and thus causes inhomogeneous resistivity throughout the material.29,44 This material is characterized by a water absorption of <0.01% (at 23°C) as well as its low water vapor permeability of 0.025 g·mm/m2/day. Furthermore, the glass transition temperature of 78°C still allows the later winding of the extruded filaments as higher values mean a more brittle material, which makes winding and further processing impractical. 45
Additives
To impart electrical conductivity to the extruded products, a conductive filler is mixed into the matrix material. Carbon black (ENSACO® 250 G, IMERYS, France) was chosen among various options owing to its conductivity and effective dispersing ability. Supplied in granular form, it is incorporated into the polymer matrix during compounding. The resulting conductivity depends on processing, mixing duration, and the inherent conductivity of the polymer. No additional additives like plasticizers are introduced to maintain suitability for analytical applications. 46
Compounding
To understand the relationship between additive amount and electrical conductivity, a simplified calibration curve (concentration vs. specific electrical resistivity, detailed in “Results and Discussion” section) was derived. This curve allows the prediction of the necessary filler content to achieve a specific electrical resistivity with the given matrix material, based on data from six compounding experiments outlined in Table 1.
Compounding Compositions (in Weight%) of Cyclic Olefin Copolymer (TOPAS 8007S-04) and Additive Carbon Black (ENSACO 250 G) for the Mathematical Approximation of Needed Additive

COC, cyclic olefin copolymer.
A co-rotating twin-screw extruder (ZSK 26 Mc; Coperion, Germany) with two 26 mm diameter (D·Dinner 1 = 1.55) screws was used for matrix material compounding. The material and additive were fed separately using gravimetric weight feeders. A pelletizing unit with strand pelletizing in a water bath followed by a cold cut was used. All tests were conducted at 220 rpm and 10 kg/h throughput to ensure mixing consistency, shear stress, and duration. The melt temperature was set at 240°C. Formulations varied only in the feed rates of the weigh feeders.
The conductivity of compounds produced in real-time was determined by analyzing 10 cm strains with a digital multimeter (Type 313; Berner, Germany), which, combined with geometric dimensions, helped calculate specific electrical resistivity. The resulting curve is shown in the “Results and Discussion” section.
Extrusion
For the production of filaments, such as used in 3D-printing, a single-screw extruder (E20P; COLLIN Lab & Pilot Solutions GmbH, Germany) with D = 20 mm and a process length of 30 D was used. The filament die that was used has an outlet diameter of 2.9 mm. To maintain consistency among various materials, the process parameters (speed = 100 rpm, throughput = 3 kg/h, melt temperature = 235°C) were kept constant throughout the entire test series. This ensures comparability by minimizing the influence of varying processing conditions on the resistance of the extruded material. 47 Based on these filaments, the specific electrical resistivity was then again determined using the same method mentioned previously and compared with the calibration curve obtained during compounding.
Specific electrical resistivity
For high precision measuring of the specific electrical resistivity, cloverleaf structures (thickness 0.2 mm) have been printed out of conductive material onto nonconductive 3D-printed carrier sheets (thickness 0.3 mm). By the van der Pauw method and a four-terminal sensing, these geometries can be used to determine the specific resistivity of the 3D-printed conductive material. 33 The cloverleaf structure was printed in quadruplicates using all possible conductive COC compounds and the commercial available conductive PLA. The measurement methodology first introduced by van der Pauw is given in Figure 1. 33
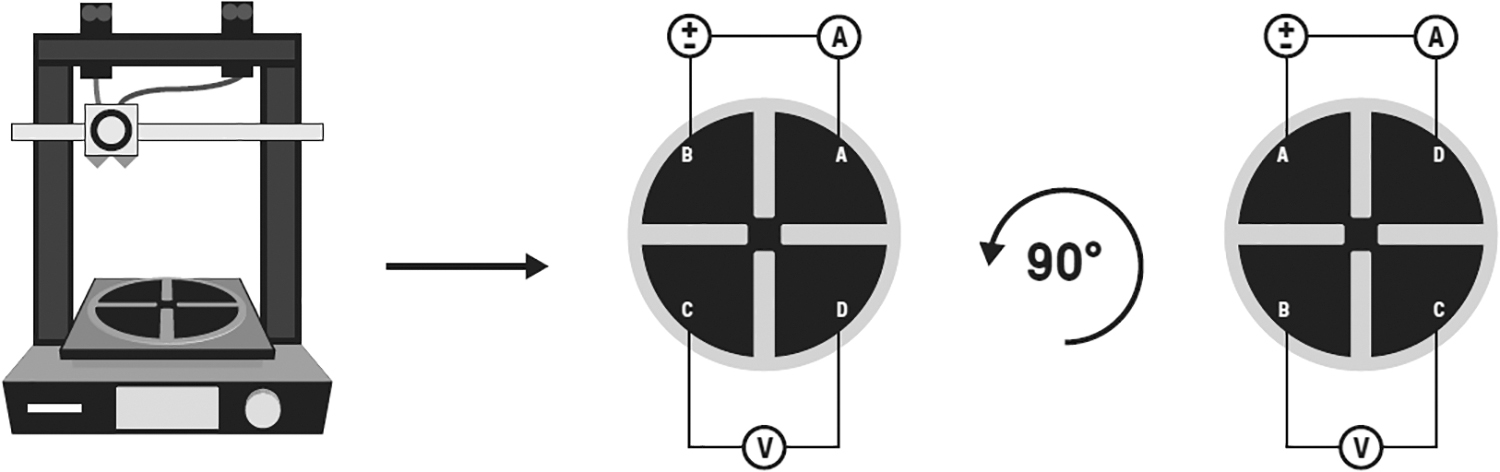
Schematic explanation of the van der Pauw method (four terminal sensing) used to determine the material specific electrical resistivity. After 3D-Printing (left), a constant voltage UAB is applied to contact pins A and B and the resulting current IAB and the voltage UCD is measured to calculate the electrical resistance RAB,CD (middle). In the last step the structure is turned 90° counter clockwise and the procedure is repeated to calculate the electrical resistance RBC,DA (right) By help of both electrical resistances the electrical resistivity can be calculated.
The measurement is divided into two measurement steps. In step 1, a constant voltage of 32 V is applied on two opposite cloverleaf pads (contact pins A and B) using a laboratory power supply (EA-PS-2032-025; Elektro Automatik, Germany). The measured current between these two pins (IAB) and the voltage (UCD) between the two remaining pads (pins C and D) is measured using two digital multimeters (Keithley 2000; Keithley). These values are used to calculate the electrical resistance RAB,CD via Ohms law. In step 2, the clamps are reattached to pins D and A resulting in the measured current IDA and the voltage UBC to determine the electrical resistance RBC,DA. This measurement method is repeated four times for each printed structure. For each reclamping 100 values are determined for the voltage and the current, which are averaged automatically by one of the digital multimeters. Using the Formula 1 the specific electrical resistivity ρ for the layer material can be calculated, with d as layer thickness, the measured electrical resistances 
Each structure is printed in quadruplicates and measured to evaluate potential scattering effects caused by the printing procedure or by inherent effects in the material.
Solvent stability
For advanced biochemical and chemical analytics, the interaction of the 3D-printed material in functionalized and unfunctionalized form with different solvents is of importance. To investigate the interaction with a test set of common solvents, a test structure of both nonconductive and conductive material has been designed and 3D-printed by both, the use of COC and PLA material. The test stripes were designed in a manner such that a U-shaped conductor path is mostly covered by nonconductive material. The technical drawing of the test strip is to be found in Supplementary Figure S1. By submerging the test structure/stripe into the solvent an interaction of the solvent with this area will change the electrical resistance of the U-shaped conductor and eventually will produce an open circuit. The test stripes were printed with COC (clear type/28 wt%) and PLA (clear type/commercial conductive). The experimental procedure is given in Figure 2.
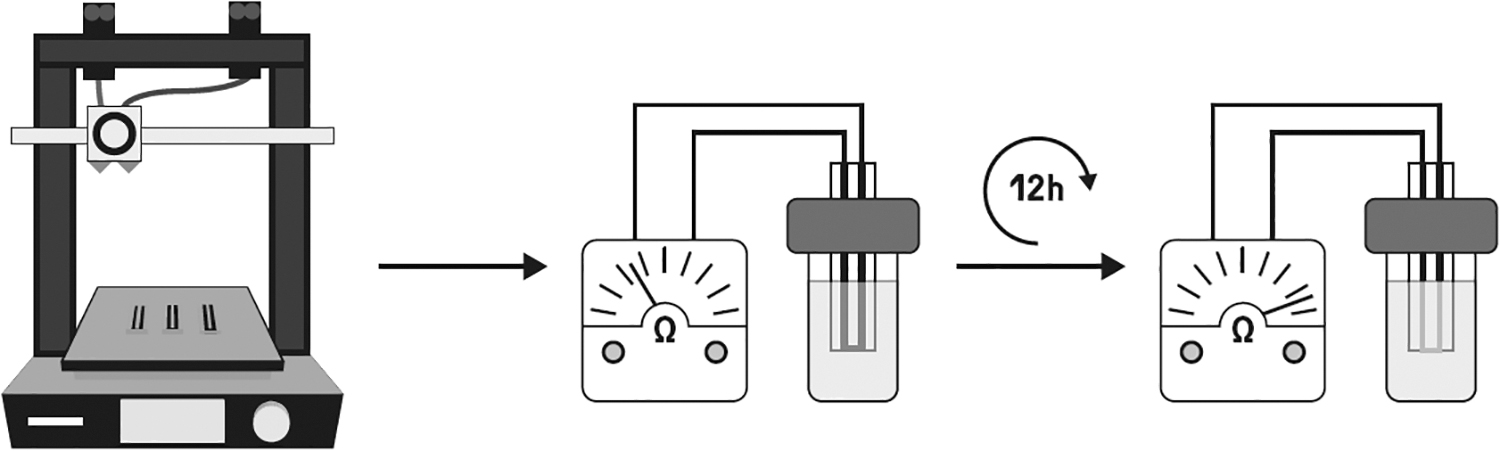
Experimental procedure of the solvent resistivity measurements. The probes have been printed out of different material combinations on a multimaterial 3D-printer. The probes are than submerged in different solvents for 12 h while monitoring the resistance of the 3D-printed structure. The material degradation during this period can then be used to evaluate the solvent resistivity of the respective materials.
The exposing in the following solvents was carried out for 12 h each: 18 mL of acetone (>99.8%; Honeywell, Germany), acetonitrile (>99.9%; Carl Roth, Germany), acetic acid (>99.8%; Carl Roth, Germany), chloroform (99.8%; Carl Roth, Germany), ethyl cinnamate (99%; Sigma-Aldrich, USA), isopropyl (>99.5%; Carl Roth, Germany), methanol (<99.9%; Honeywell, Germany), and water (demineralized, 0.054 μS/cm; Millipore Synergy185, Germany). The test vial (20 mL; Neolab, Germany) was closed with a cap and septum (24–400; Neolab, Germany). The 3D-printed test structures/stripes were inserted as tight as possible through a cut in the septum. The temperature was controlled at 30°C by placing the flask on a heating plate (C-MAG; IKA, Germany) for the course of the experiment. The electrical resistance of the 3D-printed structure is monitored and logged on a computer with a digital multimeter (Keithley 2000 multimeter; Keithley, USA). The measurement data were sent to a PC via data acquisition software (SweepMe!; Axel Fischer and Felix Kaschura GbR, Germany).
3D-Printed heating structure
The 3D-printed heaters were produced of conductive COC with 20, 24, and 28 wt% of carbon black, the commercially available conductive PLA and both clear type materials. Soldering pins were inserted into the conductive structure of the 3D-printed heaters to achieve a connection to a power supply. In Supplementary Figure S2, the design drawing of the heater is shown. Power was supplied through a regulated laboratory voltage power supply (Voltcraft PPS—12008; Conrad, Germany). Current was monitored with an in series connected multimeter (Keithley 2000; Keithley, USA). The process of fabrication and measurement is given in Figure 3.
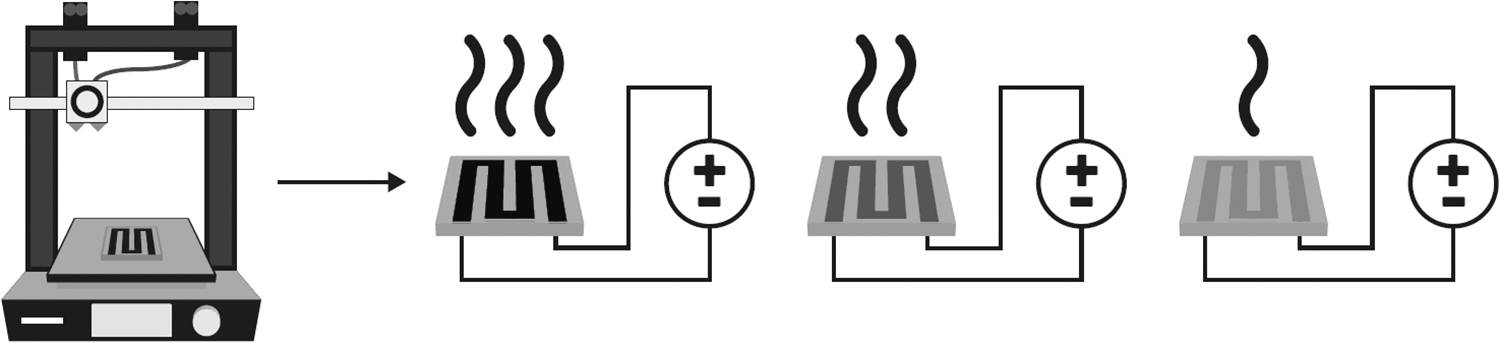
Schematic representation of the different 3D-printed heating structures. Three different heaters with different amounts of carbon added have been manufactured. The ones with the highest carbon content would have highest heat release at the same voltages.
Two different measurements were made with all four heaters. In one measurement, a steady voltage of 70 V was applied with the power supply. After 30 min, the current was determined and the temperature specially resolved was measured with a thermal camera (FLIR C2; Teledyne FLIR, USA).
For the second measurement, the power was set to 0.8 W using the measurements of the multimeter (current) and the setting of the power supply (voltage). Owing to the temperature dependency of the specific electrical resistivity, the current had to be adjusted during the heating of the 3D-printed structure. After achieving a steady power supply of 0.8 W for 30 min, a thermal image was taken of the heater and power such as voltage were determined. All temperature measurements were executed at ambient temperature of 20°C.
Results and Discussion
The distinct test structures were manufactured as described, using different material compositions. Figure 4 illustrates the cloverleaf structure (a), the disintegration test strip (b), and the 3D-printed heating structure (c). Despite the use of both PLA and COC, there was no discernible change in the appearance of the printed objects; all the displayed items were printed with COC.

Various test structures used for material characterization. The displayed structures include the cloverleaf structure
Compounding and extrusion
Various compositions were tested to create a 3D-printable conductive COC compound with desired printability and conductivity. Initial compounding trials were performed in triplicates, followed by filament extrusion in triplicates to obtain a 3D-printing raw material. The goal was to achieve the percolation threshold while ensuring even distribution of additives for consistent and reproducible results.
The resistance in the compound should be adjustable and increase with higher carbon black weight ratios. Excessive nonpolymer materials can raise the melting point or brittleness, making it unsuitable for 3D-printing. Therefore, it is essential to keep the carbon black content minimal while maintaining precise content introduction, depending on the type of carbon black, to meet the desired resistance range. ENSACO® 250 G granules met these requirements in preliminary experiments.
The tests showed that COC material conductivity can be adjusted by selectively compounding with conductive carbon black, with mass content having the most significant impact on specific electrical resistivity. Higher weight ratios result in not only greater conductivity but also increase brittleness. Process parameter variations and further processing affect specific electrical resistivity, so consistency in processing parameters is crucial. 48 Specific electrical resistivity curves for compounded materials before and after extrusion into filaments are given in Figure 5.
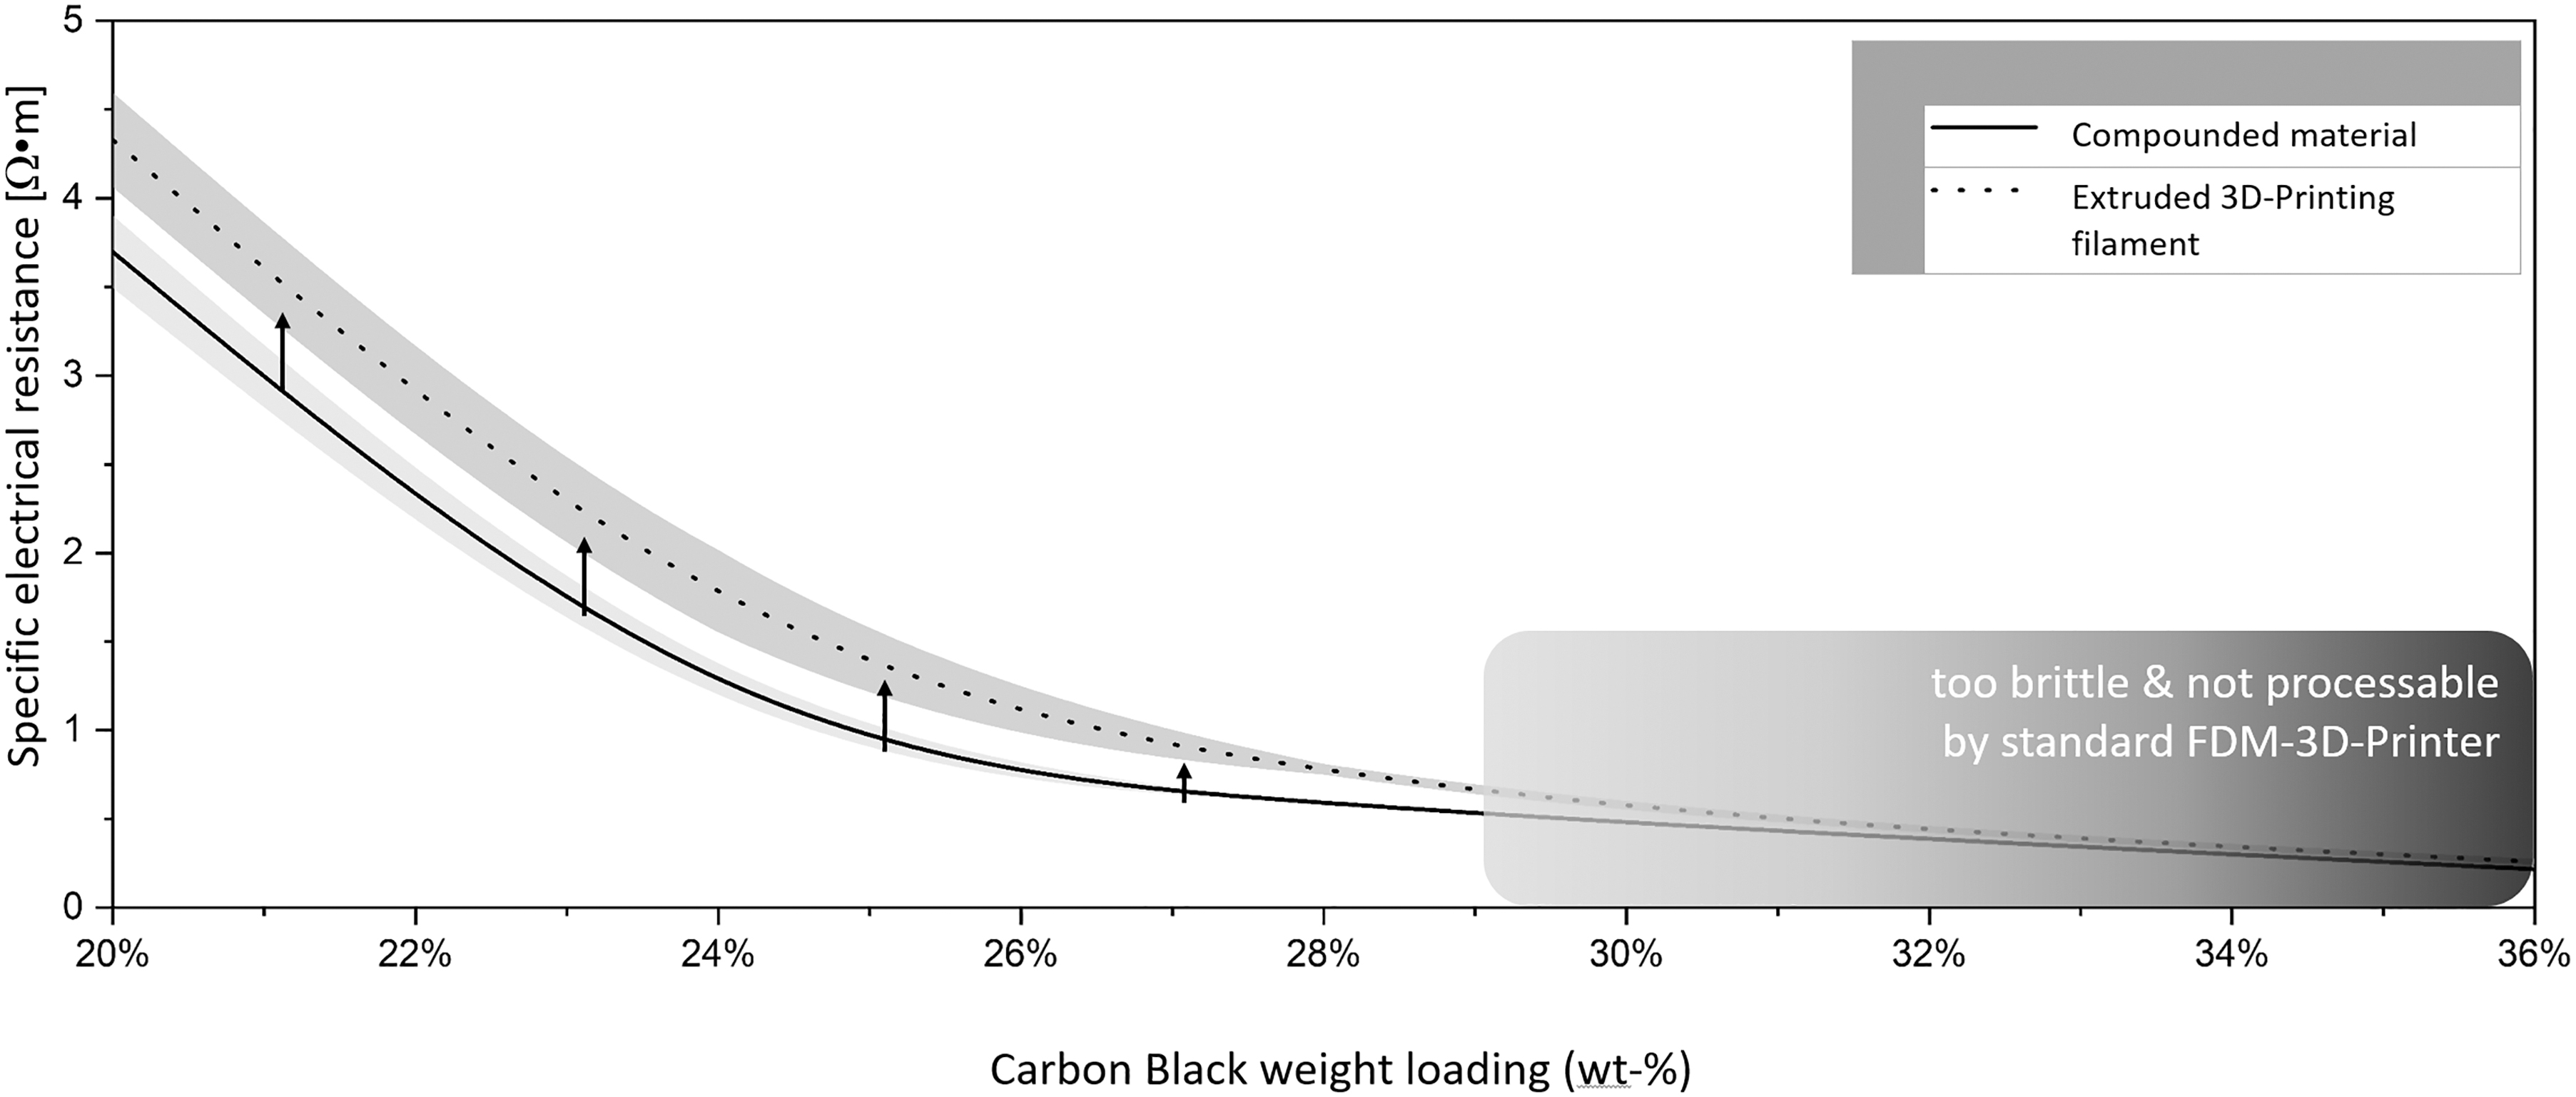
Curve of specific electrical resistivity as a function of carbon black filler content (weight loading, wt%) after compounding (solid line) and filament extrusion (dotted line). Absolute standard deviation is indicated as shaded area. Arrows indicate an increase of specific electrical resistivity during the re-extrusion process. In addition, an area for nonprocessable material is indicated where material becomes to brittle to be printed with a standard 3D-printer.
The specific electrical resistivity of the compounded material increases by 14–38% because of the shearing processes during extrusion. The relative standard deviation (RSD) rises by up to 2% points after extrusion, averaging 5% RSD, but the concentration of carbon filler does not affect RSD.
For weight percentages of 16 wt% or lower, no resistance is measurable, indicating a percolation threshold between 16 and 20 wt%. Desirable conductivity is achieved with 20–36 wt% carbon black, but beyond 28 wt%, conductivity increases only slightly, and the filament becomes highly brittle, making it unsuitable for standard FDM 3D-printers owing to the risk of breakage. The melting temperature changes minimally for different compounds.
Materials with 20 wt%, 24 wt%, and 28 wt% were chosen for this work because they meet the targeted material resistance and properties. At these concentrations, the percolation threshold is met, and a fully connected carbon black network is not yet achieved. These compounds remain suitable for 3D-printing, with changes in material properties that still allow for successful printing.
Specific electrical resistivity
To evaluate the electronic properties of the different filament composites a cloverleaf-shaped geometry was 3D-printed onto a thin sheet of nonconductive COC used as stabilizing structure. The cloverleaf geometry was first introduced by van der Pauw to enhance the method accuracy of specific electrical resistivity measurement. 33 The specific electrical resistivity of the different COC compositions in comparison with the commercially available conductive PLA have been determined using this method and is visualized in Figure 6 as boxplot diagram. For better precision comparison between all material blends, each specific electrical resistivity of the four replicate measurements is normalized to the corresponding average.
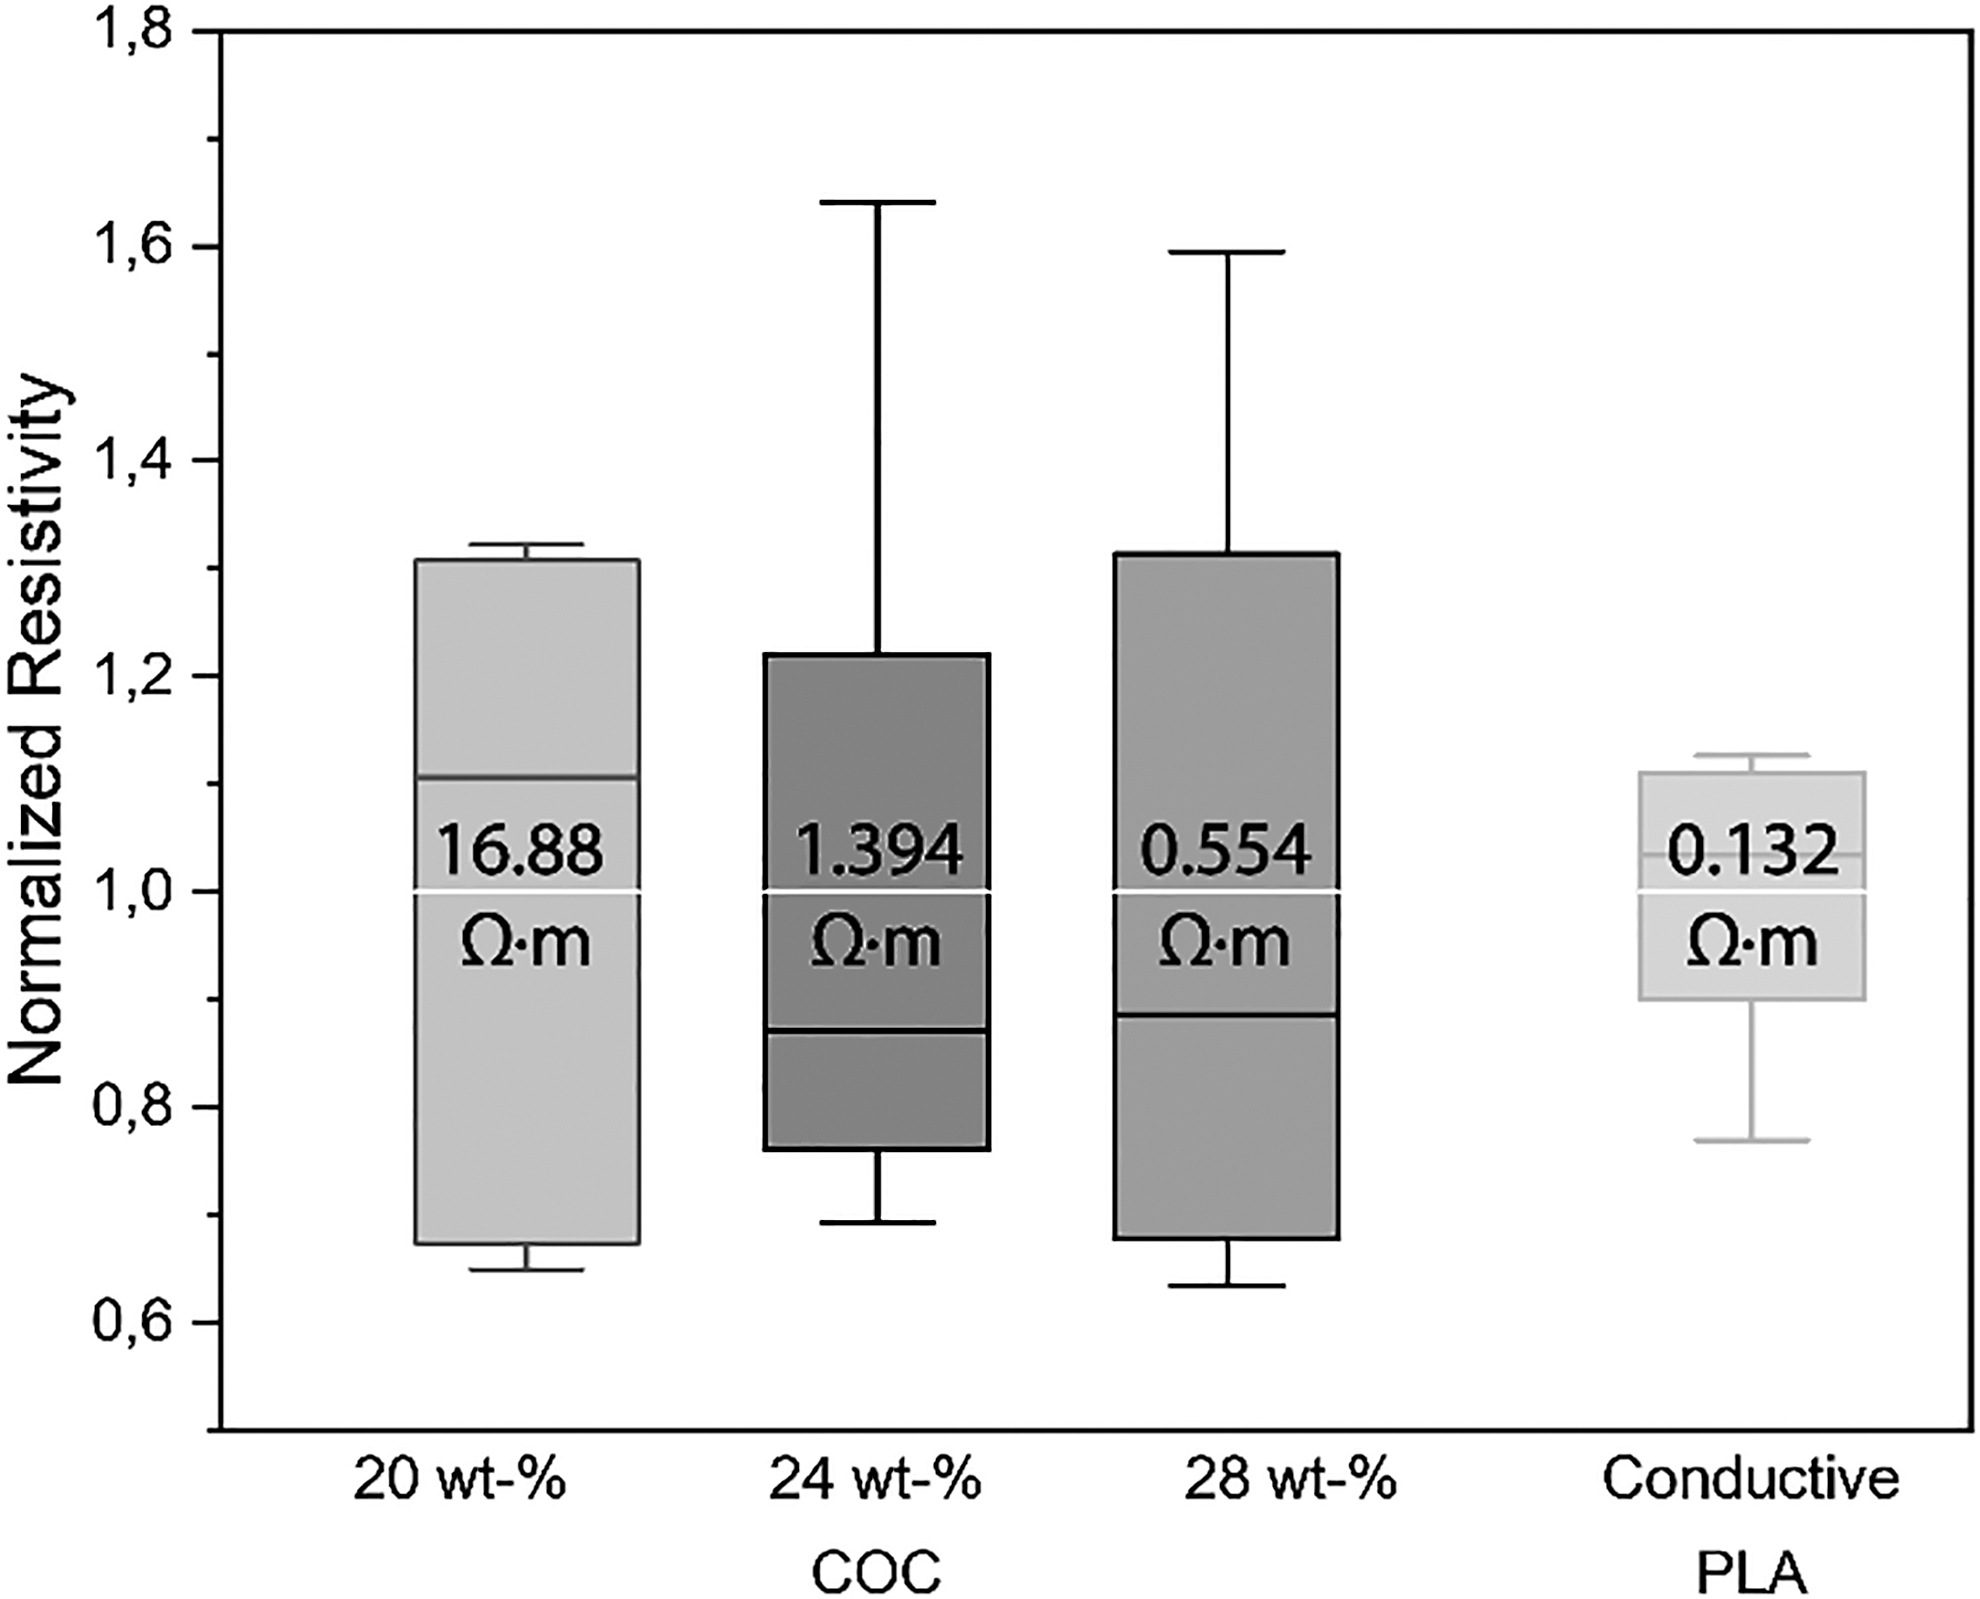
Precision comparison of specific electrical resistivity measurement of the 3D-printed cloverleaf structures by the van der Pauw method. The values are normalized to the corresponding average value of four replicate measurements. Here, the box and whiskers length indicate the precision of compounding, 3D-printing and measurement method. The absolute specific electrical resistivity is given as numbers in the boxes.
The investigation demonstrates a strong correlation between the concentration of the conductive additive (carbon black) and the specific electrical resistivity of the final 3D-printed material, as shown in previous studies.49,50 As the weight percentage of carbon black increases, the specific electrical resistivity decreases, resulting in higher electrical conductivity.
In comparison with commercially available conductive PLA, which achieves a lower specific electrical resistivity (0.1 ± 0.02 Ωm), the conductive COC compounds with 20 wt% (16.9 ± 4.5 Ωm), 24 wt% (1.4 ± 0.5 Ωm), and 28 wt% (0.6 ± 0.2 Ωm) additives exhibit higher resistivity values. The resistances of 3D-printed conductive COC structures increase compared with measurements after filament extrusion (compare Fig. 5). This behavior, previously mentioned, is an effect of the additional 3D-printing step (see Figs. 5, 6).
Indeed, all RSDs for COC values are three times higher than those of the commercially available PLA (13% RSD), but can be explained with bigger production batches and highly optimized production processes. In addition, the high deviation of the specific electrical resistivity is inherent to the 3D-printing process itself or the measurement direction and has been described elsewhere. Using a more advanced multifrequency measurement method carried out by Wadsworth et al. shows RSDs between 31% (along printed line) and 107% (between printed neighbor lines) for a 3D-printing material with oriented nickel-coated carbon fibers additive. 51 In summary, the RSDs presented in this study are reasonable considering the precision challenges presented by compounding, extrusion, 3D-printing, and measurement techniques to achieve specific electrical resistance values.
Solvent stability
Widespread adoption of 3D-printing in chemical and biological applications, like detection units or reactors, faces a challenge in ensuring material stability when exposed to solvents. Although these effects have been qualitatively observed in materials like PLA used in 3D-printing, quantitative measures are lacking beyond visual observations.24,38,39
Conductive materials offer a real-time qualitative means to observe disintegration. To investigate how 3D-printed parts made from COC and PLA interact with various solvents, test structures were submerged in vials containing different solvents, including isopropyl, ethyl cinnamate, water, acetic acid, methanol, acetone, acetonitrile, and chloroform. The structures, featuring inner U-shaped conductors, were inserted as tightly as possible through a cut in the septum using a scalpel. Figure 7 shows the optical appearance of COC and PLA for all solvents after 12 h of submersion.
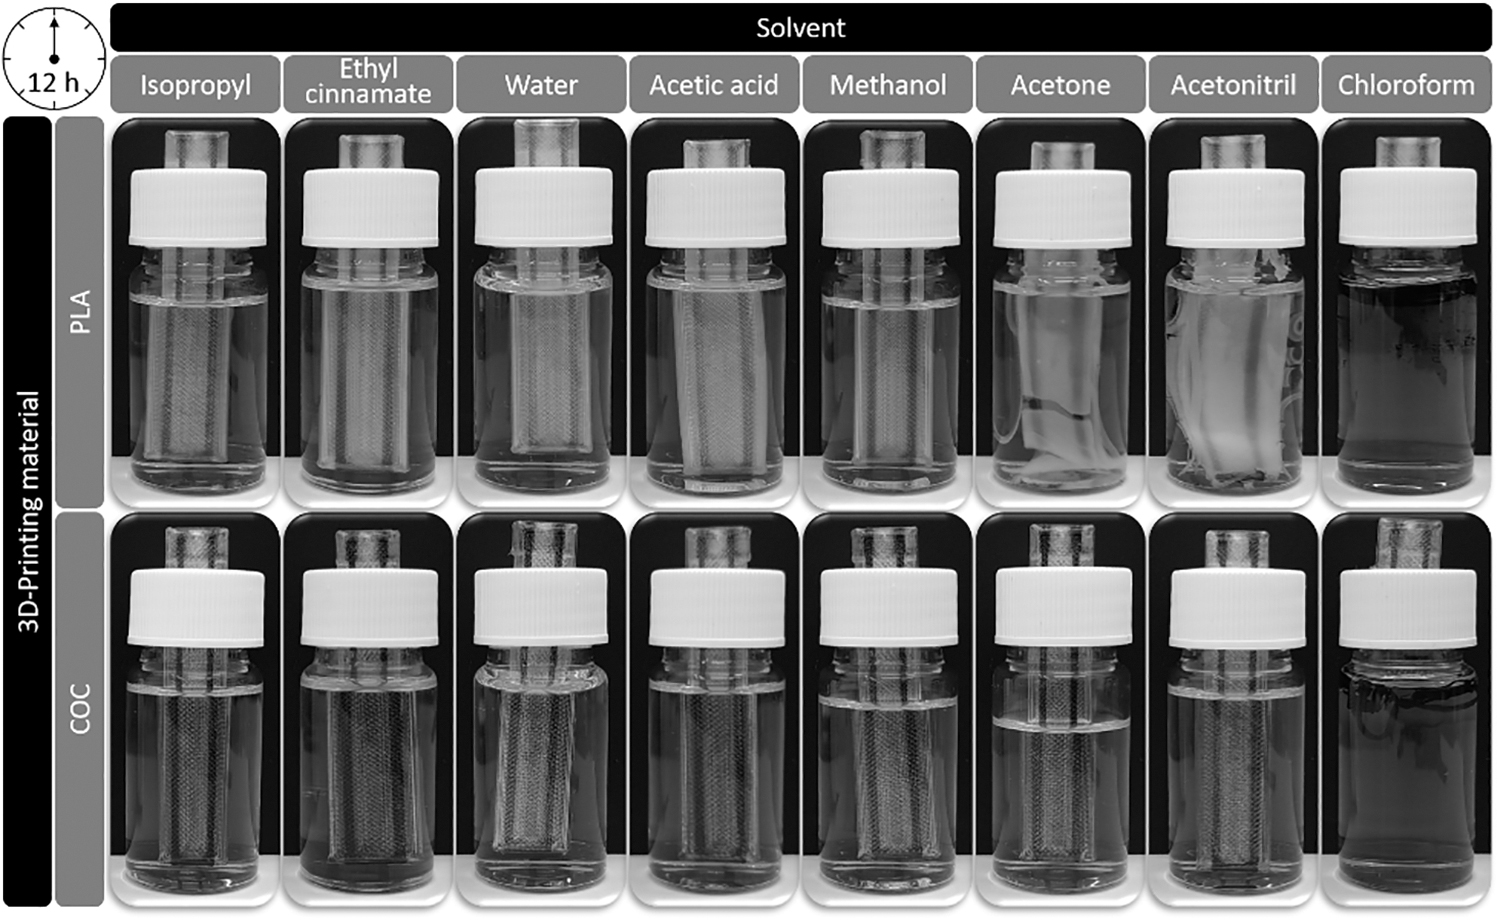
Solvent compatibility test. 3D-printed test structures made from PLA + conductive PLA (top) and COC + conductive 28 wt% COC (bottom) submerged for 12 h in the pure solvents: isopropyl, ethyl cinnamate, water, acetic acid, methanol, acetone, acetonitrile, and chloroform (from left to right). Deviating filling levels caused by different permittivity/evaporation.
Only chloroform caused the complete disintegration of both the COC and PLA structures. The remaining solvents did not have any visible effects on the 3D-printed COC structures after a submersion of 12 h. In case of PLA, acetone and acetonitrile caused the peeling of the 3D-printed structures; acetic acid and ethyl cinnamate caused only a slight deformation and tarnishing of the surface.
For a further and quantitative investigation, a time resolved electrical resistance monitoring had been performed on the inner conductor structure. To monitor an accurately resolved signal, a digital multimeter (see Section “Specific electrical resistivity”) used in electrical resistance mode with an acquisition rate of 10 Hz was used. The yielded data are given in Figure 8 for a submersion time of 12 h. As an additional indicator for the rate of interaction, the time at which the electrical resistance has changed by at least 10% is given as an inset.
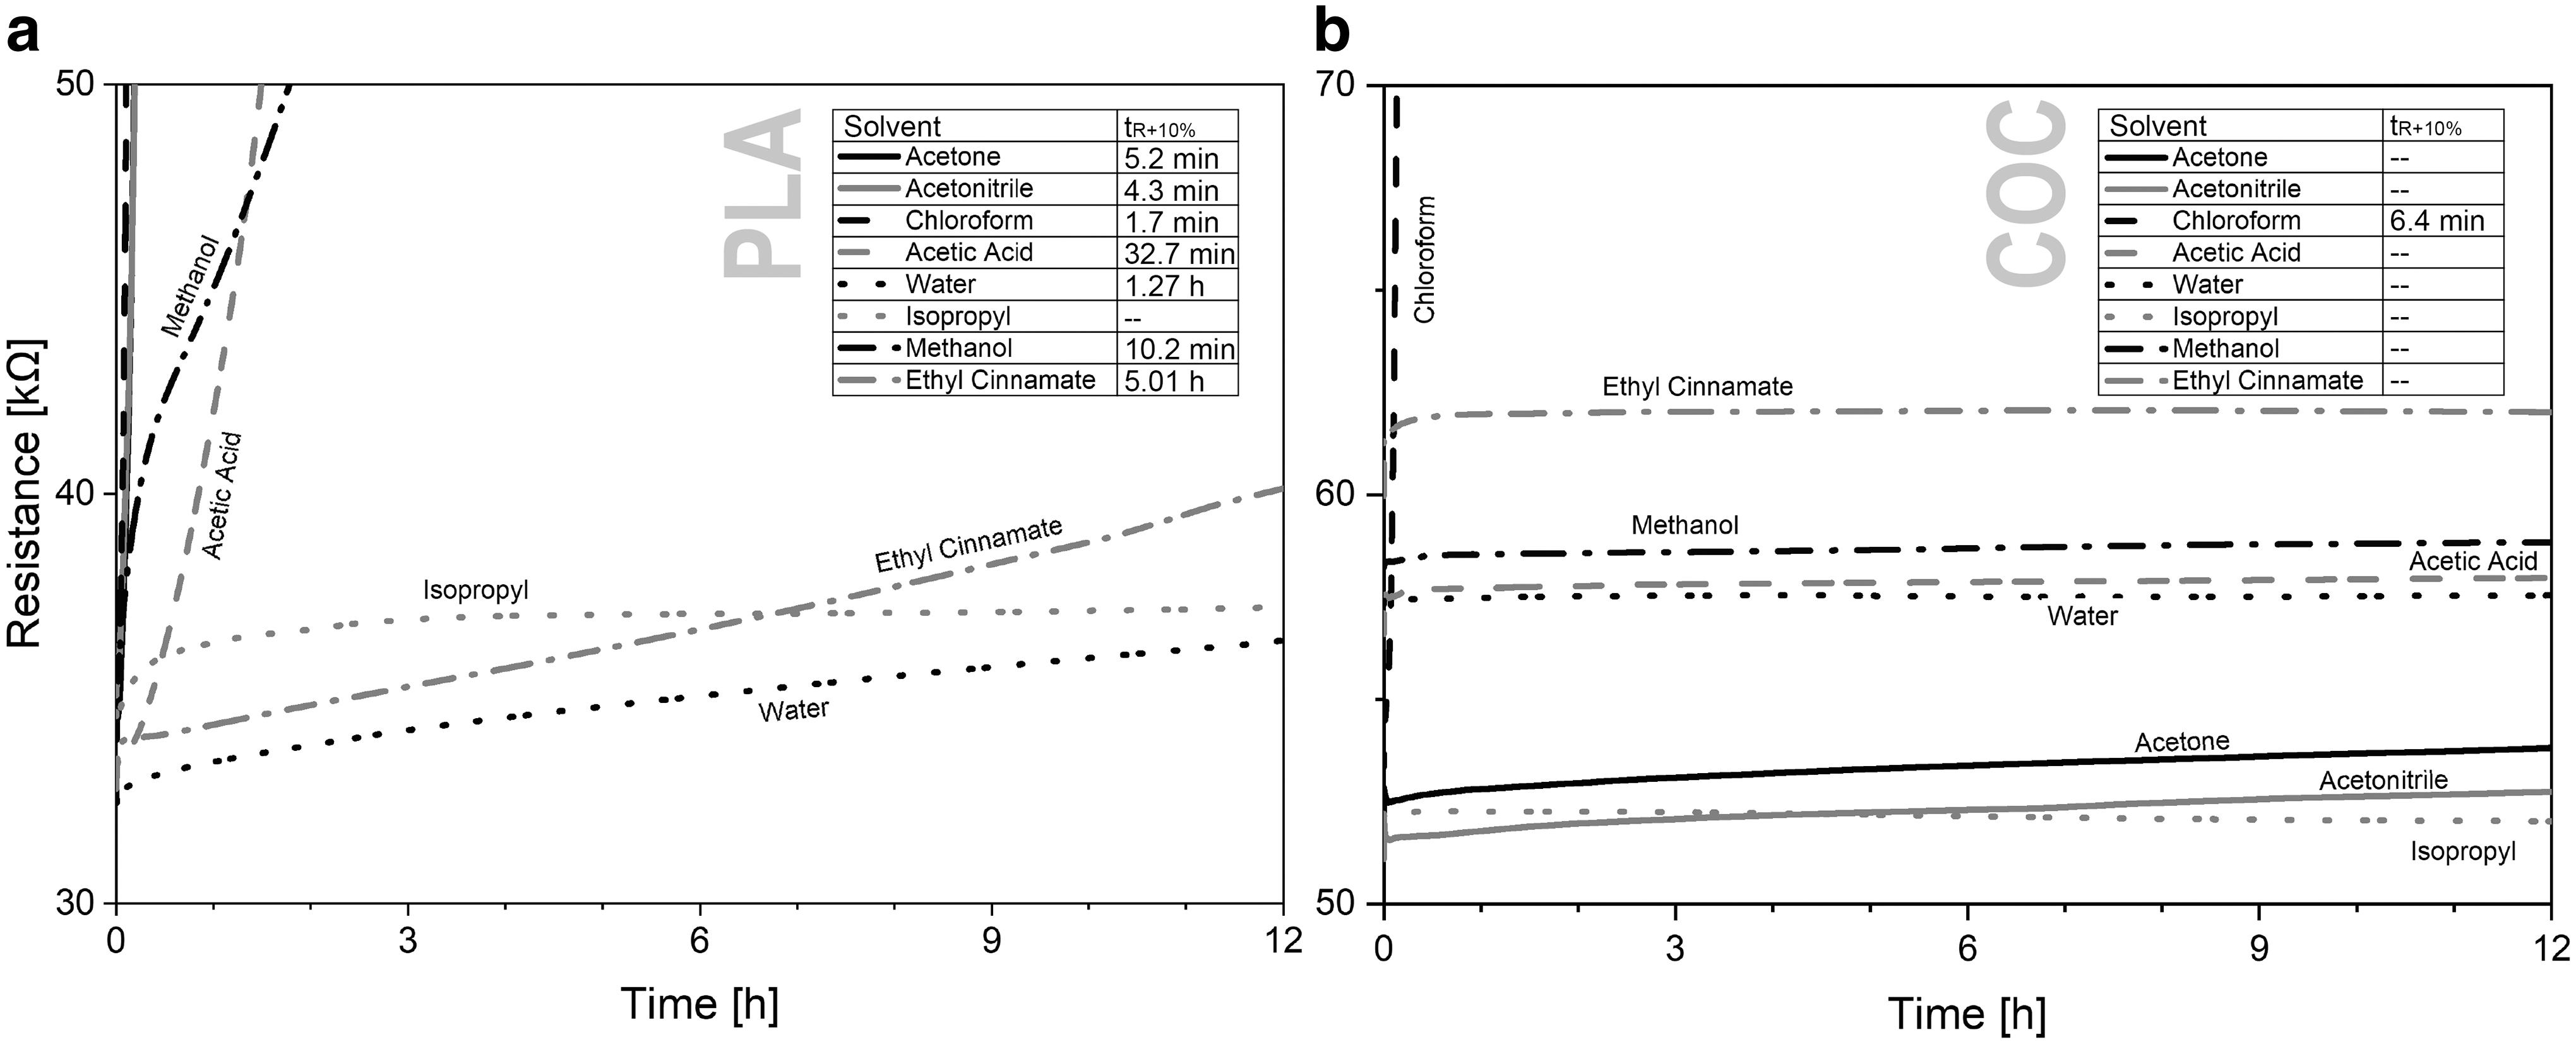
Temporal monitoring of the electrical resistance of the test strips, 3D-printed in PLA
Polylactic acid
Figure 8a illustrates the interaction of PLA with various solvents. The conductive structure rapidly disintegrates in <1 h when exposed to chloroform, acetonitrile, and acetone (note that acetone and acetonitrile lines overlap). A notable 10% increase in material degradation occurs within minutes: 1.7 (chloroform), 4.3 (acetonitrile), 5.2 (acetone), and 10.2 (methanol). Disintegration takes longer with acetic acid and water (within 1 h). Ethyl cinnamate exhibits the slowest disintegration (5 h). Remarkably, PLA remains intact throughout the observation period of 12 h when exposed to isopropyl.
Cyclic olefin copolymer
Regarding COC, Figure 8b shows the temporal changes in electrical resistance. COC exhibits minimal interactions with solvents, except for a 10% increase in electrical resistance observed in chloroform after 6.4 min. Acetone and acetonitrile show slight interactions but no 10% increase even after 12 h. In the observation period, there are no significant changes with other solvents.
These results indicate that 3D-printed COC structures have higher stability against these solvents. This makes COC preferable for (bio-)chemical detectors or reactors, where prolonged exposure to solvents is common, reducing waste and ensuring chemical inertness for frequent use.
3D-printed heating structure
To investigate the functionality of the conductive filaments, miniature heating structures similar to those described by Fornells et al. were 3D-printed by use of the novel conductive COC material blends and commercial conductive PLA in comparison. 40 For this experiment, thermal images were prepared during the heating process of the structure using a constant electrical power of 0.8 W or by applying a constant voltage of 70 V. The corresponding operation conditions of both operating points are given in Table 2.
Parameters of the Two Operation Points for the Heating Structures 3D-Printed by Compounded Cyclic Olefin Copolymer with Three Different Weight Loadings (wt%) of Carbon Black and Commercial PolyLactic Acid Material with Unknown Additive and wt%
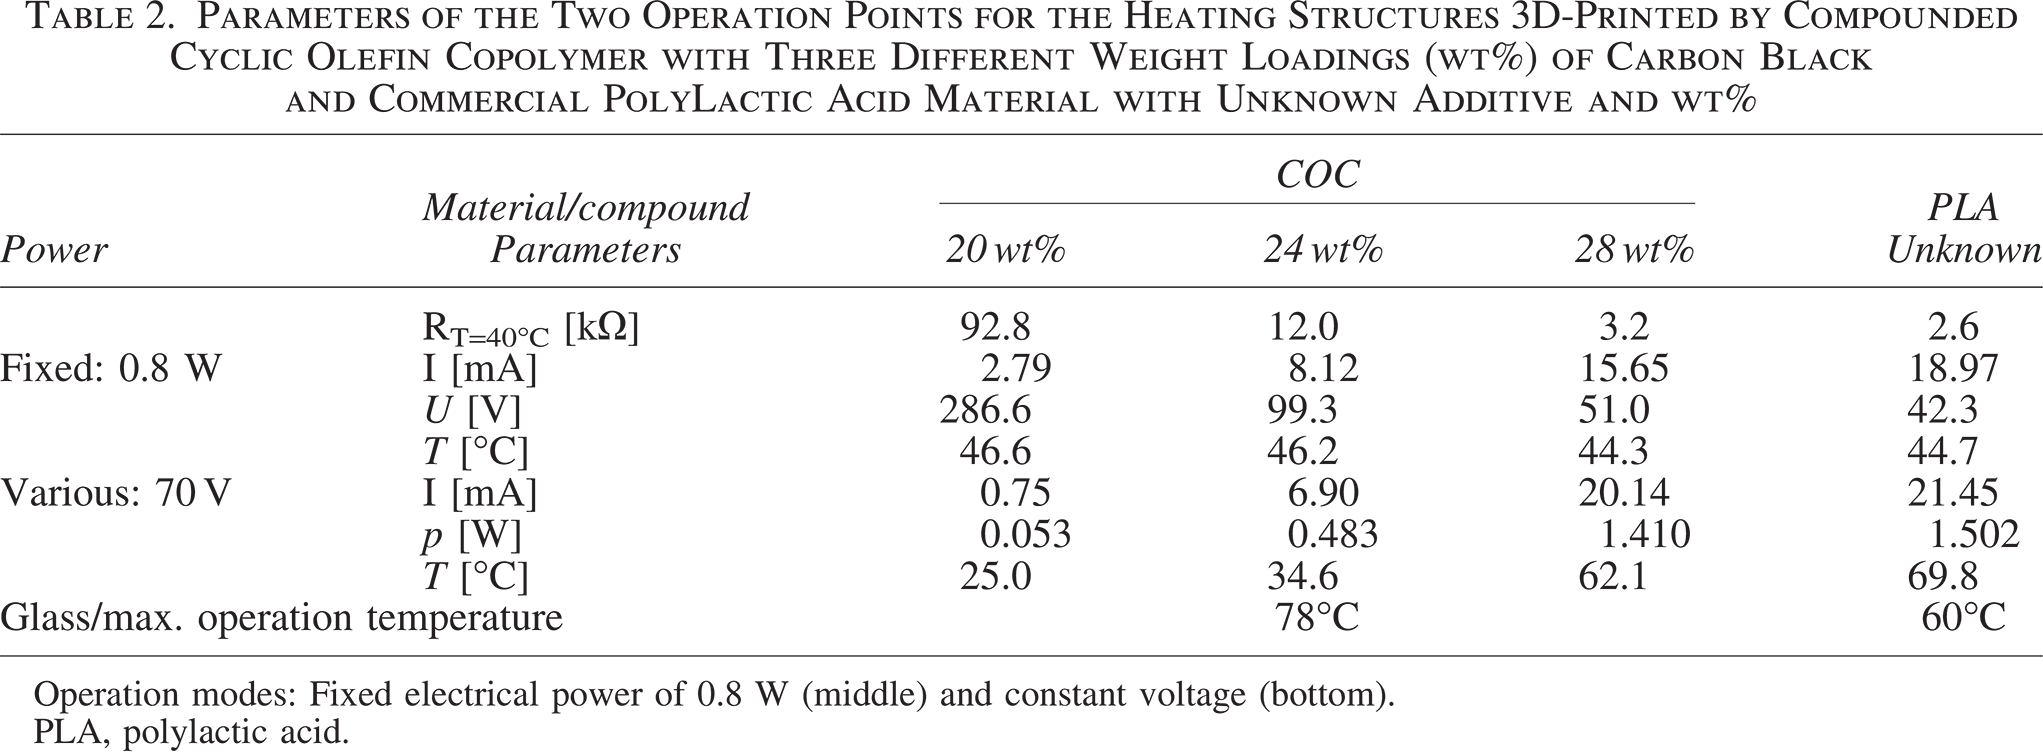
Operation modes: Fixed electrical power of 0.8 W (middle) and constant voltage (bottom).
PLA, polylactic acid.
Constant power
With a constant electrical power input of 0.8 W, all four heating structures achieved a maximum surface temperature of 45 ± 2°C. The uniform temperature performance suggests equal heat production under the given power.
However, variations in carbon black concentration in the conductive structures lead to different electrical resistances, requiring adjusted driving voltages to maintain constant power operation (see Table 2, Figs. 5, 6). To ensure safety during operation, a voltage of ≤70 V is suitable. For the COC heater (20 wt%), which has an electrical resistance of ∼103 Ω at 0.8 W, a voltage of 286.6 V is necessary. By increasing the conductive additive to 28 wt%, the electrical resistance drops to 3.3 Ω, requiring a voltage of 51.0 V. In comparison, commercially available conductive PLA has an electrical resistance of 2.2 Ω, needing 42.3 V for a heating power of 0.8 W.
Constant voltage
In practical and safe operation at a constant voltage of 70 V, the heaters exhibit different heating power capabilities. The commercial conductive PLA heater achieved the highest heating power (1.5 W) and surface temperature of 69.8°C, closely followed by the 28 wt% COC compound (1.4 W, 62.1°C).
However, it is important to note that COC and PLA have specific glass/melting temperatures, marking the point where these polymers begin to lose stability. PLA starts to deform at temperatures of 60°C, whereas COC remains stable up to 78°C.
Conclusions and Outlook
This study demonstrates a novel electrically conductive material for material extrusion 3D-printing by mixing COC with varying amounts of carbon black additive, achieving specific electrical resistivity as low as 0.6 Ωm. Compared with commercially produced conductive PLA, it exhibits comparable specific electrical resistivity variation while offering exceptional chemical/solvent stability and improved temperature stability.
Unlike many available electrically functionalized materials, this COC blend is chemically stable, making it suitable for analytical, (bio-)chemical, and life sciences applications when printed with standard FDM 3D-printers. The study includes electrical characterization of different material blends (20/80, 24/76, 28/72 wt% carbon black/COC) and their application in a 3D-printed cloverleaf using the Van der Pauw method.
The materials' solvent stability to common solvents is demonstrated through time-dependent electrical resistance measurements, allowing the use of 3D-printed parts in solvent/reactive environments. Temperature stability is enhanced compared with PLA, illustrated by 3D-printed heating structures, especially with 28 wt% COC.
Future possibilities include exploring different conductive additives for microfluidic devices or reactors, modifying additive compositions and filament forms, and experimenting with various fillers to achieve higher conductivity, antibacterial properties, or the ability to print heterogeneous catalysts.
The combination of features presented here could revolutionize design and manufacturing processes in chemical and biological laboratories, as well as small-scale production. COC's outstanding chemical/solvent stability, combined with conductivity, opens up opportunities for specialized reaction vessels, microfluidic chips, and sensors designed to operate under harsh conditions or in biological applications.
Footnotes
Acknowledgments
The authors to acknowledge Alex Ramsauer and Jan Bischof for their support in compounding and extrusion process. The financial support of the Ministerium für Kultur und Wissenschaft des Landes Nordrhein-Westfalen and the Berliner Senatsverwaltung für Wissenschaft, Gesundheit, Pflege und Gleichstellung (SenWFGGP) is acknowledged gratefully.
Author Disclosure Statement
No competing financial interests exist.
Funding Information
The study was supported by the Deutsche Forschungsgemeinschaft (DFG, CRC/TRR 296, Project P10, FKZ: TRR 296/1 2020), CRC/SFB 1525 (TP B03, FKZ: 453989101) and the Bundesministerium für Forschung und Bildung (BMBF, FKZ: 03VP07560).
Authors' Contributions
S.H.: Conceptualization, investigation, validation, visualization, writing—original draft.
M.A.: Investigation, validation, writing—original draft.
A.S.: Conceptualization, investigation, writing—original editing.
J.F.: Resources, funding acquisition, project administration, writing—review and editing.
D.S. Resources, project administration, writing—review and editing.
S.B.: Conceptualization, methodology, investigation, supervision, project administration, writing—original draft.
Data Availability Statement
The raw/processed data required to reproduce these findings cannot be shared at this time as the data also form part of an ongoing study. Nevertheless, those data may be made available retroactively from the corresponding author upon reasonable request.