
Abstract
Multimaterial additive manufacturing has enabled the fabrication of components with highly tailored mechanical responses. However, as both manufacturing processes and constituent materials become more sophisticated, the large number of process variables makes design increasingly challenging. Here, we investigate the design space for multimaterial thermoplastic composites produced by a commercially available fused filament fabrication printer. We consider the uniaxial compression of neat materials with sample geometry and toolpath variations, as well as composites comprised of a soft elastic matrix with stiff reinforcement material in different reinforcement fractions and geometries. We find that some changes to the toolpath can have a significant impact on the compressive behavior of the samples due to the high anisotropy of the filaments. The composite geometries were found to exhibit different specific strengths relative to reinforcement fraction, and their compressive behavior matched qualitatively but not quantitatively to predictions from finite element analysis. To understand the performance space, we analyzed the experimental dataset with truncated singular value decomposition. Surprisingly, despite the complexity of the system, 97.8% of the variance in stress–strain curves of our samples was captured by the first component and 99.9% by the first two. The shape of the components indicates that while the stress–strain curves of samples may vary quantitatively, very limited modes are controllable with the design variables considered here. In effect, the strength of the composite could be controlled by manipulating reinforcement mass fraction, but the shape of the nonlinear behavior was largely baked into the constituent materials despite changing the reinforcement geometry. This result has important consequences that must be considered early in the design process when developing new multimaterial systems to achieve tailored mechanical responses.
Introduction
Additive manufacturing (AM) has enabled the rapid manufacturing of personalized designs for improvements in comfort, performance, and cost. This can be seen in applications such as personalized prosthetics, 1 braces, 2 athletic wear, 3 and footwear. 4 The unique geometries of each individual are captured to print form-fitting parts. 5 Most applications require not only geometric fit but also prescribed behavior under loading. This revolution is possible thanks to advances in both computational design and precision in manufacturing processes.
Material response, such as compliance behavior, can be increasingly tailored by spatially varying geometry throughout a part. For example, compression behavior can be tuned for anisotropic behavior 6 or energy absorption by altering feature thickness across a part. 7 By including multiple materials, such as those with different elastic moduli, the design space is further broadened. 8 Spatially varying multimaterial designs can thus achieve performance that is unobtainable using a single-material structure and provide new opportunities for functionally graded parts.9,10
Printed thermoplastic polyurethane (TPU) allows AM fabrication of complex geometry for impact 11 and compression.12,13 Its tensile behavior in fused filament fabricated (FFF) parts has been studied extensively.14,15 With the right chemistry, even dissimilar polymers can bond during the FFF printing process.16,17 Consequently, many multimaterial parts have leveraged TPU for its flexibility in conjunction with other, stiffer materials.18–20 This existing literature provides a convincing picture of TPU’s utility in FFF, as it can be readily printed, is compatible with other polymer filaments, and is more flexible than materials such as polylactic acid or acrylonitrile butadiene. However, little work has been conducted on compressive behavior of FFF printed TPUs,21,22 and even less on TPU composites produced by multimaterial FFF; to our knowledge, only one study on compressive behavior of FFF TPU/TPU composites exists in the literature. 23
Optimization of AM during part manufacturing is challenging due to the vast number of process variables. 24 This has increased interest in data science to analyze experimental observations and design new materials or processing routes. 25 Linear projections such as principal component analysis (PCA) or singular value decomposition (SVD) are commonly used for dimensionality reduction when modeling and visualizing high-dimensional data.26,27 PCA has been used to visualize the design space in engineering problems such as understanding the process–structure relationships in AM, 28 predicting the cohesive energy of compounds, 27 and understanding the effects of shape on airfoil29–31 and turbine blade 32 performance. These strategies allow for more human-friendly visualizations of high-dimensional data, facilitating the understanding of complex designs.
In this work, two different grades of TPU with highly contrasting mechanical properties were integrated into solid multimaterial composite parts to understand the effects of the structural and process parameters on the material performance under compressive loading. Relatively few studies have been published on the compressive behavior of TPU in either single- or multimaterial FFF components, and very few on the compressive behavior of TPU/TPU composites in general. In our study, the components are reinforced by two different patterns with varying geometric features that span a wide range of reinforcement ratios. The patterns were fabricated on a commercially available 3D printer, and their mechanical strength was evaluated. The stress–strain curves representing the mechanical behavior of the parts were analyzed by SVD to quantitatively describe the complexity of the materials and fabrication process.
Materials and Methods
Materials
Thermoplastic polyurethane (TPU) was selected because it can be produced with vastly different hardness. By selecting two different TPU materials rather than two distinct polymers, we anticipated better bonding. Filaments were purchased from Essentium with a 2.85 mm diameter. Some properties are provided in Table 1; most importantly, the two grades of TPU have vastly different hardness, with TPU-80A having a Shore hardness of 80A and TPU-74D having a Shore hardness of 73D. The difference between these materials is also shown by tensile modulus varying by more than 15× (varying slightly in different directions).
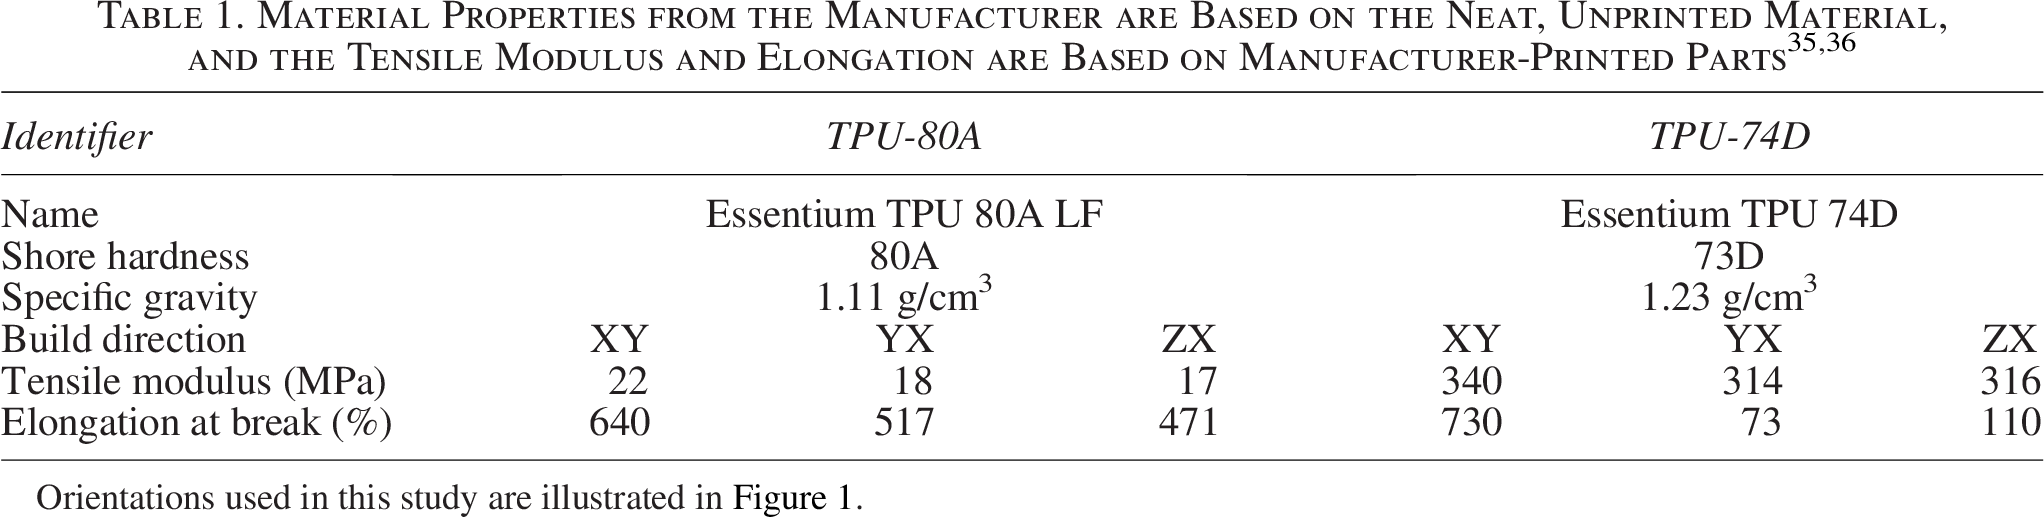
Orientations used in this study are illustrated in Figure 1.
Note that the orientations described in this text refer to the build orientation rather than solid mechanics notation; all mechanical behaviors in this work are uniaxial compressive loading. The XY build orientation refers to a flat tensile bar with printed roads aligned in the load direction, YX refers to a flat tensile bar with printed roads aligned perpendicular to the load direction, and ZX refers to a vertically printed tensile bar. Our typical load case best resembles ZX but in compression. We also perform limited tests of the YX case. See Figure 1 for a schematic representation of these directions.
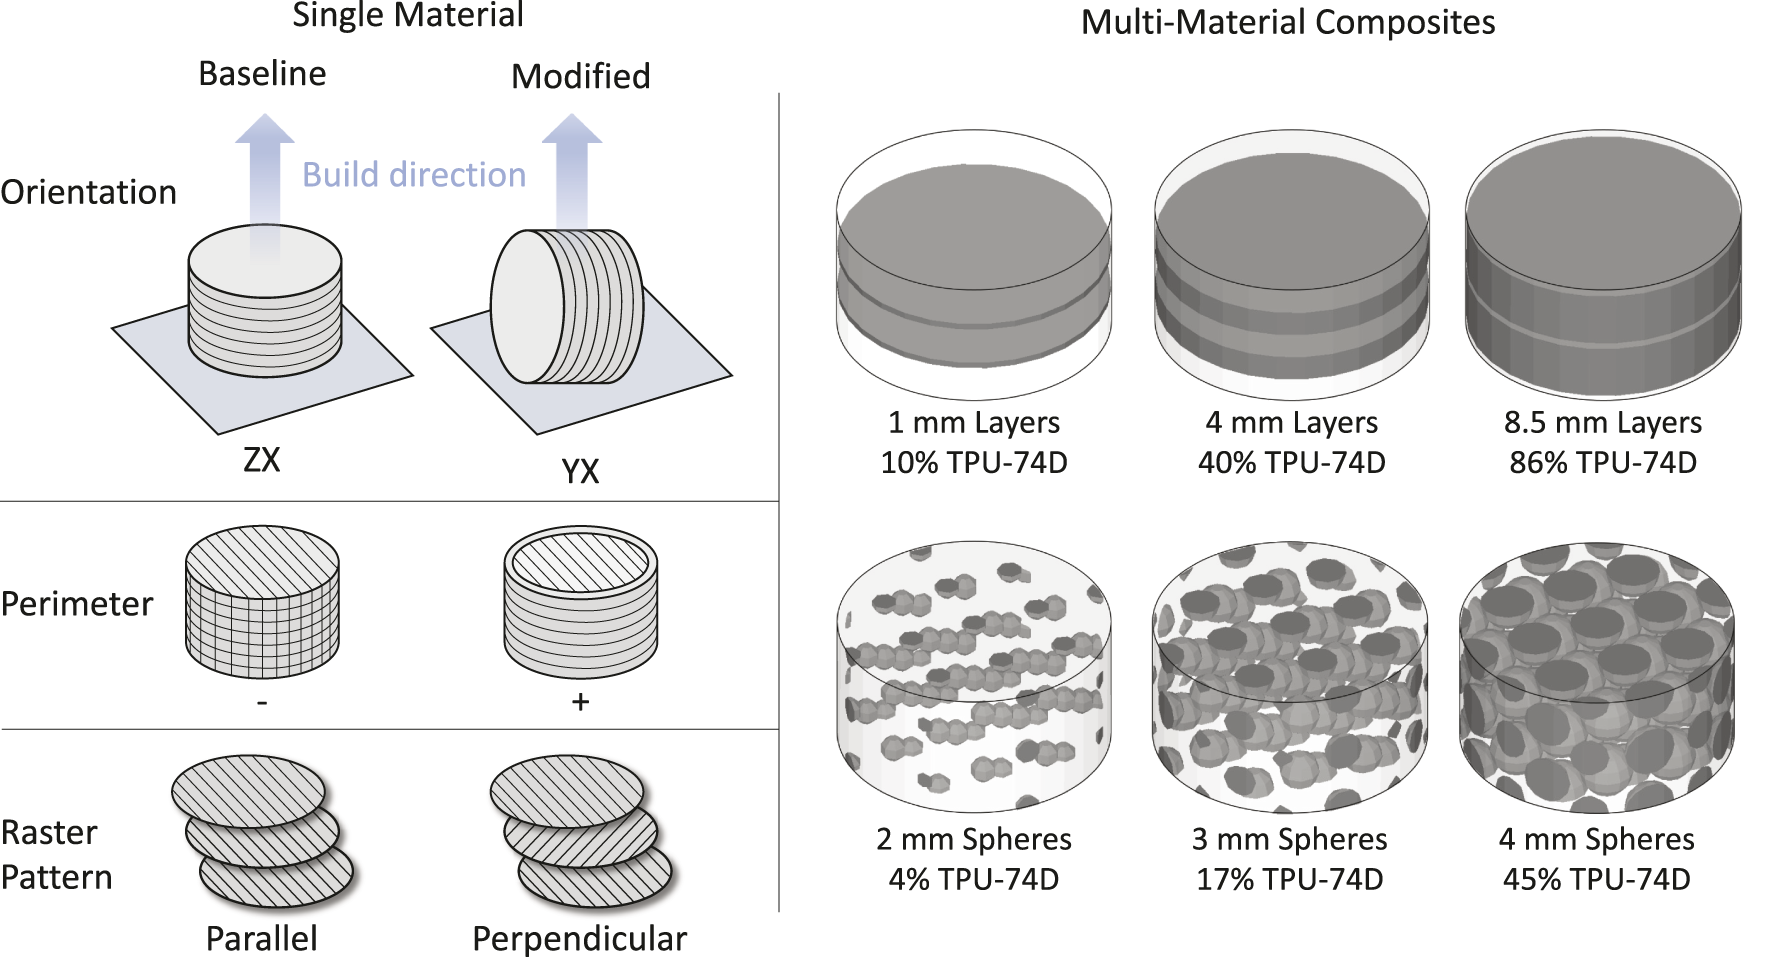
Schematic representation of the variations to sample geometry and toolpath considered in this study. For single-material designs, we varied build orientation, perimeter ring, and raster pattern as shown. For multimaterial composites, we investigated layers and spherical inclusions of reinforcement material. TPU-80A is represented in the renderings as translucent and TPU-74D is represented as dark gray, corresponding to their physical appearance.
Material was dried in a vacuum oven at 70°C for a minimum of 8 h and stored in closed air-tight containers to minimize variation in the material due to moisture content.33,34 While printing, the material was stored in a dry box (PolyBox edition II). The material was redried as needed when the material exhibited observable bubbles while printing. Note that we did not verify these tensile properties independently; we only performed compression tests in this study.
Sample design and fabrication
Disk-shaped specimens with 40 mm diameter and 20 mm height were designed for compression testing. Neat TPU-80A and TPU-74D and composites with one of two basic reinforcement geometries were tested (Fig. 1). The first was a “layered” pattern (i.e., varying only in the build axis) consisting of TPU-74D reinforcement layers of uniform thickness within a TPU-80A matrix; the single design variable for these was layer thickness. The second was a “sphere” pattern with a body-centered cubic lattice of spherical inclusions, with a lattice site in the center of the sample’s bottom face (spheres are centered at lattice sites, so the spheres on the bottom are half-spheres). Distance between the centers of neighboring spheres was held constant at 10 mm while the radii varied; the single design variable was the diameter of spherical inclusions.
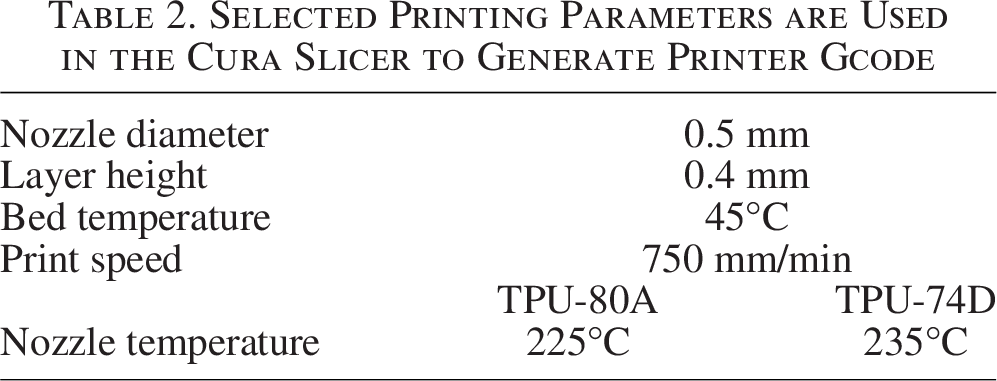
Fabrication was performed on a Lulzbot Taz Pro with dual-head extrusion. Toolpaths were generated using Cura (Lulzbot Cura SteamEngine 3.6.23). Parameters used to generate toolpaths are shown in Table 2. All samples used fully dense designs (i.e., 100% infill) and were printed flat on the print bed with aligned infill and material retraction off. Perimeters were turned off unless otherwise specified. When they were used, three layers were used for walls (so a perimeter implies three concentric rings throughout). Renderings of the toolpaths are available in SI (Fig. S1).
Selected Printing Parameters are Used in the Cura Slicer to Generate Printer Gcode
Both materials were challenging to print, requiring extensive process tuning. A raft was required to overcome poor bed adhesion in TPU-74D. A purge tower was employed to switch between filaments. The flexibility of the materials resulted in under-extrusion caused by the material buckling when compressed into the nozzle, slipping on the extruder gear, material degradation restricting material flow over time, and stretching as it was pulled from the filament spool. An extrusion multiplier was added to help compensate, but it did not entirely resolve the issues in TPU-80A. Note that this leads to samples that are not fully dense despite using 100% infill in the design.
Overall, we include data from 74 samples representing 18 different designs and/or process parameters. This is an average of four samples per design, but the mode is 3, with a minimum of 1 and a maximum of 14; the exact number of replica samples for each design is given in the SI. In short, we decided to fabricate more replicas of some designs due to high variability in the fabrication process, and for the case of the single replica (the only case with less than 3), we could only fabricate one suitable sample due to the challenges with printing TPU-80A.
Uniaxial compression testing
An Instron 8511 servo-hydraulic test frame operated by an Instron 8800 controller and equipped with a 20 kN actuator and 22 kN load cell was used for compression testing the printed samples. The specimens were centrally positioned between two flat platens and loaded in position control at a rate of 1 cm/min. Images of the compression are shown in Fig. 2. The compression tests were performed by loading and unloading in a single run, with cyclic loading repeated three times during the compression test for each sample. Force–displacement curves were obtained for each sample, which were converted to engineering stress and engineering strain based on the nominal cross-section and height. We will refer to these postprocessed data (i.e., paired engineering stress and engineering strain) as stress–strain curves.
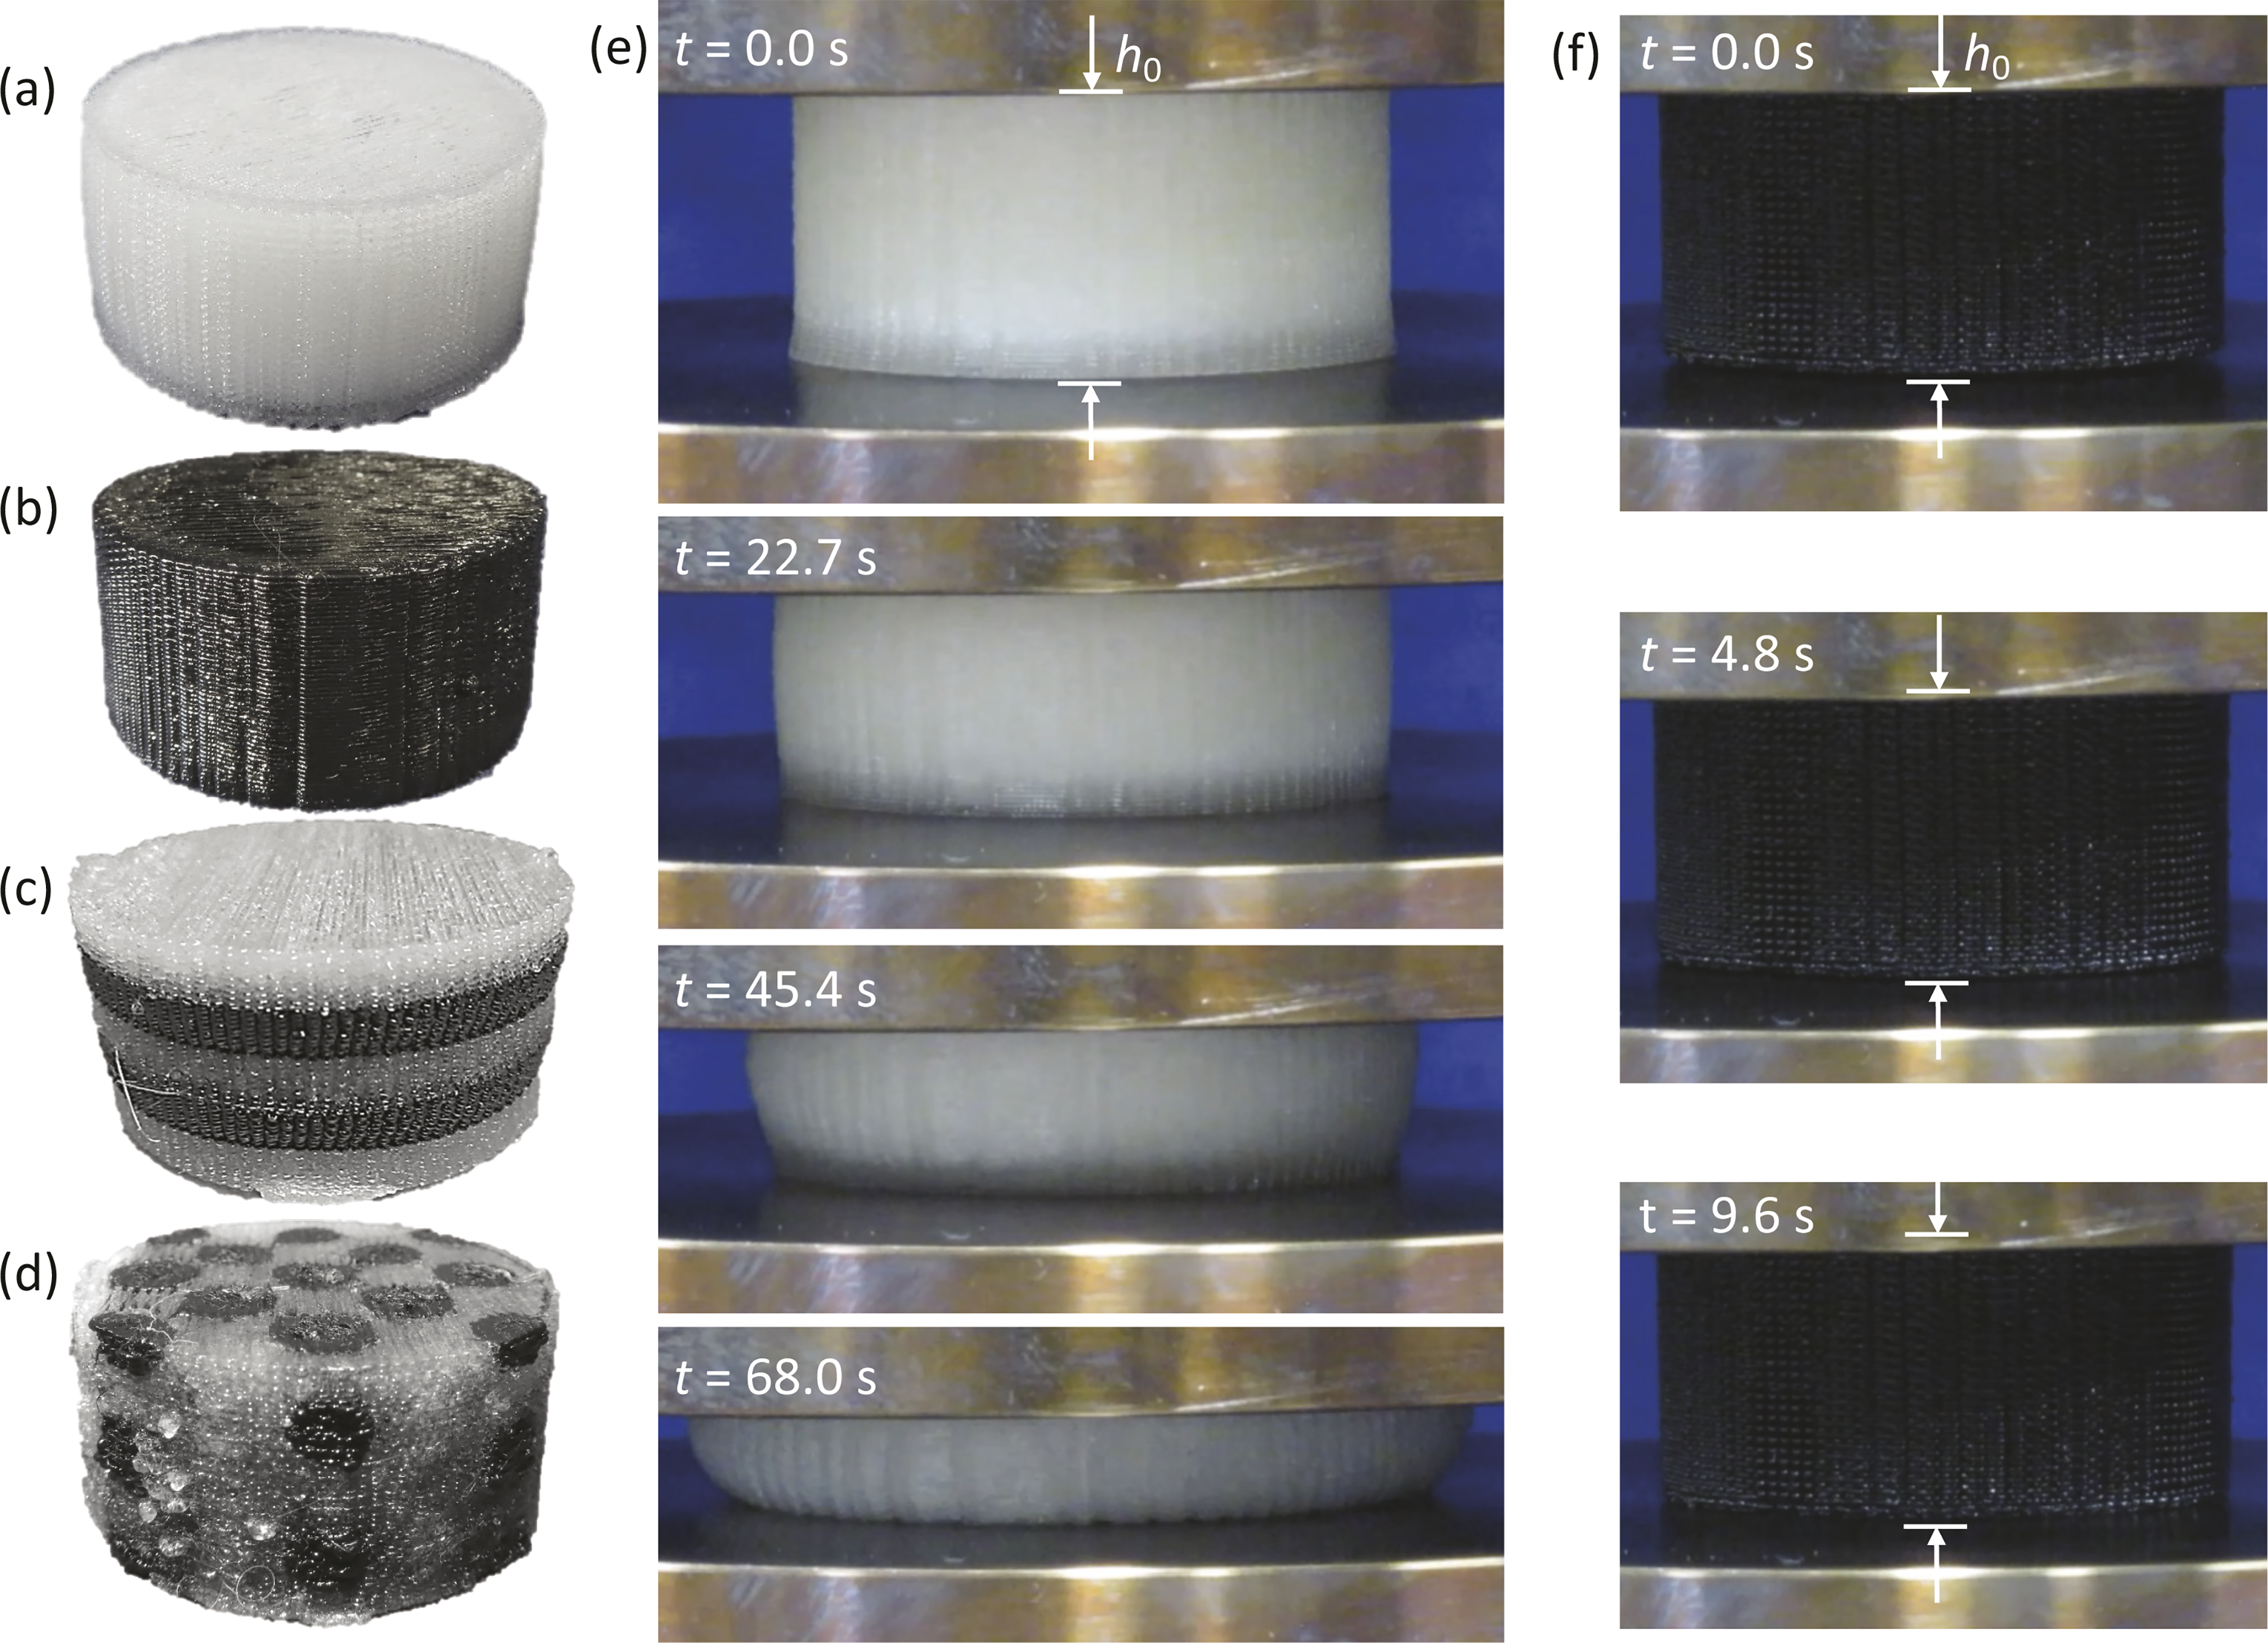
Images of experimental samples produced by FFF:
Data preparation
We applied a preloading of 0.2 MPa to account for compliance at the start of compression; this accounts for at most 2% of the maximum stress and as little as 0.8%. To compute statistics, we resampled the strain data at the same stress values using linear interpolation. Mean and standard deviation were thus computed on strain data for a given stress across multiple samples.
Finite element analysis
Finite element analysis (FEA) was performed using FeNICS, an open-source solver.37,38 Tetrahedral meshes were generated using gmsh.
39
Following relevant literature,40,41 the constitutive model was a compressible Yeoh hyperelastic model with the following form
42
:
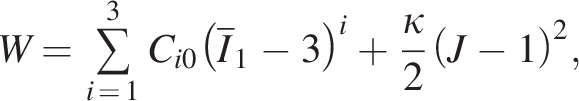
Two separate material models were obtained by fitting to experimental data for the neat TPU-74 and TPU-80 samples with 40 mm diameter. Fitting was performed using Bayesian Optimization with the open-source dragonfly package.
43
The best-fitting model parameters were:
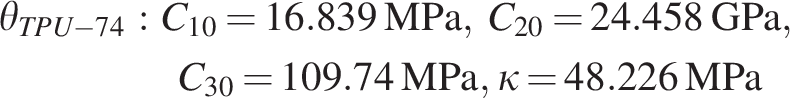
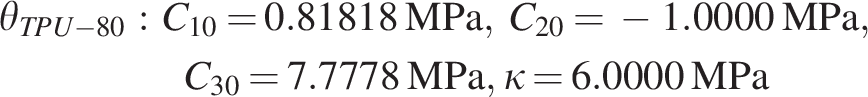
These material parameters were then applied to simulations of the composite geometries.
Dimensionality reduction
Truncated SVD is a dimensionality reduction technique by which the original, high-dimensional data are projected onto a linear basis set. The basis set is truncated to include only the components with the top-k greatest eigenvalues to effectively reduce the dimensionality of the data. Since the limiting factor in our compression experiments was the maximum force of our load cell, we chose to consider strain values at fixed stress. We, therefore, interpolated the strain data from each sample at fixed stress values between zero and the minimum maximum strain across all the samples (9.16 MPa) for consistency. The SVD was then performed on these vectors of resampled strain values, with every test specimen having data at each of the given stress values. SVD was performed using Scikit-learn. 44
Results and Discussion
Neat samples
Cyclic loading was applied to neat samples with 40 mm diameter. Hysteresis was observed between the first and second cycles, with the softer TPU-80A exhibiting densification while the stiffer TPU-74D exhibited softening. Only minimal hysteresis was observed in subsequent loading cycles, so subsequent analysis considered only the loading part of the second cycle. Some representative load–unload curves are shown in the SI (Fig. S2). Using this protocol, we evaluated the effect of different geometries and toolpaths on the mechanical properties of neat samples. We tested some neat samples with different diameters (30, 40, and 50 mm), while the rest of the designs are all nominally 40 mm in diameter. However, we also explored the effect of different raster patterns during infill, build orientations, and perimeter rings (◯). The influence of toolpath must be considered when analyzing composite geometries since it is impossible to utilize the same toolpath for different geometries.
The effects of different geometries and toolpaths are shown in Figure 3. Compression data were analyzed for different sample diameters for neat materials in panels a and b. In short, the effect of the sample diameter (ø) on compressive behavior was minimal (within uncertainty bands). Toolpath variations are shown in Figure 3c and d. For TPU-80A, both the perpendicular raster pattern (⟂) and YX build orientation resulted in slightly reduced stiffness compared with baseline, while the perimeter rings resulted in increased stiffness. For TPU-74D, the differences between the toolpaths were insignificant. We conclude that under-extrusion of TPU-80A leads to greater discrepancy in the densification behaviors with different toolpaths, while the easier-to-print TPU-74D shows less deviation.
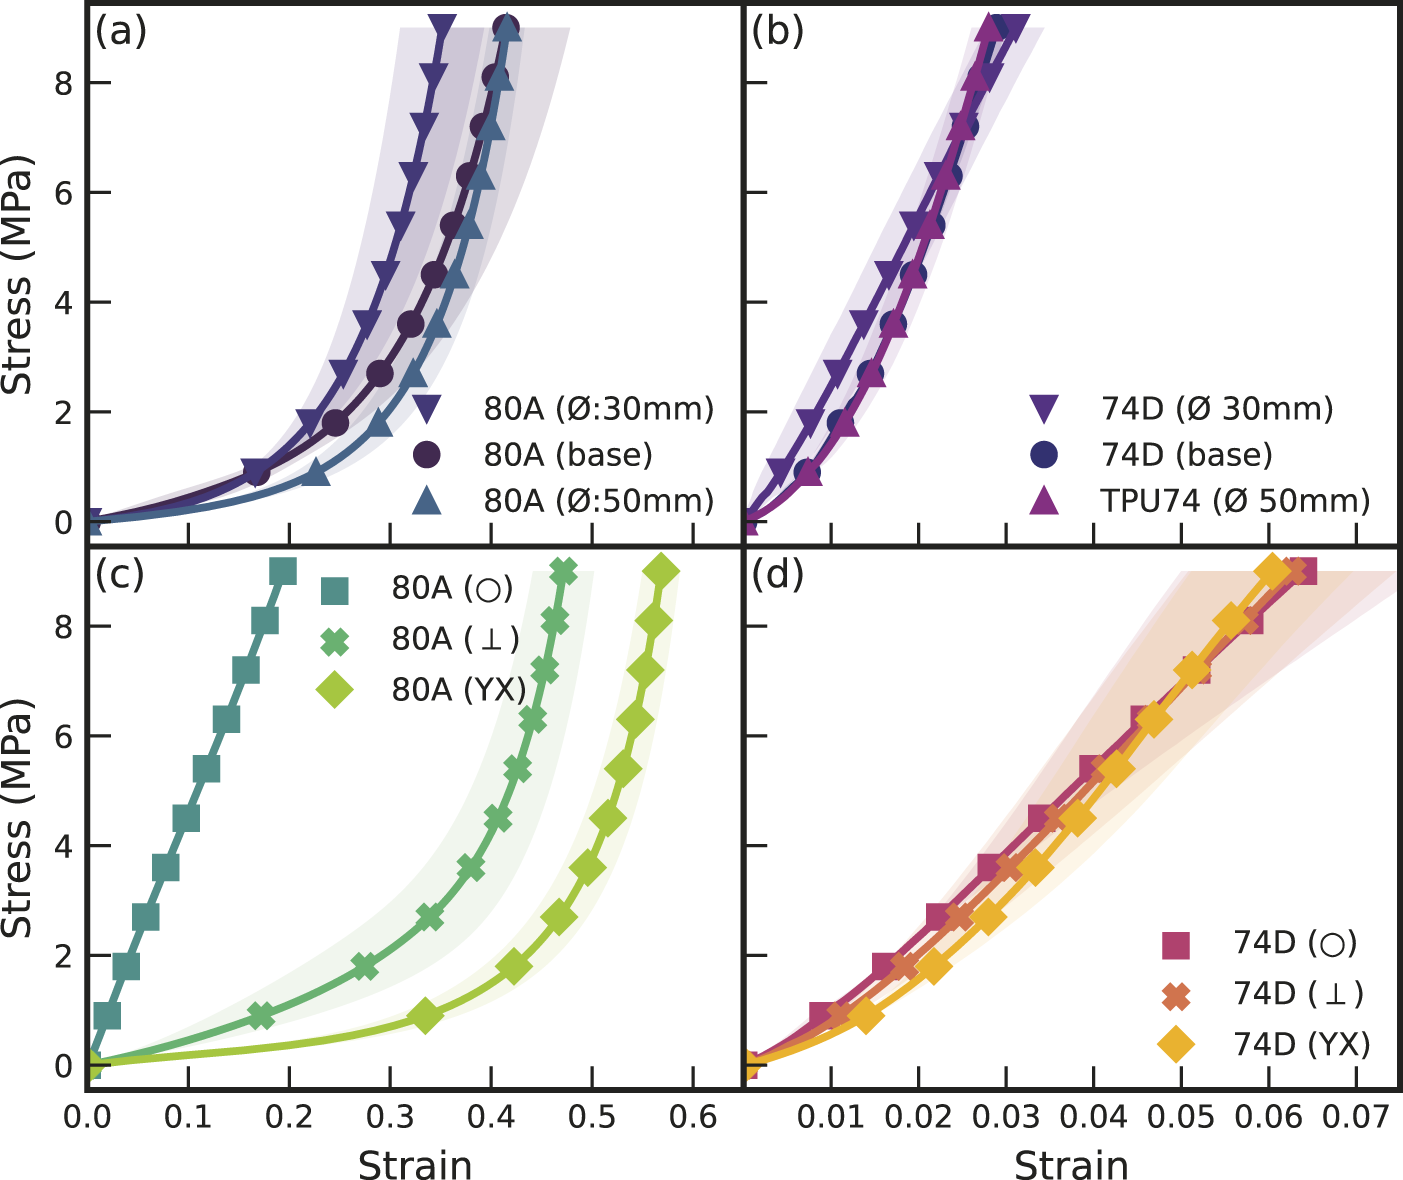
Compression test results for neat samples.
Among these experiments, the most significant effect was observed by adding perimeter rings for the TPU-80A samples. We expected this to change the densification behavior as the material will be stronger in tension along the filament than the bonding between filaments. We suspect that the perimeter rings reduce cross-section expansion during compression, which may result in misleading engineering stress compared with true stress.
Composite samples
Each composite sample has a diameter of 40 mm and a height of 20 mm, and the slicer settings were fixed throughout, with a “parallel” raster pattern and no perimeter rings. Increasing the amount of TPU-74D reinforcement material should increase the overall strength of the composite compared with neat TPU-80A, eventually approaching the strength of neat TPU-74D. Here, we seek to establish the degree to which the behavior of the composite can be controlled independently of this reinforcement fraction by manipulating reinforcement geometry.
For composite samples with layered reinforcements, the layer thickness of TPU-74D was manipulated while keeping a constant number and arrangement of layers. The reinforcement fraction for spheres was manipulated by varying the radius of inclusions. The resulting compression data are shown in Figure 4 for each reinforcement type. In the weakest cases, the samples exhibit a shallow slope before densification, similar to the neat TPU-80A samples, while the strongest cases exhibit a steeper slope that is also more linear, similar to the neat TPU-74D samples. The middle cases exhibit a blend of these behaviors, as expected.
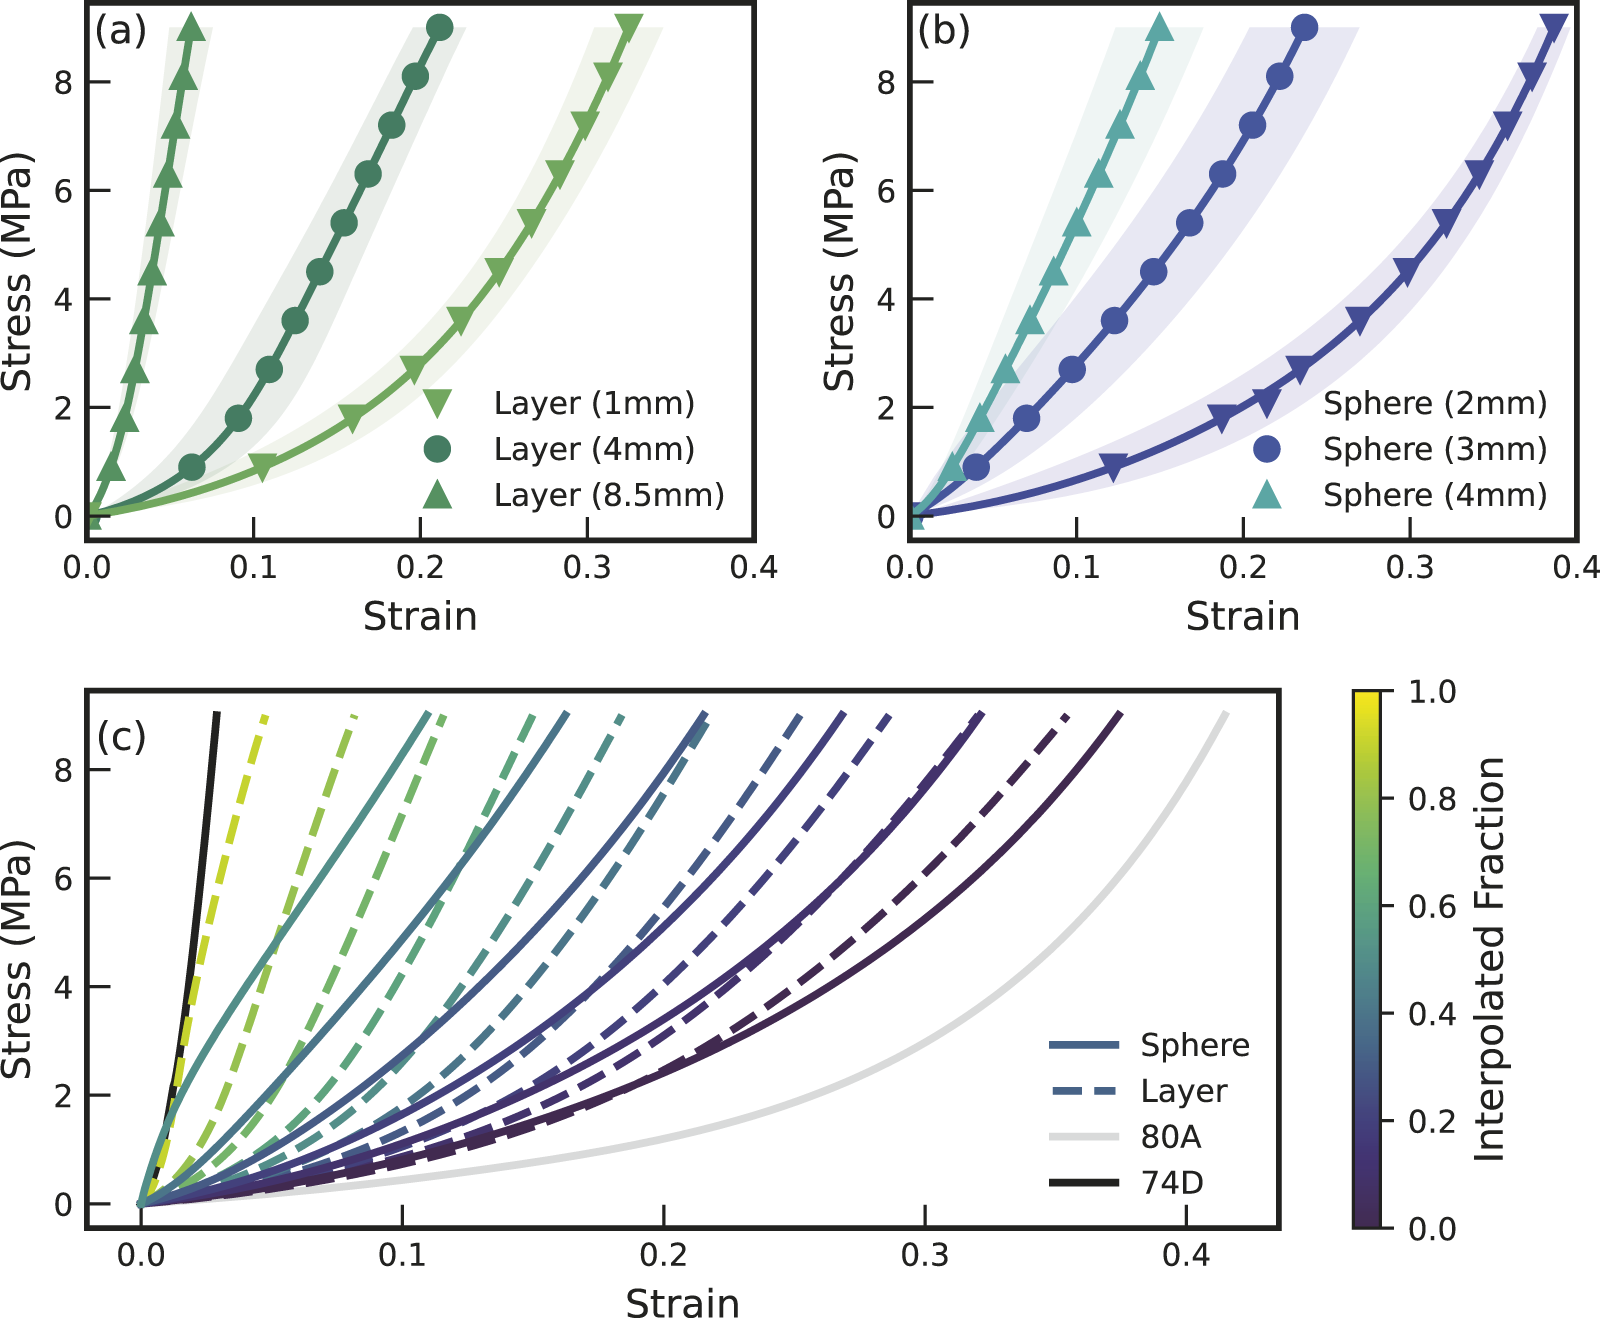
Compression test results for composite samples with different reinforcement geometries.
To compare the observed compression behavior between the two reinforcement types, it is necessary to consider the reinforcement volume fraction, as reported in Figure 1. Note that the layer reinforcement designs have roughly twice the reinforcement material in each sample compared with the sphere reinforcements. This necessitates a more detailed comparison that considers (nearly) equivalent volume fractions of the reinforcement material. We probe these differences between reinforcement geometries in Figure 4c, which shows the sphere reinforcement, layer reinforcement, and neat samples interpolated to many different volume fractions.
At moderate volume fractions, sphere reinforcements provide a higher slope at low strain but grow to a lower slope at high strain compared with the layer reinforcements. This can be seen in the 50% curve for spheres, whose stress grows faster than the 50% curve for layers but ultimately approaches a similar value at around 15% strain. Both reinforcement types outpace the expected behavior obtained by interpolating from neat samples, reaching neat TPU-74D well ahead of 100% interpolated volume fraction. The shape of these curves is due to the different compaction behavior of spherical inclusions compared with horizontal layers of TPU-74D in the composites. Spheres on a lattice will span the sample in the load axis faster than the layer samples, providing greater stiffness at lower strain. Meanwhile, the stiffness of the TPU-74D in the layer reinforcements will not become relevant until the compliant TPU-80A begins to densify, at which point the TPU-74D will start to dominate.
Finite element analysis
Calibrated constitutive models were obtained for each of the neat TPU materials and deployed to simulate the performance of the composites shown in the preceding sections. The results in Figure 5 show that the model captures the qualitative behavior (e.g., approximate ratios of strength between different geometries) but does not quantitatively match the experiments. In particular, the experimental composite samples were stiffer than the models. The discrepancy is likely due to the strong influence of the toolpath, which has not been included in the continuum simulation model; it is fundamentally impossible to achieve an identical toolpath when fabricating samples with different reinforcement geometries (i.e., one toolpath cannot fabricate spheres of different radii).
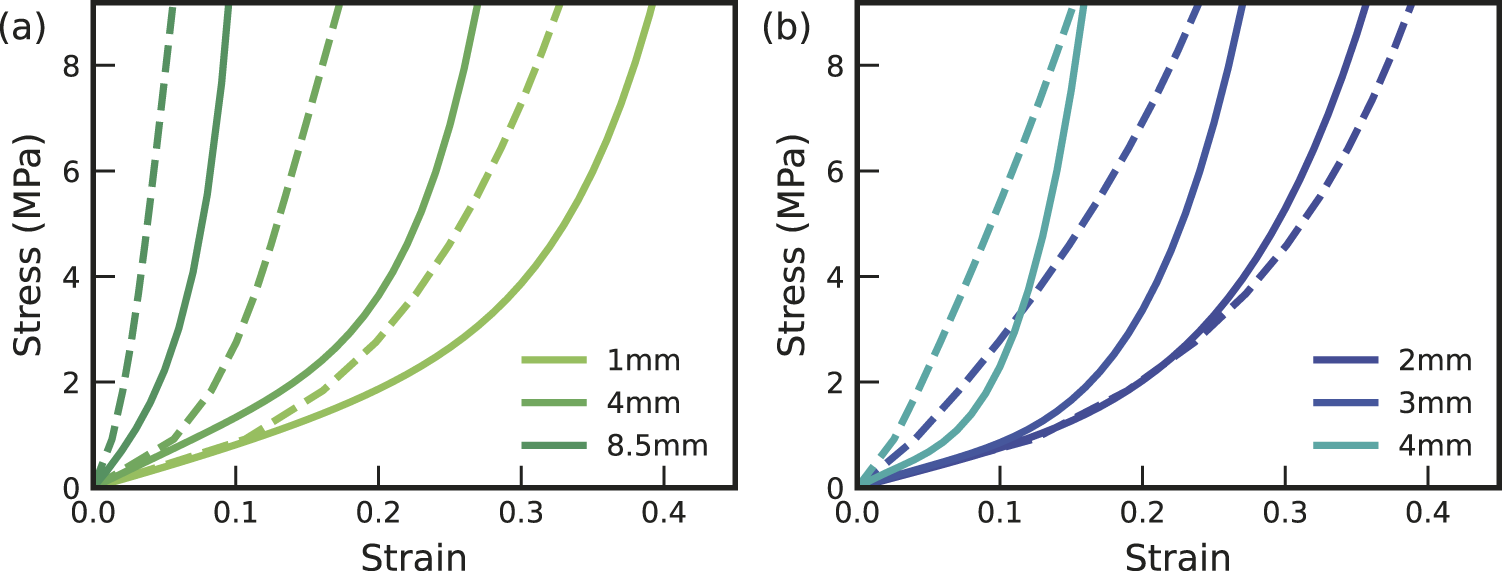
Result of the FEA on composite geometries for
To be clear, our FEA model treats the bonded filaments as a single continuous body with isotropic properties. With FFF, this is not the case, as bonded filaments will result in a highly anisotropic material that fails first at interfaces between filaments (such as between layers). In our analysis, we are considering the continuum results to be descriptive of the effect of reinforcement geometry, while interfaces between filaments and between layers are intrinsically tied to the toolpath. Thus, when we say the discrepancy is related to the toolpath, we mean that the discrepancy between the FEA results and the experimental results is indicative of the bonding interfaces that have not been included in the FEA model. We chose this simplified FEA approach as a first step to isolate the effects of reinforcement geometry.
The best example of the discrepancy is the 4 mm sphere geometry, where the simulated behavior is much more compliant at low strain compared with the experiment. The 2 mm sphere geometry gives the best match, which also corresponds to the smallest reinforcement volume fraction. Meanwhile, all the layered geometries in Figure 5a show poor agreement between the simulation and experiment, but by a consistent margin. This inconsistency between the two reinforcement styles is further evidence of the influence of the toolpath, as each build slice in the layer designs has the same toolpath no matter the reinforcement thickness, while the sphere designs have toolpaths in each slice that depend on the size of the spheres.
Dimensionality reduction
The objective of this study is to probe the degree to which the compressive behavior of fully dense thermoplastic composites can be tuned by adjusting reinforcement geometry. In examining the many variations of similar compression curves above by eye, the answer to this question remains unclear; though the overall strength of different samples varies, they all exhibit a similar nonlinear behavior that is difficult to tell apart. We now seek to address this question via a data-driven approach, namely, the application truncated SVD to all the stress–strain curves.
The number of dimensions to retain in truncated SVD projection is determined via the explained variance; each vector component of the right singular matrix captures a fraction of overall variance when creating the projection. In our SVD, the first component captured 97.8% of variance in strain data, while the second component captured 2.1%. Thus, we represent 99.9% of the total variance in the strain curves by projecting onto the first two components in Figure 6.
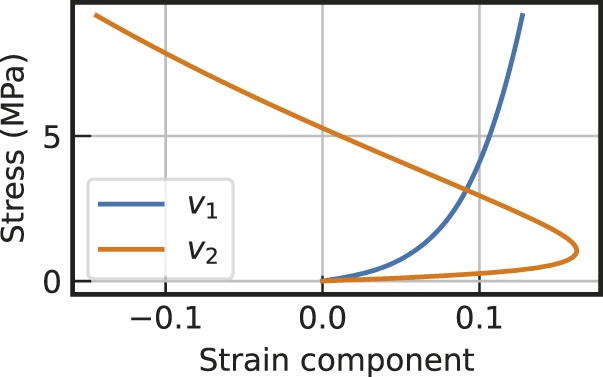
First and second components from SVD on the resampled experimental stress data. SVD, singular value decomposition.
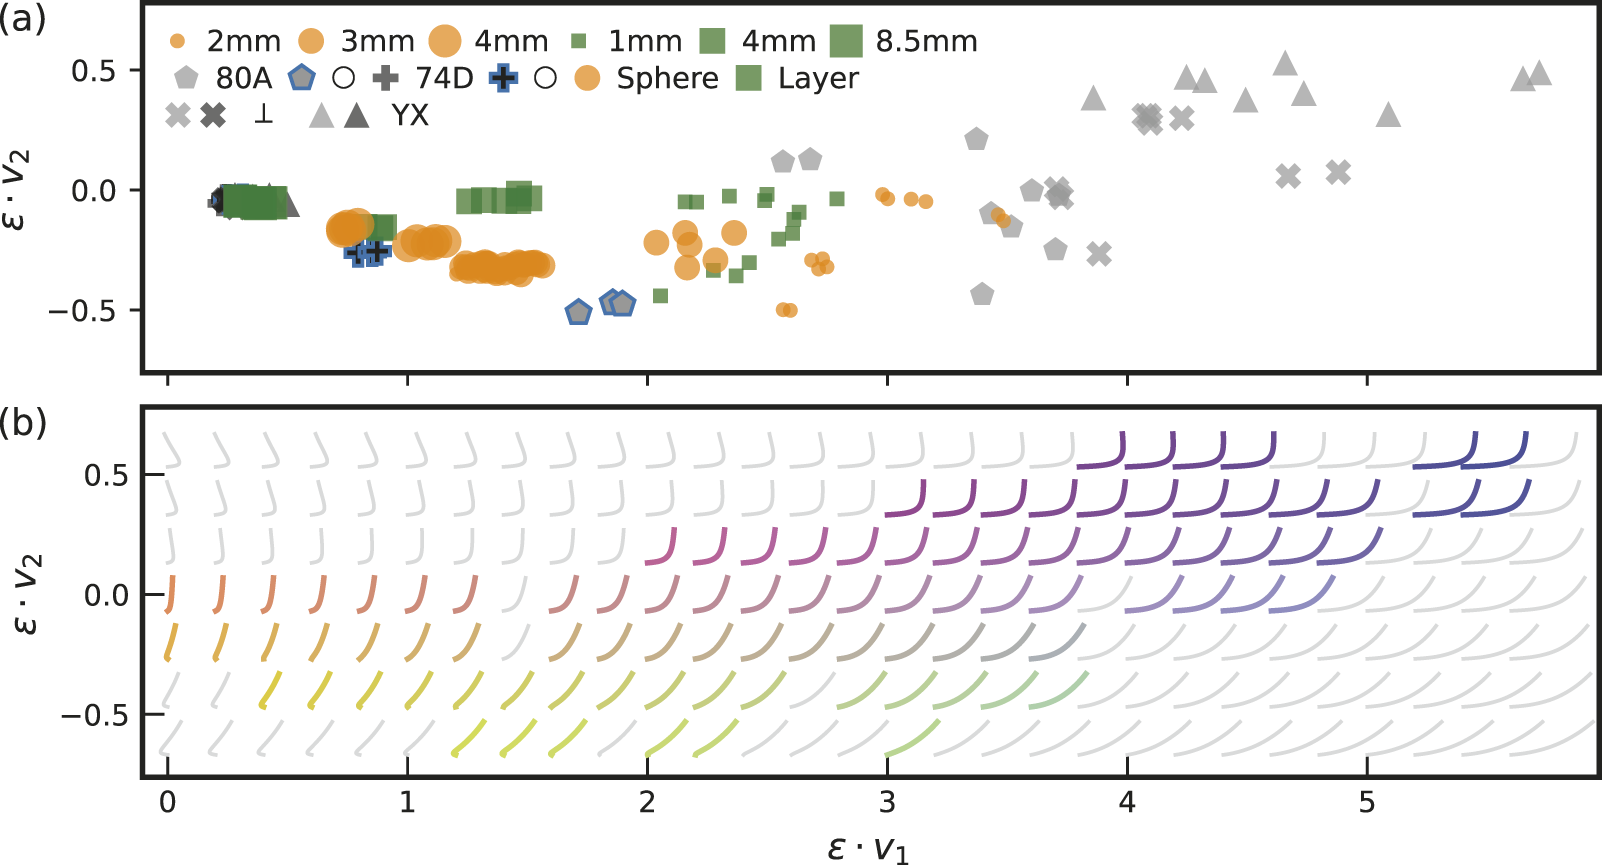
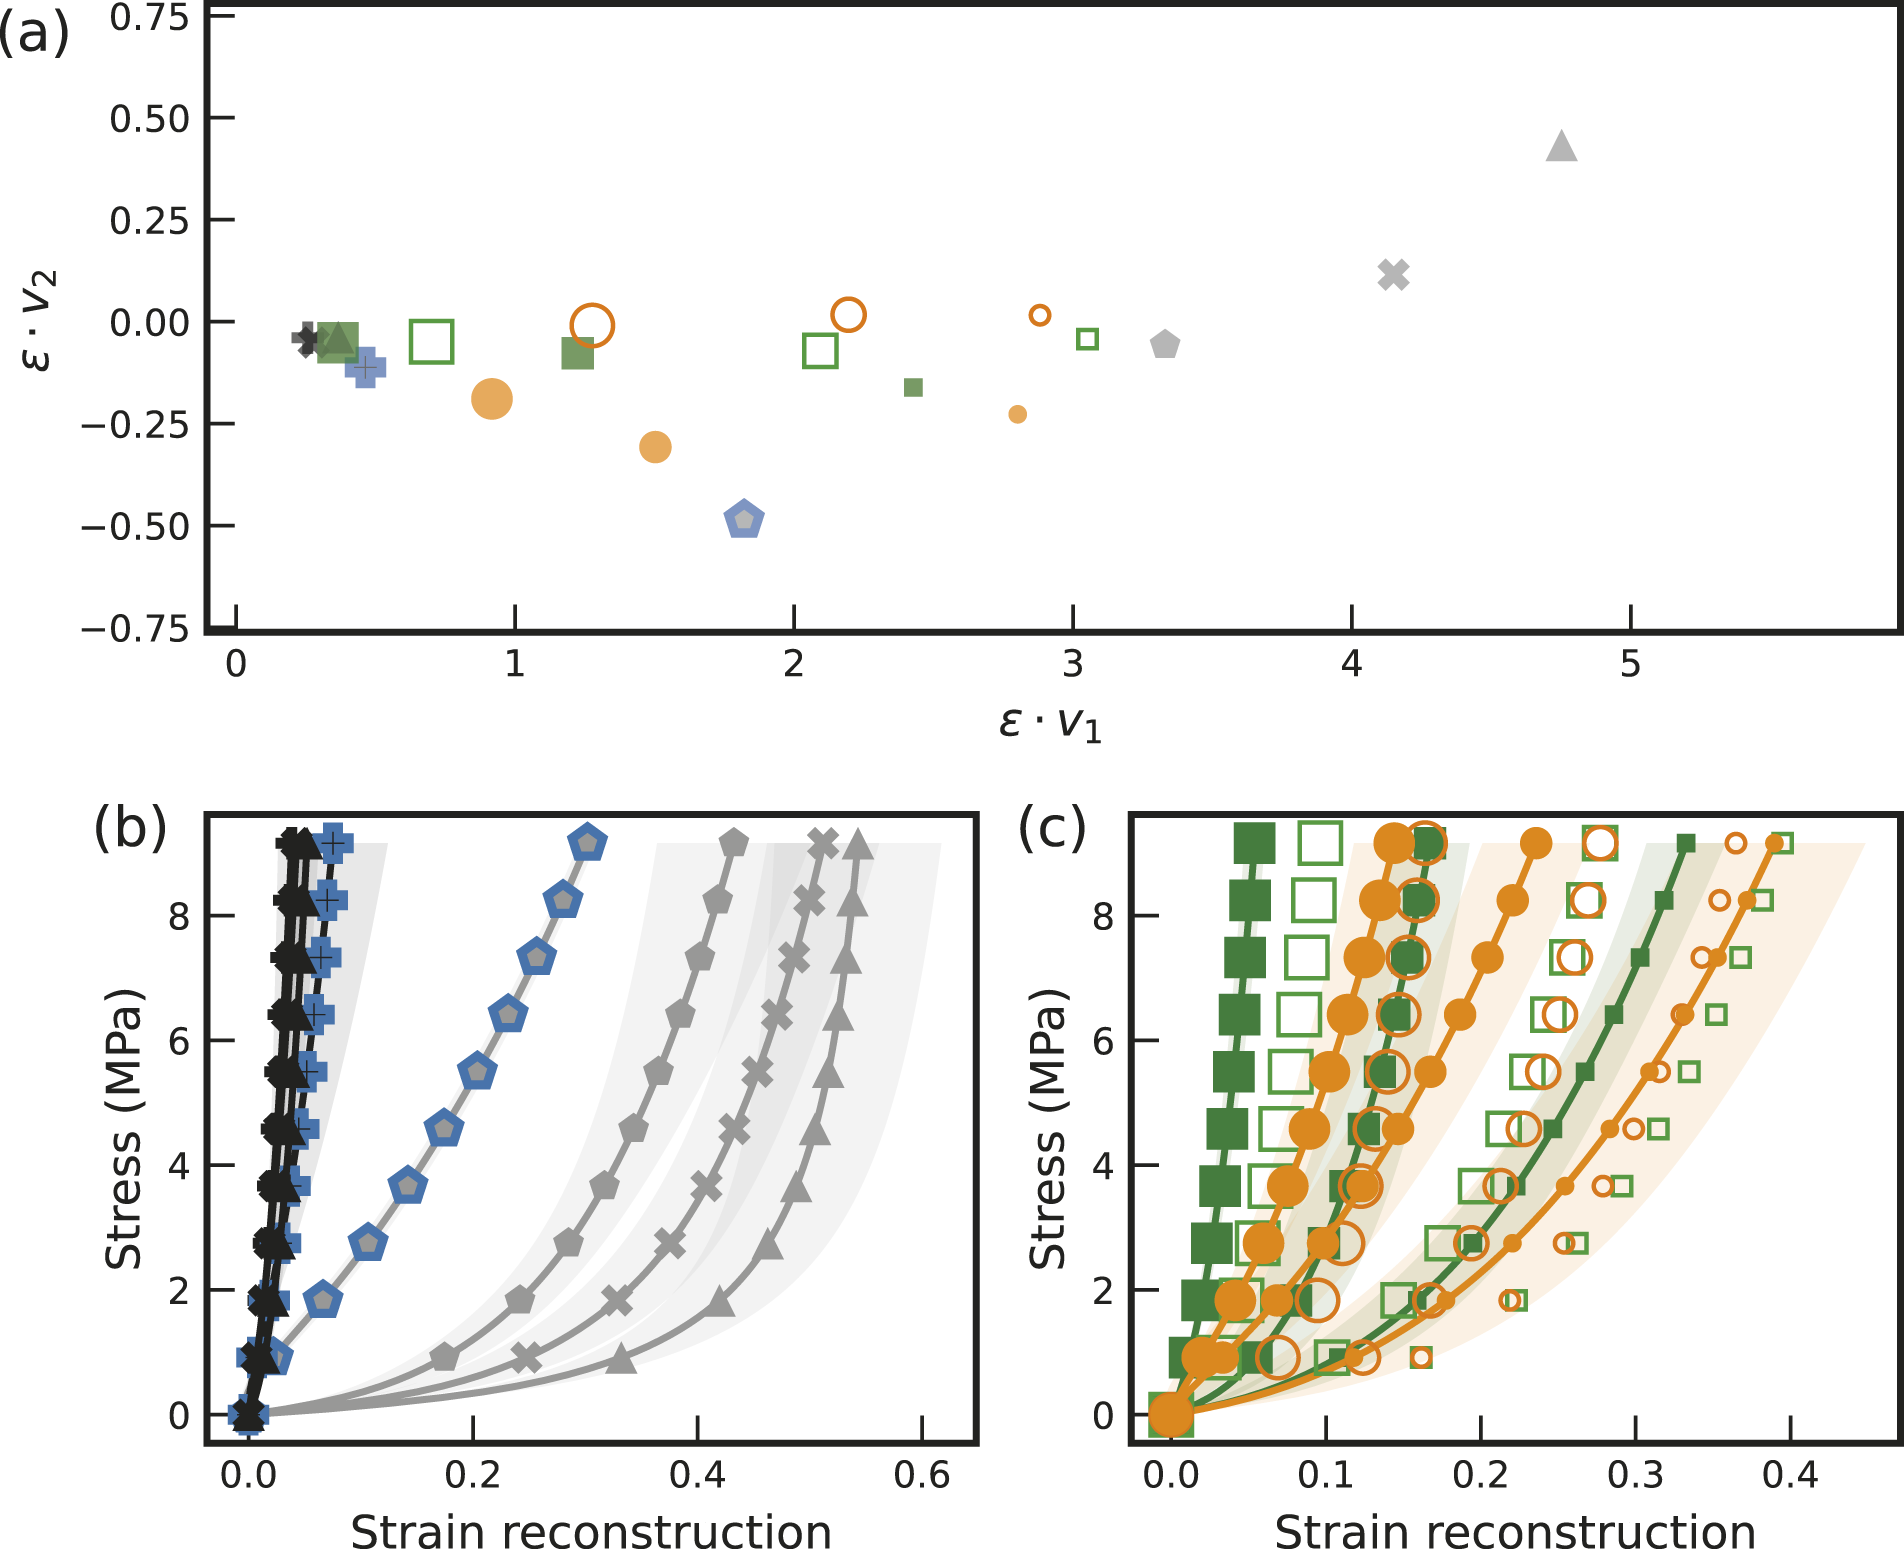
The 2D design space from truncated SVD shows how the reinforcement geometry, volume fraction, and toolpath affect the mechanical response. The embedding of all samples into this space is shown in Figure 7a. We observe that TPU-74D and TPU-80A define opposite ends of the primary vector component, v1. From its shape in Figure 6, we think of v1 as a proxy for strength, as it captures more than 98% of the variance in the data and resembles the shape of each stress–strain curve. There is a cloud of data with different strengths because of different reinforcement geometry and toolpaths.
The second component, v2, explains less than 2% of the overall variance in the stress–strain curves and is associated with greater compliance at low strain; positive v2 accentuates the nonlinearity inherent in low strain from v1, while negative v2 counteracts it and results in less initial compliance (more linear). A good example of the difference between high and low v2 is the addition of perimeters to neat TPU-74D samples, which reduces the v2 component and is shown in Figure 3 to increase the linearity of the compressive behavior without greatly affecting the overall strength.
The experimental data define a shallow arc through the design space. We visualize reconstructions of the stress–strain curves on a grid in SVD space in Figure 7b. Colored curves appear near at least one experimental curve, while gray curves are in the unexplored region. In this visualization, some regions have shapes not permitted by the physics of uniaxial compression, while others are feasible but are not represented in the experimental data. New reinforcement geometries might be able to access these regions.
Due to the large number of samples in Figure 7, we also display each geometry using the centroid of samples in Figure 8a, while reconstructions of their stress–strain curves are shown in Figure 8b and c. In v1, the extremes are defined by neat TPU-74 and TPU-80A; this effect can be observed in the reconstructions, with TPU-74D appearing at far left and TPU-80A appearing at far right. In v2, the extremes are defined by TPU-80A with perimeters and YX build orientation. The difference can be seen in the reconstructions, with perimeters being nearly linear even at low strain and YX showing the greatest compliance at the lowest strain of any geometry.
We also projected the simulated curves from Figure 5 onto the components defined by the experimental data. Simulated curves are open symbols in Figure 8a, and appear along a quasi-1D curve within the design space. Based on the above, variation in v2 is almost entirely due to toolpath variation. Thus, confinement supports the idea that variation in the toolpath is responsible for poor agreement between simulation and experiment in Figure 5. Reviewing the reconstructions in Figure 7b shows that moving in negative v2 reduces compliance at low strain (i.e., more linear), matching the experiments in Figure 5.
Conclusion
In this study, we explored the design space of multimaterial TPU/TPU composites manufactured by FFF and tested under uniaxial compression. We manufactured 74 samples across 18 designs comprising some with no reinforcements, spherical reinforcements, and layer reinforcements and explored the effect of different toolpaths by including perimeter rings, alternating raster patterns, and different build orientations, with other factors held constant. Due to the nonlinear behavior of the TPUs and the variations of geometric and process variables, many stress–strain curves were obtained. Constitutive models for the TPU materials were calibrated using Bayesian optimization, and finite element analysis was performed to predict the behavior of the composites. Finally, we analyzed the experimental data using truncated SVD to elucidate the response space.
Overall, only minor effects on the compressive behavior were observed when testing different variations of neat material samples. The purpose of these tests was to establish a baseline amount of variance expected from changes to sample geometry and toolpath within a dense sample of neat material before introducing the multimaterial composite parts. The one standout case was the perimeter filament rings, which resulted in stiffer, more linear compressive behavior. When considering the response space of multimaterial composites, spherical inclusions provided greater strength compared with layer reinforcements of equal reinforcement fraction. This supports the observation that toolpaths with perimeter rings have a proportionally greater effect on overall compressive strength due to how tension in the perimeter filament affects densification. As a consequence, TPU FFF parts designed for compressive loading could benefit from additional perimeter walls to take advantage of the tensile strength of the filament. It is not clear from our study whether there is an optimal number of such perimeter walls or if the strongest samples would result from infill with concentric shells.
Surprisingly, despite the complexity of the system, 97.8% of the variance in stress–strain curves of our samples was captured by the first component and 99.9% by the first two. The shape of these vectors indicates that while the behavior of samples varies quantitatively, limited modes are controllable with the design variables considered here. In effect, the strength of the composite could be controlled by manipulating reinforcement mass fraction, but the shape of the nonlinear behavior was baked into the constituent materials despite changing the reinforcement geometry. This was true in both the simulations (subject only to geometrical variations) and the experimental results (subject also to significant process variation, including toolpath).
In the future, further tuning may be required to better control the extrusion rate of each material and obtain more insight into geometry-specific behaviors. From our initial results, it seems clear that nozzle diameter, layer height, and other aspects of the design will also play a role in the overall strength of the parts, but introducing these will greatly expand the scope of work and complexity of the resulting analysis. It would also be interesting to explore more complex reinforcement geometries, which will impact the mechanical response both directly through the nominal geometry as well as incidentally through the effect of the toolpath. While simulation was not successful in capturing the quantitative response of the composites, it may assist in identifying geometries to obtain more novel response modes (i.e., through data-driven design).
Authors’ Contributions
S.O.: Methodology, software, formal analysis, investigation, data curation, writing—original draft, writing—review and editing, and visualization. M.M.: Software, investigation, data curation, and writing—original draft. C.Z.: Conceptualization, methodology, investigation, writing—original draft, writing—review and editing, supervision, project administration, and funding acquisition. W.F.R.: Conceptualization, software, formal analysis, visualization, writing—original draft, writing—review and editing, supervision, project administration, and funding acquisition.
Footnotes
Acknowledgment
The authors thank Eric C. Strauch for assistance with the compression testing protocol.
Author Disclosure Statement
The authors declare no conflicts of interest.
Funding Information
This work was supported by a seed grant from the Pennsylvania State University’s Materials Research Institute and Applied Research Laboratory. This material is also based upon work supported by the National Science Foundation under Grant IIS-2123343.
Supplemental Material
Supplemental Material
Supplemental Material
References
Supplementary Material
Please find the following supplemental material available below.
For Open Access articles published under a Creative Commons License, all supplemental material carries the same license as the article it is associated with.
For non-Open Access articles published, all supplemental material carries a non-exclusive license, and permission requests for re-use of supplemental material or any part of supplemental material shall be sent directly to the copyright owner as specified in the copyright notice associated with the article.