
Abstract
Additive manufacturing (AM), commonly known as 3D printing, has played a significant role in the success of Industry 4.0 by enabling rapid prototyping, tooling, and production. AM uses a layer-by-layer building process from CAD models, providing greater design flexibility for creating intricate and customized components. However, there is a prevailing misconception that design complexity comes at no additional cost for AM. This notion is challenged, especially when AM intricate components with complex external surfaces can lead to longer build times and increased costs. This article introduces a method for quantifying design complexity in additively manufactured parts using a mixed-methods approach. This approach leverages qualitative and quantitative data to assess the additive manufacturing complexity index (AMCI) of parts. The AMCI is a metric developed to measure and evaluate the complexity of parts produced using AM processes, considering factors such as geometry, features, AM machine settings, and parameter requirements. The technique aims to assist manufacturers and designers in early-stage part development by quantifying the difficulty of building parts using VAT photopolymerization (VPP) AM technology, enabling informed decision making. The article also discusses the concept of design complexity in AM. In addition, the article presents case studies and data analysis to test the proposed method. The analysis reveals that various factors such as geometry, features, AM machine settings, and parameter requirements can impact the manufacturability of parts in VPP AM processes.
Keywords
Introduction
Due to the rapid advancements of additive manufacturing (AM), a revolution in manufacturing is taking place. AM is a cornerstone technology of Industry 4.0, aligning perfectly with its focus on automation, data exchange, and intelligent manufacturing. 1 This technology enables flexible and agile production by allowing the creation of complex geometries, fostering a high level of customization, and reducing the cost of rapid prototyping.2,3 AM enables the creation of intricate designs, such as lattices and channels, that are impossible with traditional subtractive manufacturing technology. 2 Furthermore, AM minimizes material waste by layering objects, ensuring that only the materials required for each part are used. 4 This technique offers substantial advantages compared with traditional methods, which often generate significant scrap.
However, the widespread adoption of AM technologies needs improvement. AM processes can be slower in large-scale production runs than traditional methods. 3 In addition, AM technologies are currently limited in the materials they can use, which restricts their application in specific scenarios. 5 Quality control in AM can be challenging due to layer adhesion and porosity. 6 Moreover, implementing AM technologies in some cases necessitates significant investments in equipment and training, which can be challenging for some companies.
The AM process begins with a computer-aided design (CAD) file, typically generated using CAD software. This file is then segmented into multiple layers through a slicing process. Each layer is solidified and fused separately using AM machines, 7 resulting in sequential layer-by-layer construction. Material selection, such as filament or resin, varies depending on the AM technology. Stereolithography, for instance, uses a ultraviolet-cured liquid resin to fabricate layers. 8 Fused filament fabrication, or fused deposition modeling (FDM), involves a heated nozzle extruding thermoplastic filament onto a build platform. 9 In addition, powder bed fusion (PBF) is another prevalent AM method where metal or plastic powder is evenly distributed on the build platform and fused using a high-energy source such as a laser or electron beam.10,11
Despite the pivotal role of design complexity in AM, it remains inadequately explained, mainly because the existing literature prevailingly believes that complexity bears no additional cost in AM.12,13 However, contrasting perspectives in the literature highlight the need for more empirical studies exploring the implications of design complexity in AM. 14 It becomes apparent that AM’s complexity is not entirely cost-free, particularly when considering components with intricate external surfaces. As observed in the case of FDM, this results in longer build times and increased costs. 15
However, existing research recognizes the pivotal role of design complexity in AM cost reduction, as demonstrated by Martof et al., 16 who used slicing and 2D geometry to evaluate complexity and determine optimal low-cost methods for casting additively manufactured molds. Nevertheless, a quantitative evaluation of design complexity in AM has yet to be fully explored to ensure manufacturability, quality, and cost-effectiveness.
This article addresses issues related to design complexity in VAT photopolymerization (VPP) AM. It introduces a method to quantify this complexity using a mixed-method approach that combines qualitative and quantitative analysis. The strategy involves a weightage criteria approach (WCA) and statistical analysis to create a tool that can help manufacturers and designers rapidly assess the difficulty of VPP AM. Furthermore, the study offers an overview of design complexity in AM, validates the WCA assessment model through case studies, and examines the cost and time implications of the model within the context of the VPP AM process.
Design Complexity in AM
The concept of design complexity in manufacturing refers to the intricacies inherent in the physical design and structure of a specific product or component. Traditional manufacturing methods have historically faced limitations in fabricating intricate design shapes and geometries. 17 In contrast, AM has undergone a transformative evolution in manufacturing systems by enabling the production of intricate geometries. 18 This shift has sparked interest in establishing AM as a qualified product manufacturing technology, driven by its capacity to craft complex, customizable parts efficiently within a single manufacturing process machine. In contrast, traditional manufacturing often involves multiple stages and setups, potentially increasing cost and production time.
Several studies have systematically measured and quantified the design complexity in AM processes. The metrics proposed in the literature are based on various geometric factors, including volume, surface area, polygon count, cavity count, perimeter, bounding box, etc.19–21 These geometric factors are extracted and analyzed from CAD files using various methods to determine the quantity and characteristics of geometrical features. 22 Features such as holes, fillets, chamfers, pockets, and slots can be automatically identified and extracted by algorithms that analyze geometric and topological information in feature recognition methods. With the attribute adjacency graph method, features are classified based on their attributes, and with the partial entity structure method, models are represented as partial topological entities. 23 Also, the generic face adjacency graph method can reveal common design structures in assembly models, and in some cases, manual inspection is required. 24 The complexity of the CAD file and the software tools can influence whether these methods are used separately or in combination. 25 In AM processes based on extrusion, higher geometric complexity is associated with longer build times and costs, especially for mass production applications.19,26 Extrusion-based AM also suffers from a stairstepping effect when dealing with complex free-form surfaces.
VPP AM, on the other hand, presents unique challenges and characteristics in design complexity management. Research on VAT photopolymerization has identified unique issues like build orientation and surface quality.27–29 According to Ben Amor et al., 30 optimizing build orientation is a critical strategy for balancing surface quality with build time trade-offs caused by geometric complexity. Specific build orientations may be necessary for successfully printing complex geometries in VPP AM, impacting support structures, print quality, and overall success.31–33 Apart from surface finish and printing time, build orientation influences structural stability and overall print success, as indicated by these studies.
Extensive research has been conducted on other AM technologies, but empirical studies to quantify the complexity of VPP AM still need to be addressed. AM findings from other process families would need to be generalized and adapted to fill this gap. Nevertheless, some studies have begun to address related aspects of complexity in VPP. For instance, D’Andrea et al. 34 discussed the impact of geometric complexity on printed parts’ mechanical properties. Also, Valizadeh et al. 35 explored the optimization of process parameters to improve print quality for complex geometries.
In numerous other research works, quantitative complexity metrics and manufacturability analysis are combined in AM-specific process selection, design, and quality assurance frameworks. These studies aim to optimize the consolidation of AM parts, select the most suitable processes, and monitor the level of print quality for complex geometries.36–38
However, further investigation is needed on the correlation between AM process parameters, materials, quality factors, and geometry-based complexity metrics calculated from CAD models. 39 A trade-off evaluation is required to determine the optimal complexity of additively manufactured parts, balancing the enhanced geometry enabled by AM with their manufacturability. These trade-off studies not only enhance product designs but can also enhance performance. 40
Ultimately, “complexity for free” does not apply to all AM processes. We discussed previously how, in extrusion-based AM specifically, increased geometric complexity negatively impacts cost, timeliness, quality, and manufacturability. The investigation of manufacturability analysis based on geometric or design complexity has yet to be explored in detail for VPP AM. However, it is essential to implement optimized complexity management across all AM technologies so that AM can combine its design flexibility with process-specific optimization needs.41,42 This paper provides a framework for quantifying the VPP AM complexity index. Correlating design complexity factors to process parameters and materials can be a powerful tool for decision-making in AM.
Following this understanding of design complexity in AM, we now turn to the methodology used in this study to assess and quantify the complexity of the VPP AM process.
Methodology
Several methodologies have been proposed to evaluate design complexity for AM. Valentan et al. 43 introduced an approach that utilizes STL data, precisely the number of triangles and part volume, to assess geometric complexity. Their method explores the intricate mathematical characteristics derived from fundamental STL data. Another was presented by Martof et al. 16 that uses a complexity evaluation tool that assesses CAD models based on slicing and 2D geometry evaluations. This evaluation helps determine the most cost-effective casting option among various alternatives, such as traditional manufacturing, AM-enabled sand casting, and hybrid approaches. Moreover, computational methods have been used to analyze convexity-based attributes related to shape complexity and to correlate them with the energy consumption of layer-wise processes in electron beam melting systems. 44
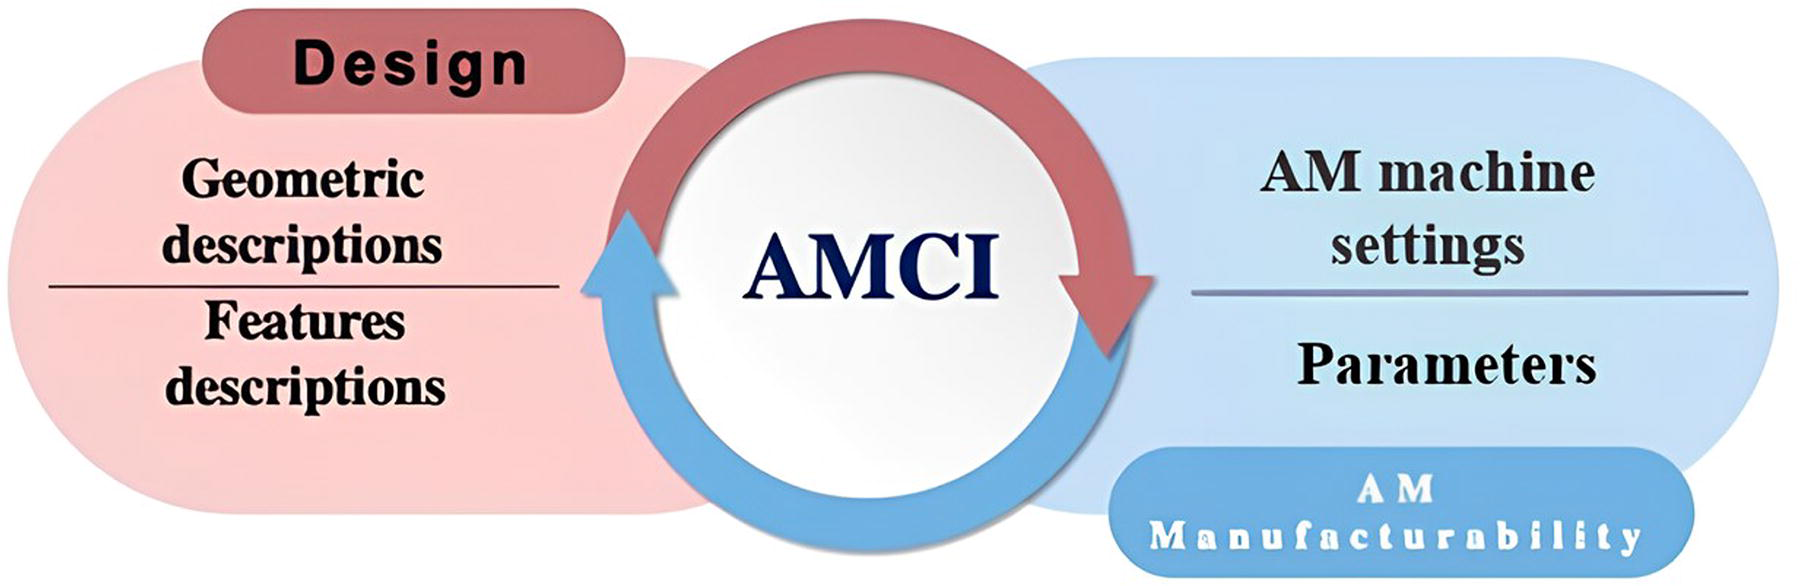
This study uses a comprehensive mixed-methods approach to develop and validate the additive manufacturing complexity index (AMCI). The methodology encompasses several key components, each contributing to a holistic assessment of part complexity in VPP AM processes. Figure 1 provides a visual representation of the AMCI concept, illustrating the intricate relationship between design complexity and additive manufacturing processes.
Additive manufacturing complexity index (AMCI).
The mixed-methods approach used in the present study consists of a developed hierarchy for assessing the AMCI using the WCA method, inspired by prior works such as Conner et al., 45 and Maheta and Sata, 46 along with case studies and data analysis. This approach will compute the complexity index of parts intended for VPP AM and analyze the build time and cost implications.
A mixed-methods approach was selected to leverage qualitative and quantitative data to assess parts’ AMCI. Through a hierarchical AMCI structure, the manufacturability of a part can be evaluated systematically. Case studies will provide real-world samples and insights into implementing the AMCI methodology. Lastly, the data analysis of the case study results will analyze build time and cost effects. A more comprehensive method was developed by combining qualitative and quantitative data.
The key steps involved in the methodology are:
Development of hierarchical AMCI structure with complexities, criteria, attributes, and ranges for assessing complexity index. Assessing the complexity of sample parts using the AMCI model. Analyze AMCI records, generate datasets, and identify correlations with build time and cost using statistical analysis. Synthesizes the findings from AMCI assessments, case studies insights, and data analysis to evaluate the efficiency of the developed AMCI.
The AMCI hierarchy provides a method for evaluating part complexity. In contrast, the case studies provide insight and context into real-life situations. An analysis of the data quantitatively validates the utility of the AMCI method in predicting build time and cost implications.
As an AM process, VPP is the focus of this study. It was chosen because it produces high-resolution components with smooth surface finishes, making it ideal for analyzing the impact of complex geometries and delicate features on AM. VPP also introduces unique considerations regarding support structures and resin flow due to its liquid resin material and layer-by-layer curing process. By examining VPP AM processes, we aim to discover nuanced relationships between design attributes and manufacturing outcomes that are less prevalent in other AM families. The following subsections detail each component of our methodology, beginning with developing the AMCI structure.
AM complexity index structure
A comprehensive hierarchical structure comprising five levels has been developed to facilitate the evaluation of the AMCI. This structure forms a framework for evaluating the manufacturability of parts using VPP AM processes. At the top level of this hierarchy is the AMCI, which encompasses two complexity aspects: design complexity and manufacturability complexity. The subsequent level further subdivides these aspects, with design complexity comprising geometry and feature description criteria. In contrast, manufacturability complexity involves AM machine settings and process parameters criteria—the fourth and fifth levels house attributes and attribute range data, respectively. Figure 2 provides an illustrative representation of the hierarchy within the AMCI structure.
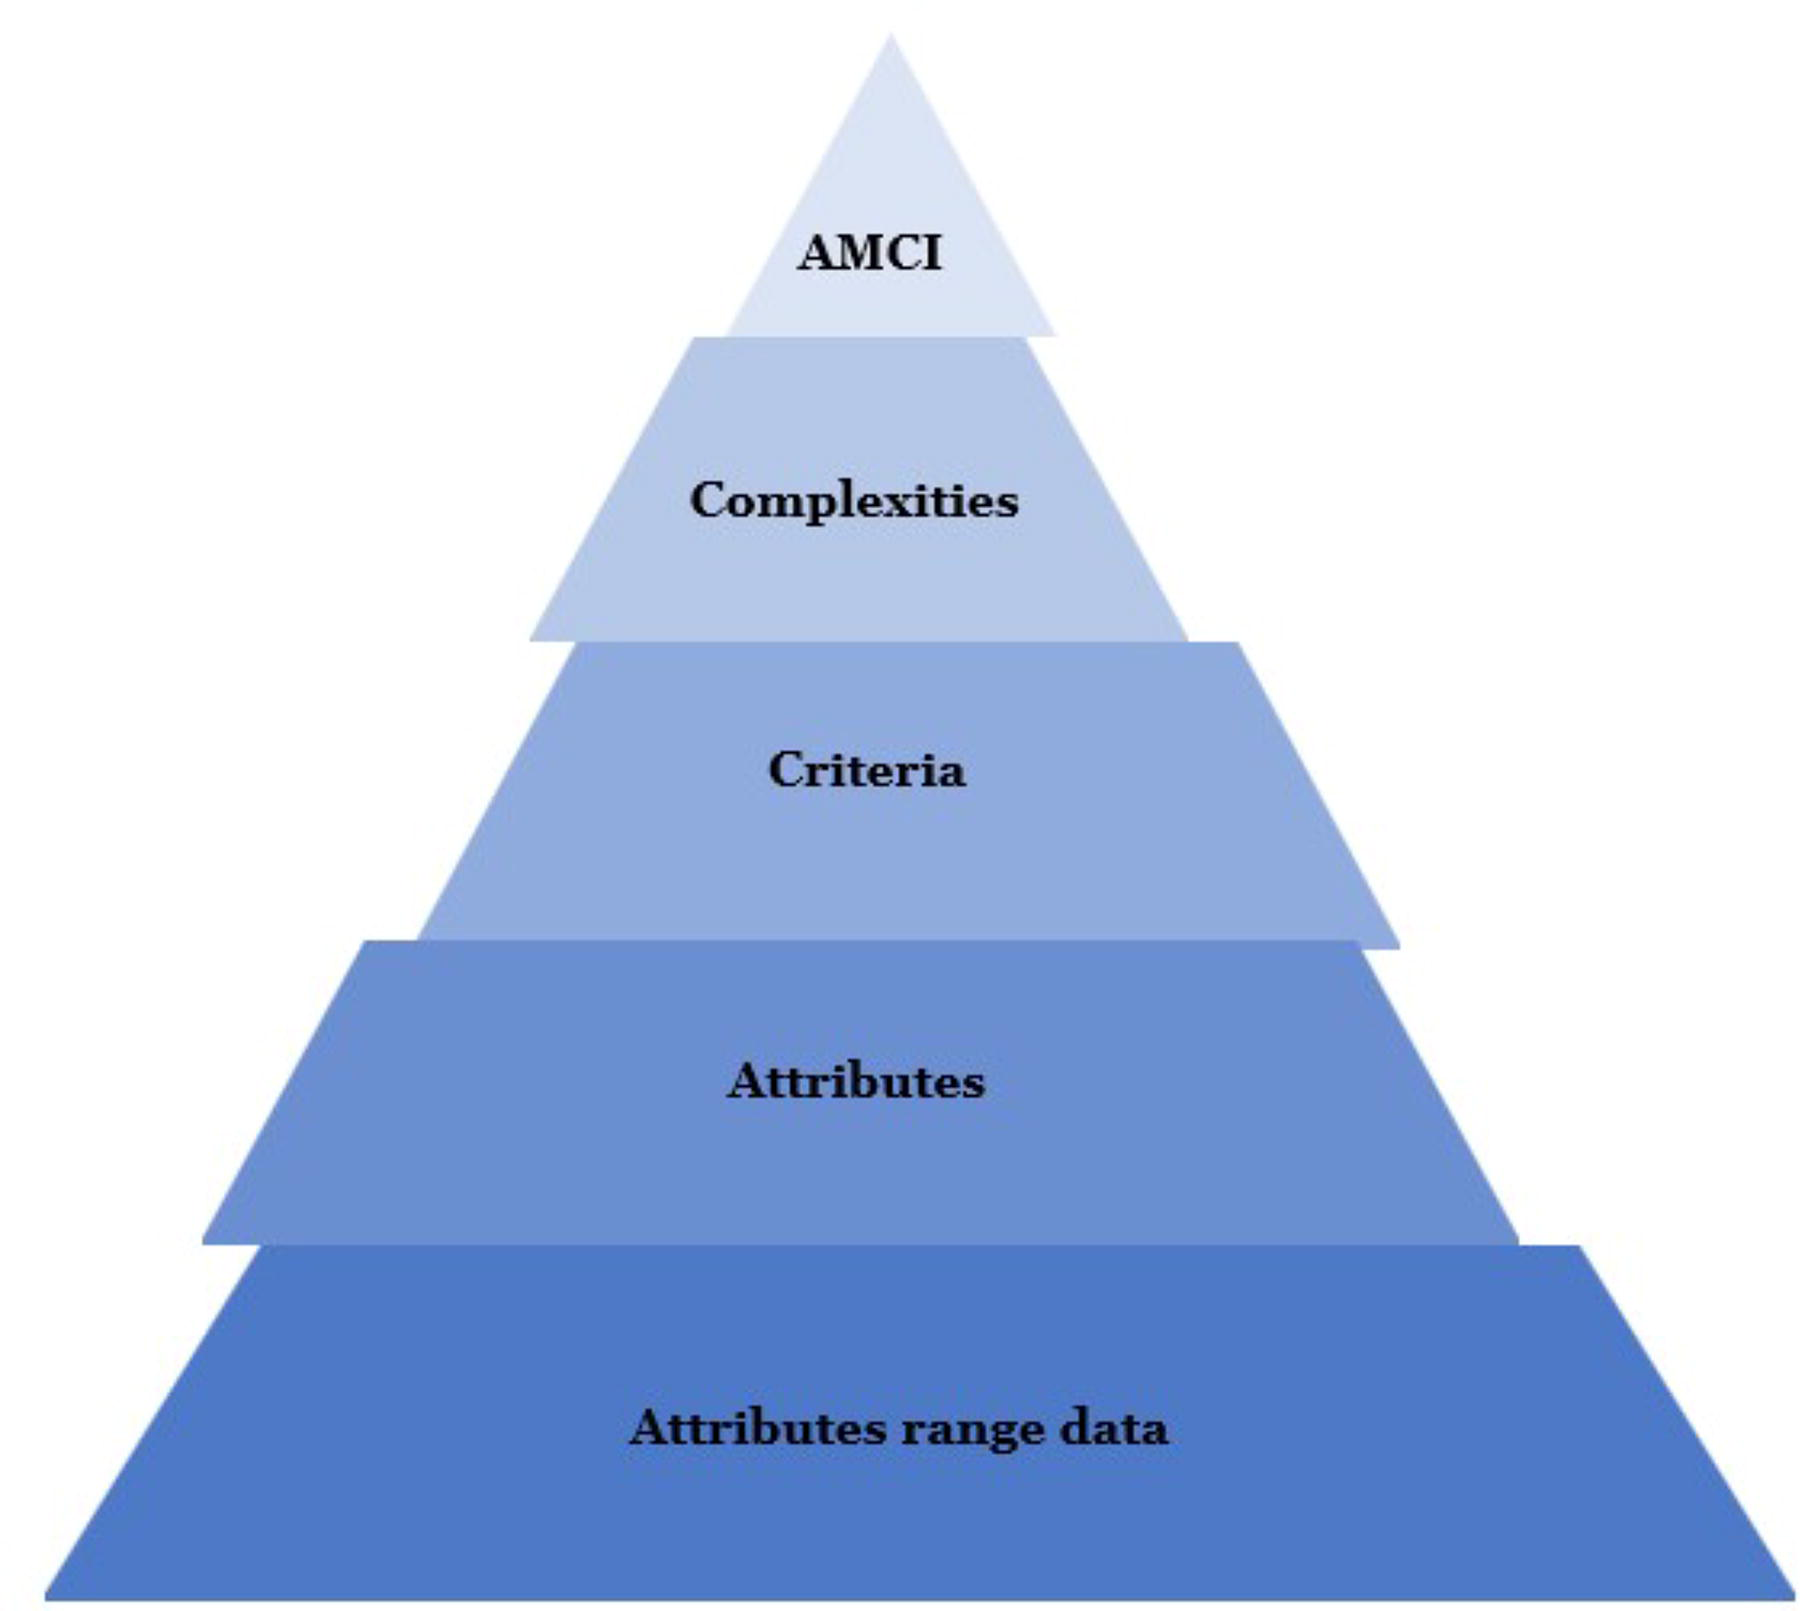
Hierarchy of the additive manufacturing complexity index (AMCI).
Geometry descriptions involve attributes such as length, height, width, thickness, and surface characteristics, which can vary between flat, curved, or stunted. Figure 3 highlights feature descriptions, AM machine settings, and AM manufacturability parameters.
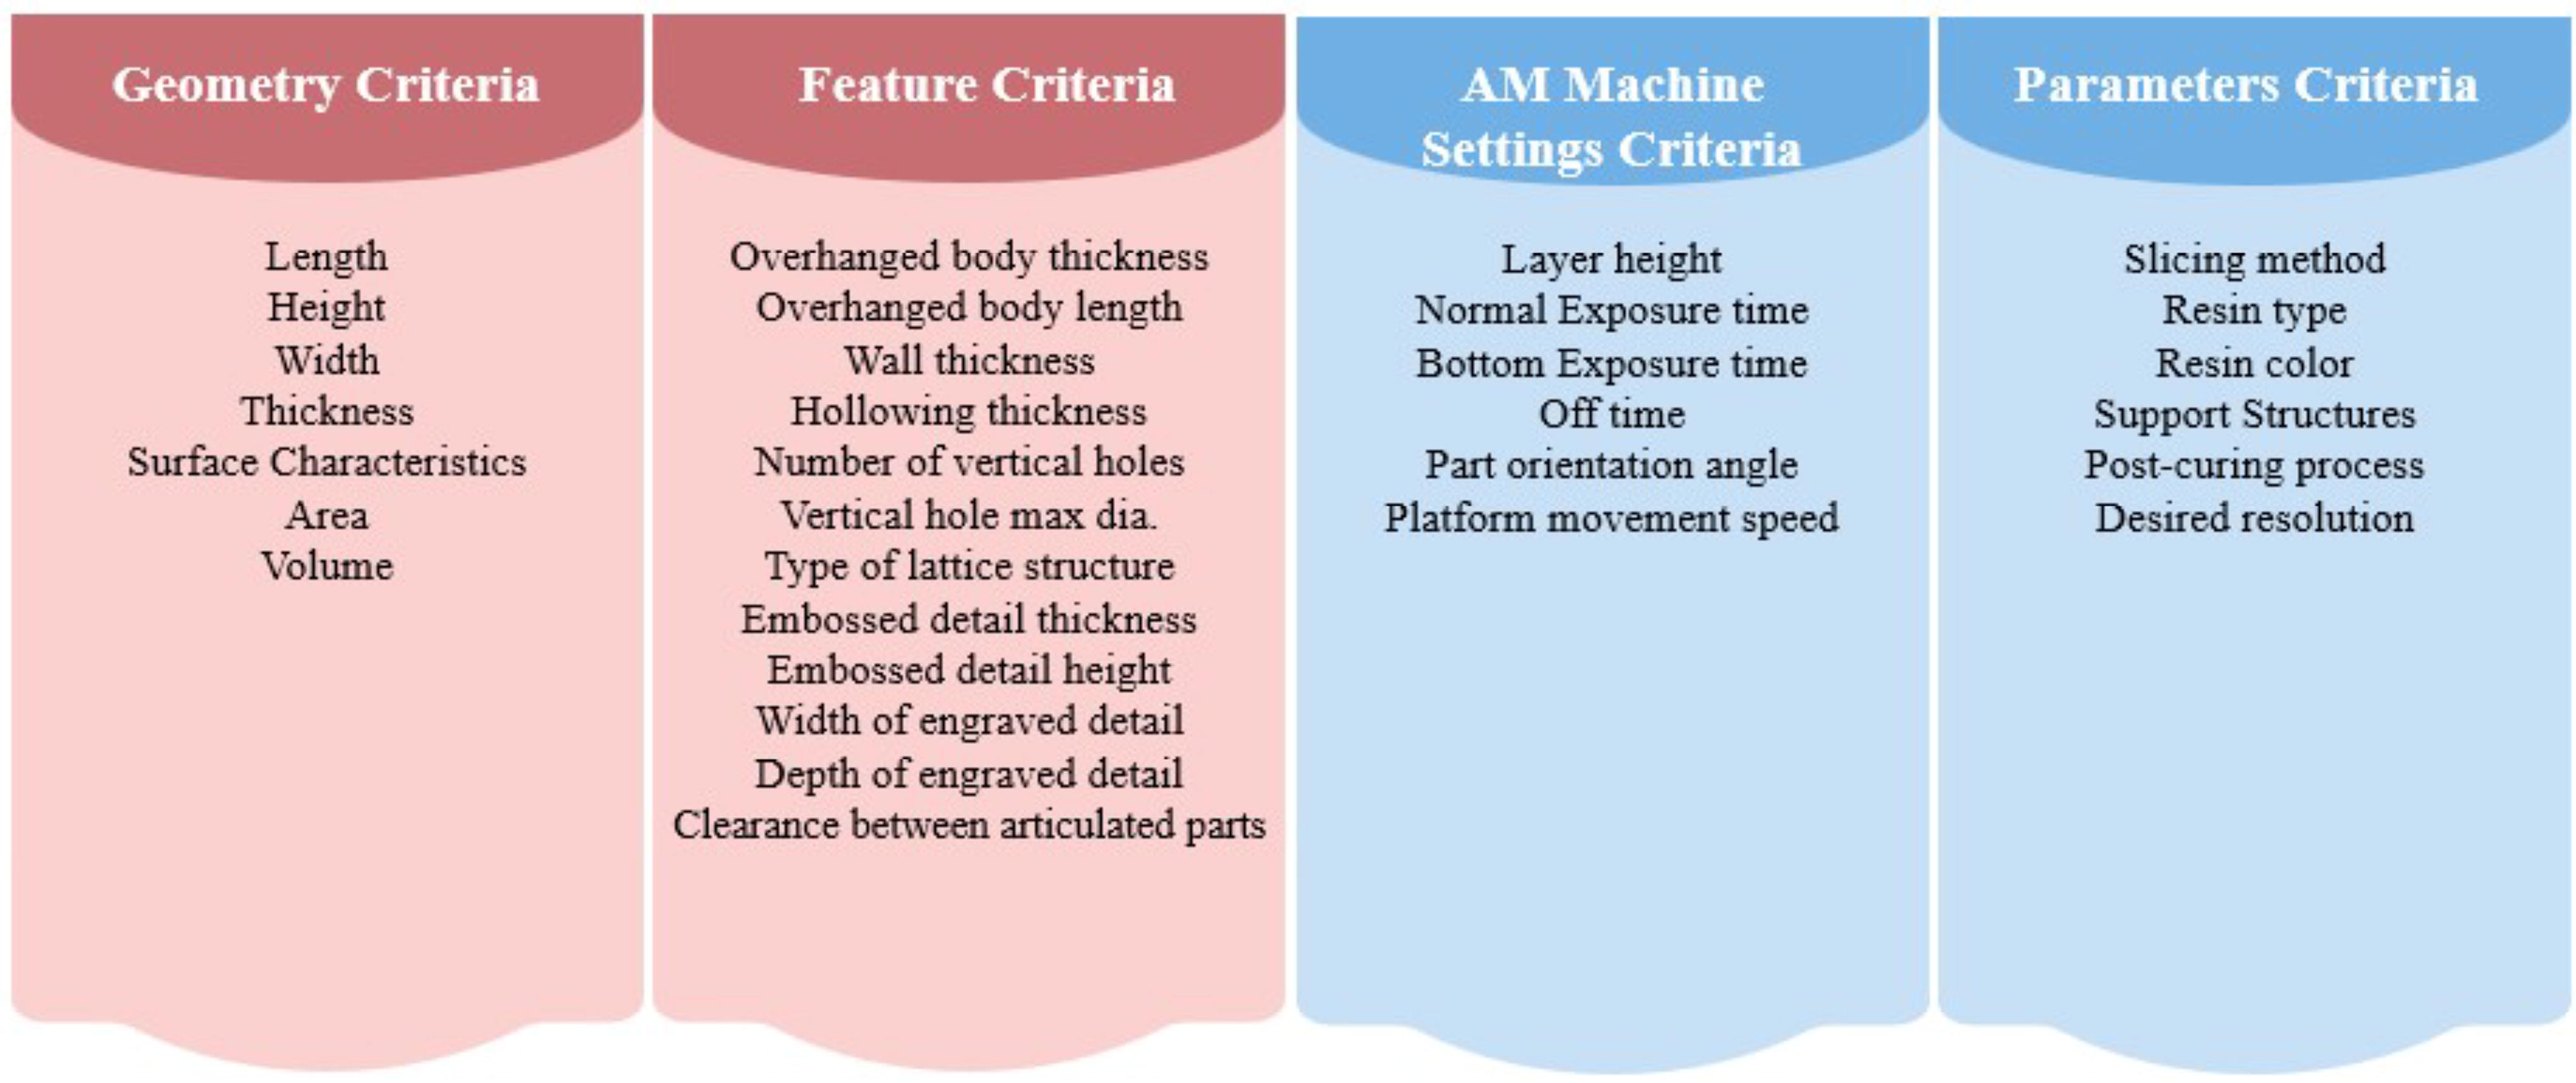
AMCI structure criteria and their attributes.
To develop the AMCI structure, a literature review, expert consultation, and empirical testing were performed. All levels of the hierarchy were carefully considered to ensure comprehensive coverage of factors affecting VP manufacturing. Theoretical and practical manufacturing constraints were considered when determining attribute ranges and weightages.
For example, thickness is crucial to geometry description criteria. The thickness attribute ranges are as follows:
0.0001–0.2499 mm (Hard): Thin features challenge VPP system resolution limits and threaten structural integrity. 0.25–0.4999 mm (Medium): The features may be printable but have limited strength and require careful handling. 0.5–0.9999 mm (Simple): The ideal thickness range in VPP applications, balancing strength and detail. 1–4.9999 mm (Medium): Thicker features require more resin and a longer curing time but are usually straightforward to print. 5–10 mm (Hard): Thicker features can result in increased resin consumption and curing challenges due to the limited penetration of light.
As part of the AMCI structure, the same considerations were applied to all attributes (refer to the Appendix 1 for detailed attribute data tables for the rest of the attributes). A balanced importance of each criterion (geometry, features, AM machine settings, and parameters) was initially assigned a weightage (25). The weightage is then distributed among each attribute within each criterion according to their relative impact on manufacturability. Figure 4 gives information about the distribution of ranges within the AMCI hierarchy.
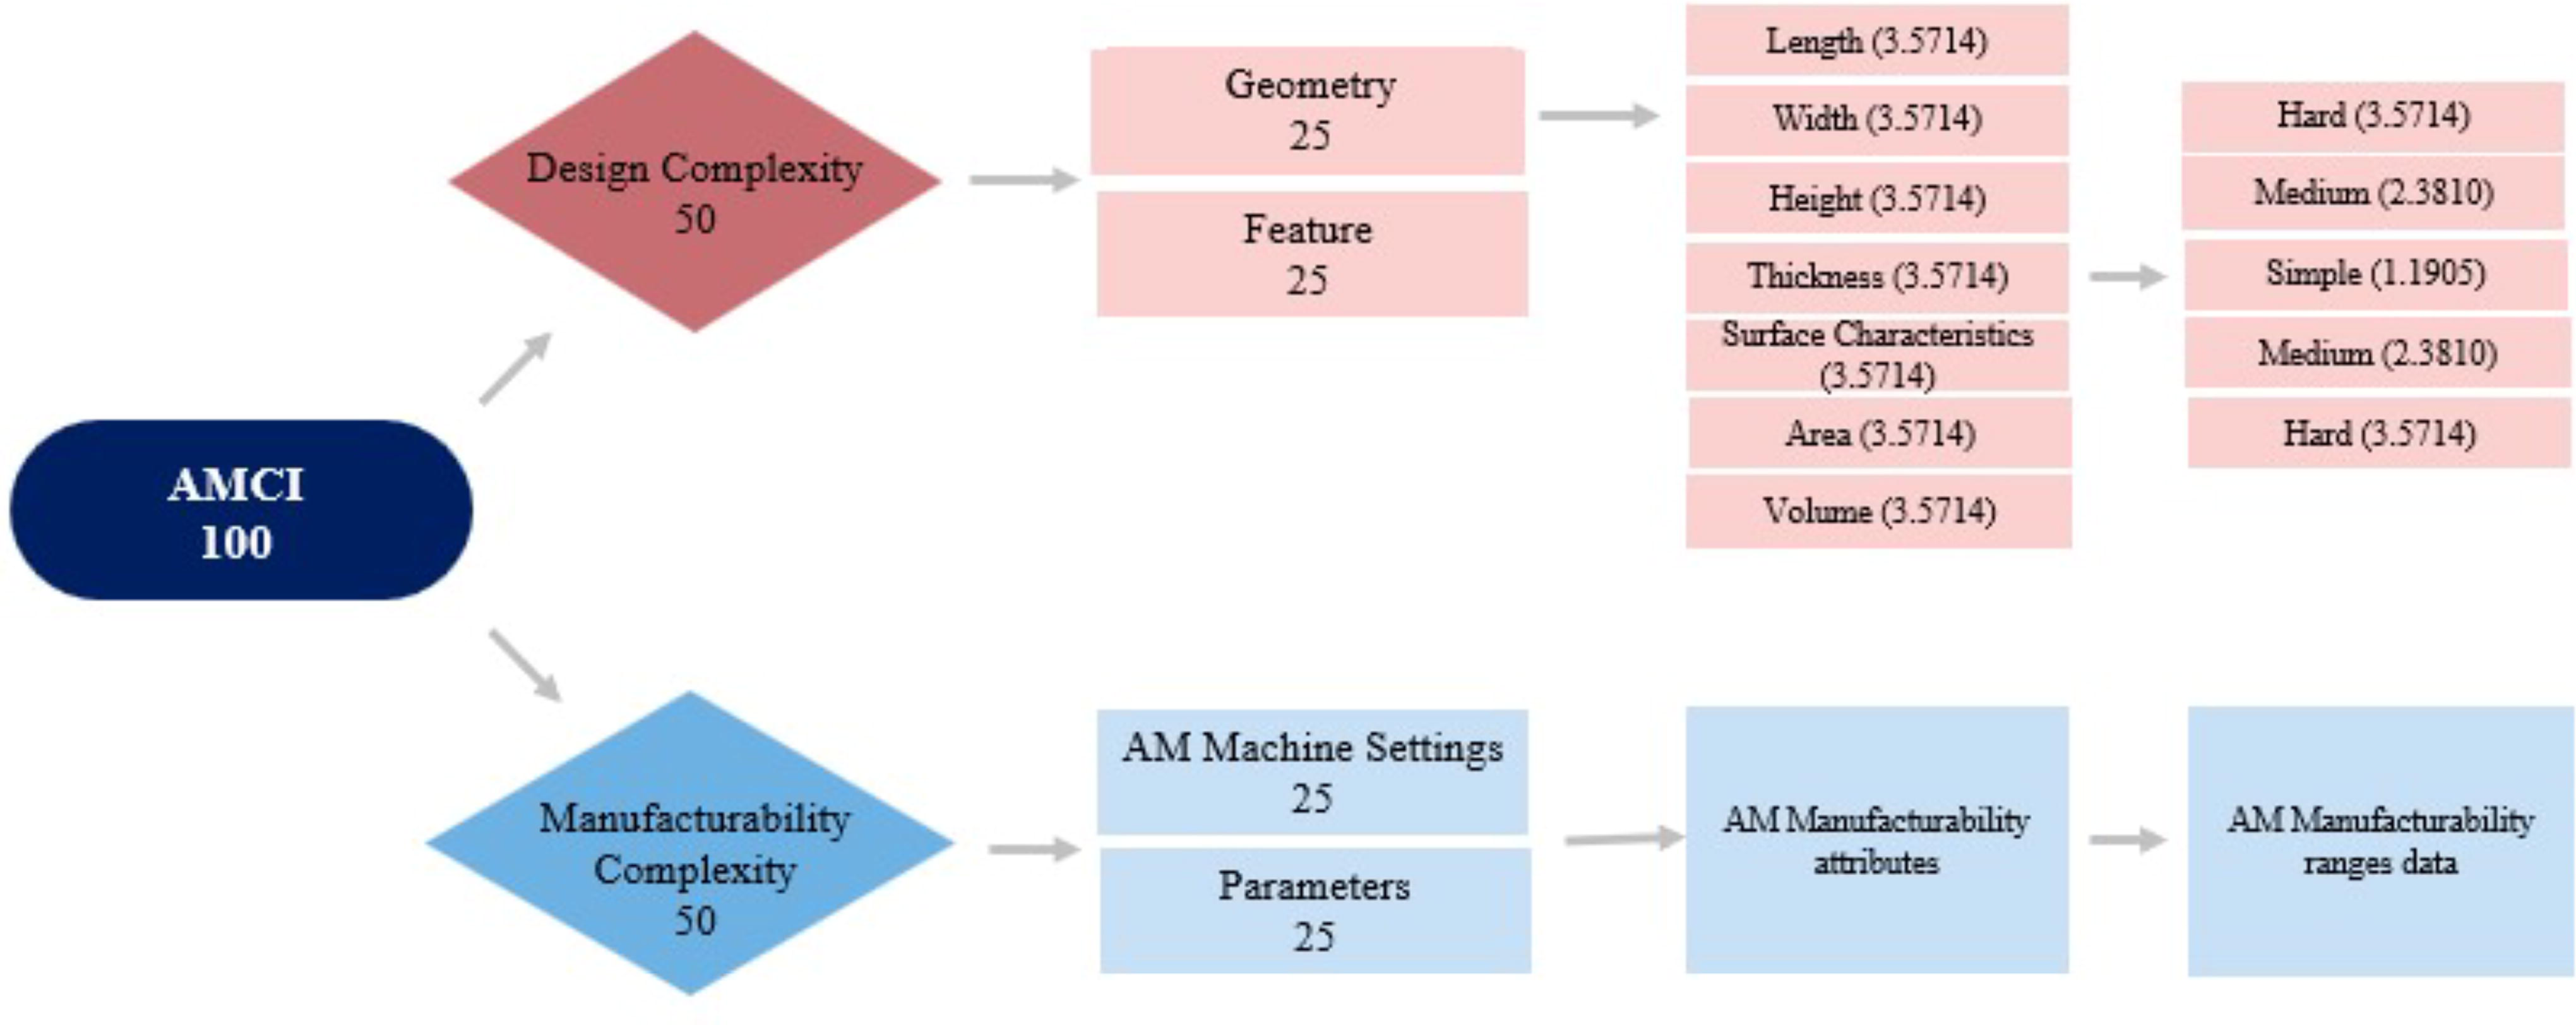
Distribution of weightage within AMCI hierarchy.
This approach ensures the AMCI structure considers both theoretical aspects and real-world VPP manufacturing limitations, providing a robust framework for evaluating part manufacturability.
The AMCI can be mathematically represented as follows:
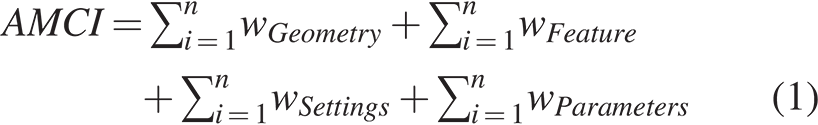
For each of the criteria (geometry, feature, AM machine settings, and parameters), the weightage (w) is calculated using the following expression:

Here, “weightage” (w) refers to the numerical representation of the criteria mentioned earlier, whereas “n” represents the number of attributes within each criterion. The weightage is distributed among the respective attributes within each criterion based on their relative impact on manufacturability. Table 1 provides an overview of the range values used for each criterion in the AMCI.
Additive Manufacturing Complexity Index Attributes Ranges
It is important to note that these values are specific to VPP. Different AM processes may have different thresholds based on their unique mechanisms, materials, and parameters. For instance, because of differences in layer adhesion methods and material properties, PBF or material jetting tolerances and optimal thickness values could differ significantly from those of VPPs. With the AMCI structure established, we now turn to its practical application through case studies.
Case studies
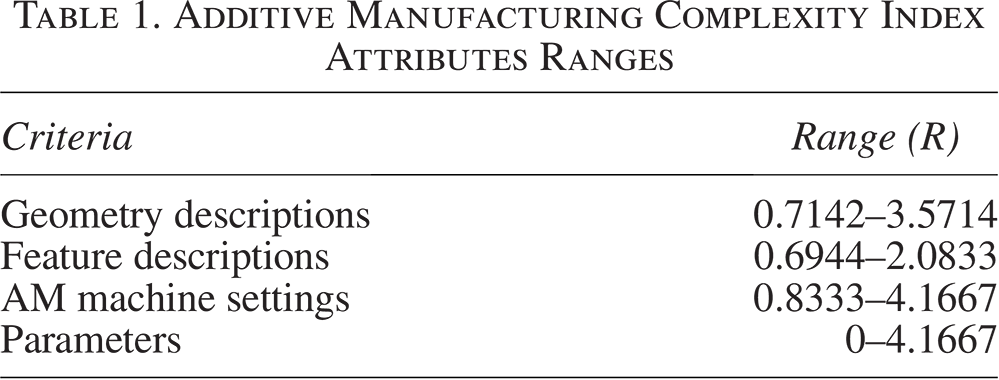
To validate and demonstrate the utility of the proposed AMCI, we applied it to a diverse set of components, each presenting unique geometric and feature characteristics. Twenty-one components (Fig. 5) available for free download on the Grabcad website were selected. The assessment focuses on geometric and feature descriptions, with original manufacture equipment information being overlooked. The AMCI framework incorporates a standardized strategy for part orientation selection. This strategy prioritizes factors such as minimizing support structures, balancing surface roughness, and optimizing layer area to account for variability caused by orientation and other process parameters. In addition, when calculating AMCI, relevant machine settings will be considered to ensure consistent and comparable results across different printing scenarios. The printing settings and parameters set for building the components are considered the best scenario that provides the best quality for AM using an (Anycubic mono × 6k) 3D printer machine. These settings and parameters are also guided based on guidelines for building 3D objects available in design for additive manufacturing (DFAM). 47 For example, DFAM guidelines recommend keeping overhang or bridge thickness below 1 mm when designing a component with an overhang feature, as values below that threshold are deemed challenging to manufacture. The computation of weightage criteria accounts for the manufacturing difficulty level, with higher difficulty levels corresponding to higher range values.
Twenty-one selected parts for the case study.
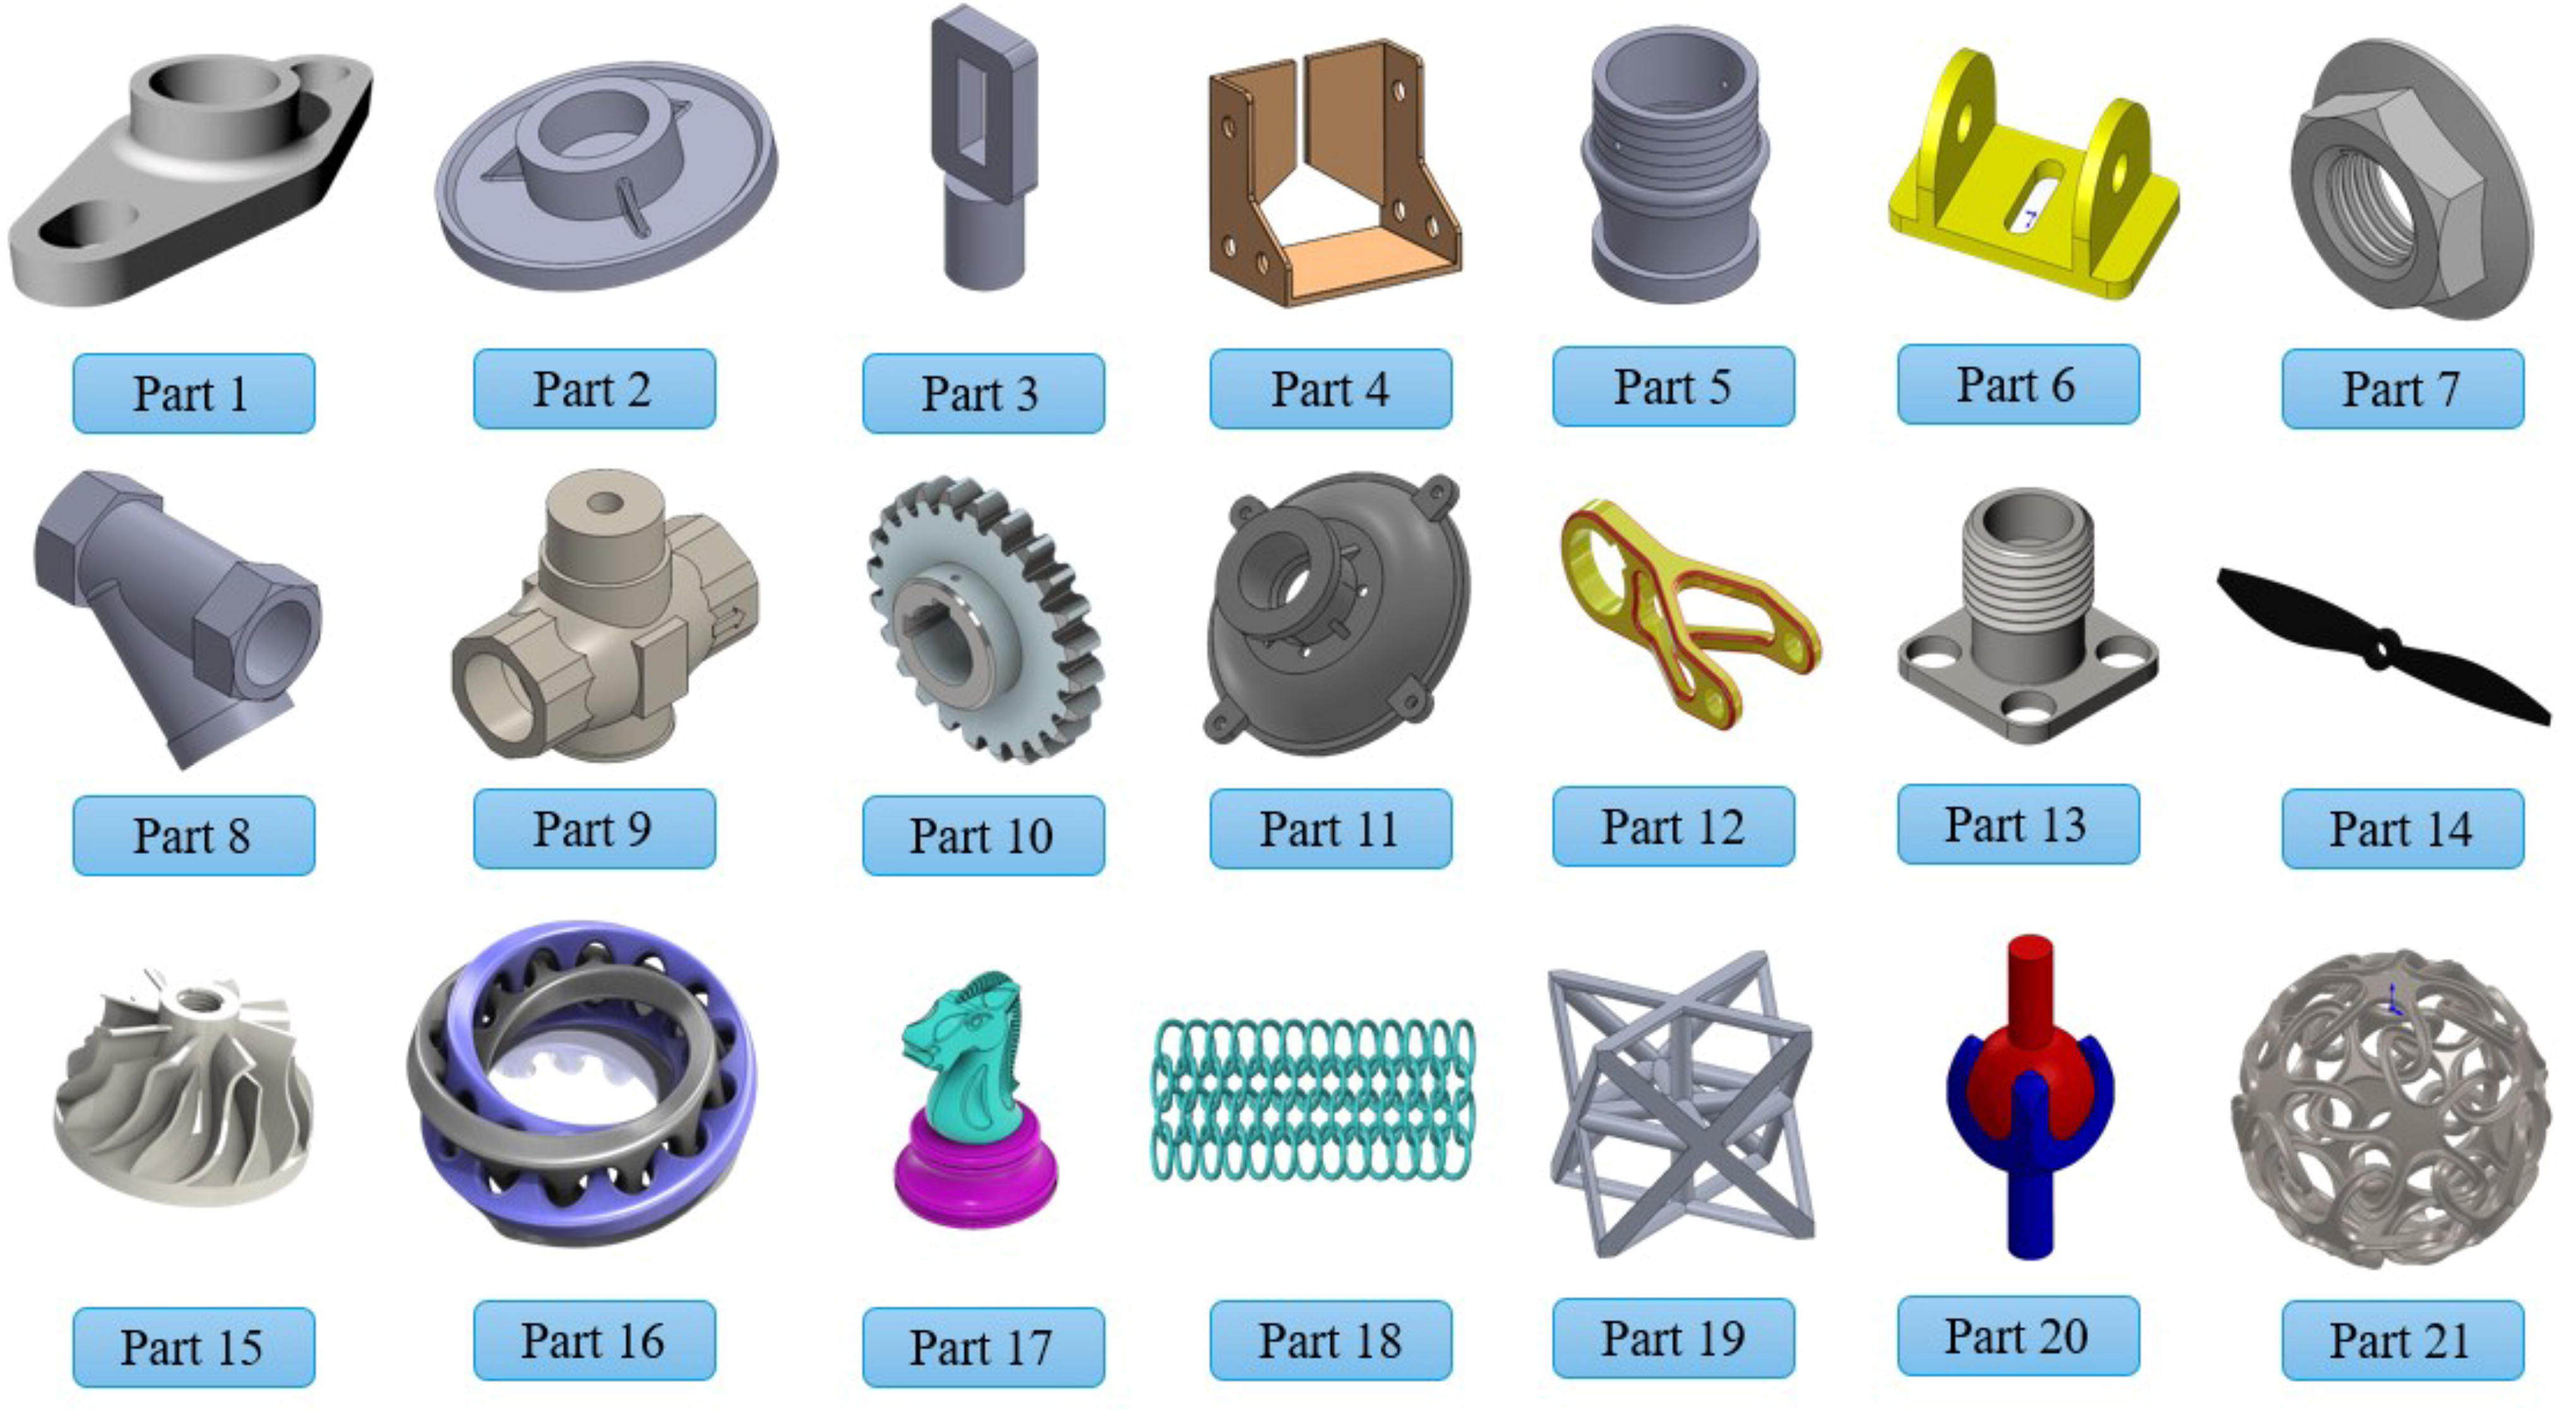
A graphical user interface application has been developed using Python to streamline the AMCI calculation for parts. This application simplifies the process by allowing the importation of Stereolithography (STL) files and their basic information for complexity assessment.
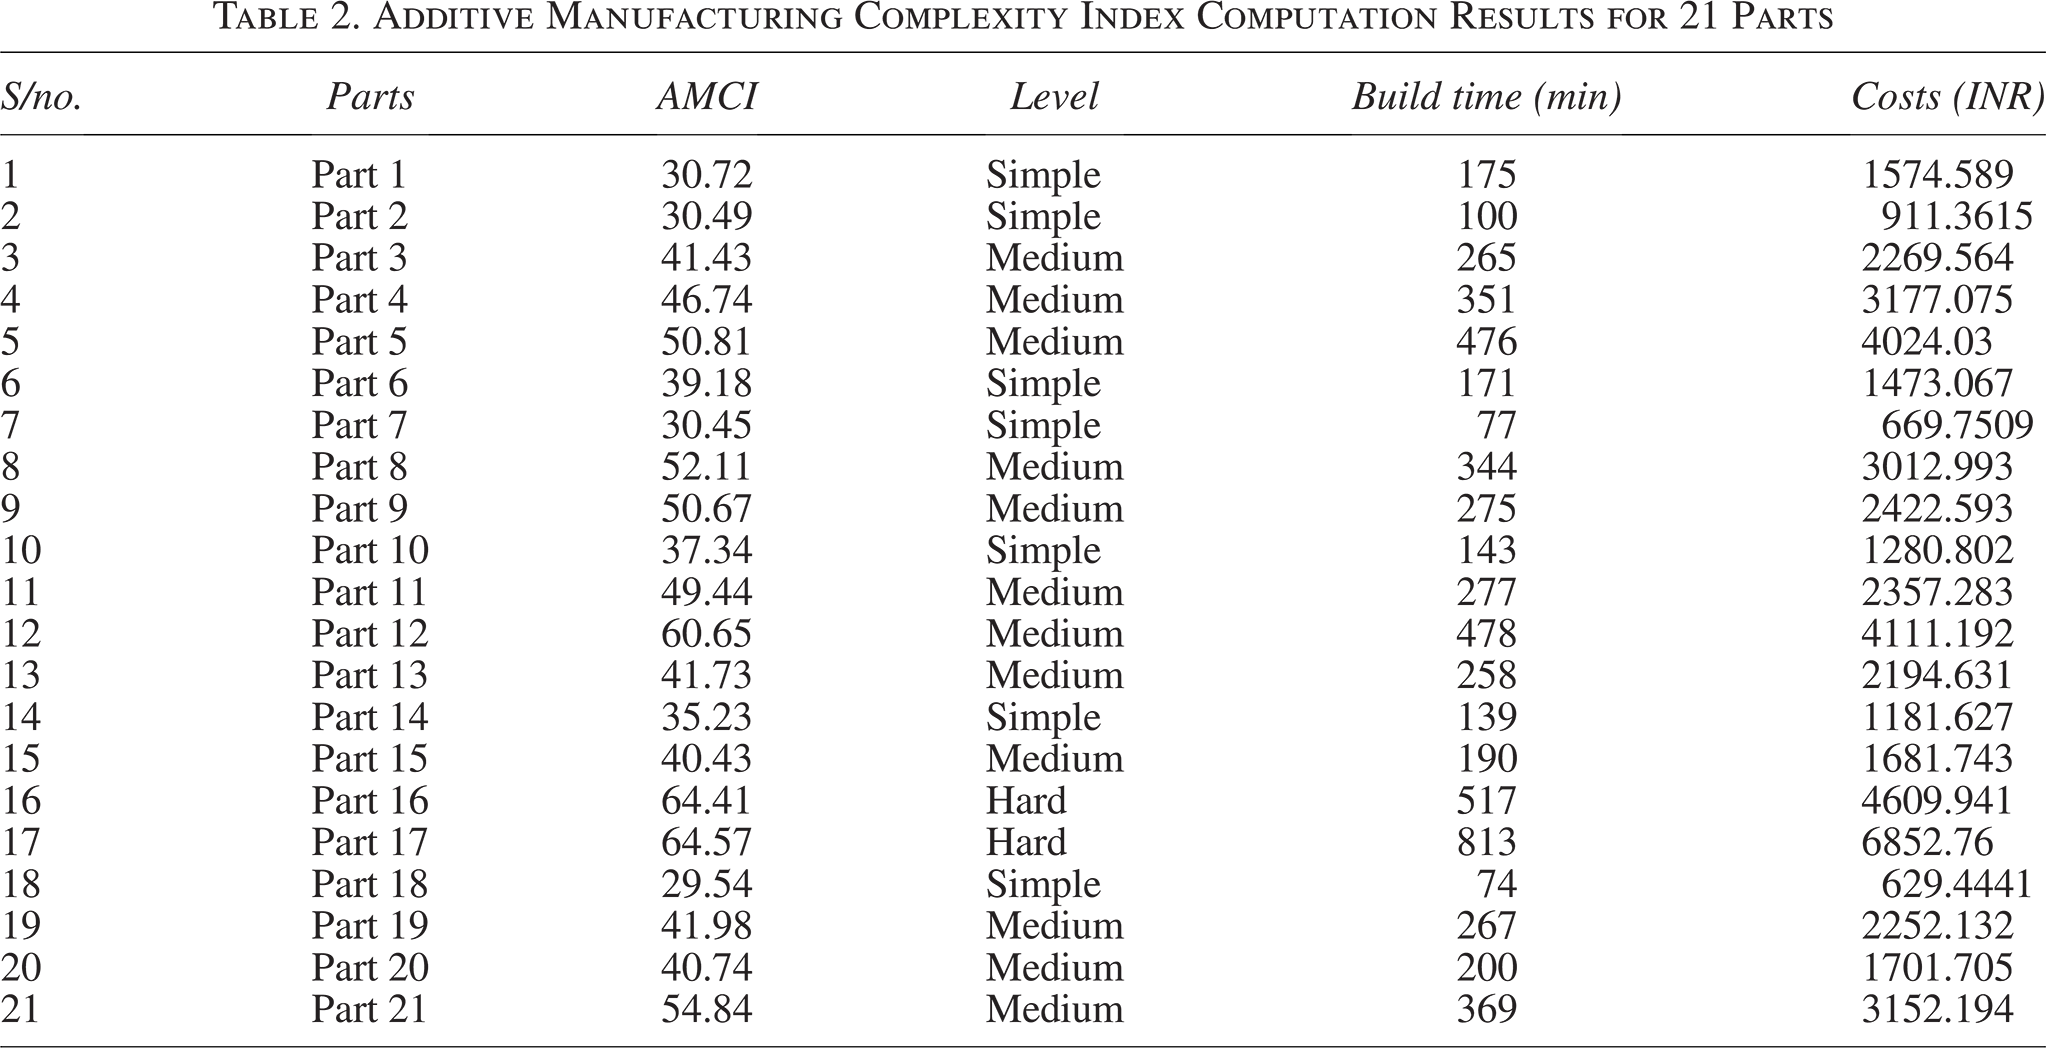
Figure 6 provides a concrete example illustrating the computation of the AMCI. The complexities of the remaining parts are detailed in Table 2, shedding light on how various geometries, features, printer settings, and parameter requirements interplay to influence the manufacturability of parts within the framework of the developed AMCI. Having applied the AMCI to these case studies, we next explore the analytical methods used to interpret and validate the utility of developed AMCI.
A Snapshot of additive manufacturing complexity computation system.
Additive Manufacturing Complexity Index Computation Results for 21 Parts
Data analysis
The relationship between the independent variable AMCI and the dependent variables of build time and cost was modeled using linear regression. Each dependent variable was analyzed separately using simple linear regression. R-squared values were used to determine how strongly the AMCI model correlated with each dependent variable. Moreover, the regression equations were analyzed to determine whether the variables were related positively or negatively. Analysis of variance (ANOVA) was conducted to determine whether there are significant differences between AMCI complexity levels. The overall complexity of components, as determined by the AMCI, was categorized into four levels: simple (ranging between 0 and 39), medium (40–59), hard (60–79), and very hard (80–100). Statistical differences between the means of the complexity levels were determined using a one-way ANOVA for each dependent variable to validate whether greater complexity correlates with higher build time and cost. In addition, correlation, ANOVA, scatterplots, and boxplots were used to visualize AMCI scores and manufacturing Key Performance Indicators (KPIs).
Python software was used to perform data analysis. In short, a comprehensive evaluation of the AMCI method for predicting manufacturing performance was conducted by combining linear regression, ANOVA, and graphical exploratory analysis.
Build time analysis
In AM, build time is critical to production costs and throughput. Therefore, understanding how build time and AMCI correlate is valuable in this study. In the linear regression, AMCI was used as the predictor variable, and build time was used as the dependent variable. We can determine how well the AMCI predicts build times depending on the strength and direction of the correlation. Also, using ANOVA, average build times will be compared across AMCI complexity groups because it was hypothesized that higher complexity groups would exhibit longer average build times.
Cost analysis
Cost is another crucial factor in assessing the effectiveness of the proposed AMCI model. Hence, AMCI’s usefulness can be further validated by examining the relationship between production costs and the model. The cost estimations in this study are based on the cost evaluation method proposed by Yang and Li, et al.;
48
the total part cost equals the sum of material, labor, energy, and machine-associated costs.

As mentioned in the build time analysis, a similar procedure was performed by considering the AMCI as a predictor and cost as the dependent variable. ANOVA was also used to compare the mean costs across the different AMCI complexity levels. With these analytical methods in place, we can now examine the results of our study and discuss their implications for AM processes.
Results and Discussion
Applying the AMCI to our case studies and subsequent data analysis yielded significant insights into the relationship between part complexity and key manufacturing outcomes. This section presents these findings and discusses their implications for AM processes, particularly VPP.
The AM of complex parts presents notable challenges. Figure 7 illustrates examples of 3D printed parts that showcase these complexities. Specific design features such as overhanging bodies and thin walls may complicate accurate printing due to resin flow dynamics, curing considerations, and the need for support structures. In some situations, support structures may be necessary to prevent collapses during printing, even though this adds complexity to the process. Although adjustments to part orientation or support can improve accuracy, these measures also entail extra postprocessing steps, contributing to increased complexity.
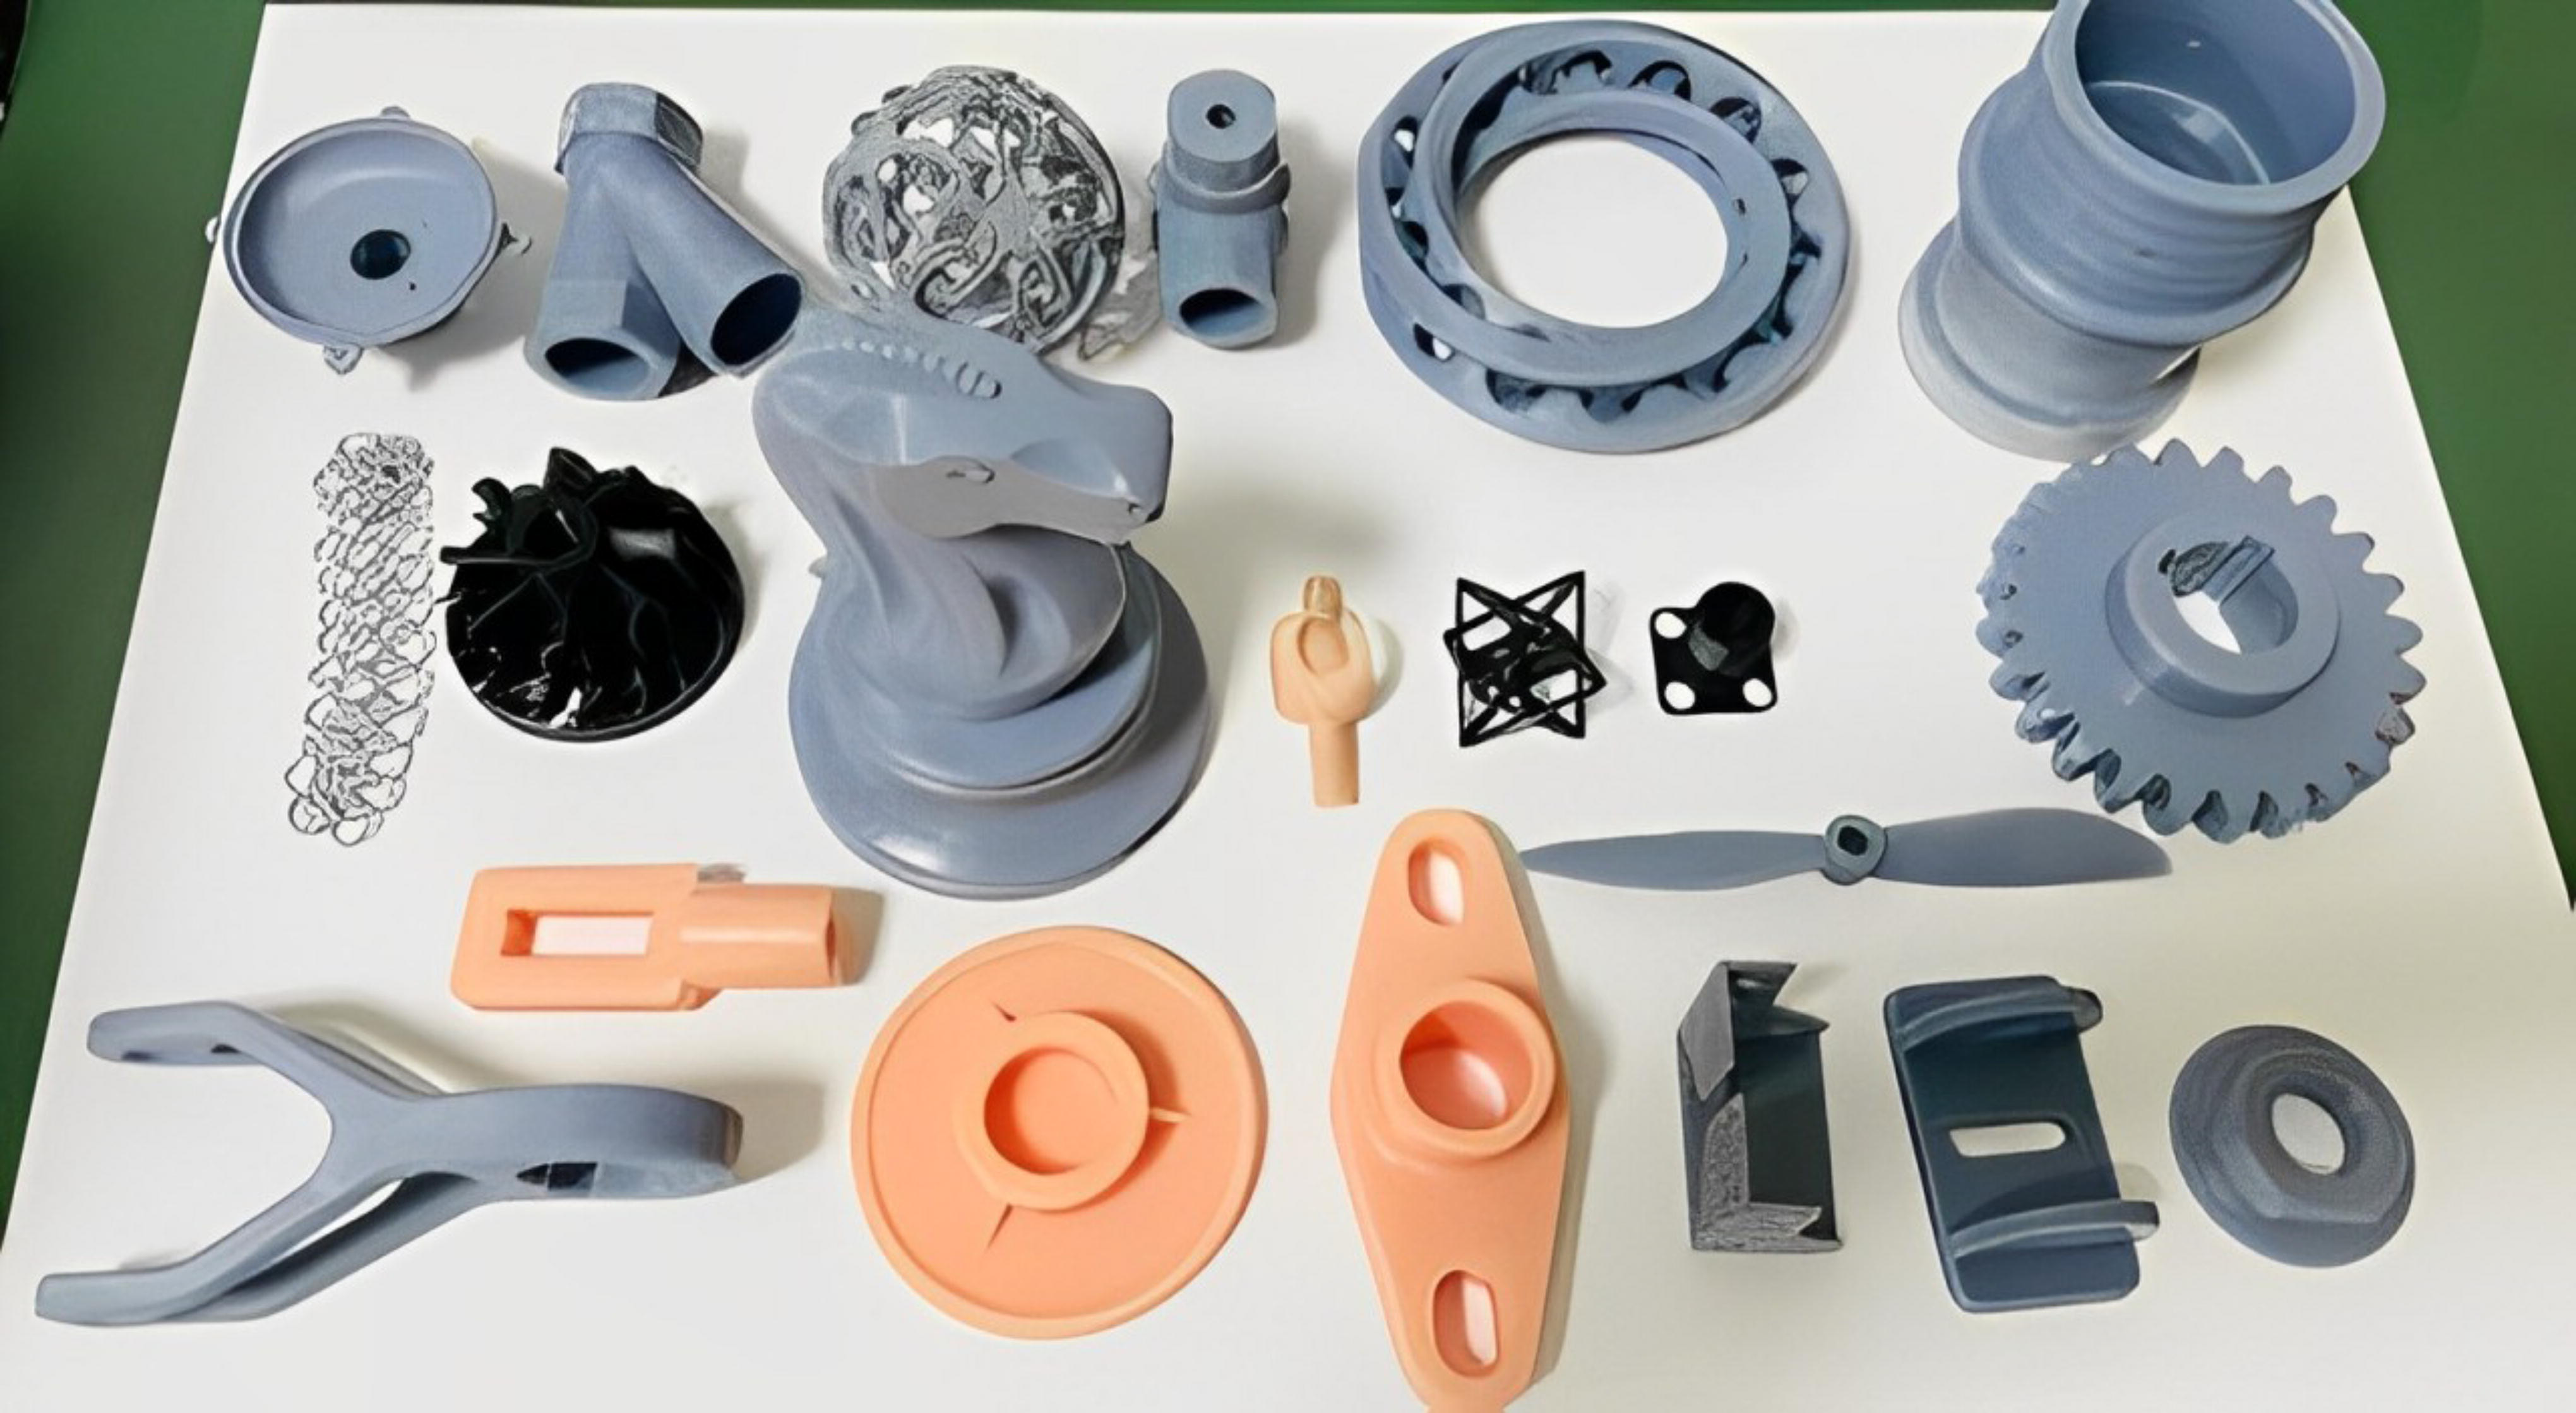
3D-printed parts.
Furthermore, the components outlined in Table 2 possess distinct characteristics related to geometry, features, AM machine settings, and parameters. These factors directly impact the overall complexity of parts produced through resin AM. As the complexity of these design attributes increases, so does the complexity of the manufactured part. This complexity escalation can substantially affect the building time and cost, especially if the part needs to be correctly calibrated to account for the intricacies.
Figure 6 provides a concrete example of calculating the AMCI. The complexities of the remaining parts are detailed in Table 2, illuminating how various geometries, features, printer settings, and parameter requirements interplay to influence manufacturability within the AMCI framework. The AMCI categorizes overall part complexity into four levels: simple, medium, hard, and very hard. Notably, the “very hard” designation indicates potential challenges such as increased build times, costs, and lower quality/accuracy—not that the part is impossible to manufacture in an AM process. For instance, some parts are more straightforward to produce, given they do not require support and can print vertically. In contrast, components with intricate structures (e.g., lattices, overhangs, and engraved details) necessitate specific orientations, supports, and postprocessing. The added intricate designs impact the resulting cost, quality, and accuracy.
An analysis of linear regression was conducted for a set of parts to examine the relationship between the AMCI, the build time, and cost. According to the regression model, AMCI to build time and costs display a strong linear correlation with R-square values of 0.83 and 0.84, respectively.
The obtained regression equations are as follows:


The positive slope coefficients 14.82 and 126.98 show that building time tends to take longer and cost more as AMCI increases. Therefore, AMCI-measured more complex parts require longer build times and higher costs.
The R-squared value provides reliable information when working with large sample sizes, but its usefulness diminishes as the sample size decreases. To overcome this limitation in our AMCI framework, we incorporated bootstrapping techniques. This approach allows us to estimate confidence intervals for both slopes and intercepts. Using bootstrapped confidence intervals, we gain valuable insights into how AMCI relates to key variables, even with smaller sample sizes.
Based on the slope of the build time, we can be 95% confident that the actual population value falls between 11.05 and 19.11. A positive correlation between AMCI and build time indicates that a one-unit increase in AMCI will likely lead to a build time increase between 11.05 and 19.11 units.
Similarly, AMCI and cost are positively correlated, as the cost slope confidence interval ranges from 96.01 to 160.65. A unit increase in AMCI is expected to result in a unit increase in cost. In addition, we computed confidence intervals for the intercepts for both regression equations. Although AMCI values typically do not reach zero in practical scenarios, it is essential to note that they represent the expected build time and cost when AMCI is zero.
Using confidence intervals enhances our comprehension of the relationship between variables by considering the uncertainties in our small sample size. This allows us to draw more precise inferences about the larger population.
Although these regression models provide valuable predictive power for estimating build times and costs based on the AMCI of a given part, we aimed to validate further the AMCI’s effectiveness in distinguishing between complexity levels. To achieve this, we analyzed variance. Subsequently, based on their AMCI values, we categorized the parts into four complexity levels: simple (AMCI 0–39), medium (AMCI 40–59), hard (AMCI 60–79), and very hard (AMCI 80–100). We then compared the means of build times and costs at each complexity level using an ANOVA.
There was a p-value of 0.0000 and an F-statistic of 26.85 in the ANOVA results for the relationship between AMCI and build time and a p-value of 0.0000 and an F-statistic of 28.17 for AMCI vs. cost. Among the different levels of complexity, the mean build times and costs differ statistically significantly based on the low p-value. In particular, the ANOVA results indicate that parts with higher complexity levels (hard and very hard) have substantially longer build times and higher costs than parts with lower complexity levels (simple and medium). As demonstrated in Figure 8, the relationship between AMCI and build time becomes evident.
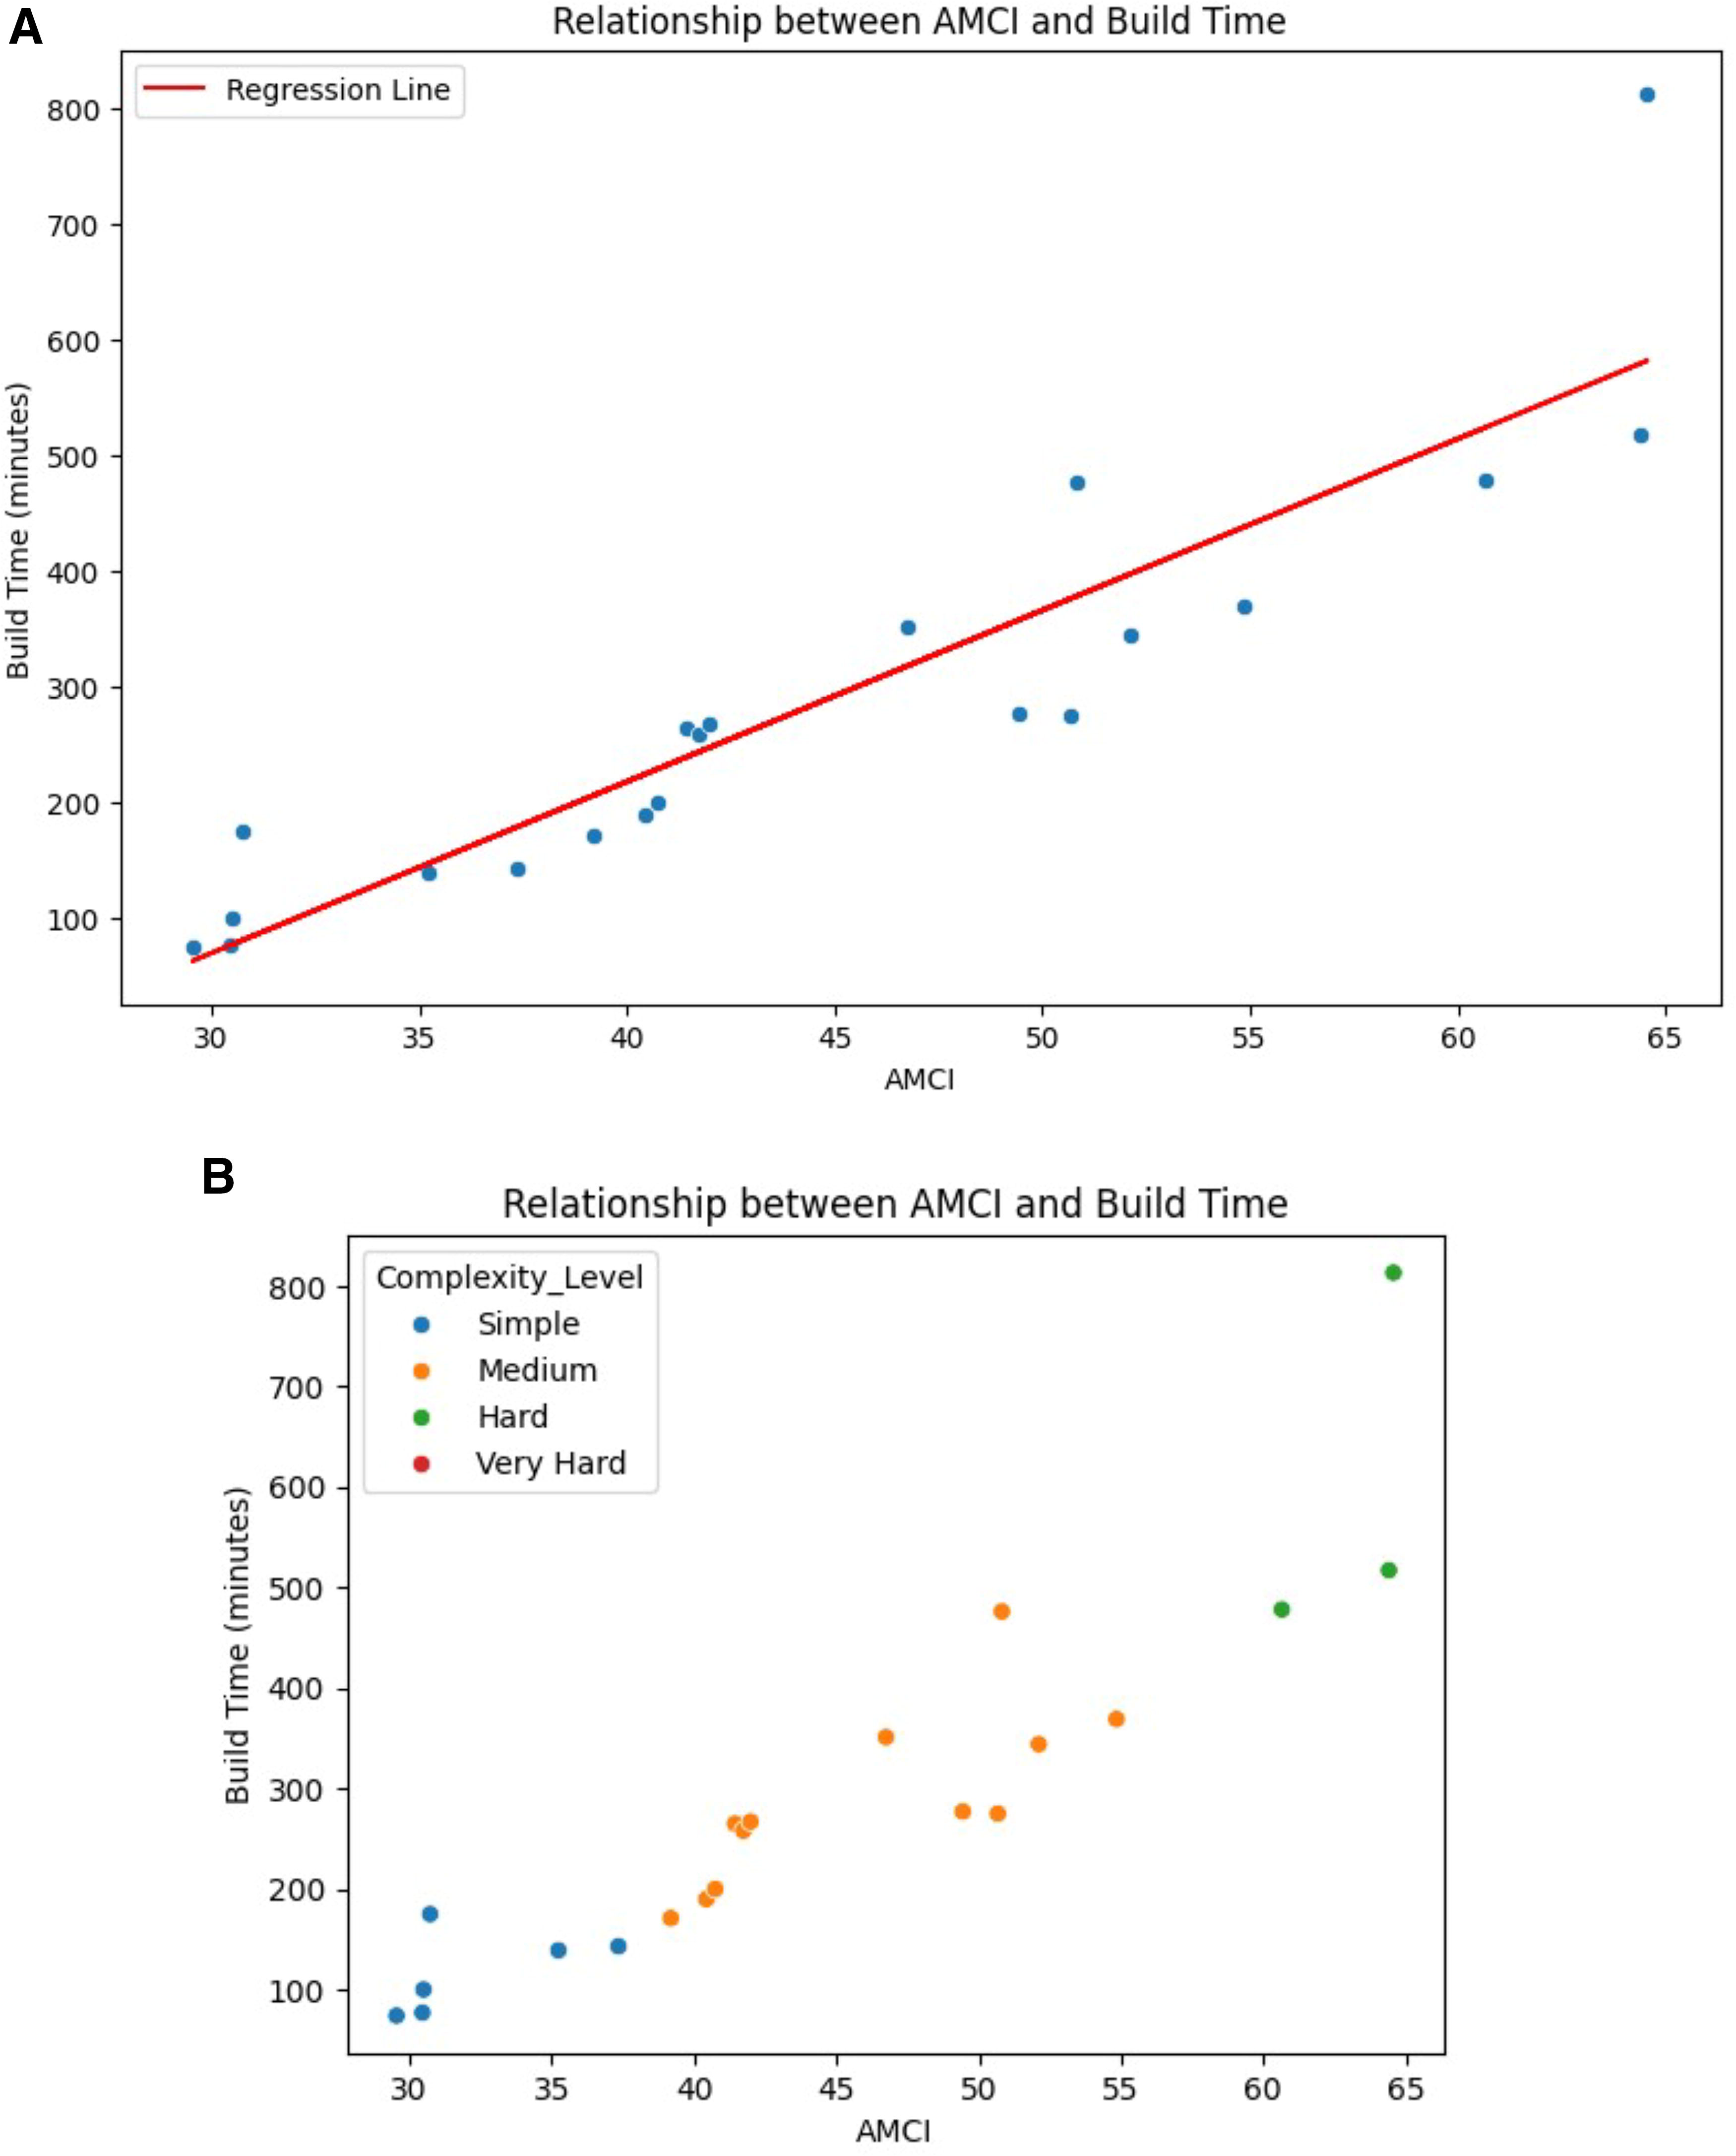
AMCI versus build time relations.
In addition, using a scatter plot visualization, data points are colored according to their complexity level, further illustrating the relationship between AMCI, build time, and cost, as shown in the following figures. The scatter plot visualizations further reinforce these findings, clearly representing the relationship between AMCI, build time, and cost across different complexity levels. Figure 9 similarly demonstrates the correlation between AMCI and estimated costs.
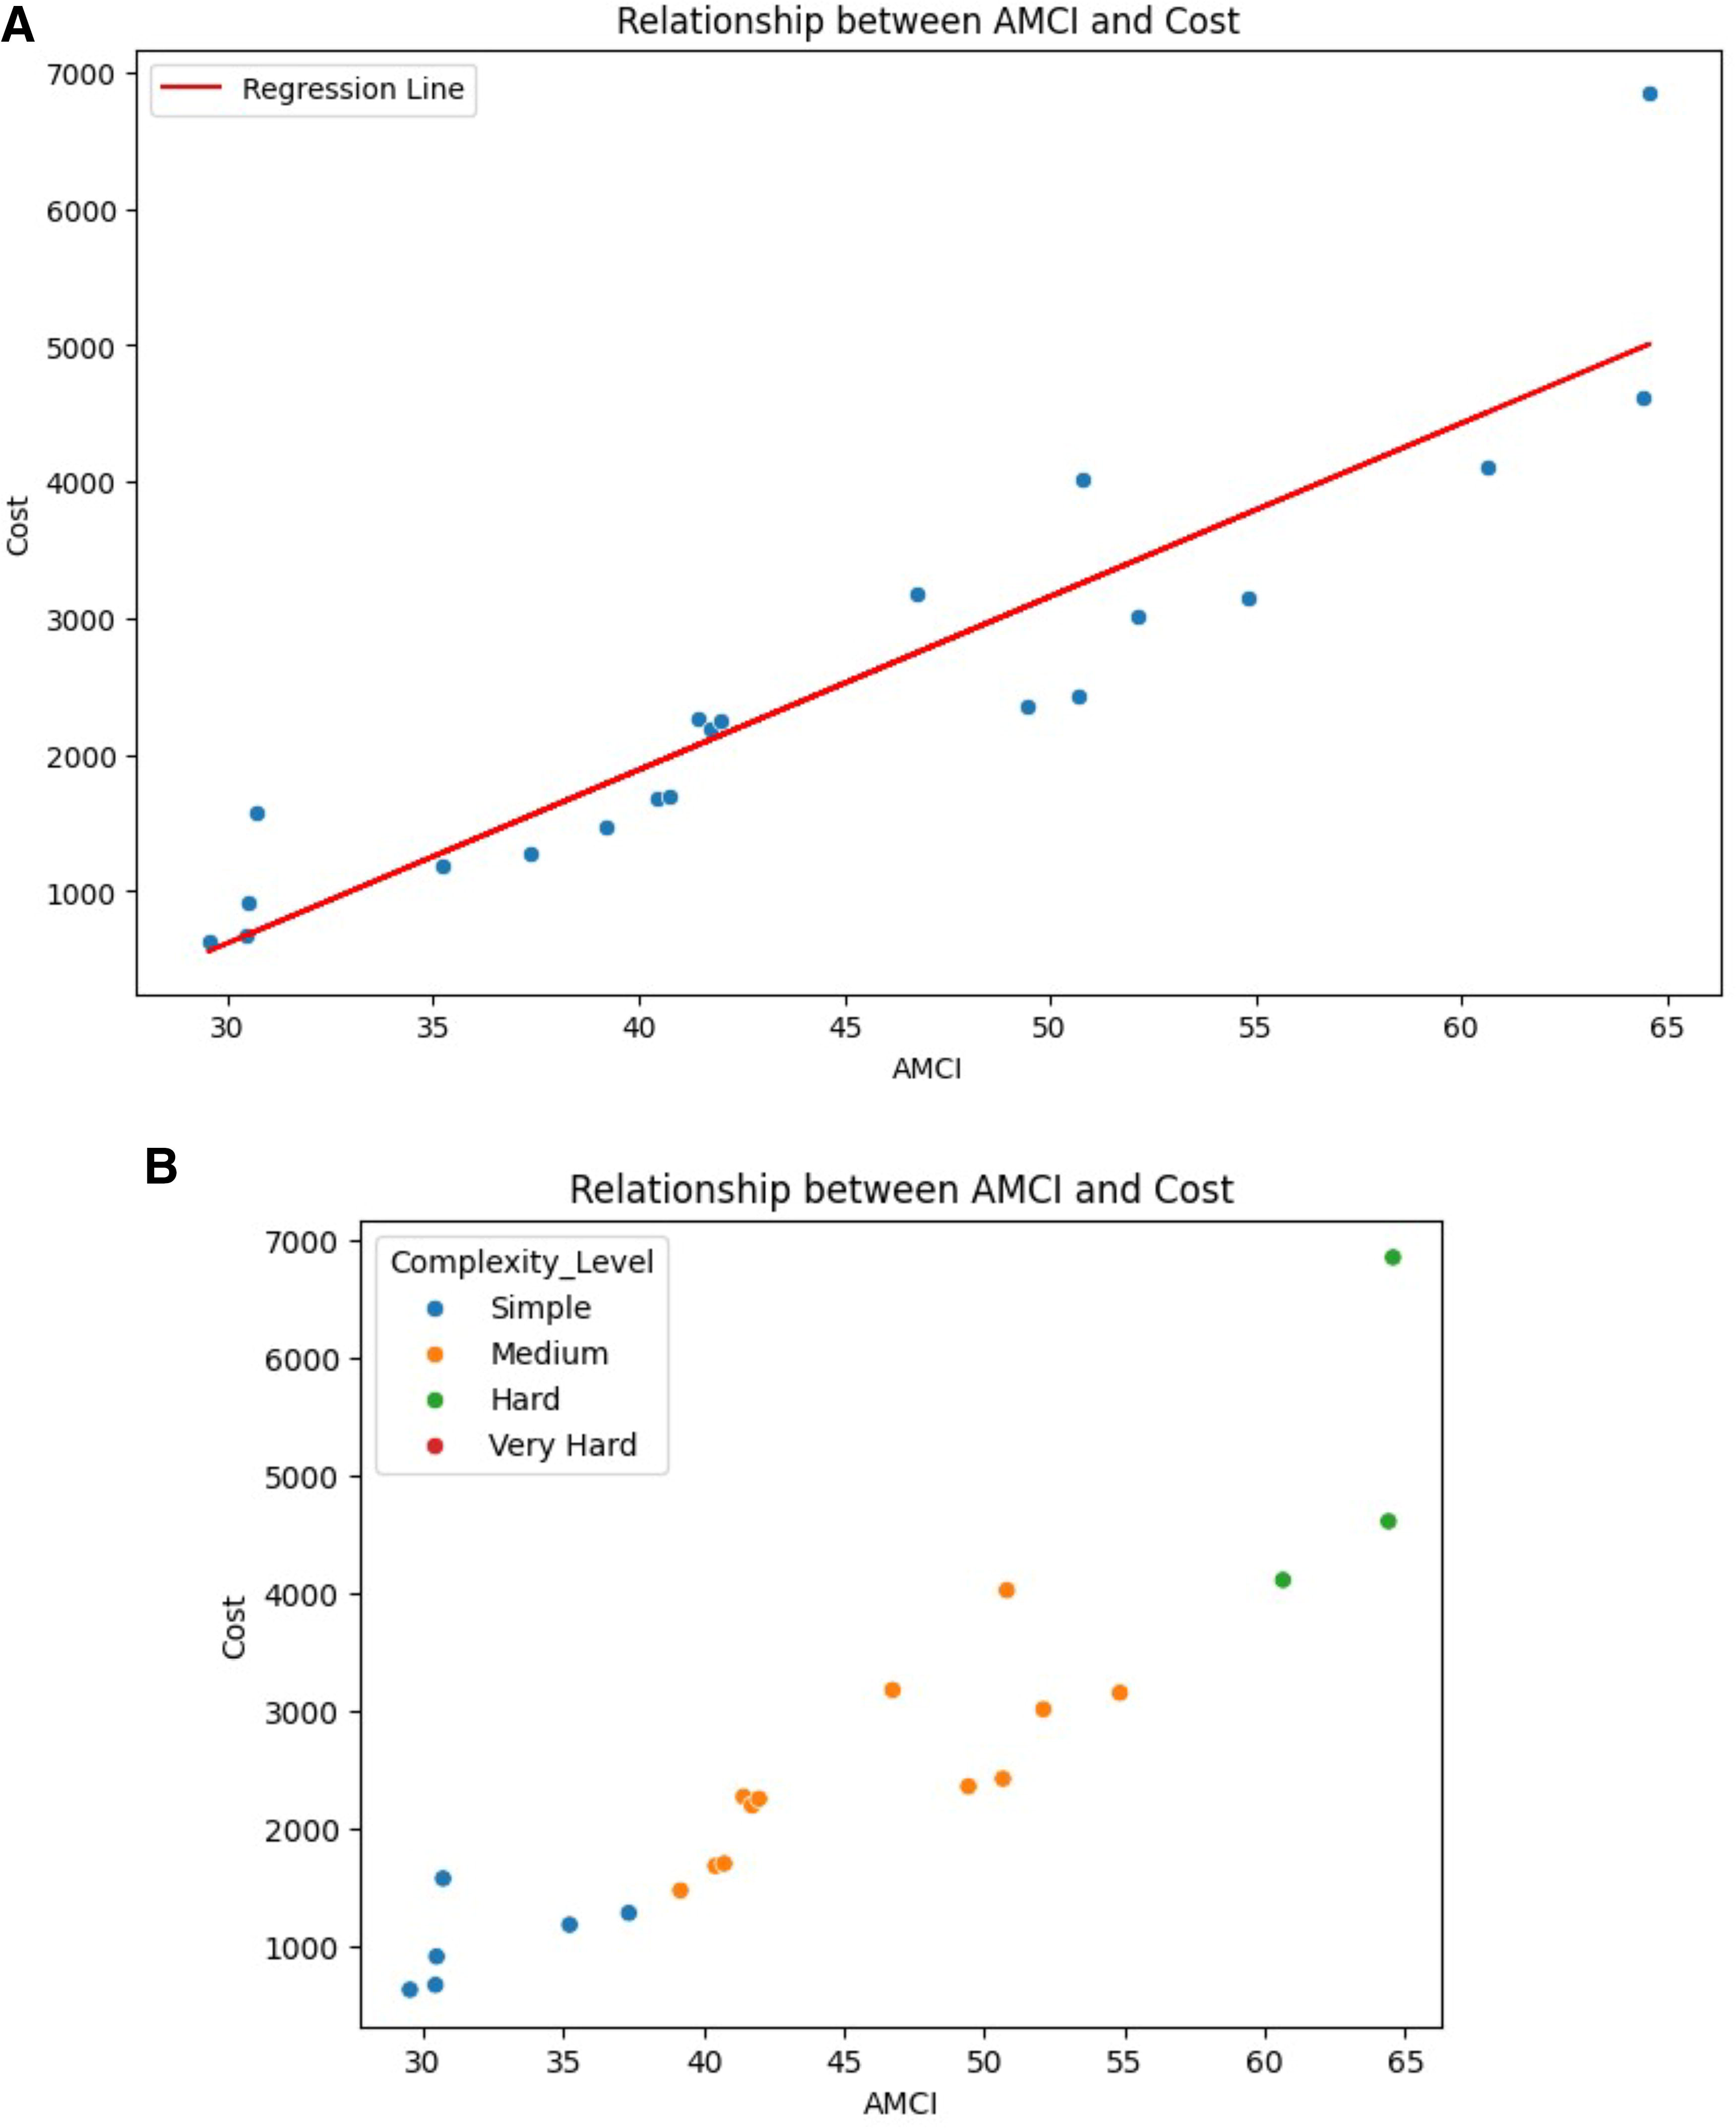
AMCI versus estimated costs relations.
Despite this study’s focus on VPP, the AMCI method could also be applied to other AM processes. Nevertheless, the relationships between manufacturing outcomes and complexity factors will likely vary. The complexity of powder bed fusion processes may be primarily determined by factors such as thermal stresses and powder removal rather than resin flow dynamics. Complexity and support structure requirements might be more closely related in FDM. To account for each process family’s unique characteristics, AMCI weightings, and attribute ranges must be adjusted. A comparison of AMCI results across multiple AM families could provide valuable information on how different processes handle complex geometries and their relative strengths and limitations.
Conclusion
In light of the results and discussion presented, we can draw several important conclusions about the utility and implications of the AMCI. Leveraging the AMCI, this article introduces a valuable tool for evaluating the complexity of components manufactured using resin AM. The AMCI encompasses design features (geometric and feature descriptions) and additive manufacturability considerations (AM machine settings and parameters). This index is structured within a five-level hierarchy, with the first level representing the AMCI, then design and 3D printability complexities at the second level, and further detailed criteria at the third level. The fourth level comprises 31 attributes, with the fifth level specifying their data and ranges.
To calculate the weightage of components produced through VPP AM, we used the WCA, assigning equal importance to attributes within their respective categories and ranges. Our case studies demonstrated how the AMCI can yield different complexity values, providing designers and manufacturers with valuable insights during the early stages of component development.
It is essential to acknowledge the limitations of this study, primarily that our focus was exclusively on VPP AM technology. However, the AMCI framework can be extended to encompass various other AM technologies. Future research could enhance the accuracy and relevance of AMCI computations by incorporating additional data from the AM industry and users, thus further strengthening its utility as a decision-making tool.
Although this study provides a solid foundation for understanding and quantifying complexity in AM processes, it also opens numerous avenues for future research and practical applications in AM.
Authors’ Contributions
Conceptualization: D.A.M., N.M., B.K.K., and A.S. Methodology: D.A.M., N.M., and A.S. Formal analysis and investigation: D.A.M. Writing—original draft preparation: D.A.M. Writing—review and editing: D.A.M., N.M., B.K.K., and A.S. Funding acquisition: None. This research was conducted independently without any external financial support. Resources: The authors acknowledge the use of university facilities, including for the conduct of this research. Supervision: B.K.K. and A.S.
Footnotes
Acknowledgments
The authors would like to express their sincere gratitude to the Marwadi University administration for their valuable support and facilitation in conducting this research. Their assistance was instrumental in the successful completion of this study.
Author Disclosure Statement
The authors have no relevant financial or nonfinancial interests to disclose.
Funding Information
The authors declare that no funds, grants, or other support were received during the preparation of this article.
Availability of Data and Material
The data that support the findings of this study are available on request from the corresponding author, D.A.M. The data are not publicly available because they contain information that could compromise the privacy of research participants.
Code Availability
The code that supports the findings of this study is available on request from the corresponding author, D.A.M.