
Abstract
Melt electrospinning writing (MEW) technology has demonstrated its utility in additive manufacturing 3D micrometer structures, such as biodevices and flexible electronic devices. It needs to achieve high-precision and micrometer-scale deposition through the 3D jet formed by the Taylor cone. However, jet lag effects during high-speed direct printing present a significant challenge in realizing high-precision deposition, especially at 90° angles. This study first analyzes the generation of jet lag effects. Subsequently, a detection model for the jet deflection angle
Introduction
Melt electrospinning writing (MEW) technology, also known as a near-field direct writing technology, belongs to electrospinning additive manufacturing technology that can achieve ordered micrometer-scale jet deposition. 1 The commonly used melt polymer in MEW is polycaprolactone (PCL) because it has a relatively low melting point of over 60°C and better material adaptability.2,3 It can print the micrometer-scale fibers, and the value range is between 0.8 and 20.0 μm, and the distance between the nozzle and the collector is close, which is between 0.5 and 300 mm and is conducive to the high-voltage electrostatic force to stretch and thin the jet of melt polymers, 1 so MEW is also called 3D near-field direct writing. Under the high-voltage electrostatic field, the ultrafine fibers can be obtained from melt polymers after the solidification.4–6 At present, MEW technology can generate micrometer-scale structure patterns with high-scale consistency and complicated morphology and has been successfully used in the manufacturing of biological scaffolds,,7–9 electronic microfluidic devices,10–12 and functional sensors,13,14 promoting the development of micrometer additive manufacturing technology.12–16 In printing, writing patterns require the X- and Y-axial collectors to provide feed motion. However, the existence of a time difference (jet lag effects) between the planned trajectory and the deposited trajectory during the feeding motion will cause deviations in deposition. It is difficult to realize that the deposited trajectory is consistent with the planned trajectory, especially at the 90° corners. 17 The deviations will affect the pattern integrity, directly impacting the performance required for microstructure functional devices.
With the in-depth MEW research, preliminary technical breakthroughs have been made in predicting jet trajectories.18,19 Nevertheless, achieving high consistency between jet-deposited trajectory and collector trajectory is still a problem that remains unresolved. The impact of process parameters on a jet’s high-precision deposition has not been fully explored. Jet lag effects are the main reason that affects the high-precision deposition, especially at corners. The generation of the lag effects is inextricably linked to the acceleration of the collector, but the relevant exploration research of their influence mechanism has not yet been carried out. In 2016, Hrynevich et al. 20 confirmed that the inconsistency between deposited trajectory and collector trajectory is due to the jet lag effect in the printing process but did not propose a solution for achieving trajectory consistency by adjusting acceleration. In 2019, Wunner et al. 21 built a MEW system with monitoring capability and identified the main process parameters of the jet flight path, which could reduce the jet lag effect and improve the precision of jet deposition. However, the solution requires a large number of parameter explorations and technical requirements. In 2020, Liashenko et al. 22 obtained the microscale layer shifting deposition by adjusting collector speeds. However, this research has not explored the conventional parameter of collector acceleration. In 2022, Liashenko et al. 23 also discussed the advantages and disadvantages of drum collectors in near-field electrospinning and demonstrated that the supplementary electrodes can realize the precise control of the jet trajectory. It opens possibilities to control the positioning of fast nanofibers, but it has not been applied in the market yet. In 2021, Karlsson et al. 24 proposed a higher degree control method of the electric field direction electrode by using auxiliary steering hardware to achieve a higher-precision jet deposition in MEW, which can determine the real-time jet position. In 2023, Li et al. 25 also proposed an ultrafast modulation of jet trajectories by introducing jet-deflecting electrodes, which can make deposition errors of <5 µm by using ultraviolet curable adhesives. However, the methods mentioned above require additional hardware around the jet for controlling the electric field direction in equipment, which increases the complexity of the MEW system and the accuracy of hardware greatly influences the precision of deposition. In 2023, Zhu et al. 26 obtained lattice pattern fibers with a high positioning precision of 0.98 ± 0.06 μm based on optimizing the printing parameter and the printing order. Nevertheless, different patterns have different printing orders, and while the printing pattern is not the lattice, it is challenging to readjust without technical experience. With the development of the intuitive software toolbox, it can be used for planning the MEW path automatically from 2018.27,28 In 2022, McCosker et al. 29 reported a novel toolbox that can generate G-code for several scaffold designs and print successfully through optimization of printing parameters. In 2024, Devlin et al. 30 introduced an application about the workflow for MEW fabrication, which can generate the G-Code that learnings from pioneers’ experience in the MEW and innovate one user-friendly platform. This application offers a valuable toolbox to generate G-Code and correct the toolpath of specific fiber constructs. In addition, Zhou et al. 31 developed a visualization system that can measure jet diameters, and the measured system is reliable. However, it is a significant development and application in the MEW field about the tool path and writing error correction, but it has not explored the relationship between acceleration and high-precision deposition trajectory.
Although the reason the collector trajectory deviates from the designed trajectory has been clarified, the collector acceleration mechanism affecting the deposited trajectory at the corner has not yet been determined. If high-precision deposition can be achieved by adjusting acceleration, it will promote the development of MEW. In order to optimize the acceleration and explore the relationship between it and jet deposition at the corner, research based on collector acceleration was carried out. First, the deposition phenomena of the jets are classified based on the collector speed. Subsequently, the jet deflection angle θ is detected in real-time based on the camera, and a jet deposition prediction model is constructed. Next, experiments were conducted to explore the influence of acceleration on the jet deposition. Finally, the solutions are explored under different acceleration and process parameters (such as nozzle height and heating temperature). Experiments have shown that adjusting the acceleration can effectively realize high-precision deposition. It provides a new solution for how to achieve high-precision deposition in MEW.
Theoretical Analysis
The generation of lag effects
The feed motion of the collector is the basis for realizing the jet-patterned deposition in MEW. The lag effect has caused a slight deviation in the deposition, affecting the deposition precision. There are three main situations for the falling jet.32,33
When the collector starts moving at an extremely slow speed, and the speed of the feed motion is less than the jet’s falling speed from the nozzle tip to the collector (i.e.,
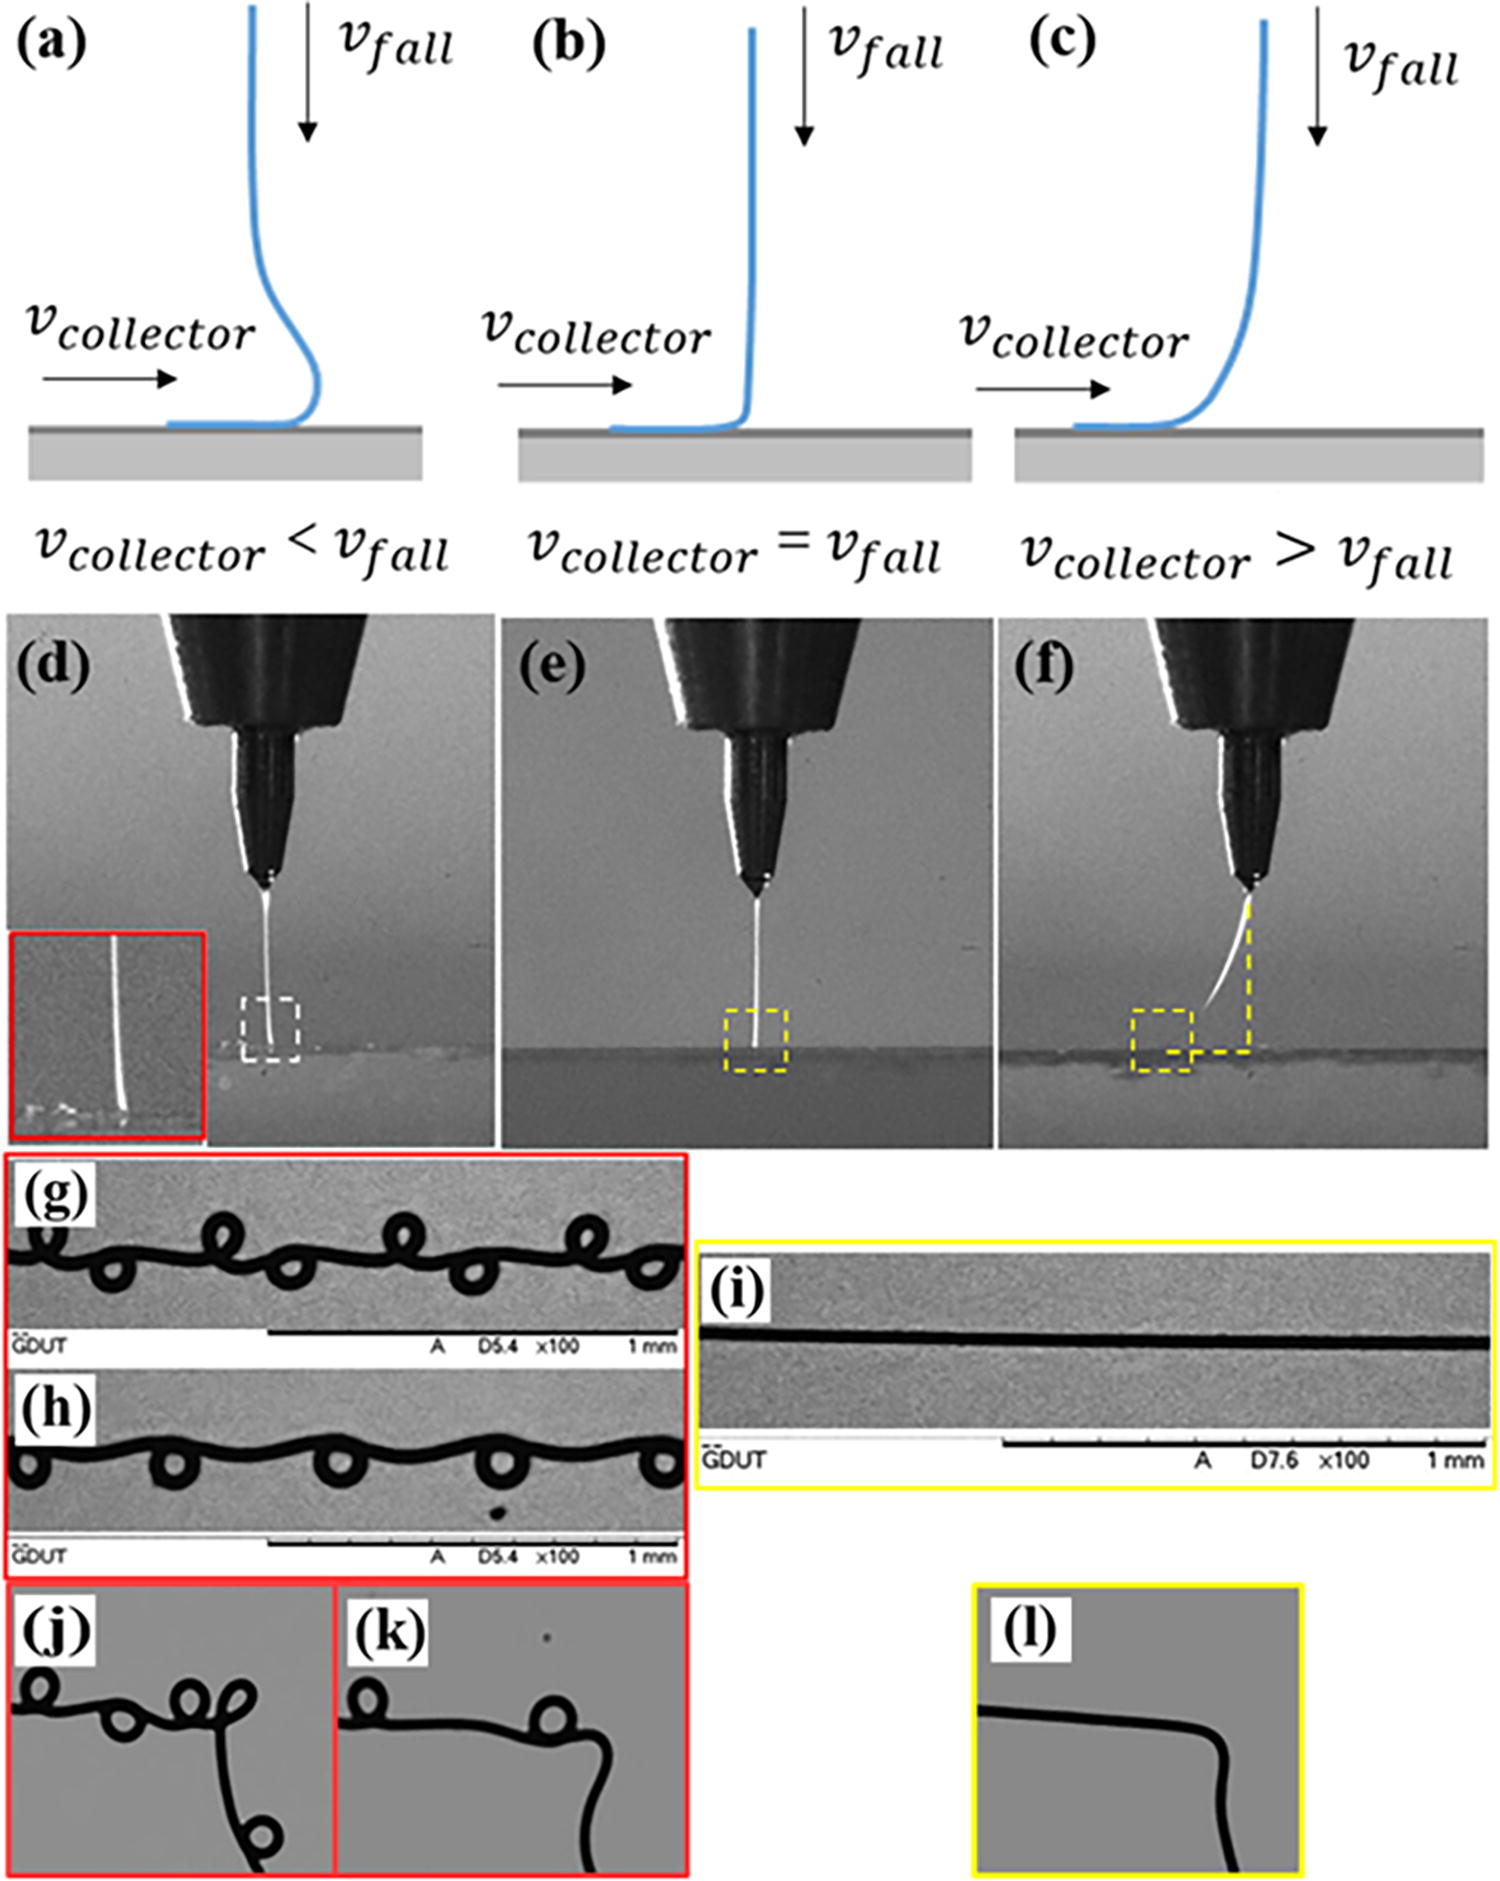
Jet trajectory under different states.
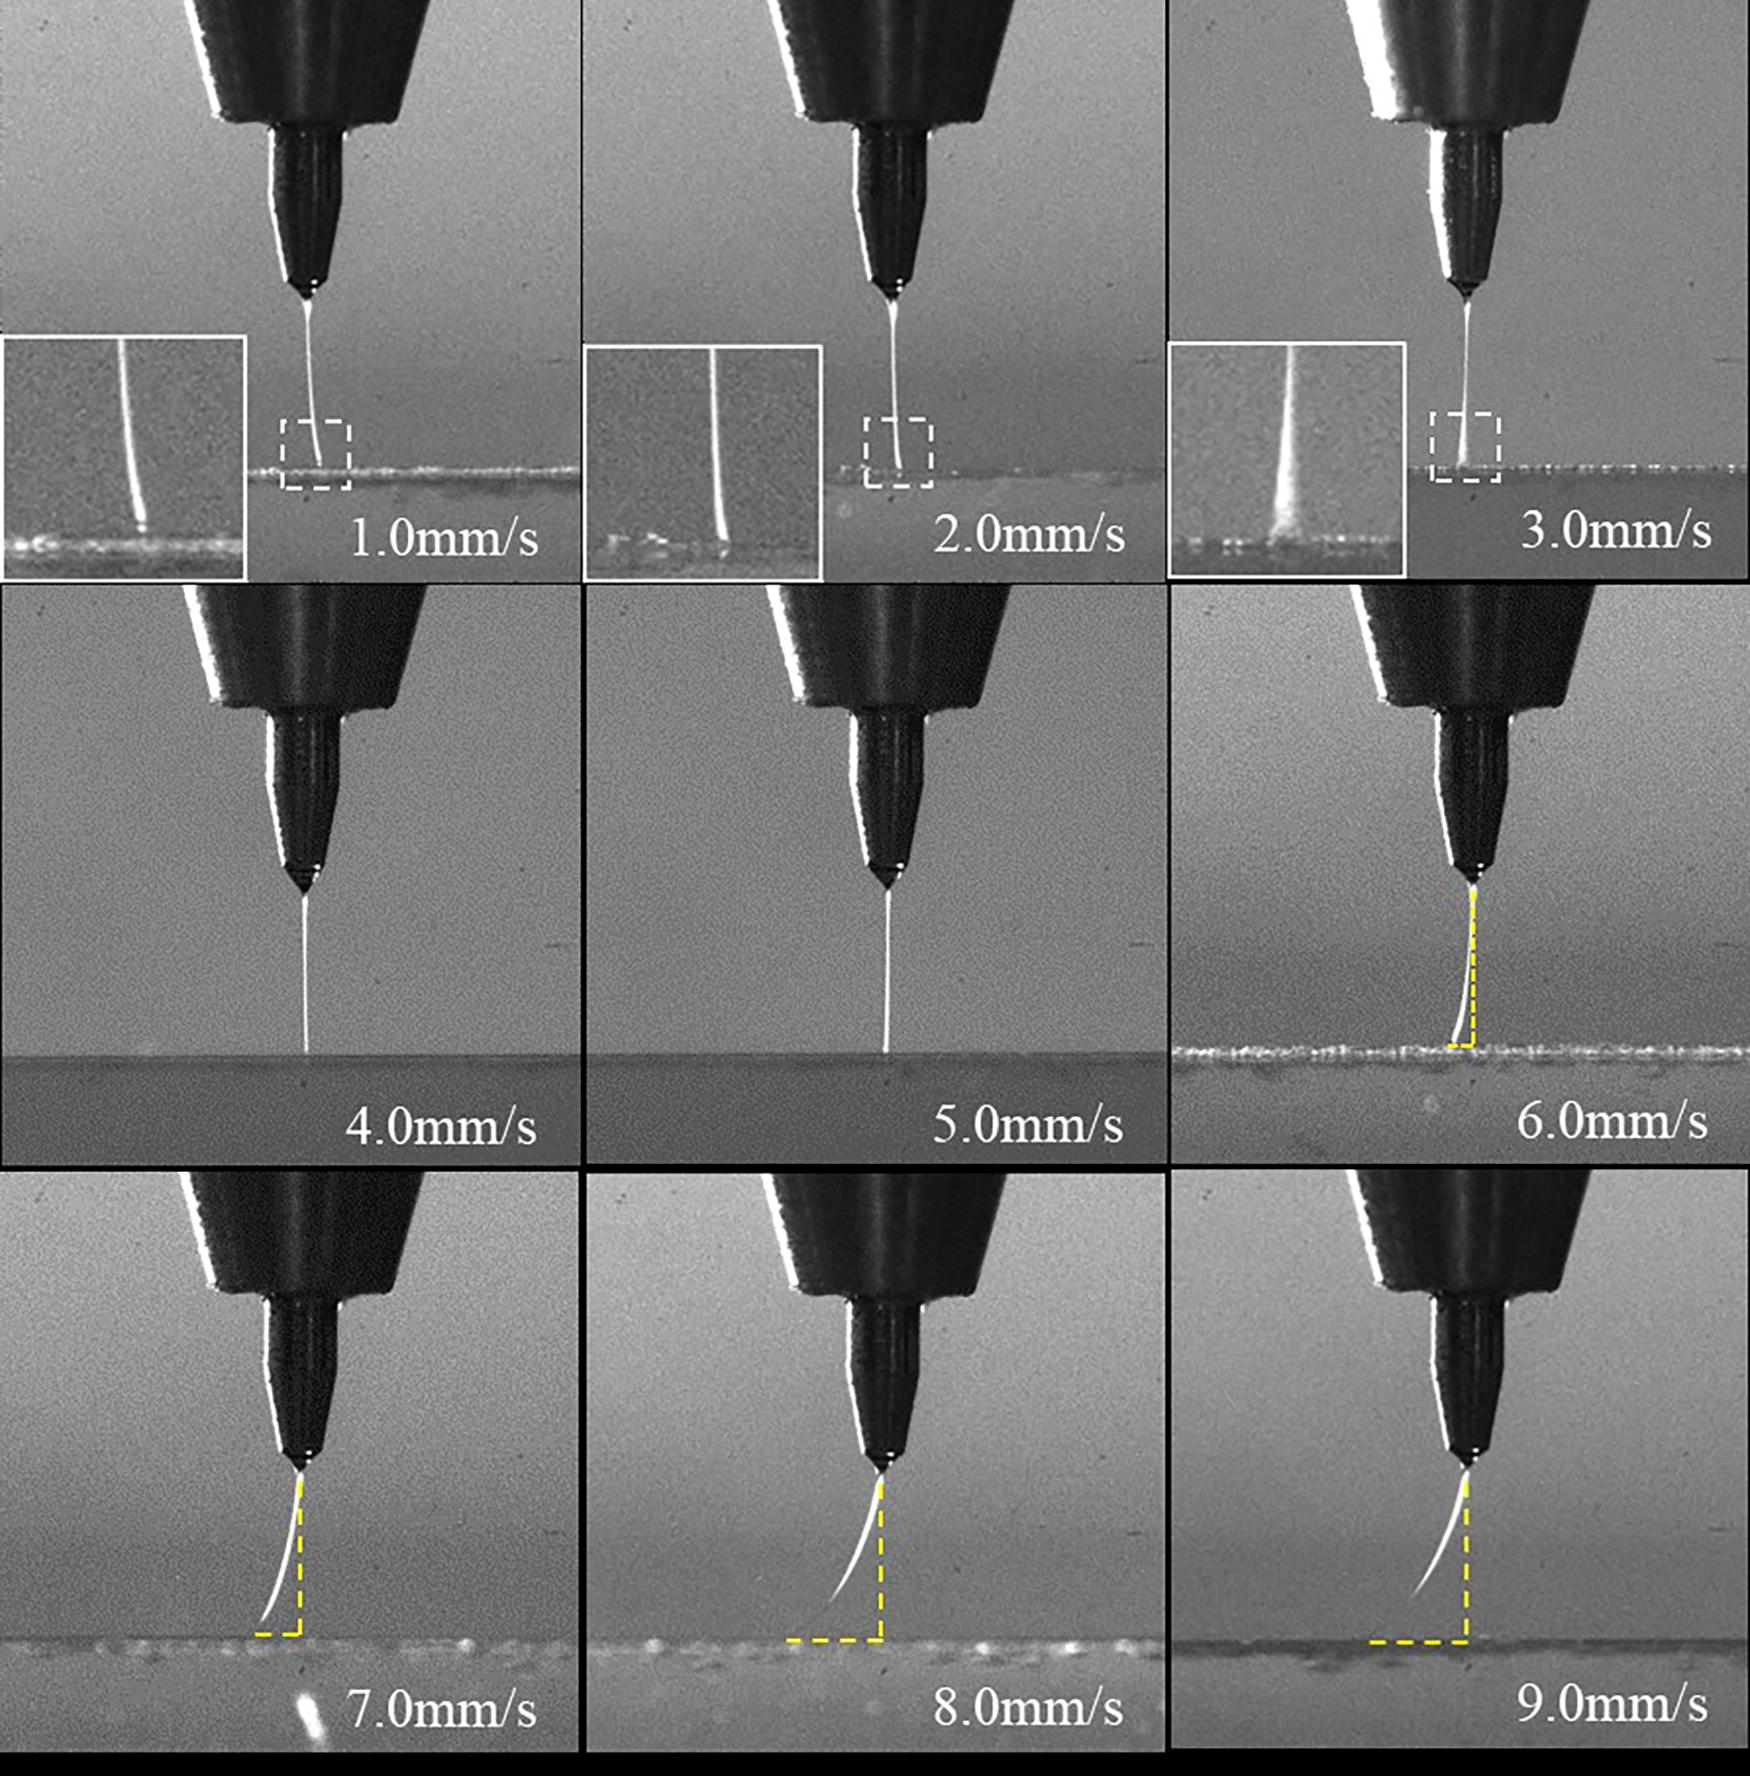
Different state of the jet in MEW under the speed range between (1.0 and 9.0) mm/s. MEW, melt electrospinning writing.
Based on the above images, the following summary can be made. When the collector speed is as low as 1 mm/s to 4 mm/s, at this time
Equipment and image processing
The size of the jet deflection angle θ can be used to define the strength of the jet lag effect during the printing. The deflection angle θ can maintain high consistency when performing near-field printing at the same collector speed. Currently, there is no specific calculation formula for the deflection angle. In order to obtain the θ in real-time, it has established a real-time monitoring system for the jet. Based on the machine vision algorithm, the real-time characteristic monitoring of the jet is carried out, and the accurate jet deflection angle θ is finally obtained.
The process for calculating the jet deflection angle θ is as follows in Figure 3c and d. The first step is to preprocess the images collected from the monitor. The median filter is selected for filtering processing, and then the Otsu threshold segmentation is used to distinguish the foreground and background of the image. Then, the Sobel operator is used to obtain the jet edge information, and above edge information is used to obtain the contact intersection point between the jet and the collector.

MEW system and the real-time image process solution of jet deflection angle θ.
The second step is to judge the working status of the Taylor cone based on YOLOv7.
34
When the Taylor cone is determined to be in stable working, obtain the center point
Through real-time image analysis, it can be found that as the collector speed increases, the θ becomes larger. As shown in Figure 2, when the speed changes from 6 to 9 mm/s, the θ is approximately 10.3 ± 0.2°, 15.2 ± 0.2°, 20.4 ± 0.2°, and 30.5 ± 0.2° which have tolerance of ± 0.2° in the angle measurement. After the feed motion is maintained at the same speed, the jet deflection angle θ can remain basically stable.
Deposition prediction
There has been research on the deposition path in MEW, which is based on the geometric catenary to represent the deposited trajectory.16,20 In the research, we use machine vision to identify the jet deflection angle θ and calculate the lag length S at a constant collector speed in real-time, establishing a trajectory prediction at the deposition corner. Our geometric catenary is similar to the catenary model shown in G. Saiz et al. (2023)16,20 However, there are differences in that we use the geometric catenary to predict the next deposited point of the jet trajectory prediction and calculate the coordinates of the geometric catenary at the corners.
Due to the jet lag effect, the actual deposition position of the jet will obviously lag behind the nozzle position, as shown in Figure 4. In the above prediction model, the lag distance is represented by
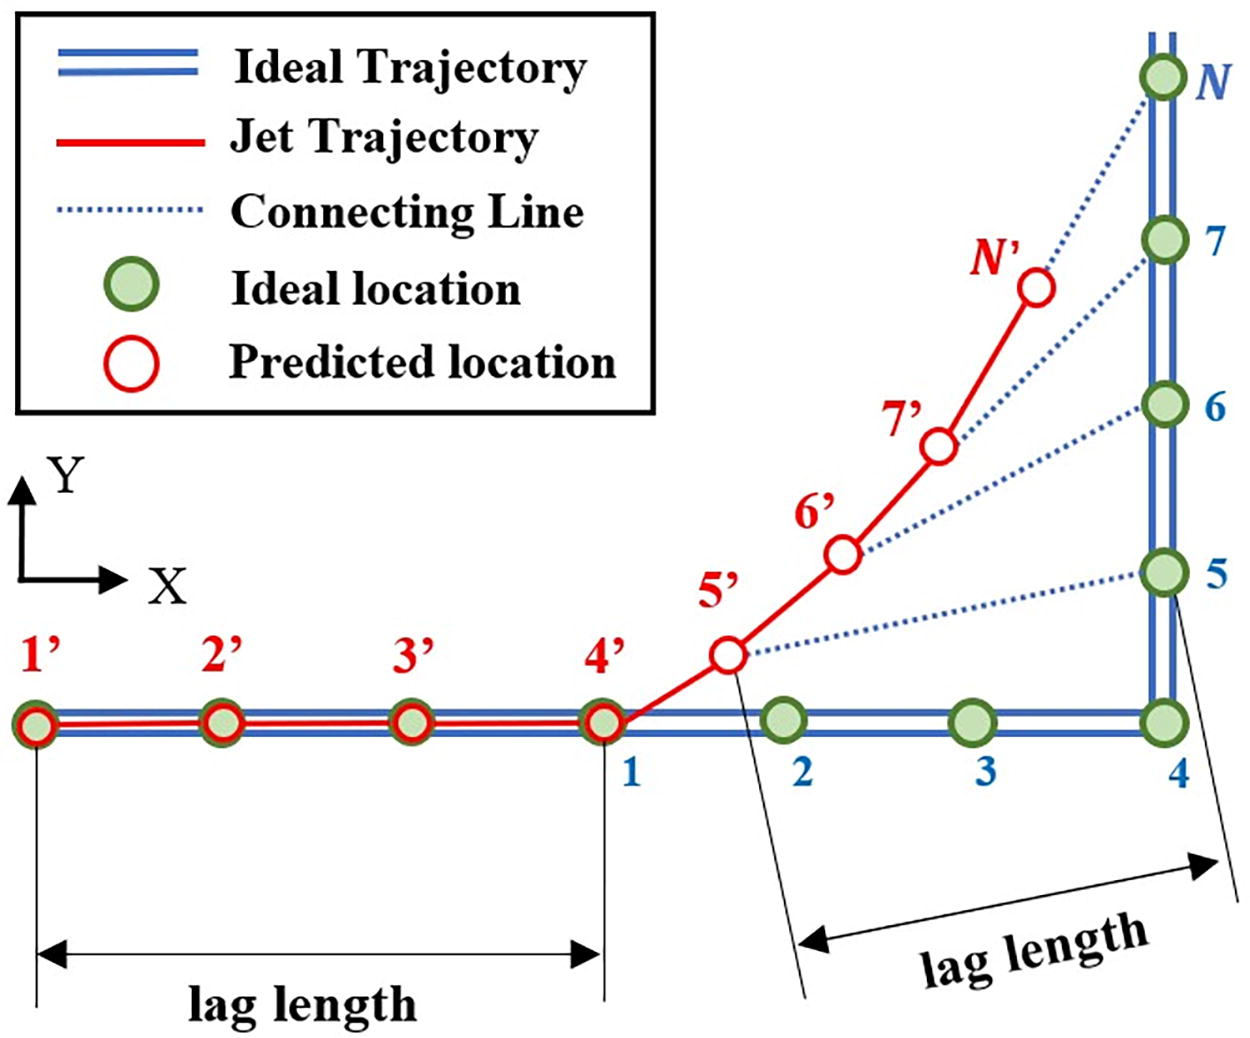
Deposition trajectory prediction of the jet at a corner.
When the nozzle position (planned trajectory) reaches the
The coordinates of
The predicted deposition point is
Until when
Experiment and Discussion
The strength of the lag effect has a specific relationship with the X- and Y-axial collector speed, especially at the corner. Since there is a drag effect when the jet is deposited on the collector, different collector speeds correspond to different jet deflection angles
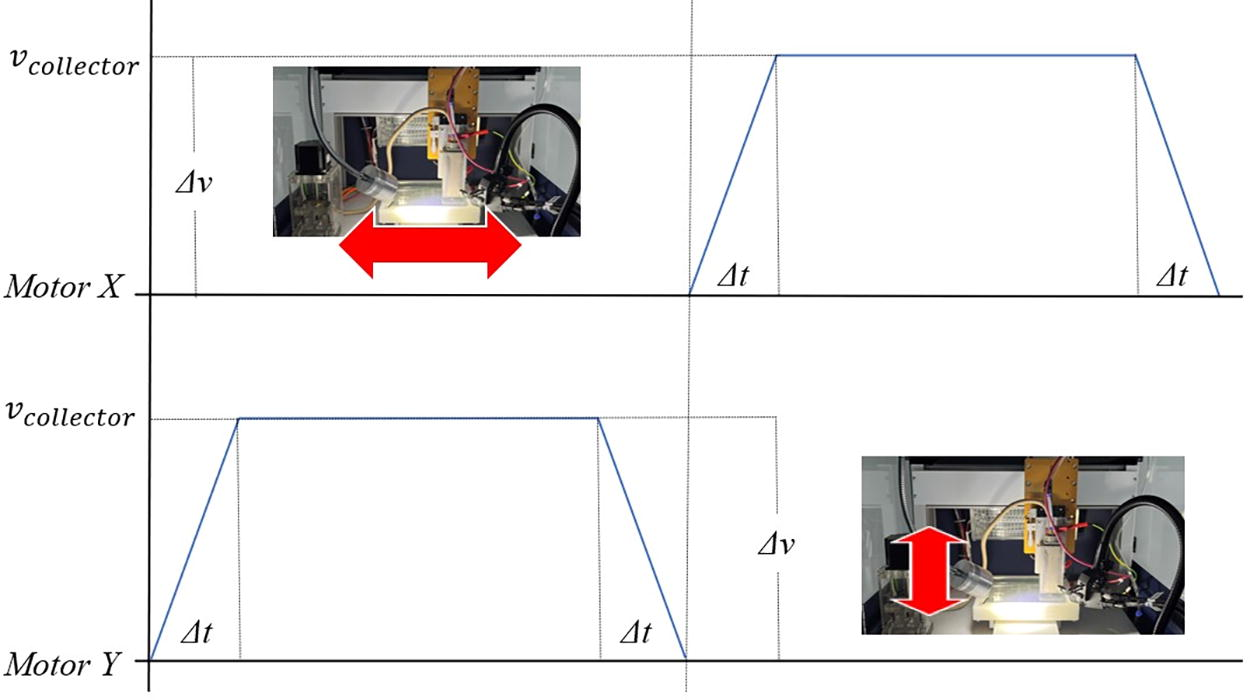
Speed around corners with the same accelerations.
The Setting Parameters in Collector Speed and Collector Acceleration Exploring Experiment
As shown in Figures 6a and b, when the collector acceleration is set to 2000 mm/s2, the X- and Y-axial collector can reach 10 mm/s from 0 mm/s in the shortest time among the eight group experiments. At this time, Δv = 10 mm/s and only takes 2*Δt = 0.01 s. When the nozzle approaches the corner, it only takes 0.005 s to reduce the speed from 10 to 0 mm/s in one direction. And then, it only takes 0.005 s to raise the speed in the other direction from 0 to 10 mm/s. The collector speed change process is displayed in Figure 5. When the collector acceleration is set to 1000 mm/s2, the Δv = 10 mm/s is the same and takes 2*Δt = 0.02 s. When the nozzle approaches the corner, it only takes 0.01 s to reduce the speed from 10 to 0 mm/s in one direction. And then, it only takes 0.01 s to raise the speed in the other direction from 0 to 10 mm/s. Due to the relatively large acceleration, the nozzle appears to “stop and go” immediately at the corner, so the actual deposited trajectory deviates greatly from the planned path. The extent of its deviation almost coincides with the predicted trajectory in the model. As shown in Figure 6c, when the acceleration is set to 500 mm/s2, the value of Δv is still 10 mm/s and 2*Δt =0.04 s for the speed change. When the nozzle approaches the inflection point, it only takes 0.02 s to reduce the speed from 10 to 0 mm/s in one direction, and then it only takes 0.02 s to increase the collector speed from 0 to 10 mm/s in the other direction. Compared to the 500 and 2000 mm/s2 group, the acceleration is reduced, and the turning time is more for the jet from squeezed until deposited, so the actual deposited trajectory at the corner has been more conducive to reducing the deviation compared to the 2000 and 1000 mm/s2 group. However, a deviation still needs to be eliminated compared to the planning path.

The jet deposition trajectory under different accelerations in experimental groups.
Subsequently, in order to further reduce the deviation between the actual trajectory and the planned trajectory, it used accelerations of 250, 200, 150, 100 and 50 mm/s2 to conduct experiments, as shown in Figure 6d–h. It can be seen that as the acceleration decreases, the strength of deposition deviation is further reduced compared with the planned path. When the acceleration reaches 200 mm/s2, its deposited trajectory is already similar to the planned path, and the strength of deviation is close to infinite and tends to zero, making the pattern more ideal. Analyzing the reasons for the reduction of the above deviation, the main reason is that Δv = 10 mm/s remains unchanged, and the time Δt for the collector to decelerate and increase the speed at the corner continues to increase. When the acceleration is 200 mm/s2, the time is 0.05 s. When the acceleration is 150 mm/s2, the time Δt is 0.067 s. The acceleration is decreased, resulting in a longer time for the jet extruding from the nozzle to deposit on the planned trajectory. Ultimately, this trend can effectively reduce the trajectory deviation compared with the planned trajectory. And the longer the time, the more perfect the trajectory will be. Next, experiments will be conducted with further reductions in acceleration. When the acceleration is 100 mm/s2, the Δt at this time is 0.1 s. The jet has undergone bending deposition at the corners. The excess jets are deposited repeatedly at the corner point, resulting in excessive deposition. It is because the time is too long, resulting in too many jets extruding from the nozzle and depositing at the corners, causing overlap. When the acceleration is 50 mm/s2, the situation of the excessive deposition is more obvious than the 100 mm/s2. The reason for the above-mentioned situation is the same as the principle in Figure 1a. In order to reduce this situation, it avoids setting the acceleration too low. The above experiments should be set close to 200 mm/s2. After experimental analysis, it was found that (200, 210) mm/s2 is set as the most adapted acceleration range in the experiments group with the above specific parameter. The overlapping deposition situation is lower, and the deposited trajectory infinitely tends to the planned trajectory.
For further exploration, it leads to more experimental groups with different collector speeds, respectively. After experiments and verification, the same conclusion was obtained, and the relationship between collector acceleration and deposited trajectory shows a normal distribution of influence. When the speed is 5 mm/s, the optimal acceleration threshold should be set in the range (100, 110) mm/s2. When the speed is 15, 20, and 25 mm/s relatively, the optimal acceleration is in the range (290, 300), (380, 390), and (460, 470) mm/s2, as shown in Figure 7. It records the most adapted acceleration range corresponding to collector speeds and shows a linear positive relationship, proving that the acceleration effect on the jet deposition is isotropic in all directions.
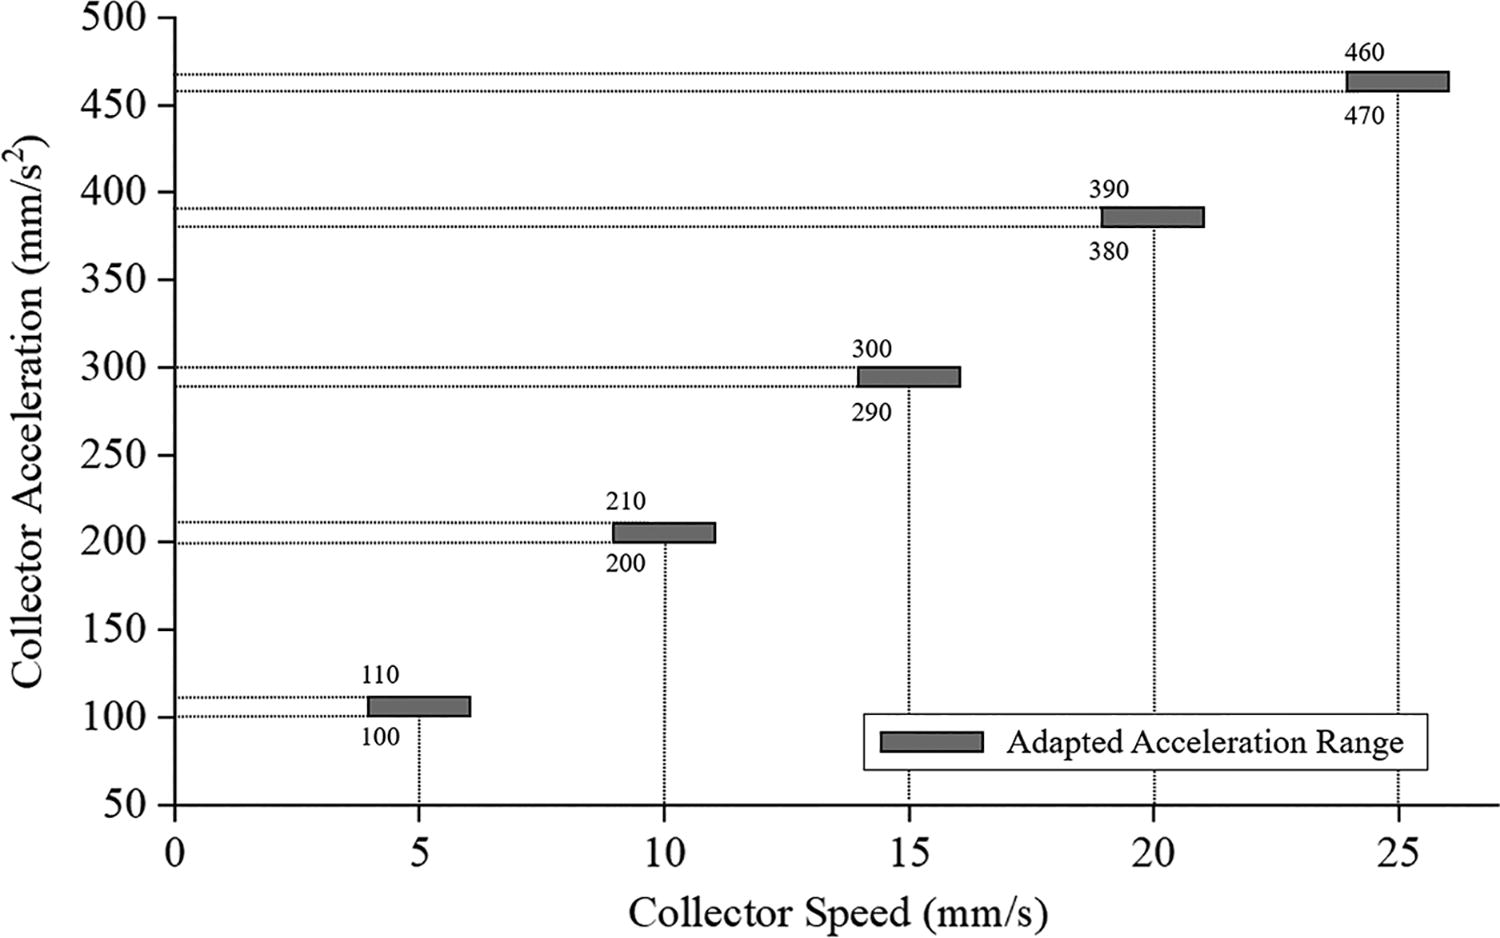
The most adapted acceleration range in the exploring experiments group is in Table 1.
In addition, in order to explore the relationship of the jet deposition between nozzle height and collector acceleration, other experiments are carried out. It is setting up different nozzle height experimental groups at the same collector speed, as shown in Table 2.
The Setting Parameters in Nozzle Height and Collector Acceleration Exploring Experiment
When the nozzle height increases, and at the same collector speed and acceleration, the jet deflection angle
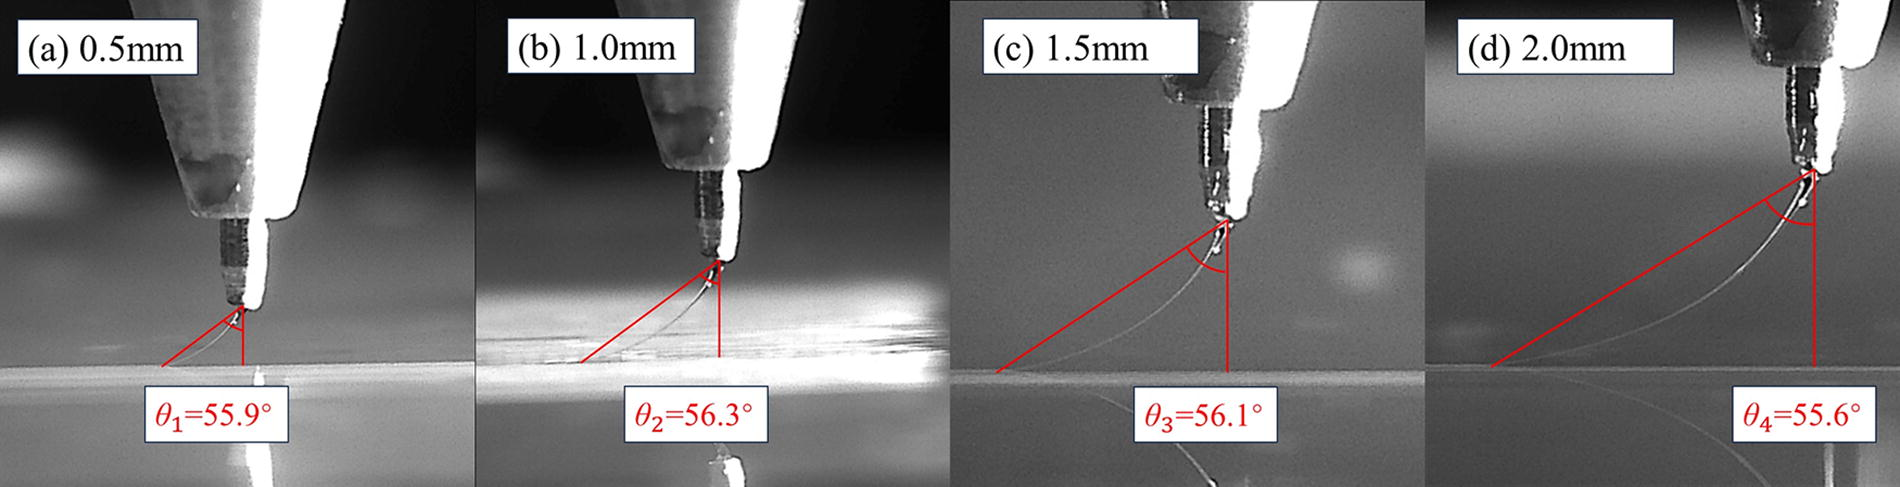
Different nozzle height parameter and their corresponding jet image data from the experiments.
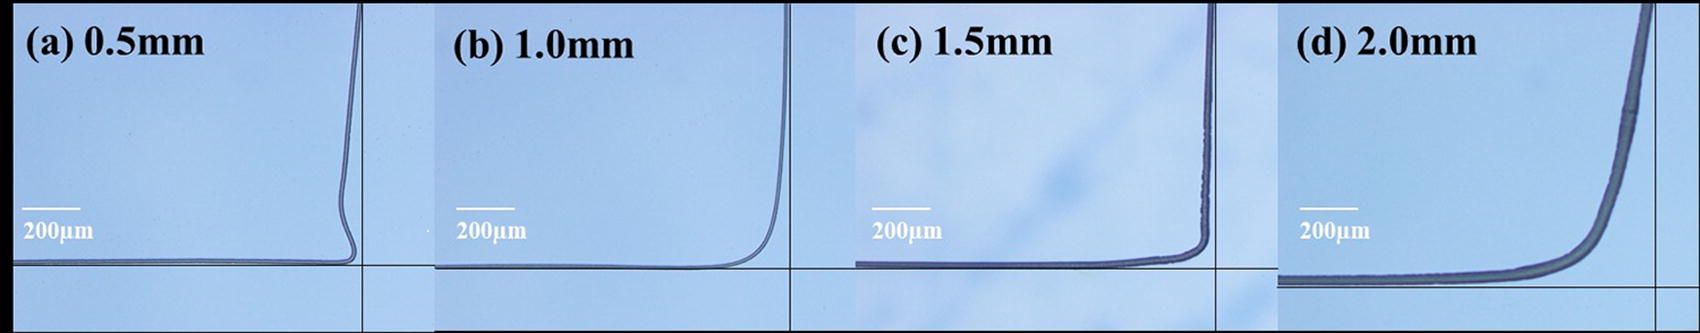
Different nozzle heights can cause different jet deposition under the same collector speed and acceleration.
Next, in order to explore the relationship of the jet deposition between heating temperature and collector acceleration, the following experiment is carried out. It sets up different heating temperature experimental groups at the same collector speed, as shown in Table 3.
The Setting Parameters in Heating Temperature and Collector Acceleration Exploring Experiment
The Setting Parameters in Comparative Experiments to Intuitively Present the Deposition Difference
The heating temperature has a significant effect on the fluidity of PCL. As the heating temperature increases, the viscosity of PCL decreases, and the fluidity increases. When the collector speed is 10 mm/s and remains unchanged, the jet deflection angle
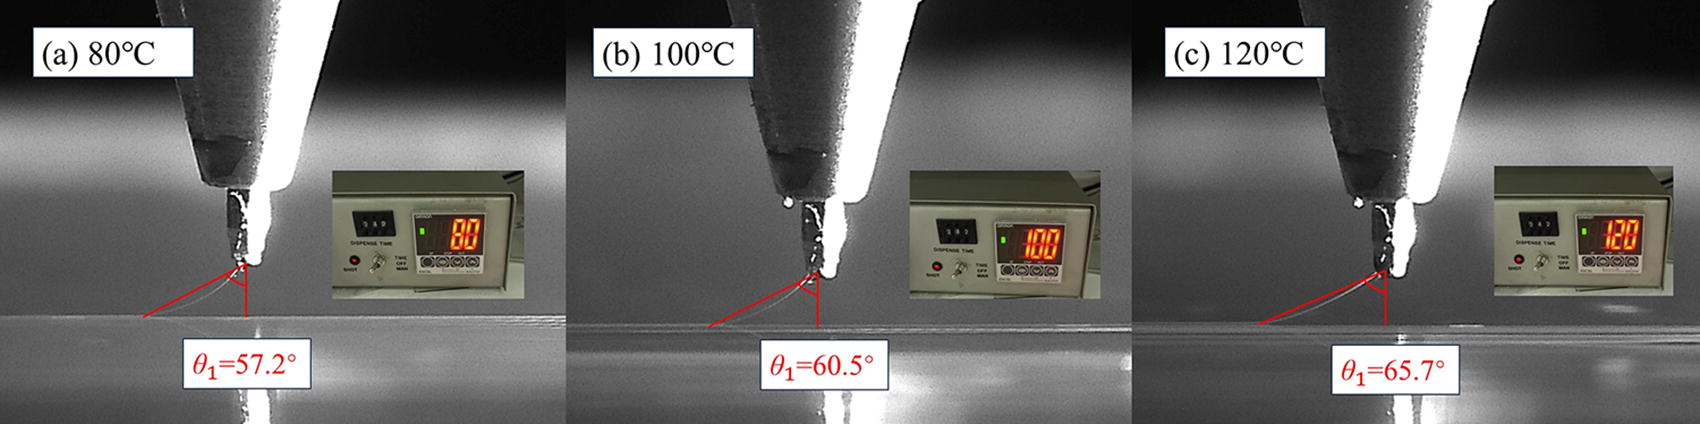
Different heating temperature parameter and their corresponding jet image data from the experiments.
When the collector speed and acceleration remain unchanged, the higher heating temperature could lead to a larger jet deflection angle
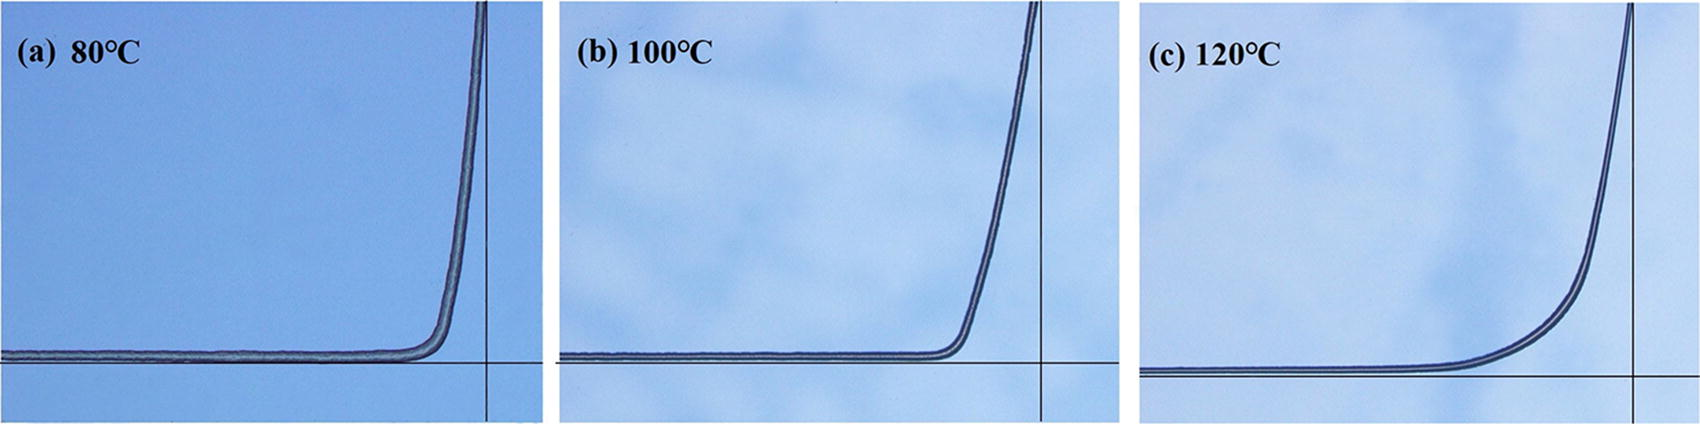
Different heating temperatures can cause different jet deposition under the same collector acceleration.
The above research shows the difference in jet deposition effect between adjusted acceleration and the unadjusted one. In order to more intuitively present the difference in deposition effect between them, comparative experiments were carried out and analyzed in the following parameter settings, as shown in Table 4.
Continuous zigzag patterns were printed under the above process parameters, and the printing results are shown in Figure 12. The design trajectory of the zigzag pattern is the yellow line in Figure 12. The comparative experiment shows that after adjusting and matching the adapted acceleration, the offset of printing the zigzag pattern with 200 mm/s2 , as shown in Figure 12 (b), is closer to the actual designed trajectory than 1000 mm/s2 without adjusting acceleration, as shown in Figure 12 (a). Especially at the turning corners, the inevitable offset is very slight and consistent with the designed trajectory.
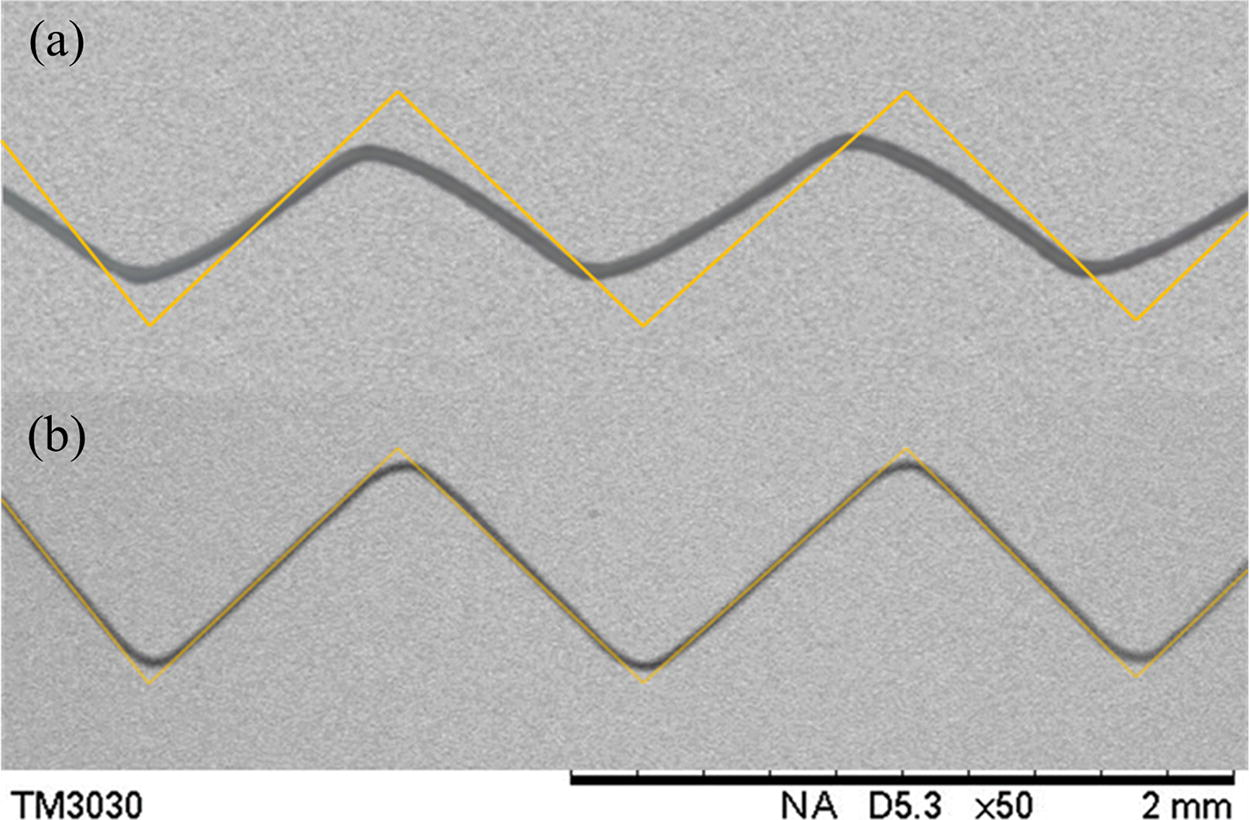
The zigzag printing pattern without the adjustment of acceleration
On the contrary, the deposition trajectory with the 1000 mm/s2 has a faster and stronger turning effect and trend due to the lack of adjustment and matching the adapted acceleration. Under the influence of the faster and stronger cornering, the falling and undeposited jet has a greater offset between the designed trajectory and the turning corners. Before reaching the turning corners, the falling jet has been restrained and stretched by the beginning of the subsequent displacement in the designed trajectory. As a result, the overall printing morphology is more inclined to the serpentine shape, and the offset between the turning corners and the designed trajectory is much larger than that of the 200 mm/s2.
In order to more intuitively compare the offset relationship between the designed trajectory and experimental trajectory with the adjusted and unadjusted acceleration, the three types of trajectories are extracted and overlapped in Figure 13. It can be seen that the zigzag pattern printed with adapted acceleration can effectively improve the deposition precision when other process parameters remain unchanged. When the adapted acceleration is adjusted, the trajectory has a relatively slighter offset at the turning corner, which is consistent with the designed trajectory. This is an acceleration discussion that has not been mentioned in other studies.
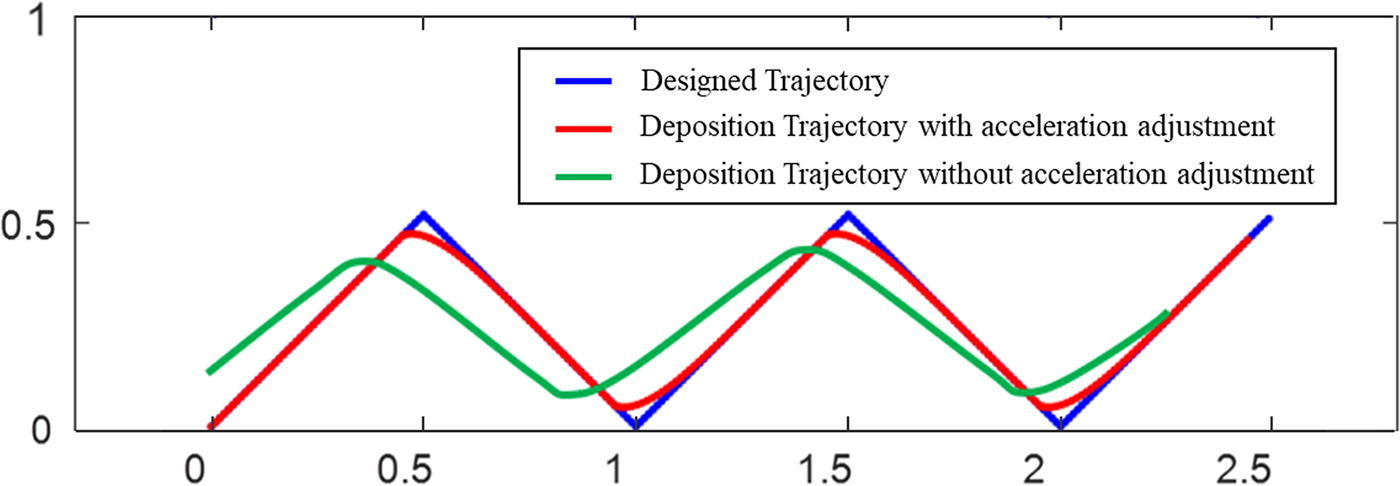
The printing zigzag pattern compares with the designed trajectory by overlapping the data point.
Since this research only studies the MEW parameter called “acceleration”, acceleration is explained here additionally. As a physical quantity, acceleration is the rate at which the change of velocity over time is evaluated. In MEW, this parameter file is only related to the performance of X and Y-axis motors in the collector, which is a hardware parameter inherent to the motor. It mainly determines the time trend of the collector starting and stopping in one direction. The acceleration parameters can be set directly through the software interface, as shown in Figure 14. Therefore, before each printing experiment, the value of acceleration can be set in the software to adjust different accelerations and print patterns.
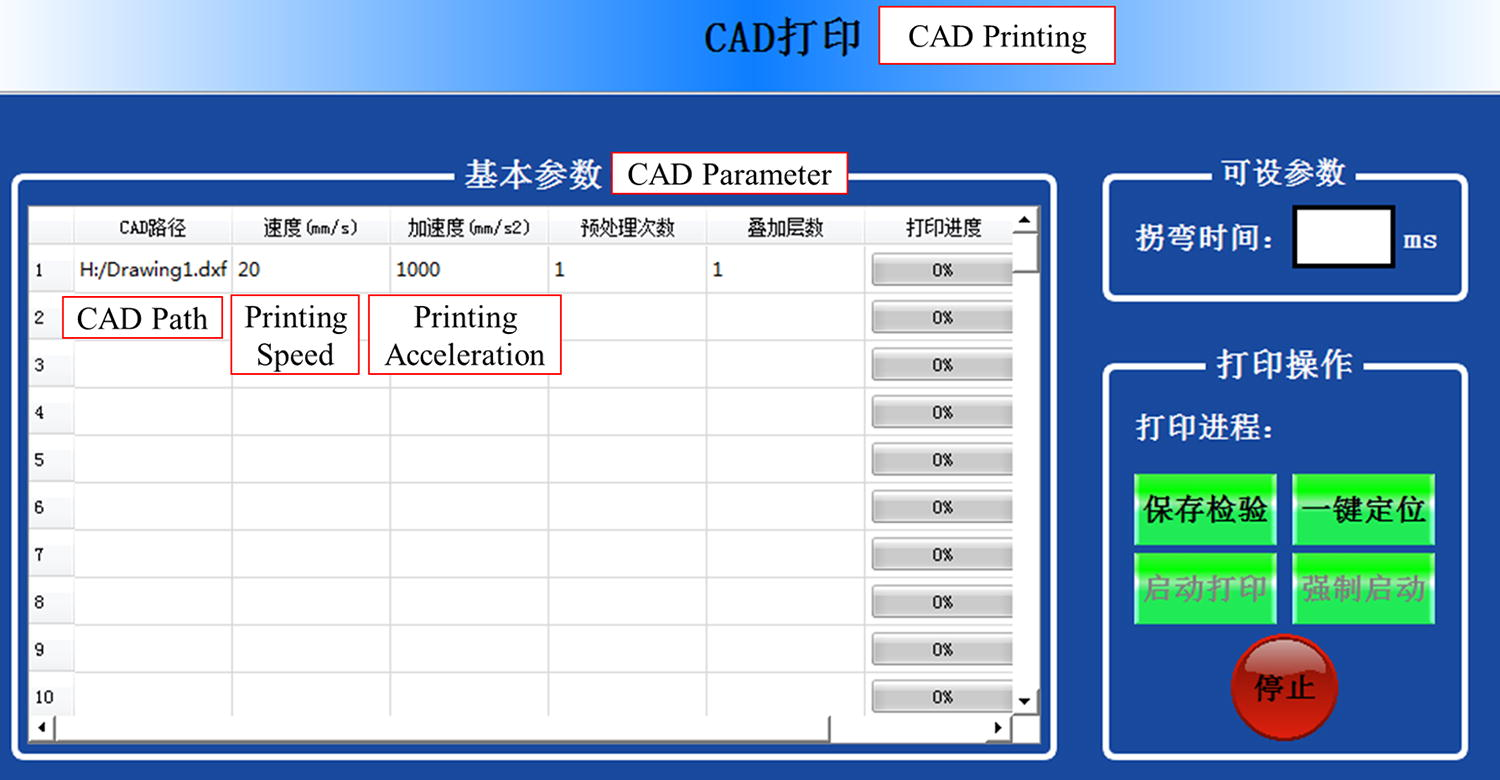
The software interface to adjust the acceleration parameter for high-precision deposition trajectory printing.
Conclusions
There is little research on adjusting collector acceleration parameters to achieve precise deposition in MEW technology, especially at the corners. The experiments confirmed that the collector acceleration also affects the deposited performance around the corners, and in the same acceleration, different process parameters (such as nozzle height and heating temperature) have different deposited performance around the corner. With further research, it is expected to establish an acceleration adjustment database to guide the high-precision deposition of complex patterns in MEW. Different speeds will lead to different jet deflection angles
Footnotes
Acknowledgments
The authors wish to thank the Foshan Lepton, Precision Measurement and Control Technology Co., Ltd during the use of the near-field writing equipment M01. The authors also sincerely thank Jihua Laboratory for providing testing instruments.
Authors’ Contributions
All authors contributed to the study’s conception and design. W.O., H.Wa., and D.Z.: investigation, methodology, writing—original draft and writing—review and editing. M.L., and Z.W.: validation. J.Z.: writing—original draft. J.H., and N.C.: software and visualization. W.H., and Z.Z.: funding acquisition and supervision.
Author Disclosure Statement
The authors declare no competing interests.
Funding Information
This work was financially supported by the National Science Foundation of China (Grant No.62171142), the National Science Foundation of Guangdong Province (Grant No.2023A1515010945), and the Jihua Laboratory Foundation of the Guangdong Province Laboratory of China (No.X190071UZ190).