
Abstract
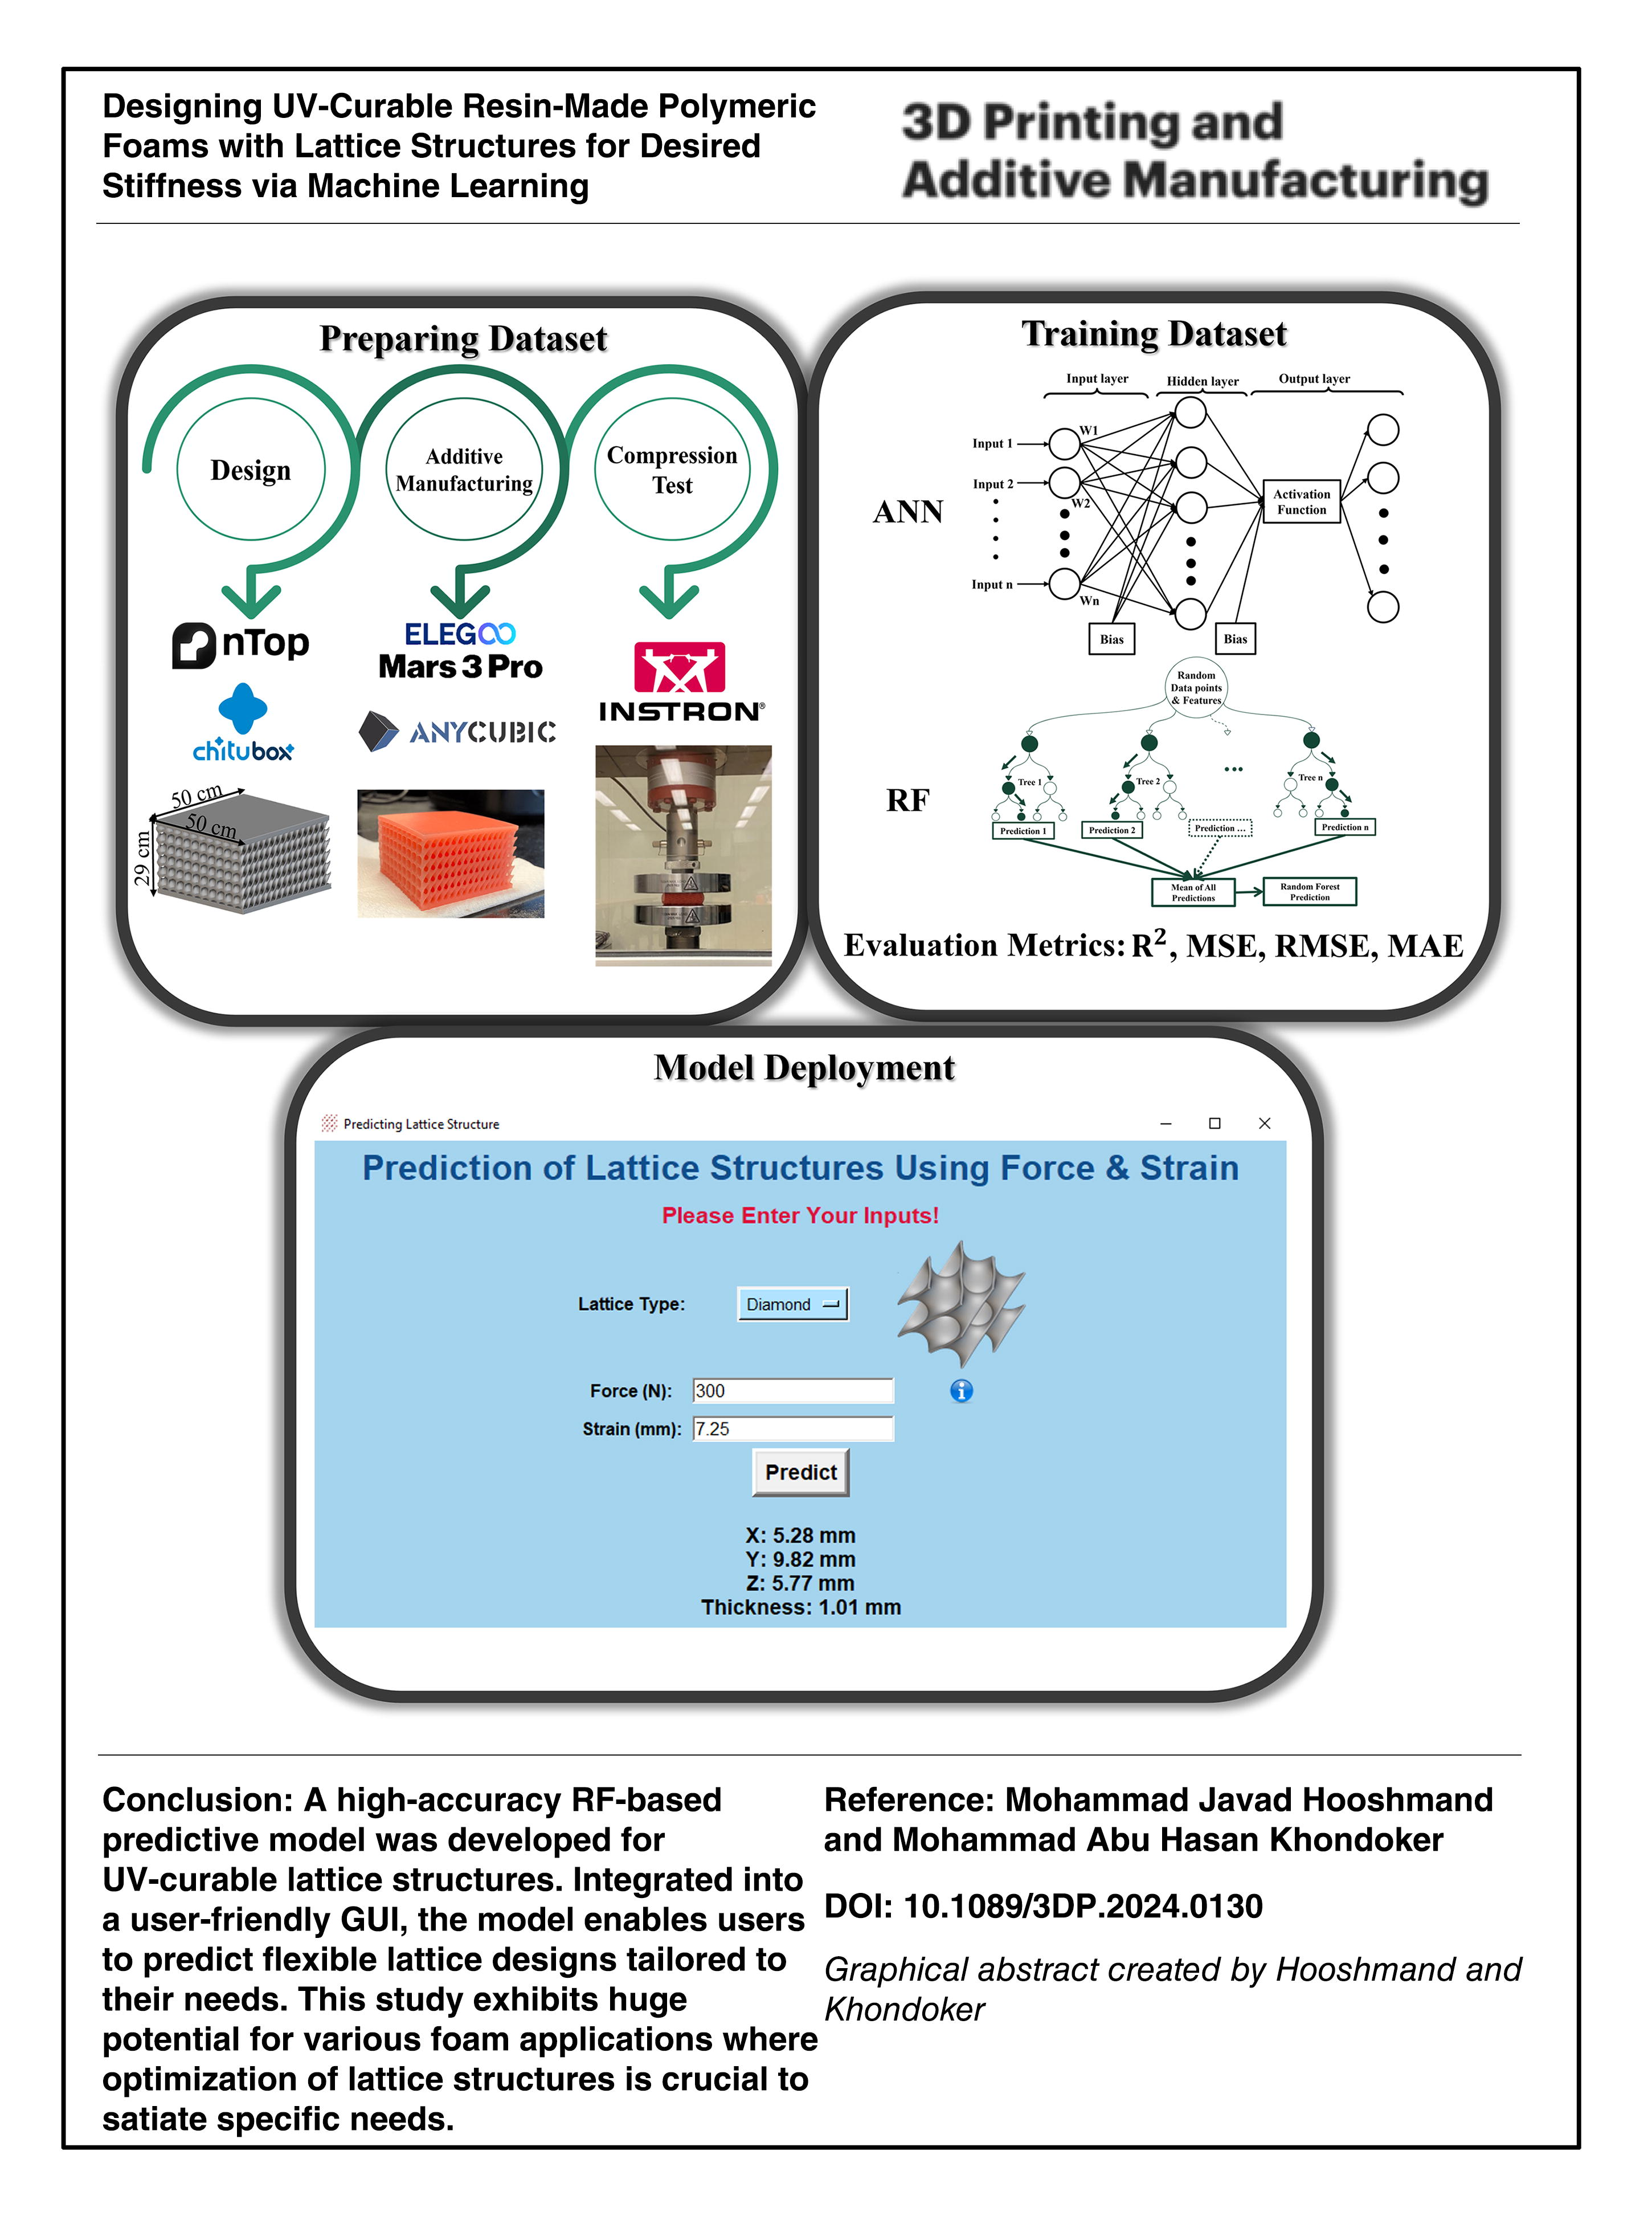
Several industries extensively utilize polymeric foams due to their exceptional characteristics. The mechanical properties of a foam structure play a significant role in compression, so it is necessary to optimize foam deformation to achieve the desired outcome. The cell structures of foams are created randomly, but the issue has been resolved by lattice structures. Compared with traditional foams, lattice structures can enhance mechanical properties and facilitate the development of novel applications. Despite extensive research on lattice structures in both rigid and soft materials, there is a notable lack of predictive modeling specifically for soft thermoset Ultraviolet (UV)-curable lattice structures. This study employs additive manufacturing (AM) and machine learning (ML) to address this discrepancy. In this work, 93 lattice designs were produced using AM and evaluated for their geometric structure through compression tests utilizing ML techniques, specifically artificial neural network (ANN) and random forest (RF). The process involves the preparation of data, training of ML models, and evaluation. The RF model surpasses ANN model and is the most effective at predicting lattice geometries using force, strain, and lattice-type inputs in a graphical user interface. Hence, this study improves ML comprehension and utilization in the design of lattice structures to optimize the performance of soft materials across diverse applications.
Introduction
Humans initially used strong but heavy materials such as concrete and steel for construction; however, they eventually discovered that the cellular structure of natural materials such as wood could increase durability and reduce weight, making structures stronger and more flexible. 1 This transformation into a foam-like structure offers benefits such as increased strength, energy absorption, thermal insulation, electrical resistance, and filtration capabilities.2,3 Polymer foams, which were developed in the late 1920s, are one of the most popular cell architectures. 4 However, in the 1990s, foam faced recycling challenges. Concerns about climate change caused the use of foam in food and beverage packaging to transition to alternatives based on paper. Because of this modification, foam is no longer a noticeable primary component but rather a hidden element that offers support and its supportive qualities could be beneficial for various applications, including the military, floating devices, cars, sports equipment, health care, electronics, and cosmetics. 5
In light of these hidden qualities, foams are essential in many uses, especially in lightweight structures, where they offer insulation, packaging, and cushioning. 6 In this application, it is imperative to consider aspects such as compressive loads and strain optimization. Therefore, it is necessary to customize foam deformation to suit specific applications.5,7 Polyurethane is a versatile foam that is commonly employed in various applications. Polyurethane foam’s flexibility and open-cell structure make it suitable for applications such as cushioning, footwear, seat pads, and other areas where its distinctive combination of properties is advantageous.8–12
Building on the importance of tailored properties, researchers know that microstructures have a big effect on how materials behave, especially when they are looking for alternatives to foam, since foam’s random microstructure makes design flexibility hard.2,8,13 One alternative, lattice structures, created by replicating three-dimensional (3D) mesoscale unit cells, offers versatility and multifunctionality, yielding a range of desirable qualities such as high strength-to-weight ratios, enhanced stiffness, energy absorption capabilities, and improved thermal insulation. Controlling mesoscale characteristics at the cellular level makes it possible to create macroscale material features for a variety of technical applications. 3
Continuing with the exploration of structural innovations, the introduction of lattice structures aims to produce strong, lightweight constructions by minimizing material usage or maximizing lightness. These structures can transfer stresses primarily through axial tension or compression without bending.14,15 Their geometric shapes, which can come from natural processes or mathematical design, make them good at energy absorption and heat dissipation.16–18
Lattice structures, categorized as either rigid or soft, have received significant research attention due to their distinctive mechanical characteristics and potential applications. Prior research has primarily concentrated on the design aspect of rigid structures while fewer studies have explored soft lattice structures. For rigid lattice, this has been achieved using theoretical models, numerical simulations, and experimental investigations to understand how these structures react in different situations, particularly in terms of their compression characteristics.19–21
Additive manufacturing (AM) is a process that builds any objects by adding layers of material. This technology enables the creation of complex designs and minimizes material waste, in contrast to conventional manufacturing techniques. 22 The versatility in the choice of materials and the ability to produce items as needed have the potential to revolutionize conventional manufacturing techniques. 23 AM techniques are essential for fabricating complex lattice geometries, as conventional methods such as machining and injection molding are impractical, resulting in significant progress in creating periodic lattices across diverse materials.24–27
As AM technology evolves, it has made significant strides in creating porous materials with unique shapes and properties. Unlike traditional methods, AM can produce 3D structures with customized designs for specific purposes. 28 A particular advantage is its ability to create graded lattice structures. These structures have varying material properties throughout, which improves their performance in areas such as cushioning, lightweight design, and stress management. For example, graded cushioning materials can better absorb shocks, lightweight structures can be stronger while using less material, and graded lattices can distribute stress more evenly. 29
Following this trend, many researchers in the field of soft lattice have focused their efforts on utilizing homogeneous components in diverse applications. Advancements in soft robotics are being made through innovative design strategies that focus on enhancing flexibility, load-bearing capacity, and functional diversity. 30 The design may be useful in deformable arms, hand manipulation, and exoskeletons, according to Weeger et al. 31 Advances in AM allow the digital generation and nonlinear assessment of soft lattice structures with curved components, improving structural integrity and mechanical functionality by precisely managing local stiffness and simulating large deformations. Graziosi et al. 32 investigated the impact of bending forces on the deformation and energy absorption of flexible lattice structures, particularly Kelvin and body-centered cubic designs, as well as the influence of printing procedures. The experiment used thermoplastic polyurethane.
Holmes et al. 18 investigated the practicality of using flexible AM Gyroid structures as substitutes for traditional polyurethane foams. They made systematic modifications to the mechanical properties of these structures to achieve compressive responses like those of elastomeric foams. This highlights the versatility and potential of soft lattice structures in various engineering applications. Li et al. 33 investigated how the design of a structure affects its mechanical efficiency. They did this by looking at the design and compressive behavior of 2D photosensitive resin lattice structures with cores that have different cross-sections. The findings demonstrated that specific core designs result in material use enhancements, underscoring the importance of structural design in improving mechanical efficiency. Ge et al. 34 demonstrated that the AM thermoplastic polyurethane Kelvin foam exhibits favorable characteristics in terms of resilience and energy absorption. This characteristic made it an appropriate material for packing applications that require exceptional cushioning capabilities.
Emphasizing the critical factors in material design, cell topology, cell size, and strut widths all have an impact on the lattice cell compressive response. 35 Stretch-dominated unit cells are stronger and stiffer, whereas bending-dominated ones absorb more energy. 36 Guo et al. 37 discovered that the compressive strengths and energy absorption of lattice structures change with the relative density. This means that deformation is dominated by stretching and bending, and energy absorption is very high at low relative densities. Dwyer et al. 38 determined that different cell types have an impact on the compression behavior of lattice structures by affecting mechanical parameters such as anisotropic modulus, strength, energy absorption, relative density, and Young’s modulus.
To build on the understanding of lattice performance, Poddar et al. 39 studied open-cell, closed-cell, and triply periodic minimal surface (TPMS) unit cells. The study examined lattices at different relative densities and under different loading conditions. In another study, 40 they demonstrate TPMS structures’ improved compressive behavior over honeycomb and foam. According to this study, TPMS structures that remain unaffected by loading exhibit a higher bearing capacity during collapse, an elastic response, a progressive compression stroke, and an ultimate densification stage. Shi et al., 41 Vafaeefar et al., 42 and Şimşek et al. 43 discovered that different cell types have an impact on the deformation mode and thus modify the compression behavior of lattice structures.
These investigations comprehensively examined the influence of different cell types on the compressive properties of soft lattice structures, revealing a significant dependence on the cell type. This highlights the need to select a customized cell type based on specific application requirements. Most of these studies focused on investigating the impacts of different TPMS lattice structures, conclusively demonstrating their superiority for applications that prioritize comfort.
By manipulating and optimizing unit cells, lattice materials produced by AM provide a precise answer to the limits of conventional foam. 2 Using AM to make lattice structures, especially with polymer and resin-based materials, has a lot of benefits. It is true that traditional polymer foams with random pores generally perform well under repeated loading, but AM-processed lattice-based foams could offer similar potential if the lattice geometry and parameters are optimized to enhance energy absorption and damping. This optimization would help extend the foam’s lifespan. 44 Although this study does not focus on customizing the lattice structure’s geometry, machine learning (ML)-assisted optimization of lattice parameters could allow us to design foams with superior durability under repeated loading.
It is especially true for making soft lattices that can change shape a lot because they are made of rubber-like materials. 32 Because thermoset materials have a permanent curing process that inhibits reshaping, recent studies in AM have investigated the use of thermoset materials in lattice systems for diverse applications.45,46 AM has successfully used thermosets to create complex lattice geometries using process technologies such as stereolithography (SLA) and digital light processing. 47
In AM applications, ML algorithms optimize the mechanical properties of lattice structures, accelerating AM technology and the complex part production industry.16,48,49 ML is poised to have a significant impact on the design and manufacturing processes of complex lattice structures due to its ongoing development and adaptation to the evolving AM domain. 48 Maurizi et al. 50 aimed to utilize ML techniques to predict the compression properties of lattice structures and accurately predict complex mechanical phenomena. Furthermore, the purpose of utilizing ML in the study of Challapalli and Li 51 was to discover new unit cells that have higher capacity than the octet cell, predict the stresses, deformations, and strengths in lattice structures, and evaluate the effectiveness of different lattice unit cells quickly. Şimşek et al. 43 aimed to predict the compressive behavior of TPMS structures using a regression model. They employed Gyroid, Diamond, and primitive specimens that were created with different volume fractions and construction orientations.
Although some academics have focused on predicting lattice structure designs, it is worth noting that none of them have been able to properly forecast lattice geometries of soft materials using ML as far as the authors know. When doing research, the incorporation of five unique lattice structures in TPMS, specifically Schwarz, Gyroid, Diamond, Lidinoid, and SplitP, boosts its worth by offering a wider range of choices for researchers to select their preferred application. These will be more valuable when they are made with materials that are both efficient and appropriate for use in products such as mattresses, toppers, military helmets, and so on.
While the customization of AM lattice structures for applications such as mattresses and toppers utilizing ML holds significant potential, its economic feasibility needs further investigation in future research. Conversely, this approach may be more readily applicable and economically viable in areas such as military helmet manufacturing, where customized lattice structures can reduce weight and decrease acceleration forces, enhancing both comfort and impact mitigation. 52
The goal of this study is to use ML to forecast the mechanical and structural behavior of soft thermoset UV-curable lattice structures made with the masked SLA (MSLA) technique when compressed. These MSLA-produced samples can serve as viable alternatives to traditional foams and withstand compression without breaking. The aim is to establish the design characteristics of these structures, such as cell geometry, wall thickness, and lattice type, to achieve optimal performance across various applications using force and deformation data.
Materials and Methods
Real-world data for ML is beneficial, even though it costs time and money. It captures the complexity and variety of real-world data and controls unknown variables, making models more resilient. Therefore, to create a dataset for this study, lattice structures were designed, sliced, and printed using an MSLA 3D printer. Next, compression tests generated each sample’s force versus displacement curve. All of these steps are described in the following sections.
Design
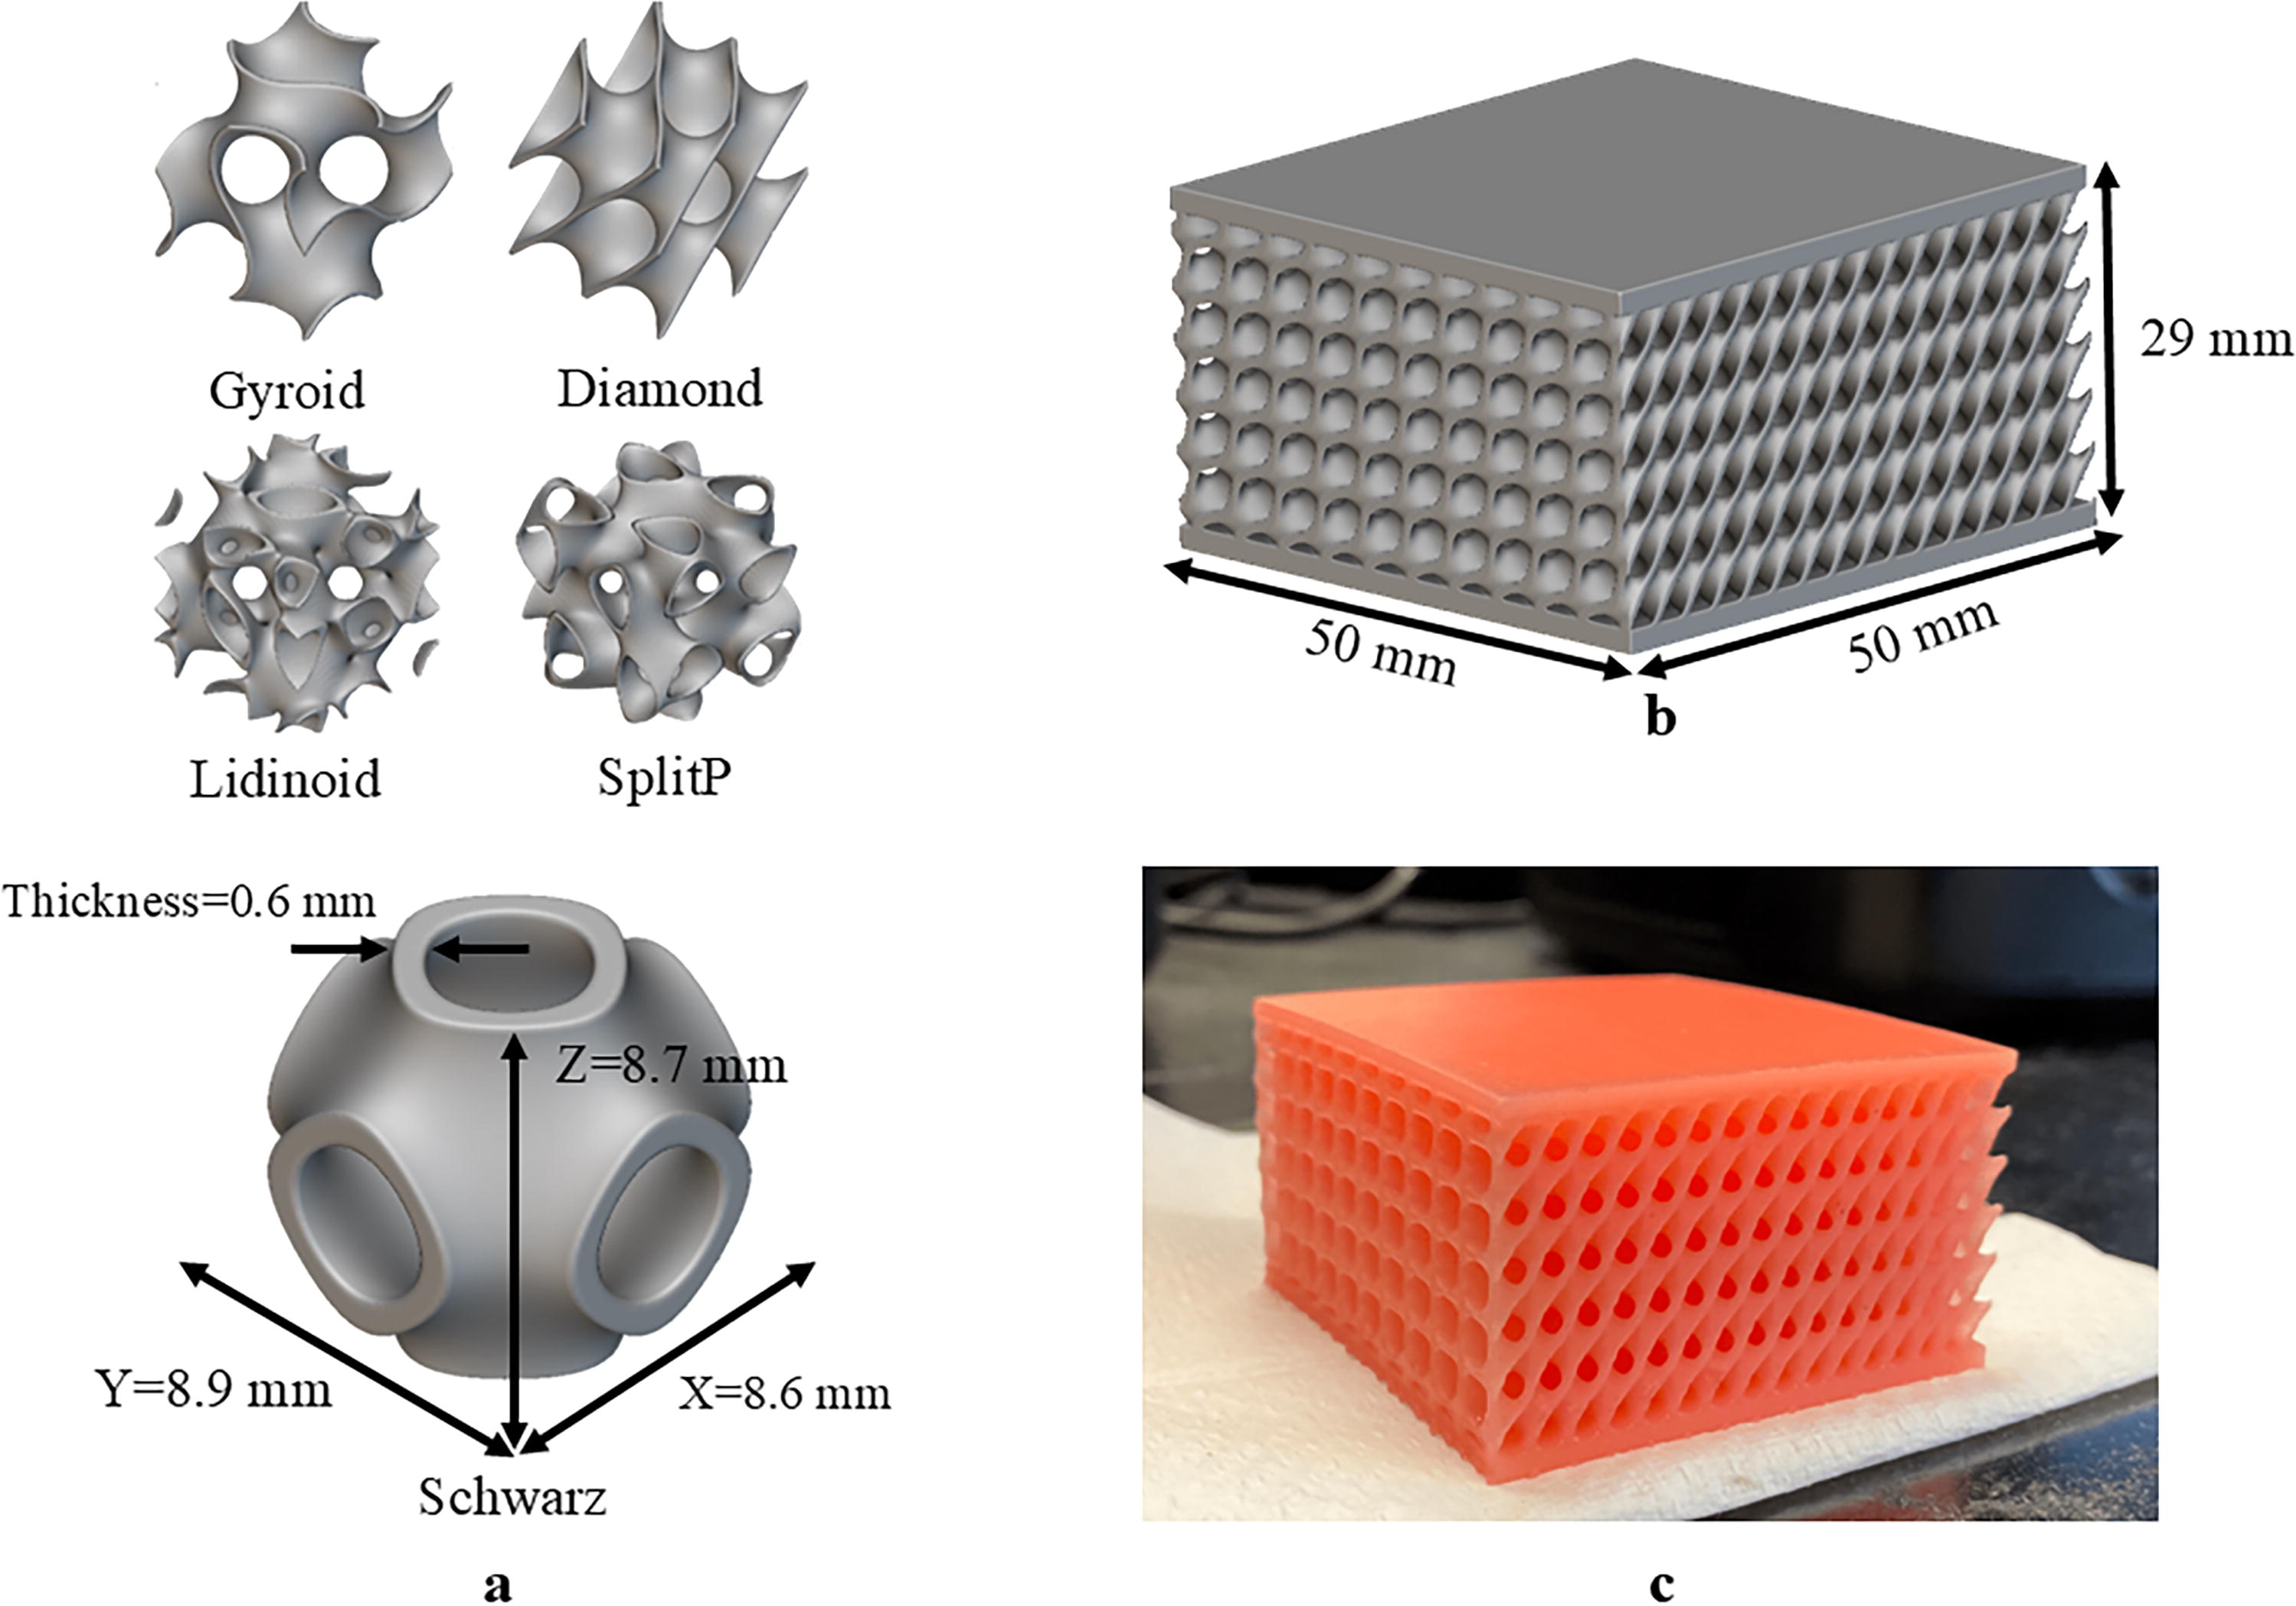
In this study, nTopology (nTop) version 4.0.5, operating under a noncommercial license, served as a tool for the design process. Ninety-three lattice unit cells were designed by using five crucial lattice parameters, namely, lattice type, cell lengths along the X, Y, and Z axes, and cell wall thickness. To choose a TPMS lattice, nTop offers Gyroid, Schwarz, Diamond, Lidinoid, SplitP, and Neovius walled triply periodic minimal surface (WTPMS)-type unit cells. Later, the Neovius lattice type was neglected since its closed cells caused the structure not to be washed and cured completely.
Five lattice types were chosen for this study, as shown in Figure 1(a). Based on domain knowledge and experimentation, values for the X, Y, and Z axes were generated between 5 and 10 mm, while for the thickness, it was 0.5–2.5 mm using Excel’s random function. The primary reason for selecting this method was to introduce variability, thereby simulating real-world conditions that are often unpredictable and not easily represented by fixed parameters. One example of this cell size is demonstrated in Figure 1(a). Lattice cells were repeated in a 50 × 50 × 25 mm³ volumetric body with two 2 mm thick surfaces at the top and bottom. American Society for Testing and Materials (ASTM) D3574-17 compression testing recommends this volume size. Figure 1(b) illustrates a Diamond sample in nTop design and its AM sample is demonstrated in Figure 1(c).
Material and manufacture
The study utilized the F80 Elastic Gingival-like resin, which exhibits a Shore hardness of 50–60 A, indicating a soft texture and remarkable elasticity. The resin quickly regains its original shape after deformation, thereby enhancing its overall longevity. Despite a slight decrease in flexibility, the F80 resin retains its flexibility even in cold temperatures below 10°C, making it suitable for use in various locations and applications year-round. 53 Given the characteristics of F80 resin, utilizing this thermoset and UV-curable resin could be advantageous for products where deformation plays a significant role, such as mattresses, toppers, shoe insoles, and similar applications.
The procedure for AM lattice designs in this study involved using CHITUBOX Basic v1.9.4 as the software for slicing the designs, F80 Elastic Gingival-like resin as the material, an ELEGOO Mars 3 Pro 4K MSLA, and the Anycubic Wash & Cure Plus Machine for postprocessing. The selection of these equipment types was based on their smooth compatibility, ensuring the efficient production of the soft resin material.
The default setting of the MSLA machine is set based on different materials,
54
but for this study, the print settings were derived from the specific configuration for F80 Gingival-like resin by using the ELEGOO MARS 3 PRO, as illustrated in Table 1. CHITUBOX suggests using equation (1) to get the ideal rotation angle for flat structures.
55
This study used an MSLA with a layer height of 0.1 mm and a pixel width of 0.035 mm. The calculated build direction was 70.71 degrees. However, to save printing time, it was decided to use its completion angle, which is 19.29 degrees, and to reduce the printing process time, two samples were printed concurrently with each print as shown in Figure 2. Figure 1(c) shows an example of one printed sample. In this work, 93 samples were printed to perform compression tests, and their printer settings are detailed in Table 2.
The Print Setting of F80 Gingival-Like Resin in the CHITUBOX Software
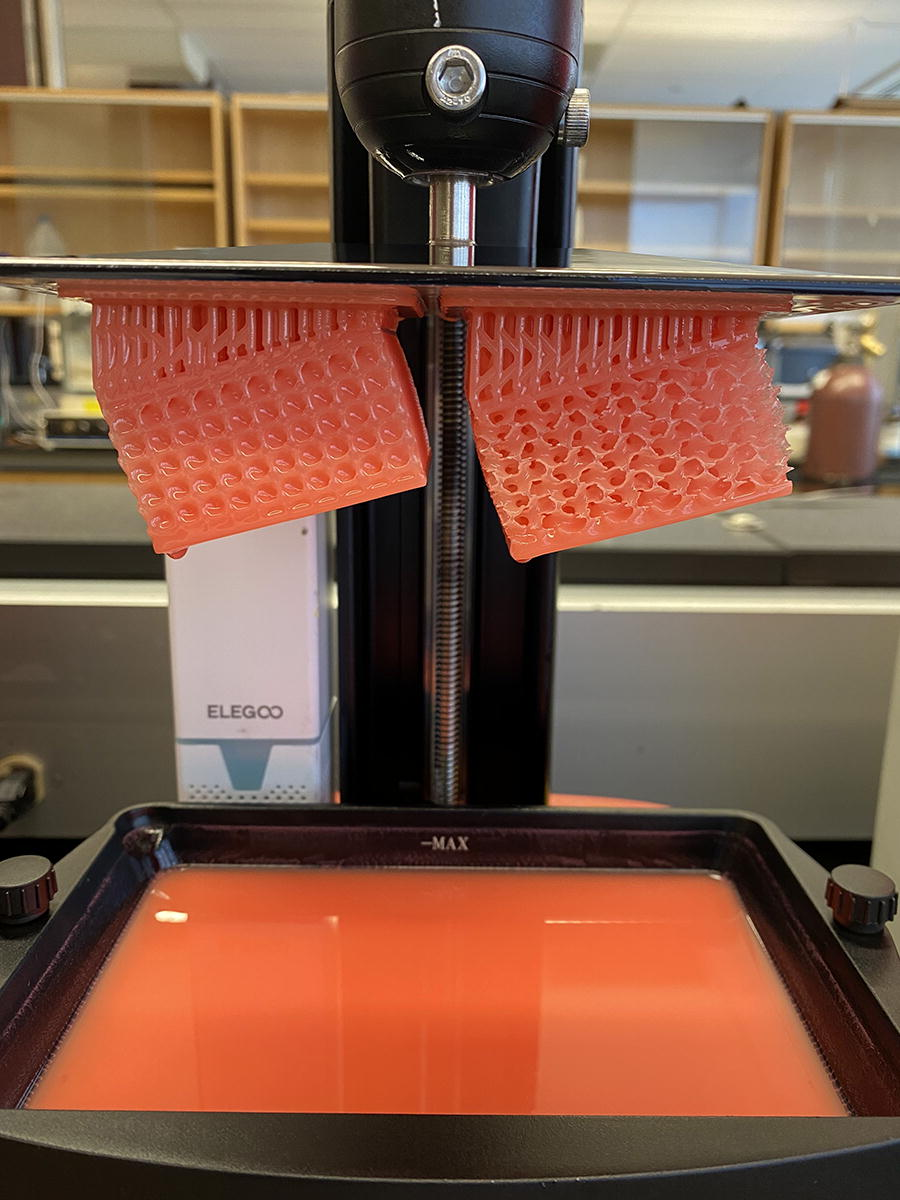
An example of MSLA-printed samples with the angle of 19.29.
Variables for 93 Samples
Compression test
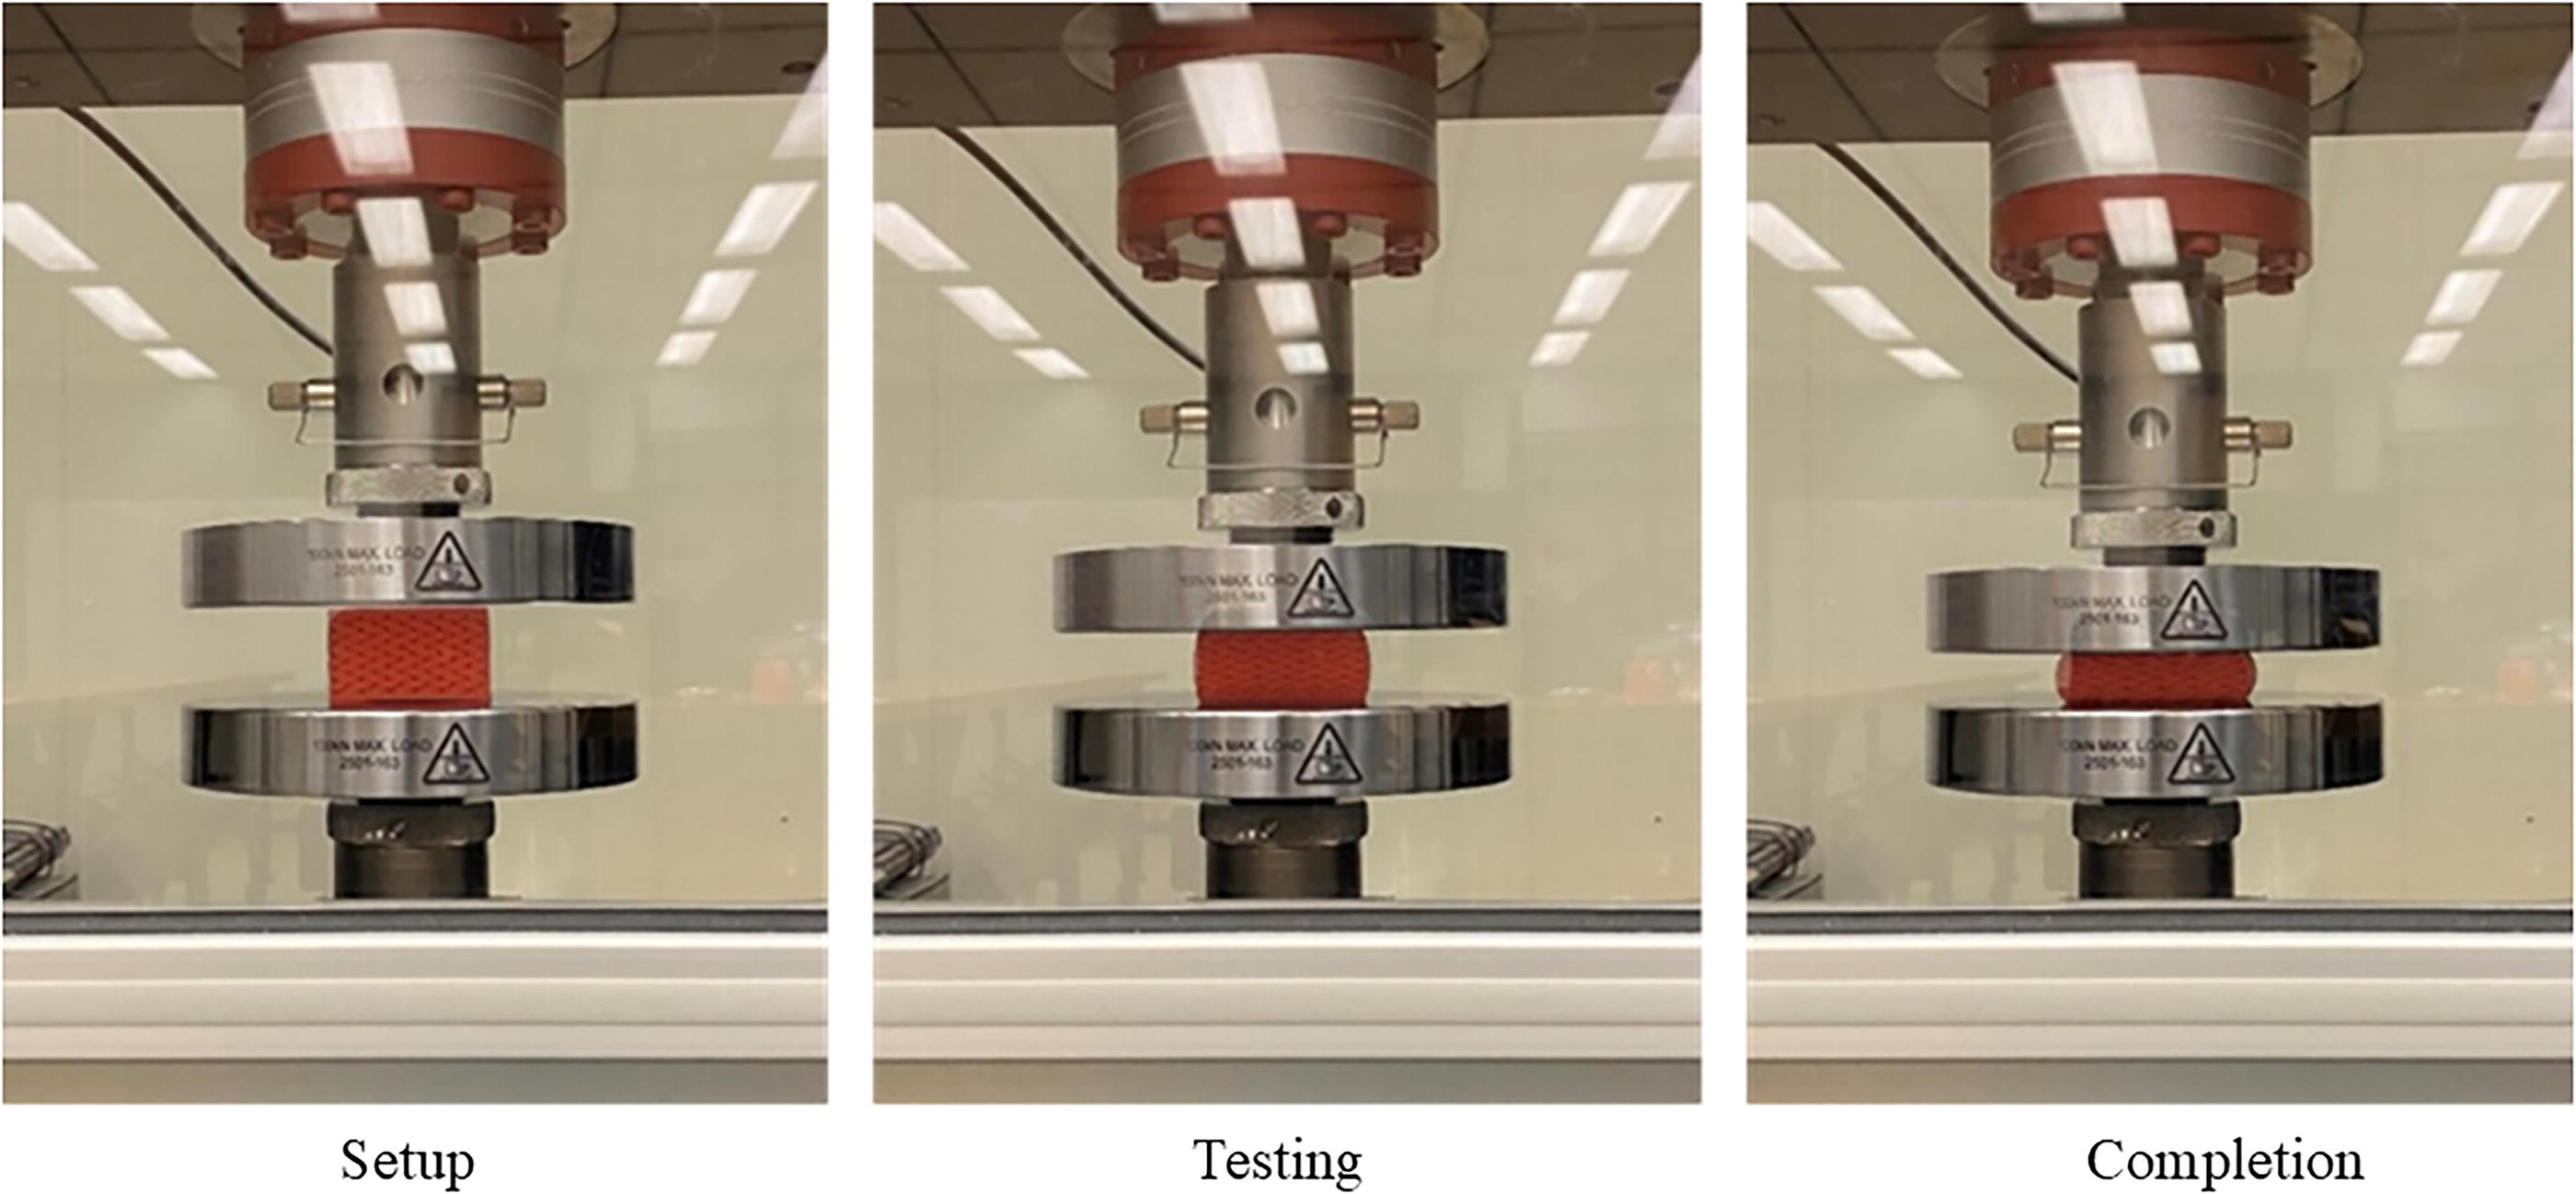
The compression test based on ASTM D3574-17, 56 compression force deflection, was conducted to measure the deformations of these MSLA lattice structures. The compression test was conducted using the Instron 5969 Universal Testing Machine, capable of applying a force of 50 kN to the samples. The apparatus comprises a flat, stationary compression foot, larger than the specimen under test. A force-measuring device attaches the foot, positioning it to deflect the specimen at a maximum speed of 600 mm/min.
This machine is compatible with Bluehill® Universal software. In the software, the ASTM D3574-17 setup was defined as the force required to apply 50% compression from the top surface of the lattice samples, which in this study is equal to 14.5 mm. The applied force is measured in Newton, and it applies at a rate of 50 mm/min. Figure 3 displays the compression test steps for sample number 76 before the test begins, at 50% of the test, and after the completion of the test.
Steps of applying force on MSLA samples.
Method and implementation
ML is a branch of artificial intelligence that uses data and algorithms to imitate the cognitive processes of human learning, thereby improving its accuracy and effectiveness as it continues to learn. It entails providing a large amount of information to a machine to aid in learning, predicting, recognizing patterns, or classifying data. 57 ML is useful for predicting patterns in lattice structures, enabling the development of efficient prediction models that aid in the design of materials with specific characteristics.58,59 It can assist in the discovery of novel, optimal unit cells, leading to lattice constructions with higher load-carrying capacities. 58 To improve AM lattice design, ML examines the relationship between lattice structural properties and mechanical performance. The ability to recognize nonlinear correlations between AM process parameters and mechanical characteristics speeds up the development of new materials and production methods. 60
The dataset for this research was obtained through compression testing, as previously explained, and a total of 76,761 data points were collected for 93 samples. Data preprocessing greatly affects ML model performance, requiring a lot of effort to get a valid result. For coding purposes, the authors used the JupyterNotebook IPython 7.31.1 environment and Python programming language version 3.9.13. The execution took place on a system configuration consisting of an 11th Generation Intel® Core™ i5 central processing unit (CPU) with four cores and a clock speed of 2.40 GHz, together with 8.00 GB of RAM, running on the Microsoft Windows 11 Home operating system.
The dataset in this article consists of one categorical variable, lattice type and six numerical variables including cell lengths along the X, Y, and Z axes, cell wall thickness, force, and strain. The method choice, either classification or regression, is dependent on the specific objectives being sought. This study determined that utilizing all data points in their original form, without any modifications, produced reliable results.
The base model for this study was developed by taking force and strain as features, as the objective of the research is to forecast the best lattice structure for a given force and strain. However, it was later shown that considering the lattice type as an additional feature yields superior results. The primary cause of this is the distinct behavior shown by various lattice types under compression. Furthermore, it was revealed that there is a slight correlation between lattice type and thickness, suggesting that considering them as feature and prediction, respectively, could enhance accuracy.
The choice of ML algorithms is influenced by factors such as the data attributes and the complexity of the problem at hand. A recent study with analogous datasets has demonstrated the higher performance and precision of these two methods. 60 This study employs two ML approaches, namely, artificial neural network (ANN) and random forest (RF), on the given dataset as their schematic are shown in Figure 4.
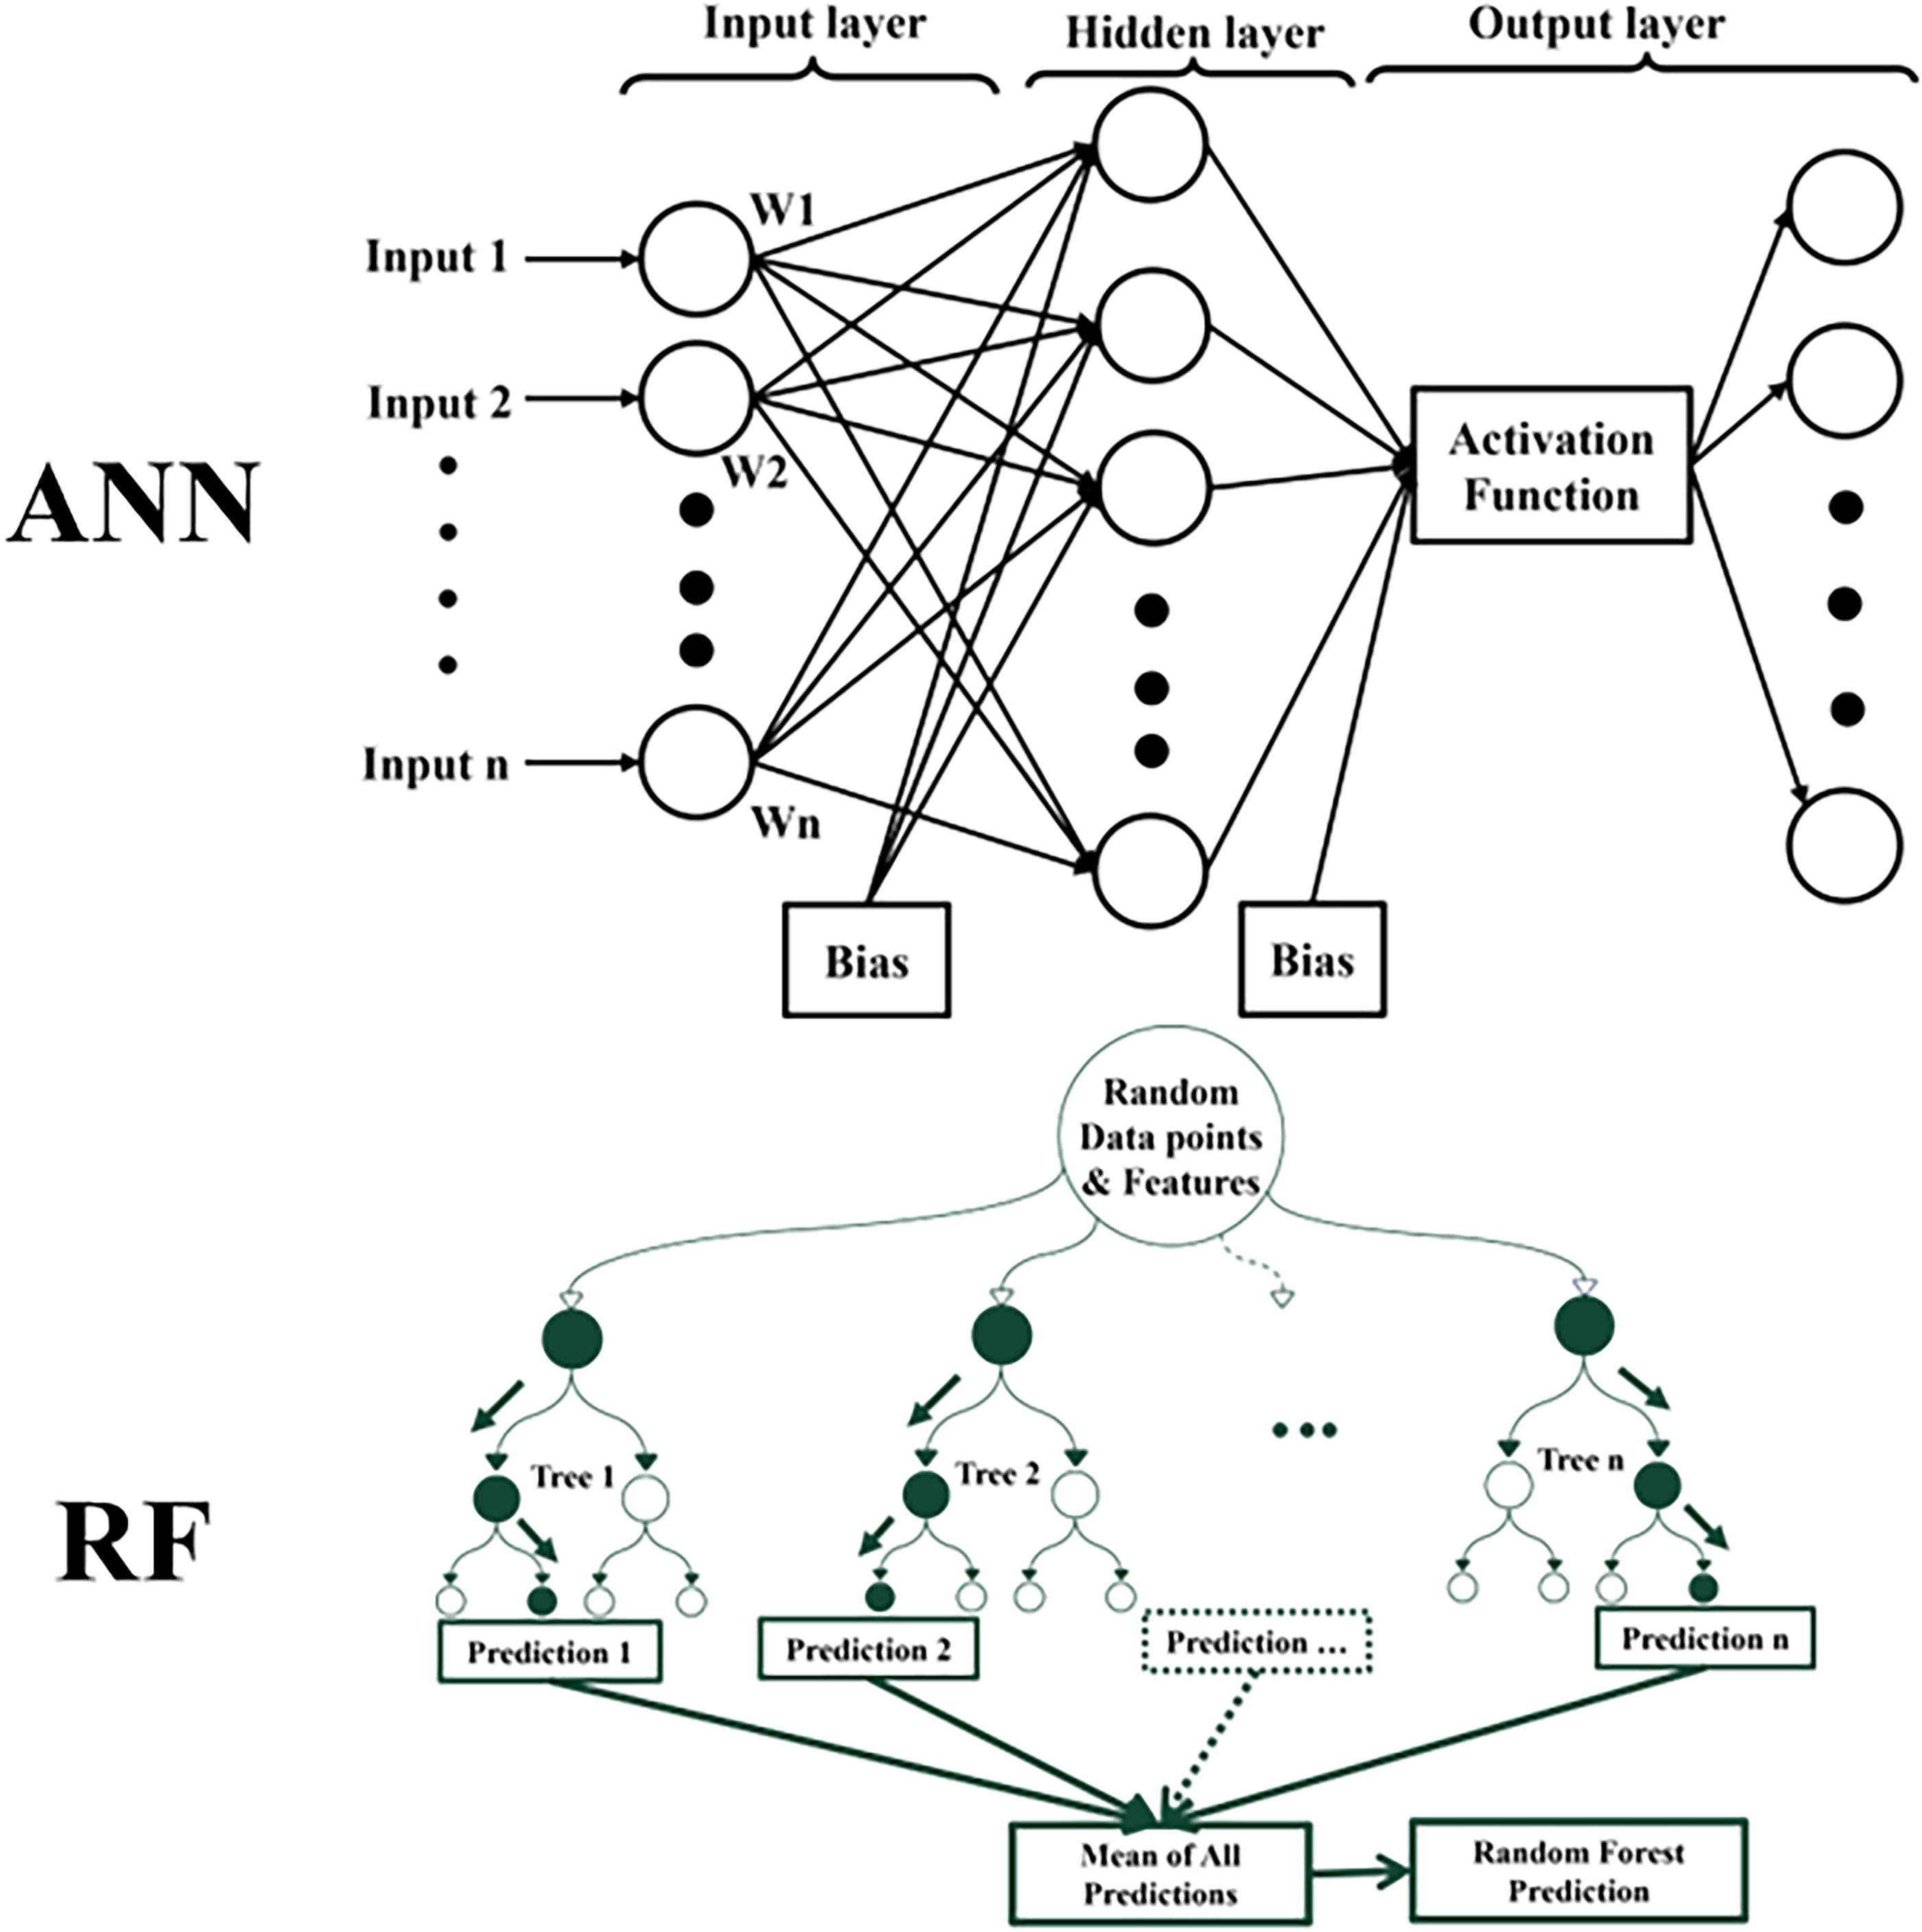
Schematic of ML methods (ANN and RF) used in this study. ANN, artificial neural network; ML, machine learning; RF, random forest.
ANN is a computational framework specifically created to imitate the intricate neural networks found in the human brain. Comprised of several interconnected computer units known as neurons, it carries out intricate computations. Neural networks can capture complex and nonlinear correlations in data because of their deep designs. 61 This study focuses on optimizing the model’s accuracy by tuning hyperparameters such as activation functions, learning rate, batch size, and epochs. The dataset was subjected to Grid Search CV to identify the optimal hyperparameters. 62 The Grid Search CV was performed using five folds.
RF is an ML algorithm that enhances performance by aggregating multiple random decision trees and establishing the final forest prediction through averaging. This approach helps to avoid overfitting and offers benefits such as increased robustness against outliers and an improved ability to make predictions on new data, surpassing the capabilities of individual decision trees. 63 This study also used Grid Search CV to tune hyperparameters such as maximum depth and number of trees.
This study used regression evaluation metrics on the testing dataset to determine the optimal model: R2, mean squared error (MSE), root mean squared error (RMSE), and mean absolute error (MAE). In a regression model, R2 measures the percentage of variance in a prediction variable that can be assigned to features. 64 By squaring each term, MSE amplifies outliers and measures estimator accuracy by consistently giving non-negative values, with closeness to zero indicating higher performance. RMSE measures the residual standard deviation and penalizes excessive errors. MAE shows the average prediction error size, regardless of direction. 65
Results and Discussion
Data preprocessing
This study used a dataset with seven variables. The lattice type is the only category variable, while the other variables, namely, X, Y, Z, thickness, force, and strain, are numerical. There is no requirement to address any missing values in the data preprocessing stage for this dataset. Furthermore, it is unnecessary to reduce the number of dimensions during the data preprocessing phase, as each variable in this raw dataset should be utilized to implement the ML model to accomplish the goals of this study.
Table 3 presents summary statistics for the dataset. This summary facilitates an understanding of the value distribution in each column, assists in identifying outliers, and supports data cleaning efforts. In this table, the term “NaN” indicates that there is no value available for that field and “std” stands for standard deviation. The top five rows represent the summary statistic specifically for the categorical variable, which is why for the numerical fields, they are labeled as NaN. This also applies to other aggregation metrics for the categorical variable.
Summary Statistics of the Datasets
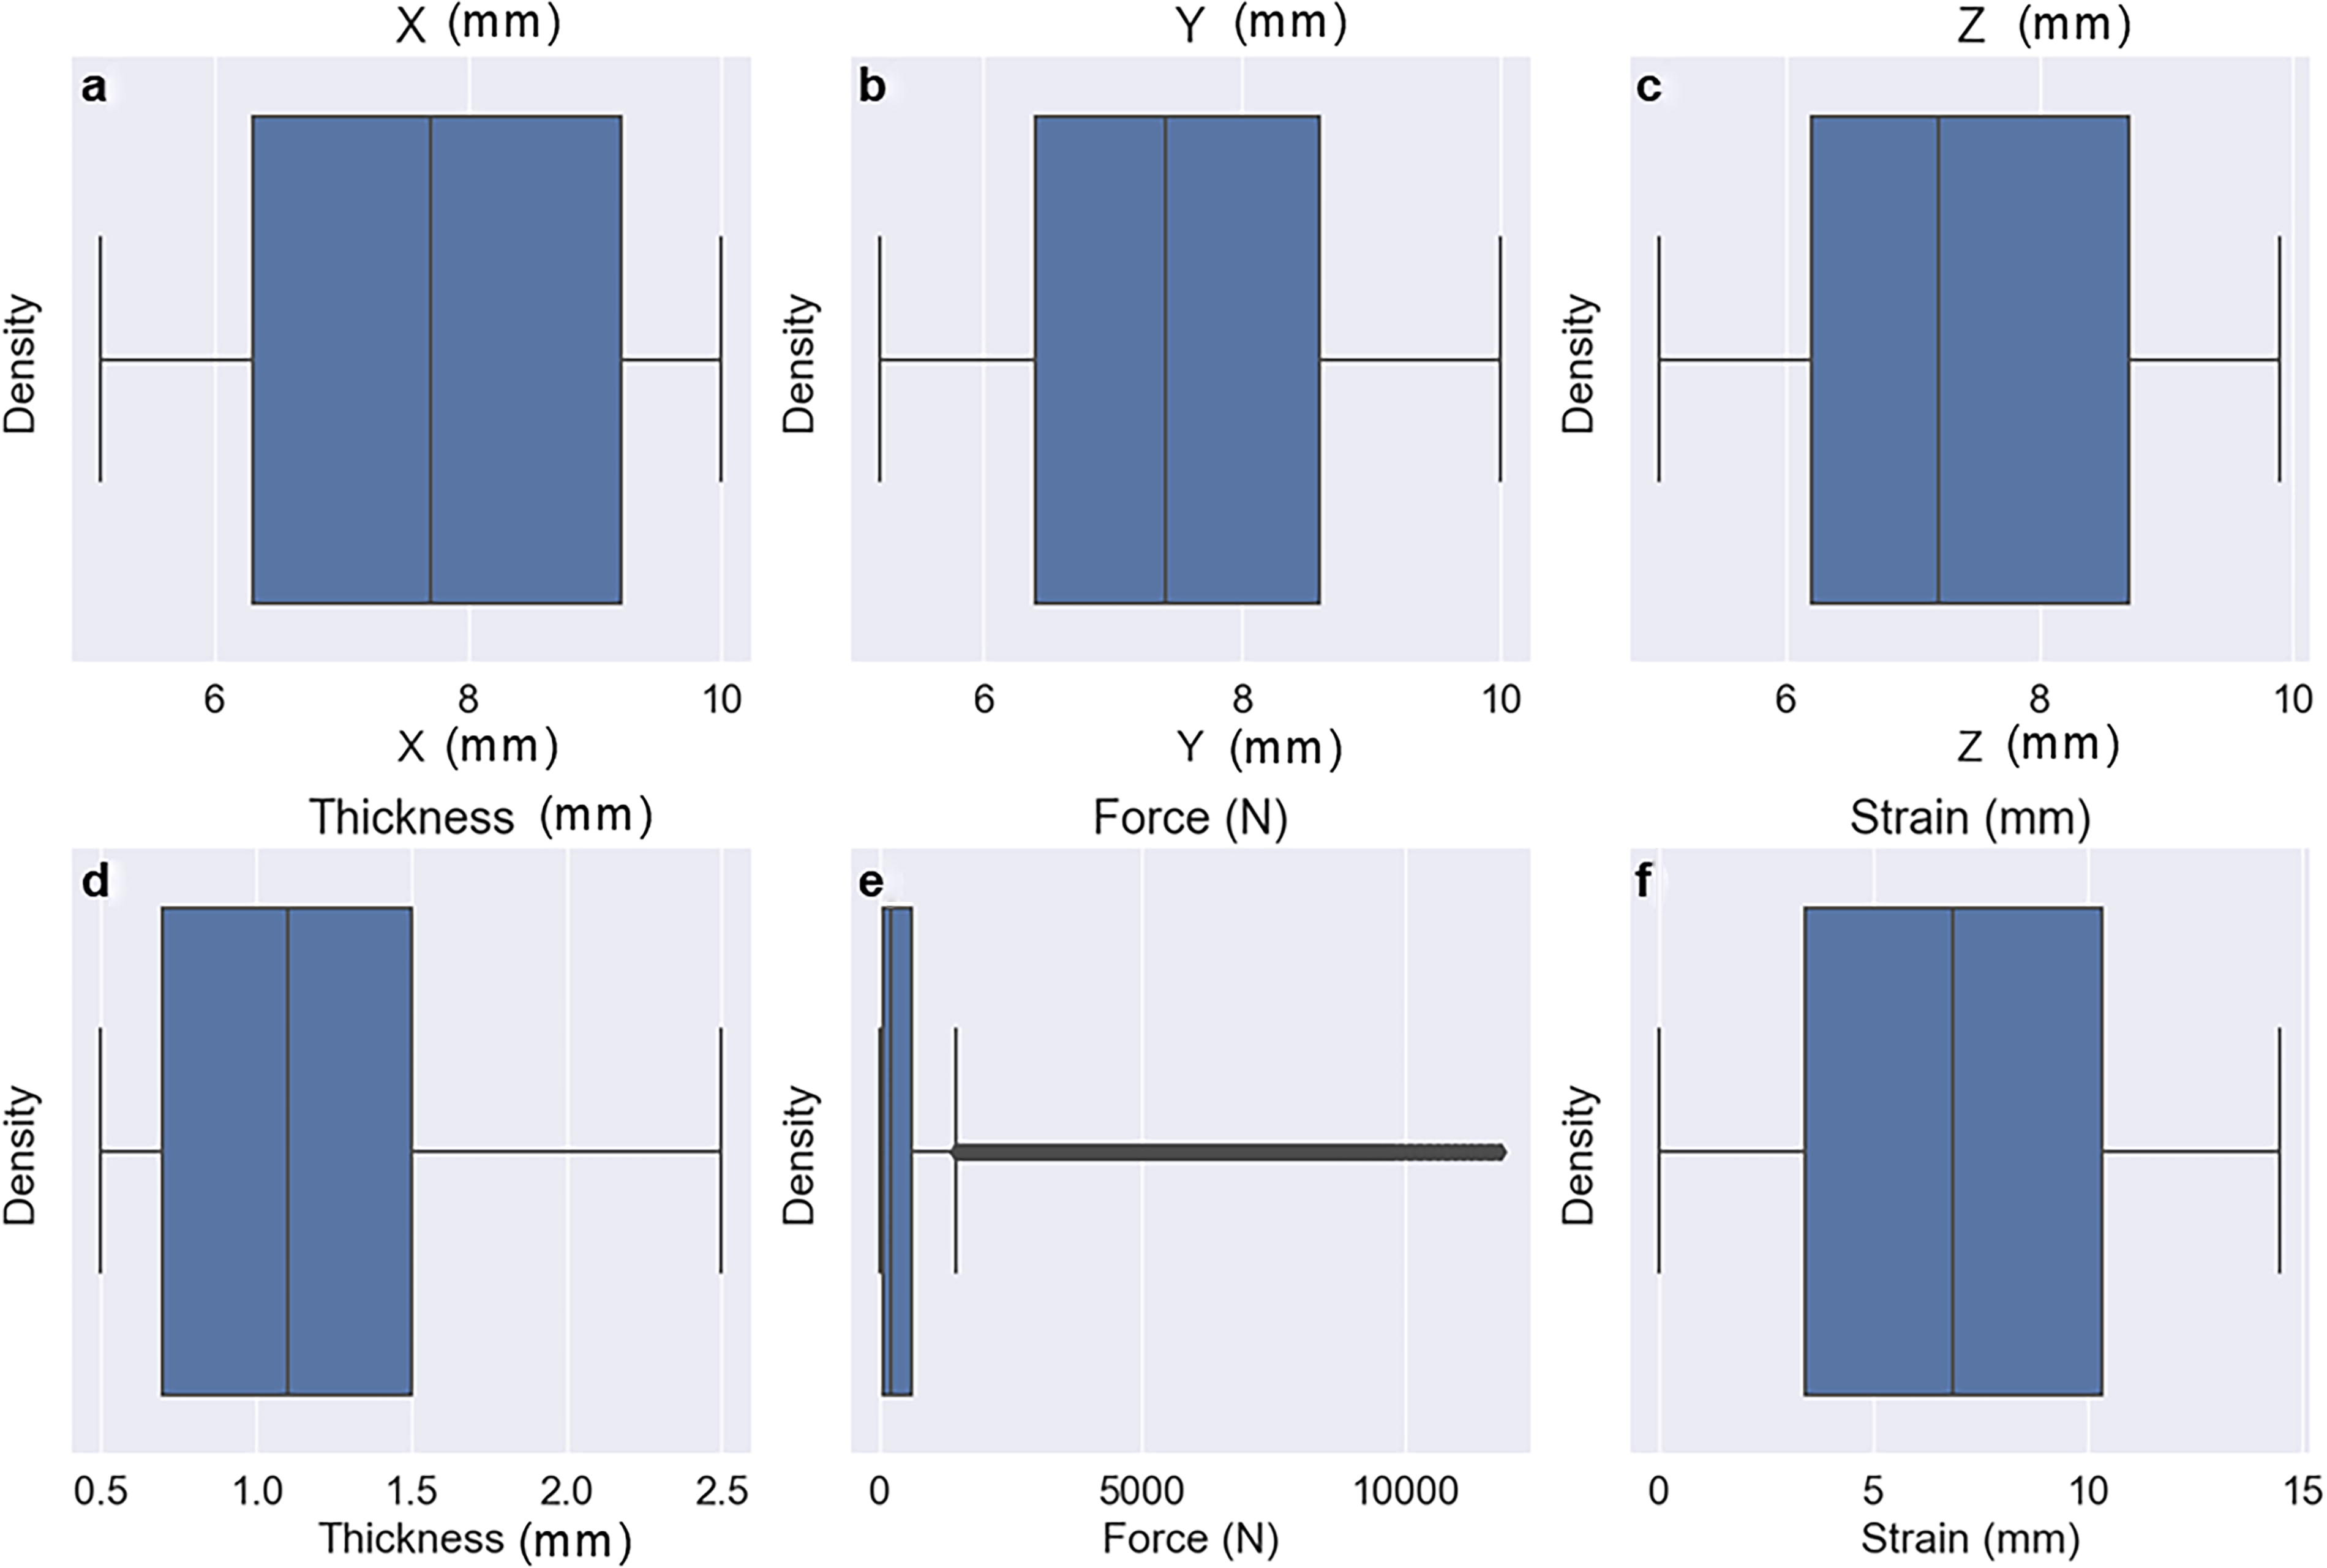
The distribution plots of variables X, Y, and Z in this research exhibit a high degree of symmetry, as depicted in Figure 5(a–c). Nevertheless, the thickness plot, Figure 5(d), exhibits a slight right skewness. The force plot in Figure 5(e) demonstrates that higher force values occur less frequently in the dataset, as indicated by the sharp decline in the curve. It suggests that a limited number of samples had a premature failure, necessitating increased force to compress them to a height of 14.5 mm. The strain distribution plot in Figure 5(f) indicates a decrease in the number of values as the strain increases, suggesting that certain samples were not compressed until reaching the 14.5 mm point. It is worth mentioning that in Figures 5–7, the density on the y-axis reflects the probability density of the data distribution, showing how clustered the data points are around certain values. This helps to identify where values are most likely to occur within the dataset.

Distribution plots for numerical variables.
Figure 6 shows the box plot for this research. Outliers in a box plot are data points that fall above 1.5 times the interquartile range (IQR) above the third quartile (Q3) or below IQR 1.5 times the first quartile (Q1). It can be found that the force plot, Figure 6(f), is the only visible sign of a potential outlier in this study. This is because certain samples exhibit extreme rigidity, necessitating a significant amount of force to compress them to 50% of their initial height. Rows with force values greater than 1434.31 are identified as outliers and need to be removed. Excluding those rows will reduce the total data to 71,085. After assessing the ML model, it was determined that removing these data points would result in a loss of information and a reduction in the model’s accuracy. Consequently, the elimination of outliers was not considered during the training of the dataset.
Box plots of numerical variables.

Distribution plots of normalized numerical variables.
Heat map correlation between normalized numerical variables.
An issue that may arise is the absence of data normalization, which is necessary for conducting relationship analysis by normalizing the values of variables to the same scale. In order to tackle this issue, the study uses the rank-based inverse normal transformation on all numerical variables. This process includes ordering the data, converting the ordered ranks into probabilities, and then using the inverse cumulative normal function to estimate a normal distribution, as shown in equation (2):
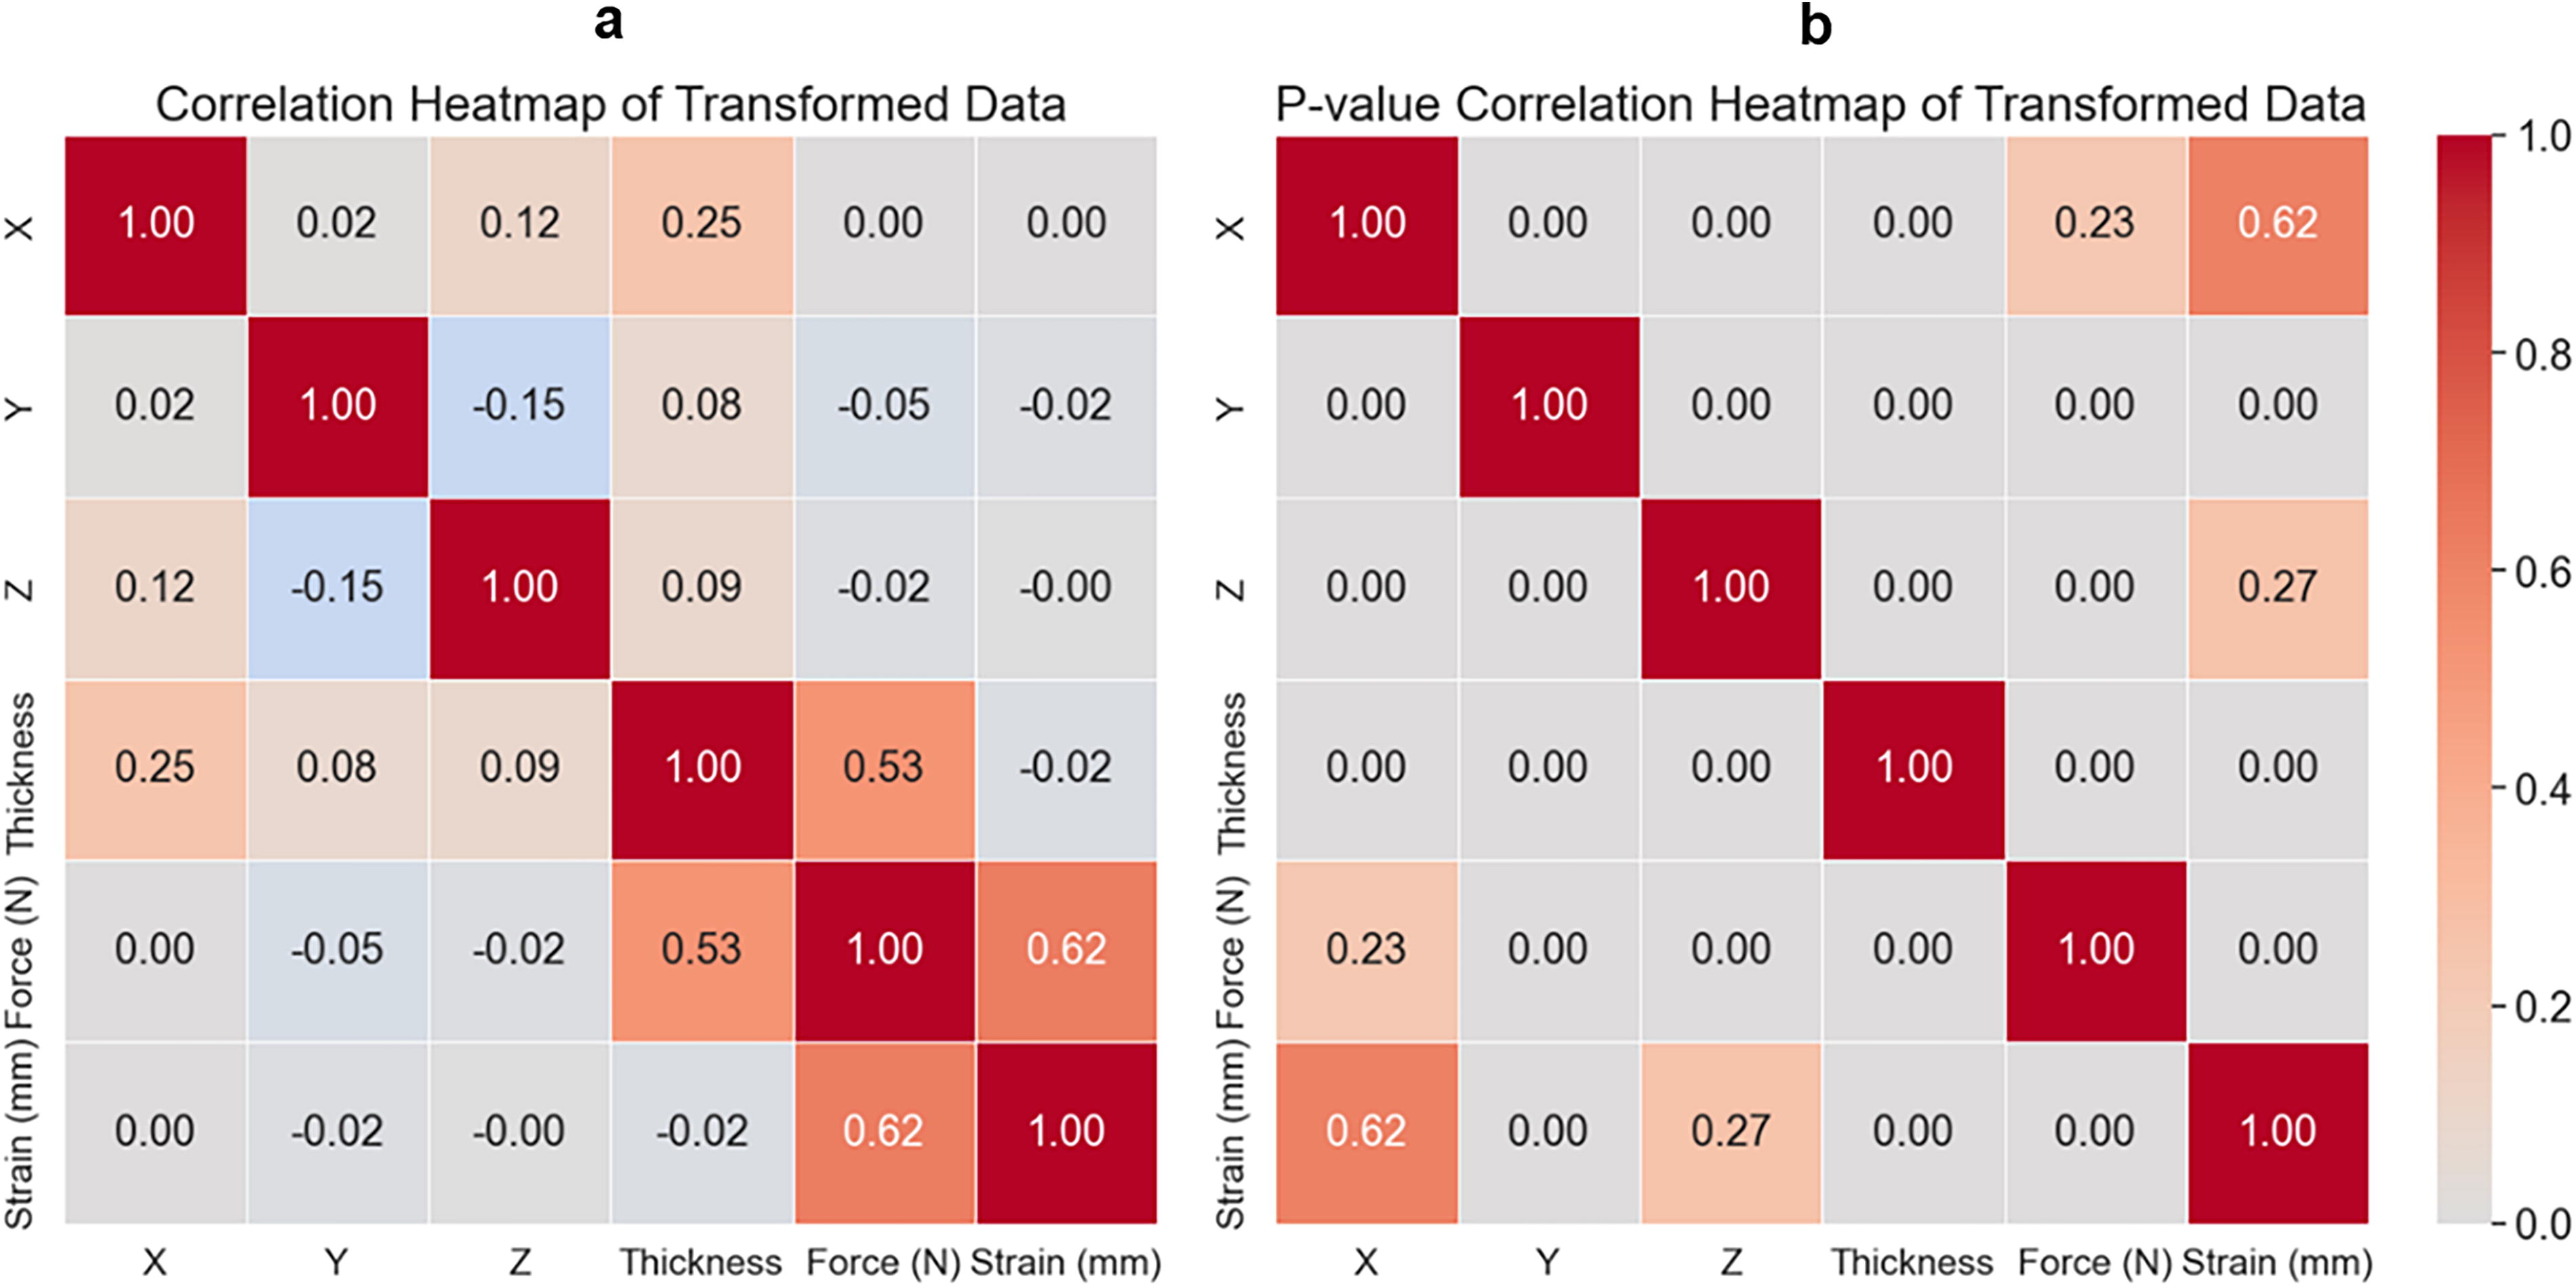
Pearson correlation establishes numerical variable relationships and is often used to assess the strength and direction of a linear relationship between two continuous variables. 68 This method uses the p value to assess if the correlation coefficient is statistically significant or random. A p value of <0.05 rejects the null hypothesis and indicates a statistically significant link between variables. A high p value suggests the observed association was random, supporting the null hypothesis. 69
Figure 8(a) displays a heat map that presents the Pearson correlation coefficients and Figure 8(b) shows their corresponding p values for the numerical variables examined in this study. Figure 8(a) indicates a direct and proportional link between variable X and thickness. Given the field knowledge, it is unlikely that changing the X-axis values will have an impact on thickness. The contradiction arises from the use of randomly generated numbers from Excel files throughout the design phase.
In addition, two notable correlations are apparent: the relationship between force and thickness, and the relationship between force and strain. There is a clear positive correlation between force and strain, as an increase in applied force results in a corresponding increase in strain, and the relationship between force and thickness aligns with domain knowledge, suggesting that greater cell thickness necessitates a higher amount of force. In addition, all values in Figure 8(b) are <0.05, except for the connection between variables X and Y and strain, as well as for X and force. This indicates that the connections lack statistical significance, implying that they may have arisen by chance and should not be solely relied upon based on the Pearson coefficient.
To determine the correlation between lattice type, which is a categorical variable with multiple classes, and other continuous variables, one approach is to evaluate the significance of each category. The binary variables are classified, and their impact on continuous variables is evaluated. Utilizing side-by-side box plots, where each category is represented by a separate plot, can facilitate the examination of this correlation. If each category’s box is distinctly unique, it suggests a connection to the variable. When boxes overlap, it suggests that there is a lack of connectivity.
Figure 9 illustrates that there is a significant amount of overlap between the categories of numerical variables in each plot. This suggests that the lattice-type variable is not dependent on the other variables. Nevertheless, a small degree of discrepancy in the overlap of categories in terms of thickness in Figure 9(d) implies a possible minimal correlation between lattice type and thickness.
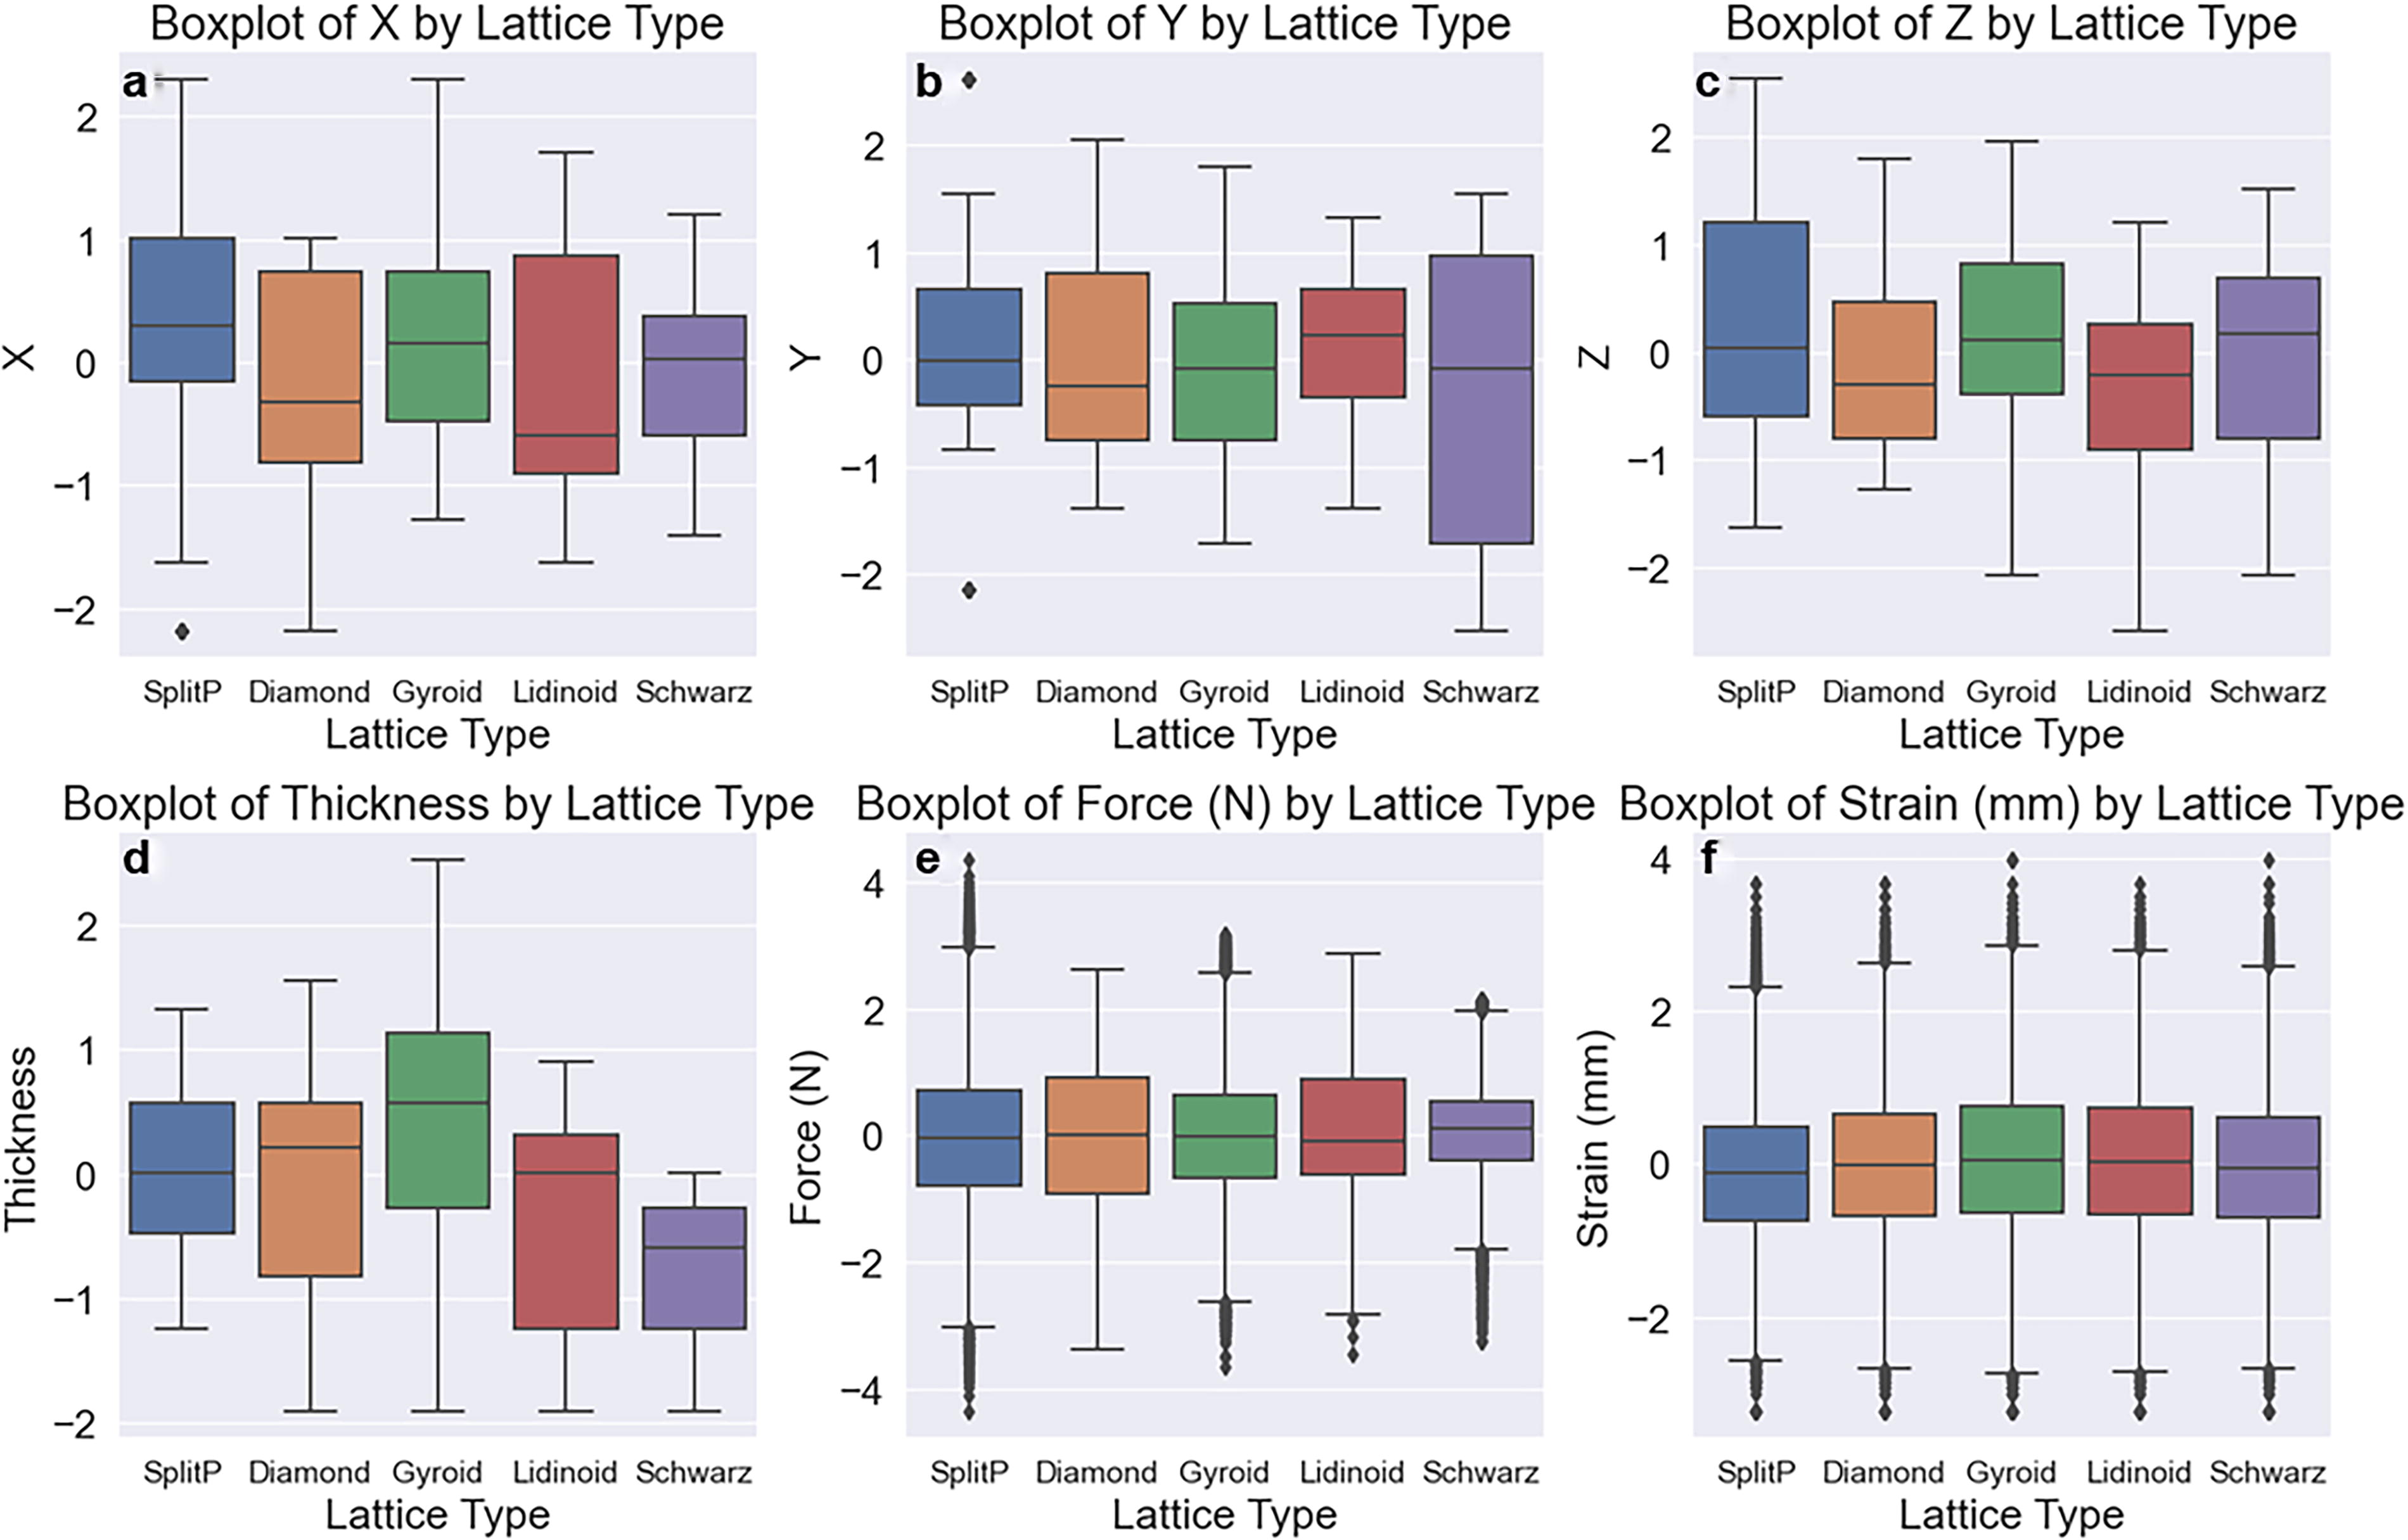
Box plot correlation between normalized numerical variables and lattice-type variable.
In addition, categorical variables are converted to numbers to prepare the dataset for training. This study only converted the lattice type, which has five classifications. Python label encoders alter this variable during training. A unique number is assigned to each category to expedite training. In the final stage of data preprocessing, the dataset was divided into 80% training and 20% testing sets. Its aim is to improve model evaluation and reduce overfitting.
Analyze the developed ML models
As previously mentioned, this study used two approaches: first, it considered the lattice type as a prediction, and then it considered it as a feature for creating an ML model. Subsequently, their performance is evaluated using R2, MSE, RMSE, and MAE as evaluation metrics. According to Table 4, the RF model outperforms the ANN model significantly in both approaches. It also shows that the R2 of the RF model for the two features is 50%, meaning that the model’s features, specifically force and strain, can explain about 50% of the observed variance while the remaining 50% is unexplained.
Results of ML Algorithms for Base Model and Improved Model
ANN, artificial neural network; MAE, mean absolute error; ML, machine learning; MSE, mean squared error; RF, random forest; RMSE, root mean squared error.
In the second approach, the R2 values indicate that the RF model accounts for 79% of the variability in the target variable, as explained by the predictors. On the other hand, the ANN model only explains 24% of the variability. Moreover, when comparing the MSE, RMSE, and MAE, it becomes evident that RF outperforms ANN. RF’s predictions closely match the actual values, highlighting its better performance than ANN does. Moreover, the best ANN model was achieved using a batch size of 90, a 50-epoch training period, a hard sigmoid activation function, and a learning rate of 0.01. For the best RF model, the optimal hyperparameters were 200 trees with a maximum depth of 20.
Figure 10 illustrates a substantial enhancement in the performance of the ML methods employed in this research, as evidenced by the R2 value rising from 5% to 79%. Additionally, a significant drop in the values of other evaluation metrics in this plot suggests improved model accuracy and predictive ability. For instance, the MSE performance shows a significant improvement in the ANN model trained on a dataset containing two features compared with the RF model trained on a dataset containing three features.
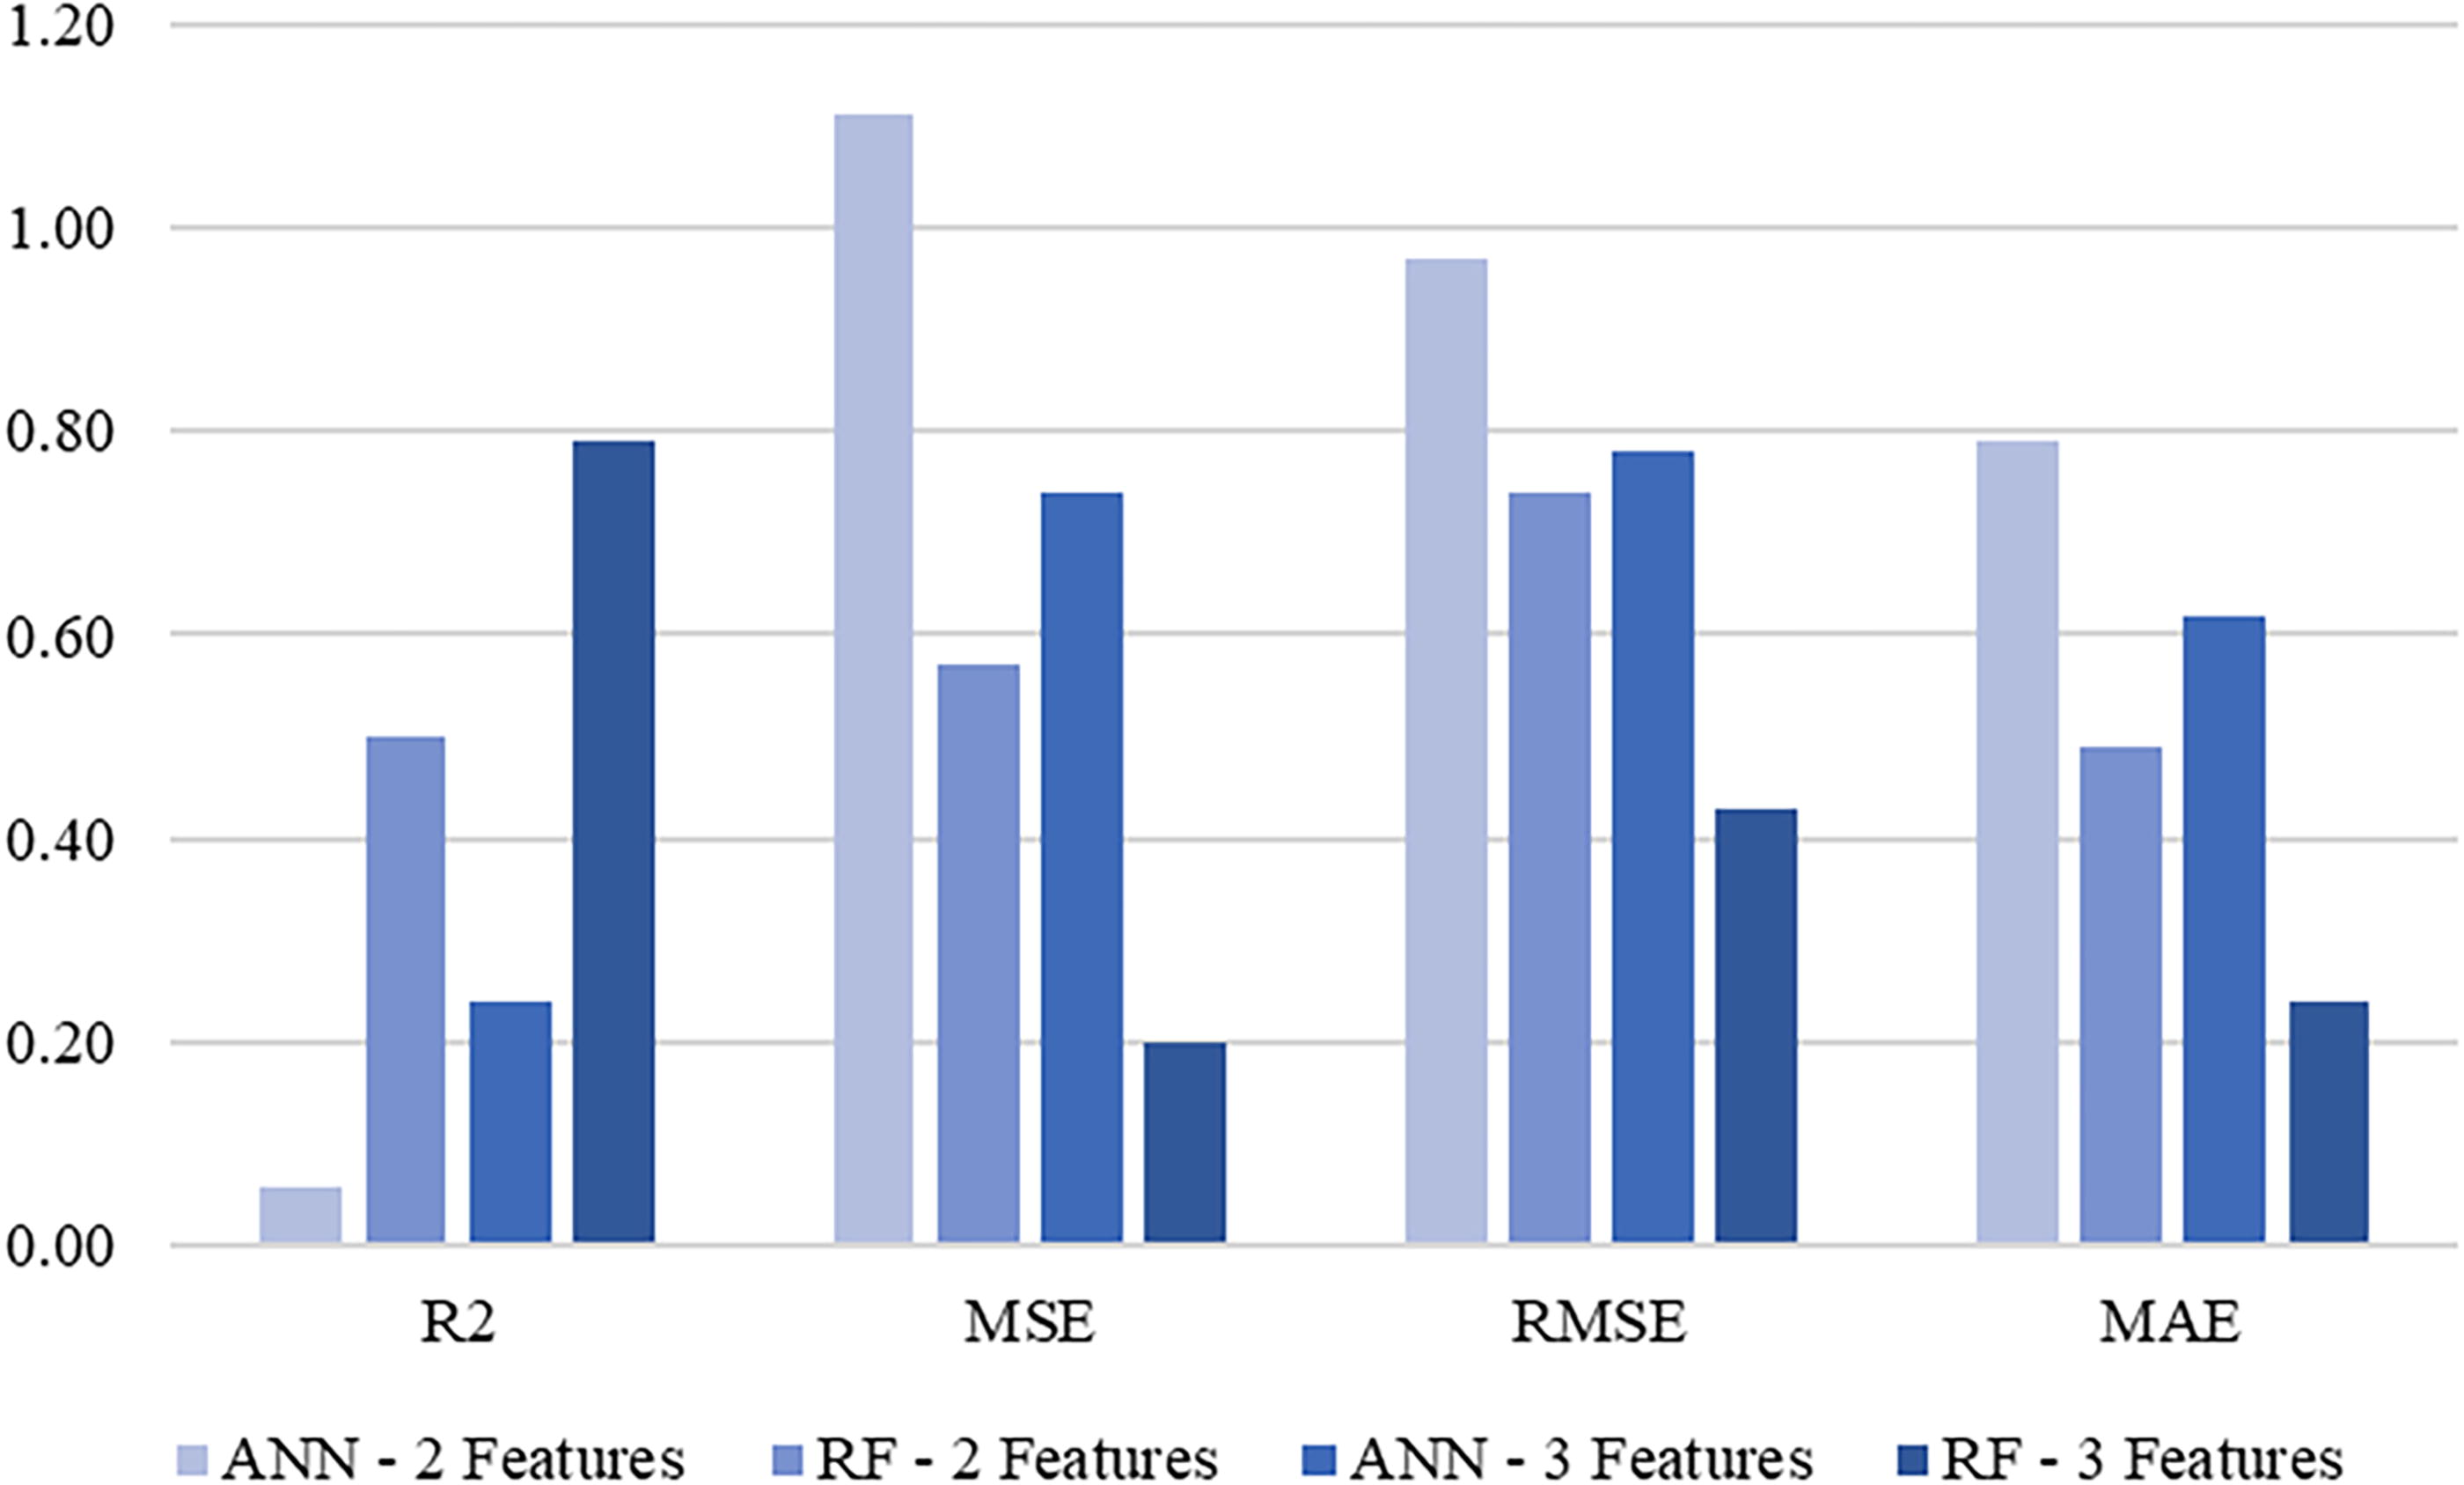
Comparison of evaluation metrics for two approaches using ANN and RF.
This study also used visualization approaches to evaluate and scrutinize the ML models’ performance, due to the significant improvement in results gained by using datasets with three features for both ANN and RF independently. Figures 11 and 12 display a comparison between the real data and the forecasted values obtained from the best ANN and RF models, respectively. The red line, representing the optimal prediction line, randomly distributes the data points in the plots. These findings indicate that the predictions made by the ANN model for these data points are not very precise, as there is a clear trend of vertical clustering.

Actual vs. predicted values of ANN model.
However, Figure 12 demonstrates accurate plots by comparing the RF model’s real and predicted values. The data points exhibit a notable proximity to the red line as compared with the ANN model, indicating superior accuracy in predictions for all targets. In terms of performance, the RF model outperforms the ANN model by producing predicted values that closely align with the actual values for all four targets, demonstrating more accuracy in its predictions.
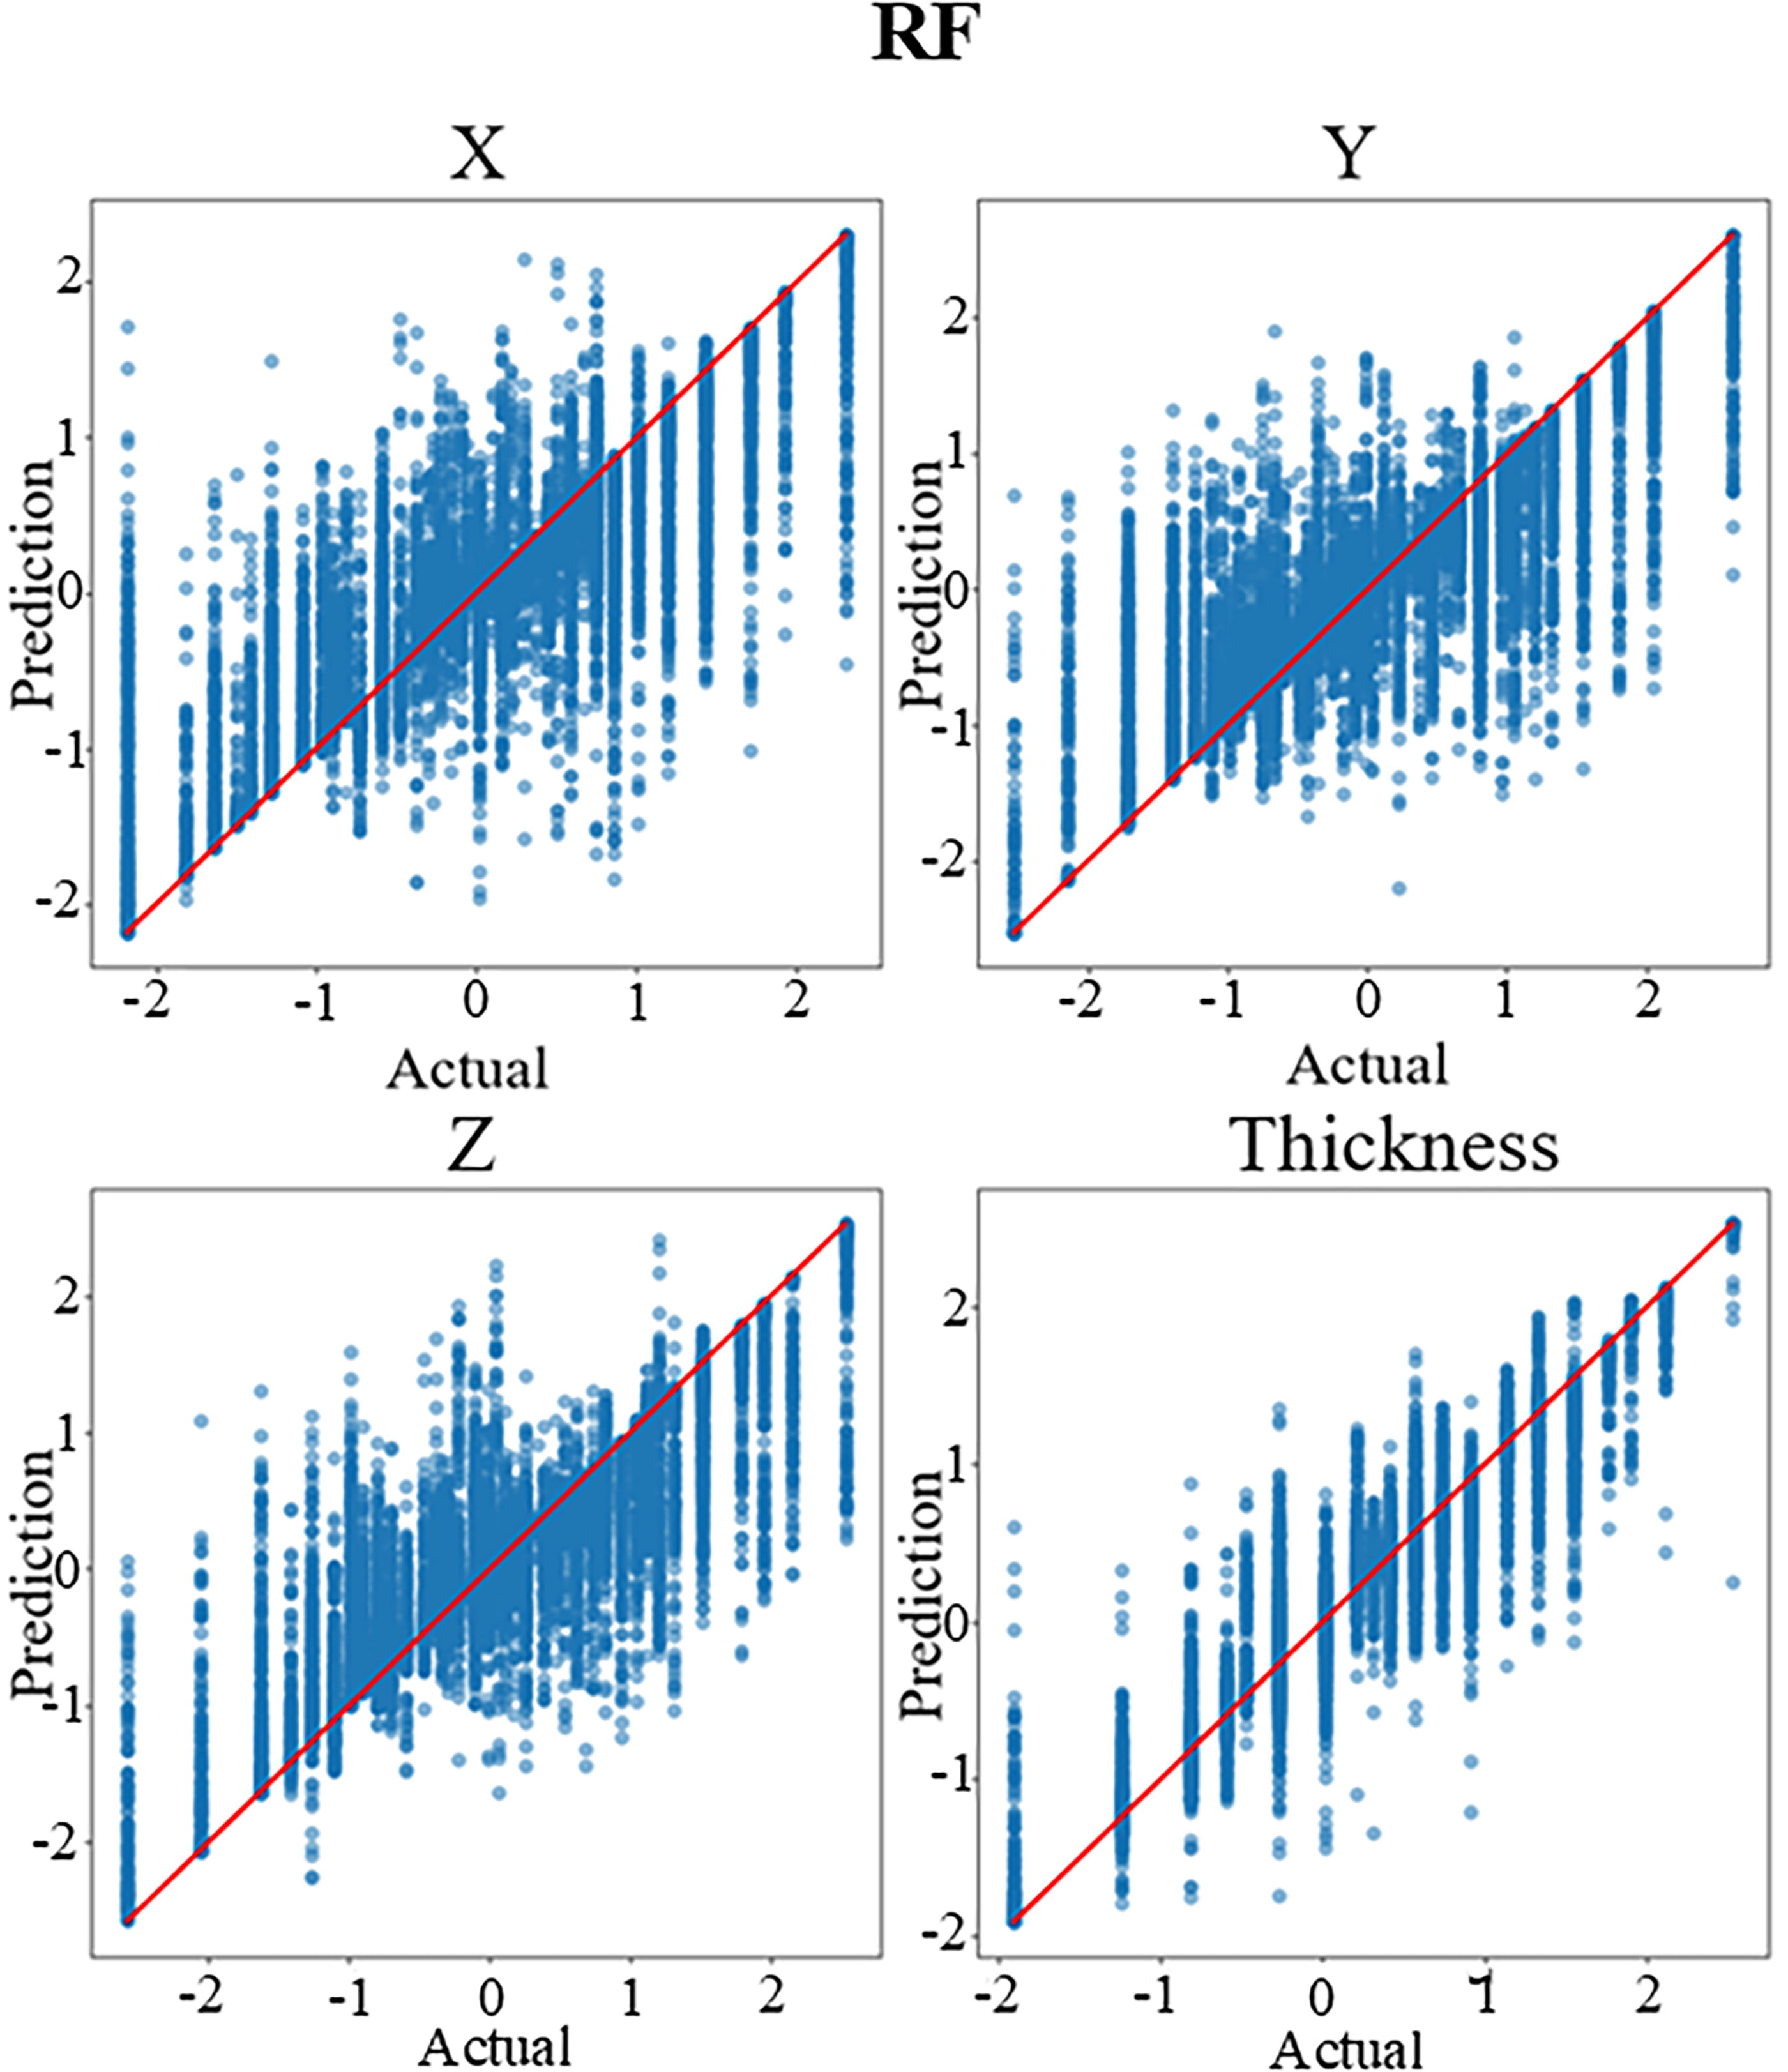
Actual vs. predicted values of RF model.
Figures 13 and 14 display the residual values of the ANN and RF models, respectively. The ANN plots demonstrate a nonrandom distribution of data points around the zero line. This suggests that the predictions made by the ANN model for all targets are not highly accurate. In contrast, the residuals for all targets in the RF model disperse evenly around the zero line, indicating a substantial enhancement in the model’s predictions. This observation is consistent with the analysis depicted in Figure 12, suggesting that the predictions made by the RF model have been significantly enhanced.

Residual plots of ANN model.
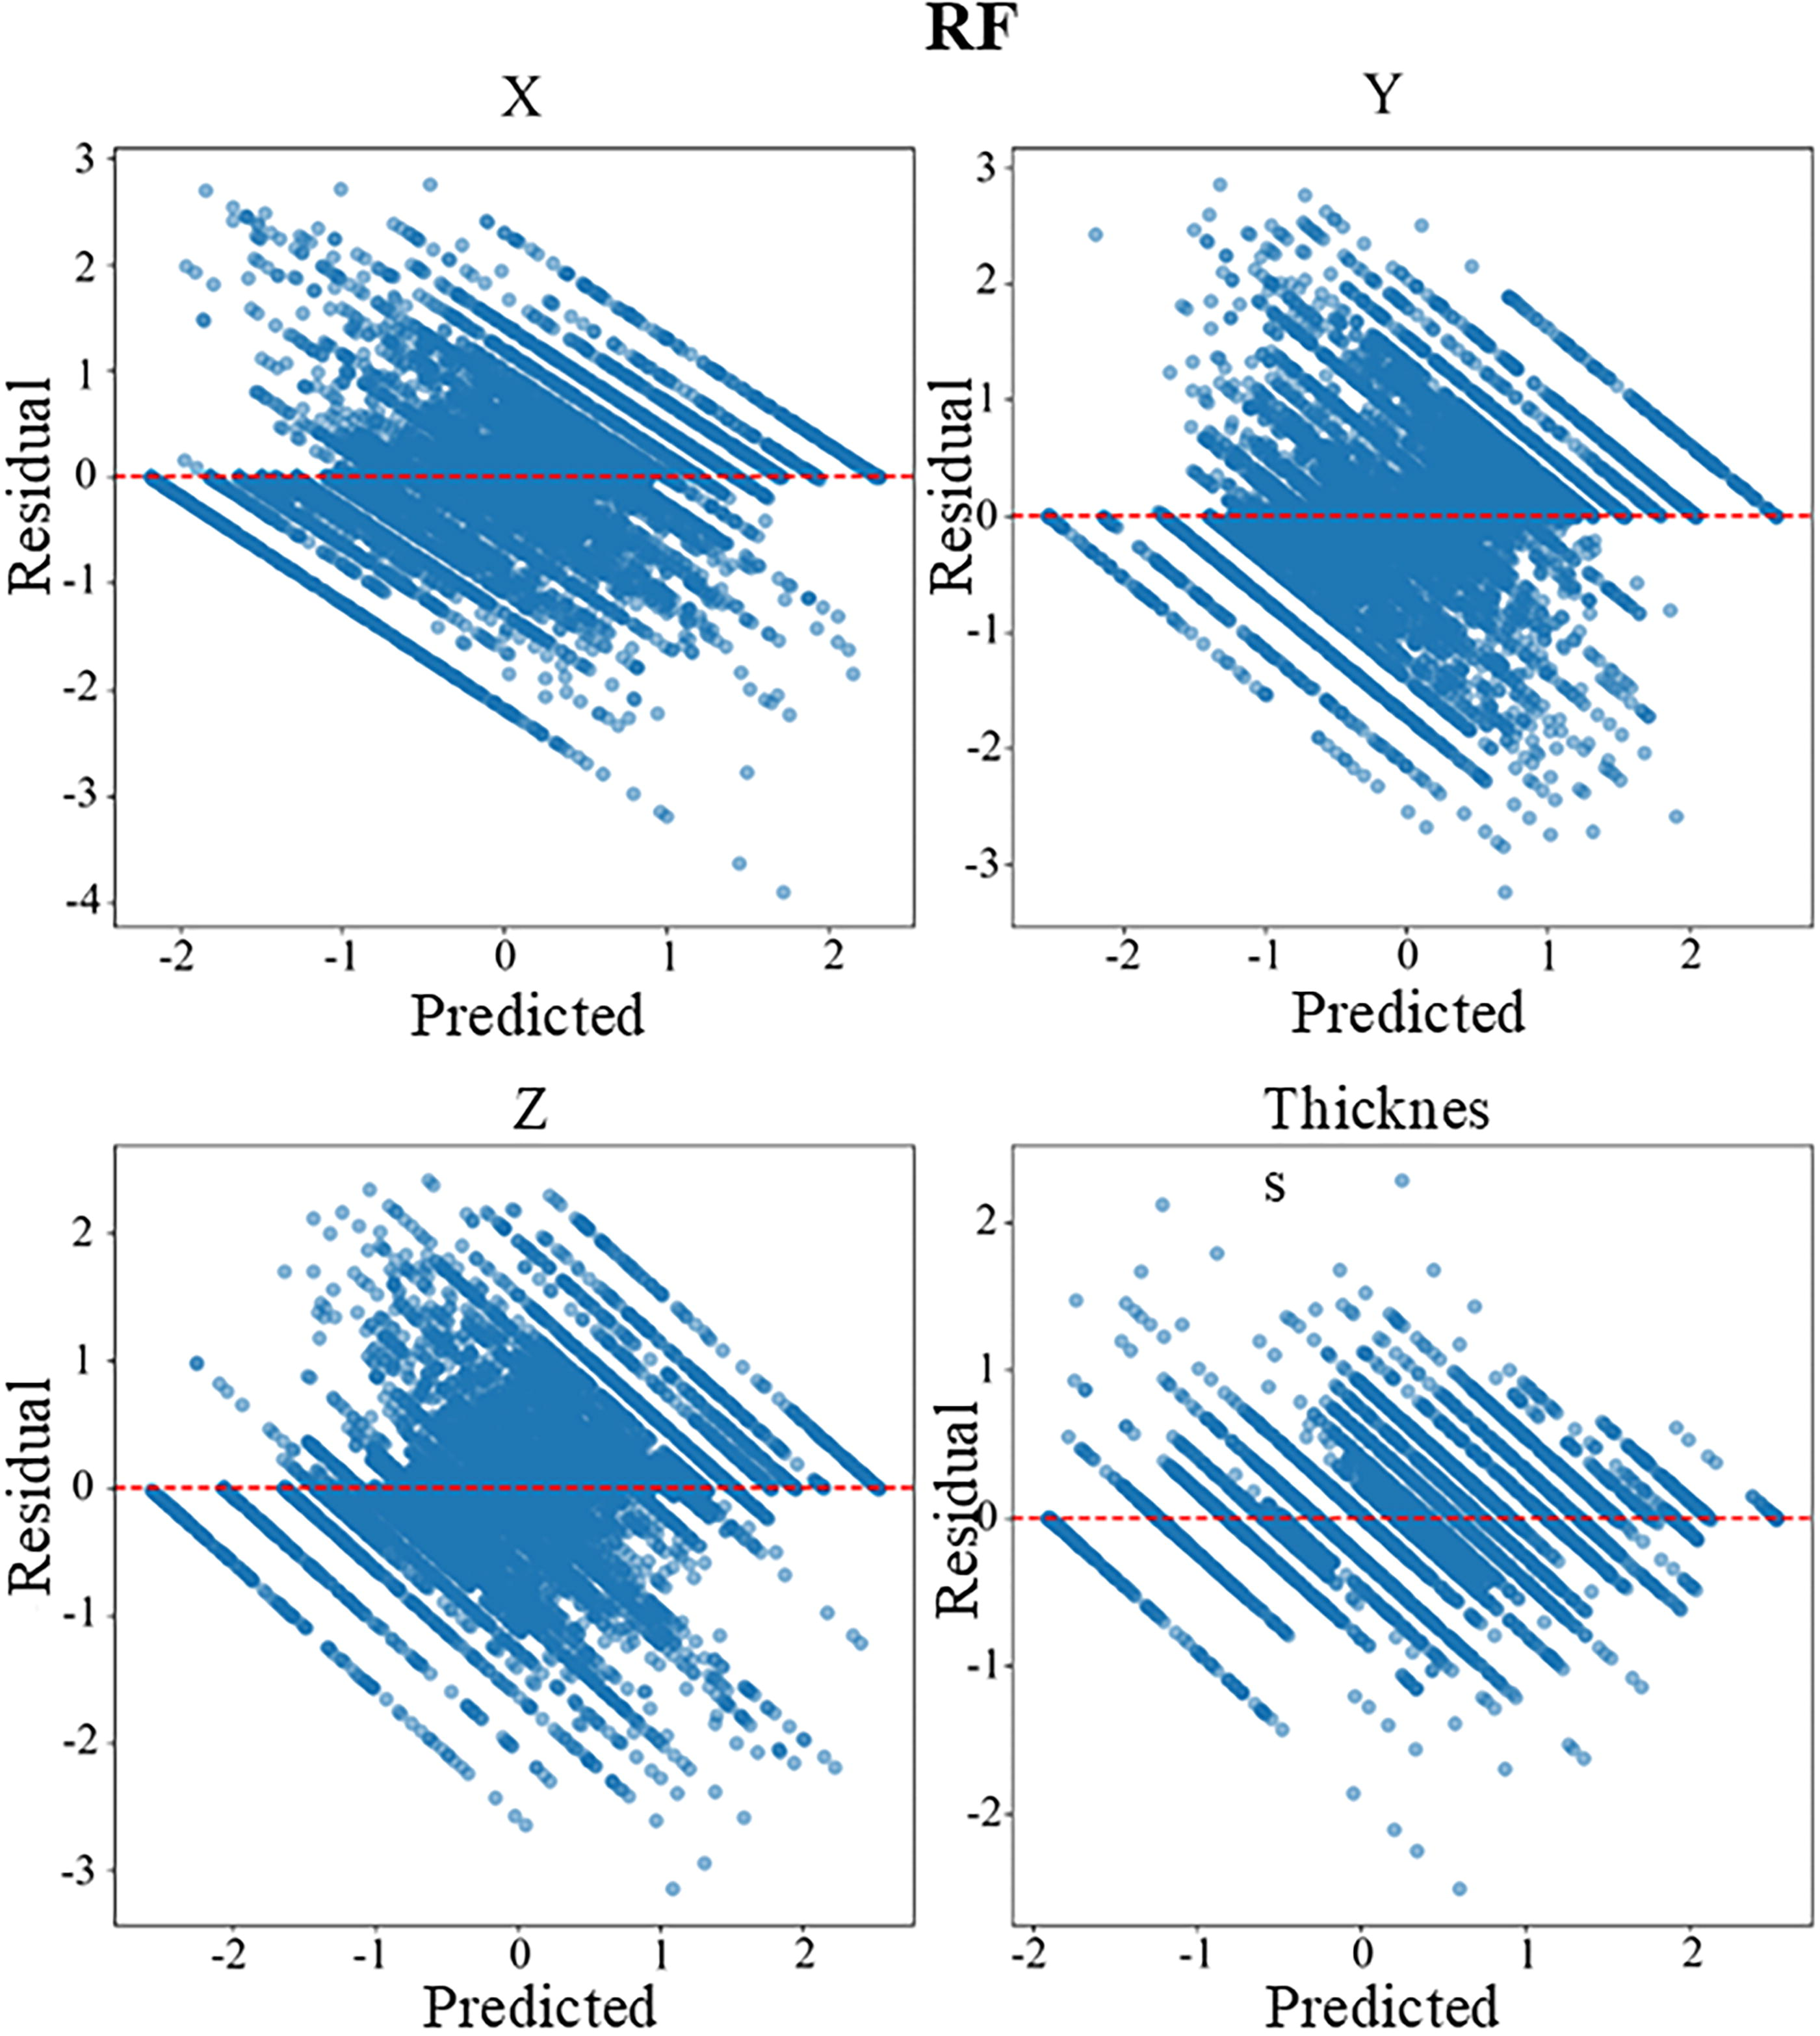
Residual plots of RF model.
Deploying the optimal ML model
The optimal model for different users may vary depending on their specific criteria. However, based on the analysis above, the RF model emerged as the optimal choice for this application and was subsequently deployed using Tkinter in Python. This program can accept input data from users, make predictions using the model, and display the results in a format that is easy for users to understand. Users can easily choose and enter their parameters in this interface as shown in Figure 15. The drop-down menu offers the option of five lattice types: Diamond, Gyroid, Lidinoid, SplitP, and Schwarz. Selecting a lattice type displays its corresponding cell structure. In addition, users can enter values for force and strain in specific fields.

Snapshots of predicting lattice cell geometries using GUI. GUI, graphical user interface.
Nevertheless, there are limitations on these numerical inputs, which users can access by pressing the help button next to the force field. These limitations arise from the use of RF and the dataset’s characteristics. The range of the dataset, which spans from 0 to 14.5 mm, constrains the predictive capabilities of RF. Moreover, 75% of force values are less than 600 N, leading to the establishment of a limit for force inputs of up to 600 N. As a result, if users input force and strain values that exceed the specified range, they will experience an error. Users can find optimal values for the dimensions (X, Y, and Z) and thickness of their lattice unit cell size by inputting appropriate values and clicking on the predict button.
To broaden its applicability across various fields and industries, this study advanced by implementing the optimized model for functionally graded lattice (FGL) applications. In FGL material properties gradually vary throughout the structure to optimize performance for specific uses 70 In this research, an MSLA sample with a Gyroid lattice configuration was modeled, incorporating two force parameters—100 and 600 N—into a newly designed graphical user interface (GUI), as illustrated in Figure 16. A deformation of 7 mm was also considered. A linear distribution of 23 intermediate zones was established between these forces, resulting in a total of 25 zones with unique cell geometries.
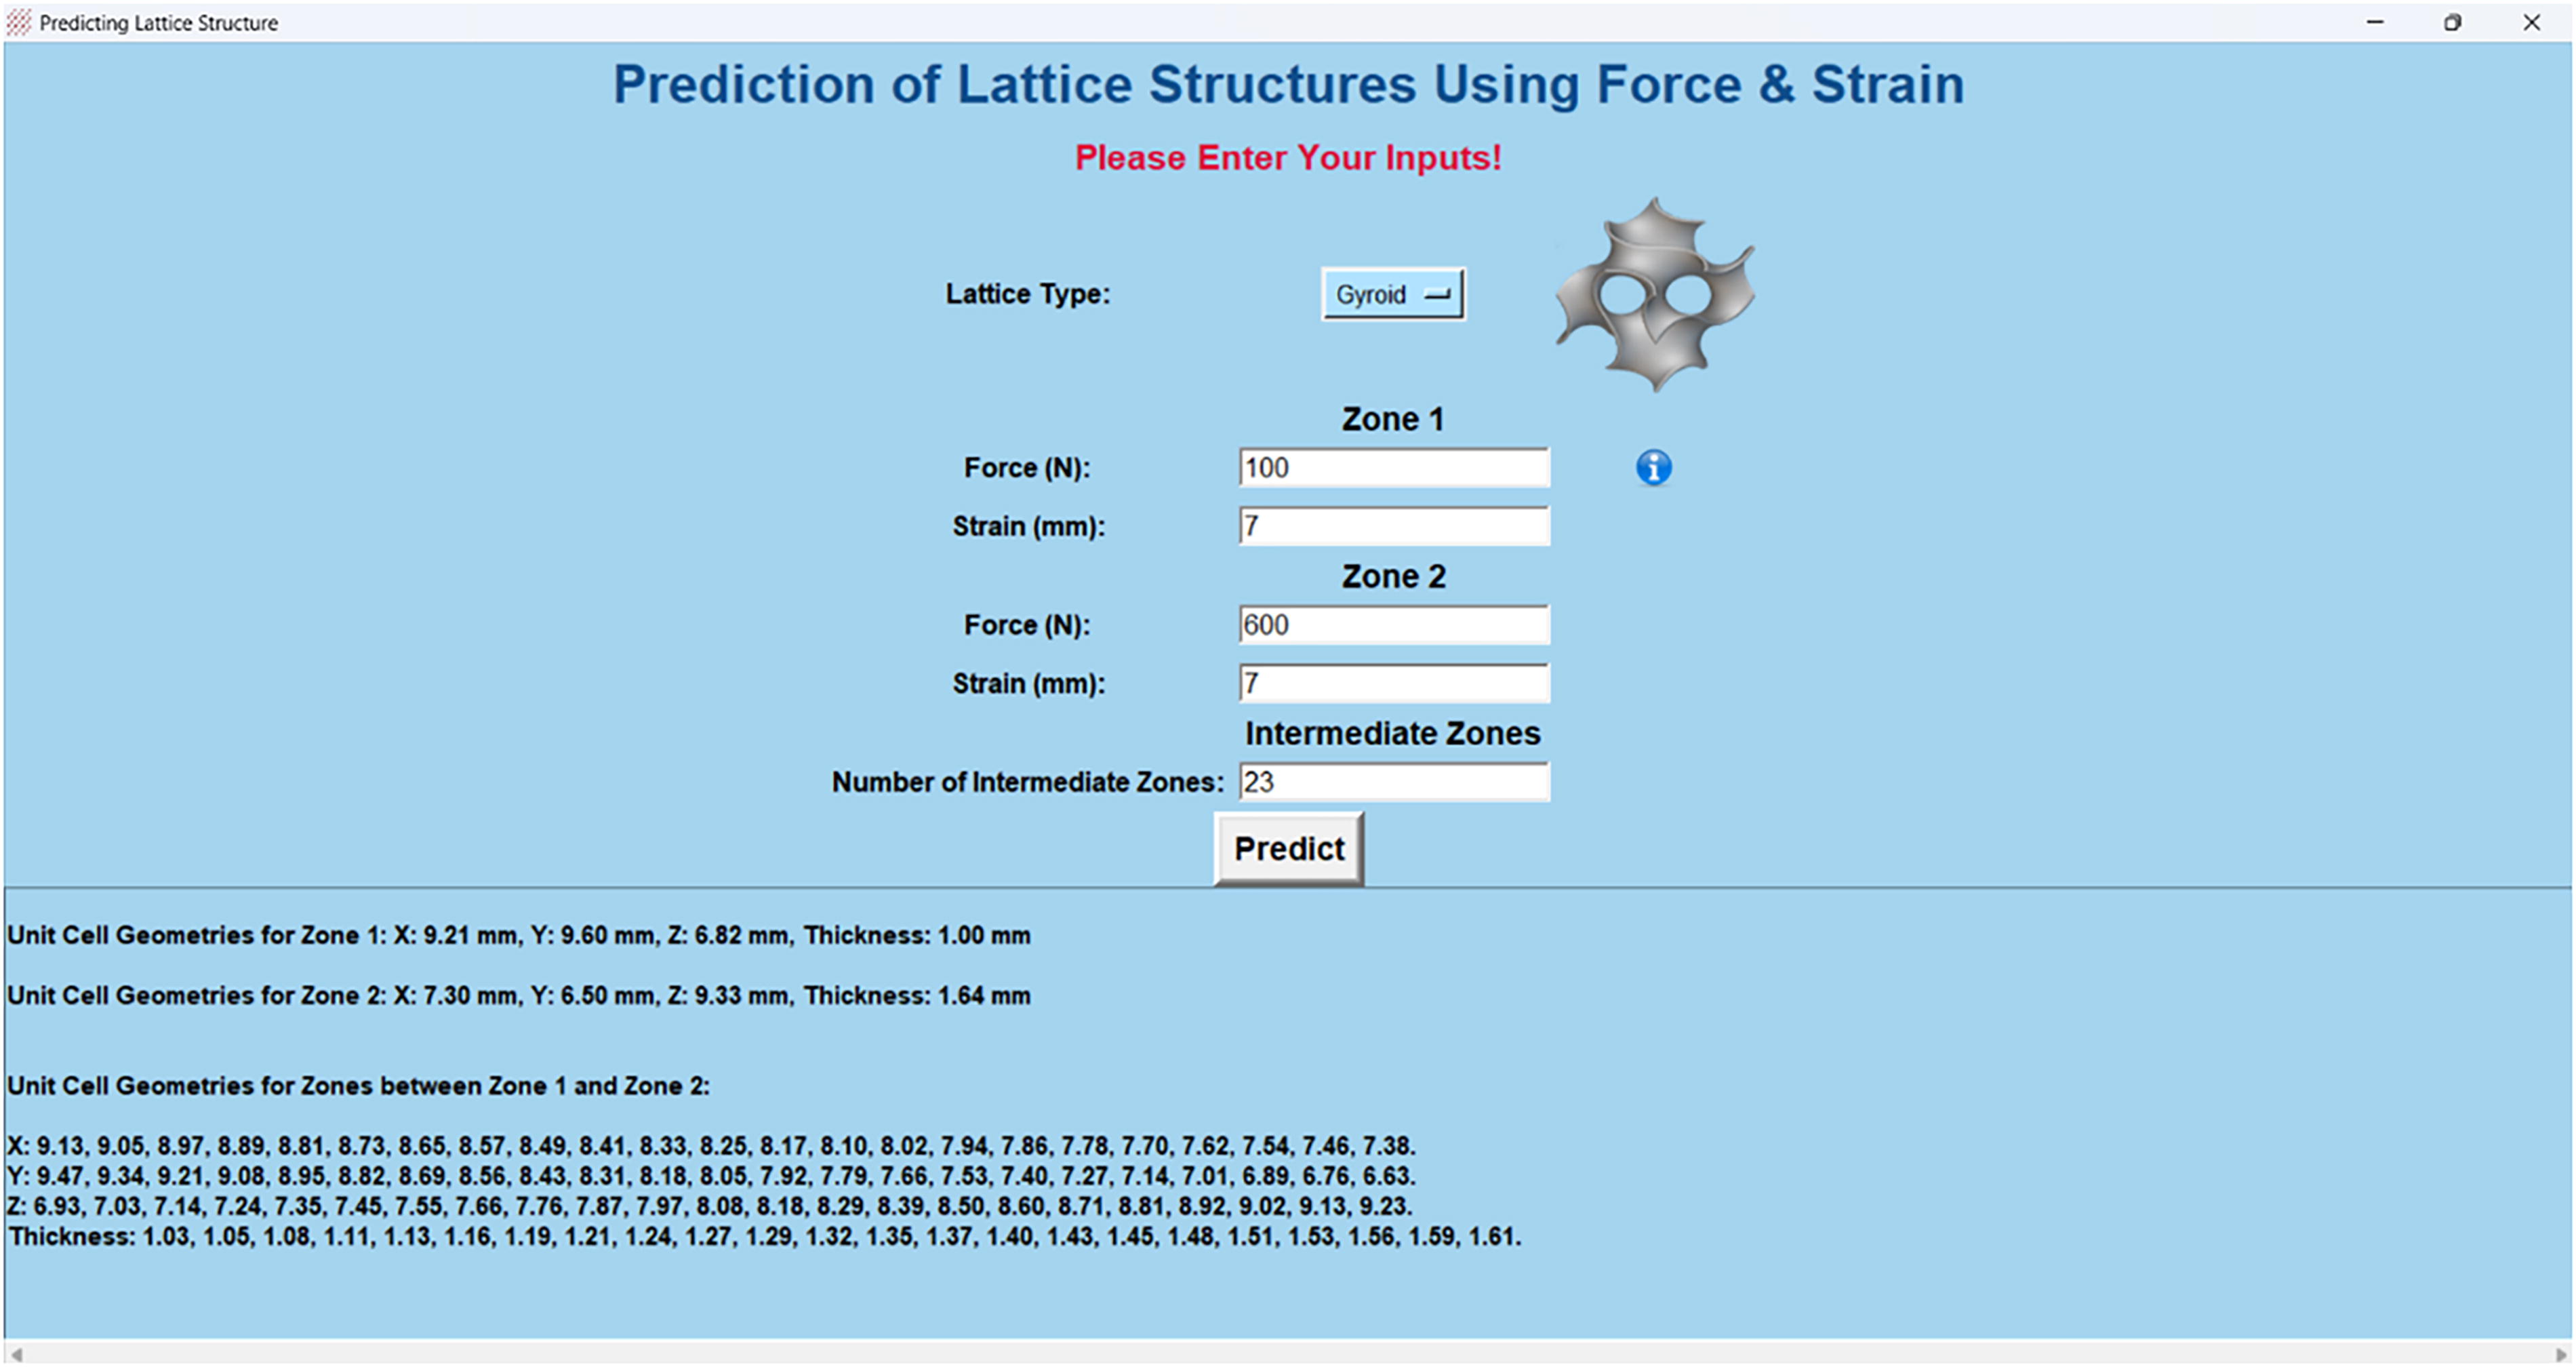
Snapshot of predicting lattice geometries for different zones in FGL. FGL, functionally graded lattice.
Subsequently, these parameters are integrated into nTop, as depicted in Figure 17. Within nTop, a Boolean operation is employed to merge all distinct zones, connected by varying blend radii. Modifying the blend radius allows for the application of fillets, facilitating a seamless transition between adjacent zones. In this study, the blend radius value is calculated based on the average of the respective zones to ensure smooth transitions. The sample dimensions are set at 250 × 100 × 50 mm, with each zone measuring 10 mm in width. After this, the model is sliced and prepared for printing using CHITUBOX software, following the same procedure previously used to print 93 samples.
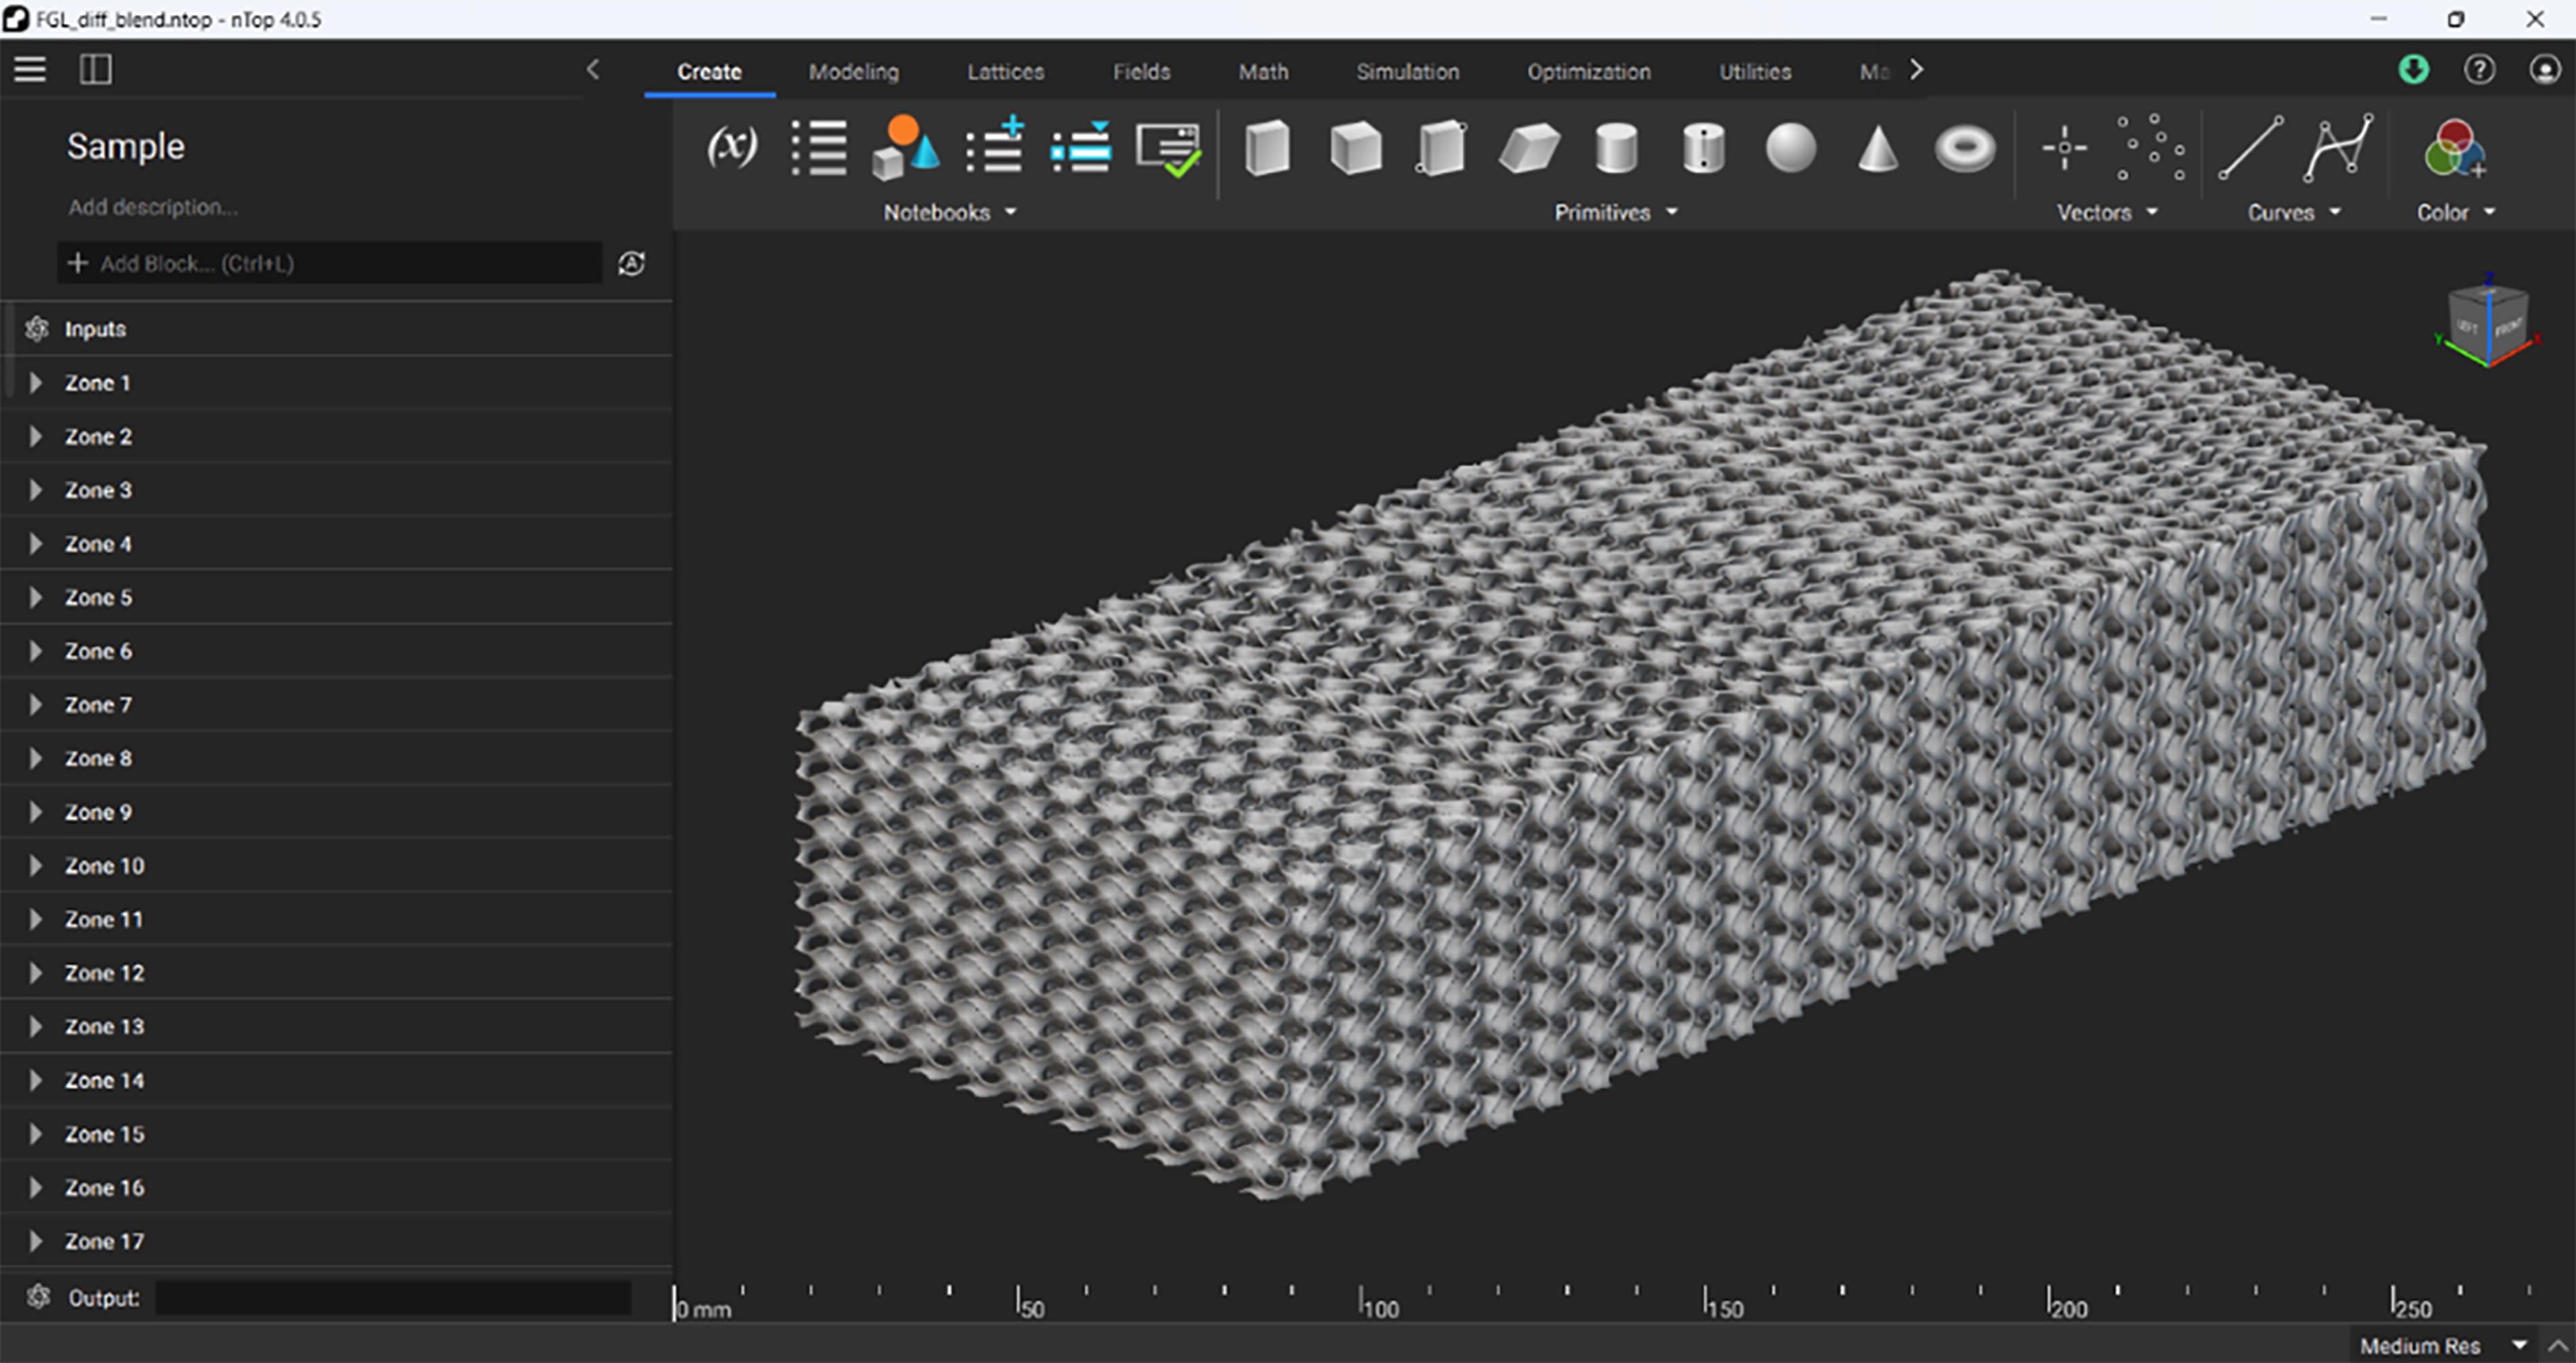
nTop design for the FGL sample.
Conclusions
The primary goal of this research was to use ML techniques to predict the geometric structure of soft thermoset UV-curable lattice structures created through AM compression tests. In order to achieve exceptional performance in a wide range of applications, this study identified the most effective design parameters, including cell geometries, wall thickness, and lattice type. This research would contribute to the advancement of flexible thermoset products that can undergo significant deformation.
The study began by creating designs, slicing them, and 3D printing lattice samples. Subsequently, compression tests were conducted to obtain force versus displacement curves for examination. This study undertook preprocessing procedures, such as normalization, on the dataset to ensure the accuracy and resilience of subsequent ML models. This study evaluated two approaches. The first strategy included the lattice type as one of the targets, along with X, Y, Z, and thickness. The second strategy involved incorporating lattice type as a feature, along with force and strain. Two ML techniques, namely, ANN and RF, were used to implement each pair of strategies on the dataset. During the model evaluation, the cross-validation technique was employed to ensure the model’s resilience against fluctuations in the dataset. Furthermore, a range of regression metrics, including R2, MSE, RMSE, and MAE, were utilized to evaluate the accuracy and predictive capacity of the models.
The RF model exhibited superior accuracy and precision in comparison to the ANN model when considering these assessment measures. The strategy involved the acquisition of two features, with the R2 values for ANN and RF being 6% and 50%, respectively. The superiority of the lattice type as a feature was evident, with an R2 value of 79% for the RF model, compared with only 24% for the ANN model using this method. The visual representations, such as the comparison between actual and anticipated values and the residual plots, further validated the exceptional performance of the RF model. Utilizing the RF model via a user-friendly GUI interface provides a practical means for users to forecast lattice designs tailored to their specific needs. Although there are limits, such as restrictions on input values, the RF model with its three features shows potential for practical use, providing a reliable tool for reliably predicting lattice designs.
Future investigations could tackle various constraints, even though this study produced dependable findings that could assist in establishing a user-friendly environment for forecasting appropriate lattice designs. The distinct mechanical behavior of each lattice design allows for the creation of additional ML models by examining them separately with enough data points. Due to the distinct configuration of each design, a wide range of applications can be employed based on the specific mechanical characteristics needed for the given application. Moreover, performing actual experiments using identical materials to compare them with the predictions of the most accurate model could confirm the results of this study. Moreover, it would be beneficial to investigate the other lattice types available in the nTop software, applying the same methodology as this study. This would allow for the prediction of the unit cell geometries associated with these lattice types. Finally, considering the FGL designs, where different lattice designs are used for the same area instead of a homogenous lattice design, it would be intriguing to apply the results of this study to achieve the main purpose.
Footnotes
Acknowledgments
The authors would like to thank Dr. Bias and Robert Jones at the University of Regina for their invaluable guidance for the machine learning and compression testing phases of this research. The authors are grateful to their colleagues Bárbara Ferrusca Ortiz and Rawan Elsersawy for their help during AM step.
Authors’ Contributions
M.J.H.: Methodology, software, validation, formal analysis, investigation, resources, data curation, writing—original draft, writing—review and editing, and visualization. M.A.H.K.: Conceptualization, writing—review and editing, supervision, project administration, and funding acquisition.
Data Availability Statement
The data that support the findings of this study are available from the corresponding author, M.A.H.K., upon reasonable request.
Author Disclosure Statement
The authors report there are no competing into declare.
Funding Information
The work was supported by the Natural Sciences and Engineering Research Council of Canada (Grant Number RGPIN-2023-04388) and Mitacs (Funding Number FR109814).
References
Supplementary Material
Please find the following supplemental material available below.
For Open Access articles published under a Creative Commons License, all supplemental material carries the same license as the article it is associated with.
For non-Open Access articles published, all supplemental material carries a non-exclusive license, and permission requests for re-use of supplemental material or any part of supplemental material shall be sent directly to the copyright owner as specified in the copyright notice associated with the article.