
Abstract
Lower surface roughness is a good quality indicator as it is directly related to mechanical strength, permeability, and aesthetic properties of printed three-dimensional (3D) objects. This study evaluated the effect of nanoclay and laser power on the surface properties of laser-sintered (LS) objects. LS specimens created from polyamide 12 (PA12) and composites were tested for surface roughness on top and bottom surfaces. Scanning electron microscopy with surface roughness tester were used to evaluate the surface morphology like surface roughness, melt-ability, and homogeneity of dispersion of nanoclay in the LS fused polymer matrix. This study’s findings demonstrate the importance of nanoclay as a filler in LS polymer-based 3D objects. Nanoclay particles interact with polymer particles via physical and chemical cross-links. These interactions increase the packing density of particles in 3D objects, which increases their surface smoothness. Thus, this study demonstrated that the addition of nanoclay to the LS polymeric powder with optimized laser power exhibited improved surface properties with an expectation to emerge new applications.
Introduction
Laser sintering (LS) is pursued as a promising additive manufacturing technology that is capable of producing highly complex and precise three-dimensional (3D) objects from polymeric powders, rendering them suitable for a wide variety of applications.1–3 Some of successful industry applications of LS include aerospace, transportation, electronics, sports, and other industries. 4 Additionally, LS has the advantage of manufacturing biomedical components with high accuracy and consistency, for instance, complex porous scaffolds with pores distribution and/or channel network according to the intended use. 5 In a previous study, Camila Fernandes Higa et al. showed that, as an example, the LS has the potential to manufacture 3D scaffold for in vitro cell culture using poly (vinyl alcohol) polymer for biomedical purposes. 6 Another example is that the potential of production of several types of orthoses and customized prostheses used to help people with missing component or disability.7,8 Thus, LS has become one of the research and development priority area in the past decade.
In the LS process, polymeric powder deposited on the build platform by a blade is selectively sintered using a CO2 laser beam. The layer-by-layer sintering process of powder spreading allows the consolidation of the objects and offers great flexibility in terms of part design and manufacturing.2,9 Polymers can be easily fabricated into customized parts with only relatively low fusion temperature and laser power required. 10 These 3D objects offer final properties that can be used to a desired extent as an end-user part with no tooling required and, thus, no additional cost.11,12 Theoretically, a wide variety of polymer powders is processable using LS, but practically it can be difficult. Polymers with unfavorable characteristics or restrictive factors, like small processing window or poor interlayer bonding, can lead to a difficulty in the processing temperature control that constrains a successful processibilty of LS objects. 11
Although many efforts have been spent to develop polymer-based powders for LS, only a few materials are widespread adopted, namely polyamides (PA12, PA11, and PA6)11,13,14 and some limited alternatives like polyurethanes, 15 high-density polyethylene, 16 and polyether ether ketone. 17 These are semicrystalline polymers in their nature, which exhibit more desirable properties than amorphous polymers although some amorphous polymers were successfully processed via LS technique such as polycarbonate, 18 polystyrene, and styrene-acrylo-nitrile copolymer. The amorphous polymers do not possess a recognized melting point; instead, they have a glass transition temperature. Therefore, when the temperature of the amorphous polymer is raised above its glass transition temperature, it increases the melt viscosity causing incomplete consolidation, more pores, and less strength. 10 Thus, the functionality of the manufactured parts from amorphous polymer is not adequate enough to meet the demands of the final use applications due to its inferior mechanical properties. 18 Thus, the amorphous polymers can be a good alternative to polyamides if higher mechanical properties are not mandatory. 9 However, the dimensional accuracy of the parts made from amorphous polymers is better than that made from crystalline polymers due to the shrinkage that occurred only in crystalline polymer sintering. 19 However, extensive published reviews detailing the research studies that focus and investigate the alternatives to LS standard polymers are well documented in the literature.9,11,20
Polyamide 12 (PA12), the targeted material, is one of the most frequently used and investigated polymers, among other semicrystalline polymers, for use in LS process for rapid manufacturing of 3D printed objects due to its ability to melt and bond using laser power better than other polymers. 10 Additionally, the follow-ability, semirounded shaped particles, and relatively low melting temperature of PA12 are favorable properties in LS. However, the performance of the finished parts made by LS from PA12 cannot fully meet the requirement of the final part applications compared with the traditional molding process. In the molding process, the fabricated parts were fully melted that allow fabrication of samples with consistent surface properties, 21 whereas the powder processed by LS is preheated to just below the polymer melting onset temperature before the laser power is applied. Preheating the build powder will keep the finished part temperature around the melting temperature until the consolidation is completed, avoiding the unwanted shrinkage and dimensional inaccuracies. 10 Therefore, LS process enables a production of objects without the need for any external pressure. Although such pressureless process allows for rapid manufacturing with no post machining, incomplete consolidation of the polymer particles and several micropores may occur.22,23 These pores formed during LS process located either on top/bottom surface, subsurface, or even in between layers 20 may lead to a reduction in the part density and anisotropic mechanical properties. Additionally, an increase in the surface roughness can also be noticed from the surface roughness measurements of the final products, which restrict their potential uses in different applications. 24 Surface roughness is resulted from the incomplete particle melting during powder processing via the moldless pressure-free LS process. 25 Evidently, for these reasons, the variation in surface characteristics, external/internal porosity, and surface roughness in the LS moldless parts were higher than the parts made by the conventional molding.21,24,25
The surface quality and internal structure of the LS parts has also a great influence on the final properties, especially the mechanical properties (tensile strength, modulus of elasticity, and elongation ratio). 23 Weakness and variation, in mechanical properties, are not limited to tensile properties but can include other properties, like hardness.26,27 Although hardness is not a fundamental property as tensile as in some applications, it also can be a key challenge in LS process. Efforts to tailor the LS build parameters that influence the final properties of the LS parts have noticeably increased. Thus, some physical and mechanical properties have been improved to enhance their potential applications.28–30 However, research efforts have focused less on the surface roughness of LS parts, which can be addressed to guarantee their reliability. Thus, the surface quality of LS parts still does not meet the requirements of applications requiring surface quality. The inclusion of nanomaterials with optimized LS production parameters can improve the surface properties of LS parts and widen their functional applications. 22 Although several types of available nanomaterials can be used to reinforce polymer matrices, nanoclays, among other types of nanofillers, can offer significantly improved polymer matrix properties. Other influencing factors are the LS parameters such as laser power, layer thickness, scan speed, and scan spacing. 31 A combination of adding fillers to the polymer matrix with poor surface properties along with optimized LS build parameters can achieve an improvement in weak properties.
In conclusion, surface properties have dominant influences in LS, thus tailoring these properties will surly broaden the scope of LS applications. Here, therefore, we introduce this study to characterize the effect of the inclusion of 3% nanoclay to PA12 polymer matrix at different laser powers.
Experimental Work
Materials and preparation method
The materials used in this study are PA12 and PA12 nanocomposite (PA12-NC). PA12 is a well-known, semicrystalline thermoplastic polymeric material, which is specifically produced for LS applications. Virgin PA12 powder provided by Electro Optical Systems (EOS) was mixed with reused powder from the same batches with a mix ratio of 50:50 between the reused powder and virgin powder to reduce powder waste. The main PA12 particle size is 60–80 μm. However, some particles from the previous LS process were consolidated together to form larger particles with size ranges of 100–120 μm.
The Nanomer I.34TCN nanoclay used to reinforce PA12 is a montmorillonite-based clay modified with an organic surfactant purchased from Sigma Aldrich Chemicals, UK. The PA12-NC was prepared by incorporation of 3% I.34TCN powder into PA12 powder, which was mixed via a process described in our previous study.22,32 Nanoclay particles, one-dimensional nanosized particles, range from 10 to 100 nm. However, aggregated particles have a range of 1–20 μm.
LS
Parts were made via LS from PA12 and its composites at three different laser power: 13, 17, and 21 W. Other LS parameters are as follows: part bed temperature, 172°C; layer thickness, 0.1 mm, laser speed scan, 2500 mm/s; and scan spacing, 0.25 mm. The samples were all fabricated in one direction (x–x direction) and in a nitrogen environment to avoid contamination. In Table 1, materials, preparation steps, and LS specifications used to produce the surface roughness samples are detailed.
Materials, Preparation Steps, and LS Specifications Used to Produce Surface Roughness Samples

LS, laser sintering; NC, nanocomposite.
Scanning electron microscopy
Scanning electron microscopy (SEM) was performed using low voltage NovaSEM at the Department of Material Science and Engineering at the University of Sheffield. SEM images were obtained using secondary electrons at low-landing energy of 2.0 KeV or below, to avoid surface charging and damage.
Surface roughness measurement
The LS samples were produced in one build direction and assessed for roughness on both their top and bottom surfaces.
i. Roughness parameters
Understanding the surface roughness of the finished product is crucial for several basic difficulties of the part’s use, such as contact deformation and friction. Some roughness parameters may be used to characterize surface roughness. Detailed information on these parameters and their calculation formulae may be obtained in scholarly works like as Gadelmawla et al.
33
Included below are the specifics of the commonly accepted parameters used in this study:
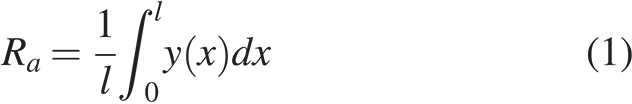
Ra (Arithmetic average height):
The average along the centerline, often known as the centerline average, is the most common surface roughness metric used in quality control. It is defined as the mean absolute deviation of roughness irregularities from the centerline for each sample length. It offers a comprehensive assessment of the surface roughness. It is widely employed as it provides a simple average of surface peaks and valleys, making it advantageous for general surface quality assessment, such as evaluating the overall smoothness of the sintered surface to guarantee adherence to functional or regulatory standards.
34
The representation of this parameter is shown in Figure 1a. It is simple to define and measure, and it offers enough information regarding the surface profile’s height changes. The Ra is mathematically defined as follows:
Definitions of the parameters.
Rq (Root-mean-square roughness)
Rq is also called RMS. It displays the standard deviation of the distribution of surface heights and is thus a statistical tool for describing surface roughness. In the event of a significant variation from the mean line, the Rq is believed to be more sensitive than the Ra. The mean line is defined as the line that divides the profile such that the total of the squares of the profile height deviations from it equals zero. It offers a more accurate representation of the overall texture when the surface exhibits irregularities. Rq can be critical for applications where stress concentration due to surface irregularities may result in mechanical failure. Thus, it is crucial for forecasting fatigue life, particularly in high-performance industries such as automotive and aerospace engineering.35,36 This parameter’s mathematical definition is as follows:
Rz (10-point height)
It is the average height difference between the five highest peaks and the five lowest valleys along the profile sample length. When compared to Ra, Rz is more sensitive to detecting high peaks and deep valleys. It highlights the extremes of the surface profile rather than the mean. This improves its effectiveness in addressing surface irregularities such as deep depressions or elevated peaks. It is commonly utilized in industries such as machining, product finishing, and coating, where controlling excessive roughness can prevent failures due to wear, sealing issues, or poor adhesion of coatings. Rz is crucial for sealing surfaces or mating components, as substantial peaks or valleys may compromise the integrity of the assembly.
37
Figure 1b presents the definition of the Rz parameter. The following is the mathematical definition of Rz:
Rt (Maximum height of the profile)
Rt is defined as the vertical distance between the height of the profile’s highest point and the greatest valley depth along the profile’s length of evaluation. This parameter is believed to be very sensitive to extreme peaks and valleys. It is used for components requiring precise fit or where sealing surfaces are important to high-precision applications. In additive manufacturing, Rt is emphasized as a crucial statistic for assessing postprocessing needs for LS components. The representation of this parameter is shown in Figure 1c. From Figure 1c, the formula below is derived:

ii. Surface roughness test
In this study, the SRT-6200S surface roughness tester was used to assess the surface roughness of the top and bottom surfaces of each specimen. Four roughness parameters Ra, Rz, Rq, and Rt were measured. Measurements were recorded over an evaluation length of 4 mm at a transverse speed of 0.5 mm s−1, using a stylus with tip radius and angle of 10 μm and 60°, respectively. Gaussian filtering with a cut-off length of 0.8 mm was applied.
The surface roughness is recorded in a line form; therefore, four lines of measurements were undertaken along each surface. In each line area, measurements were repeated 10 times.
Results and Discussion
Surface morphology using SEM
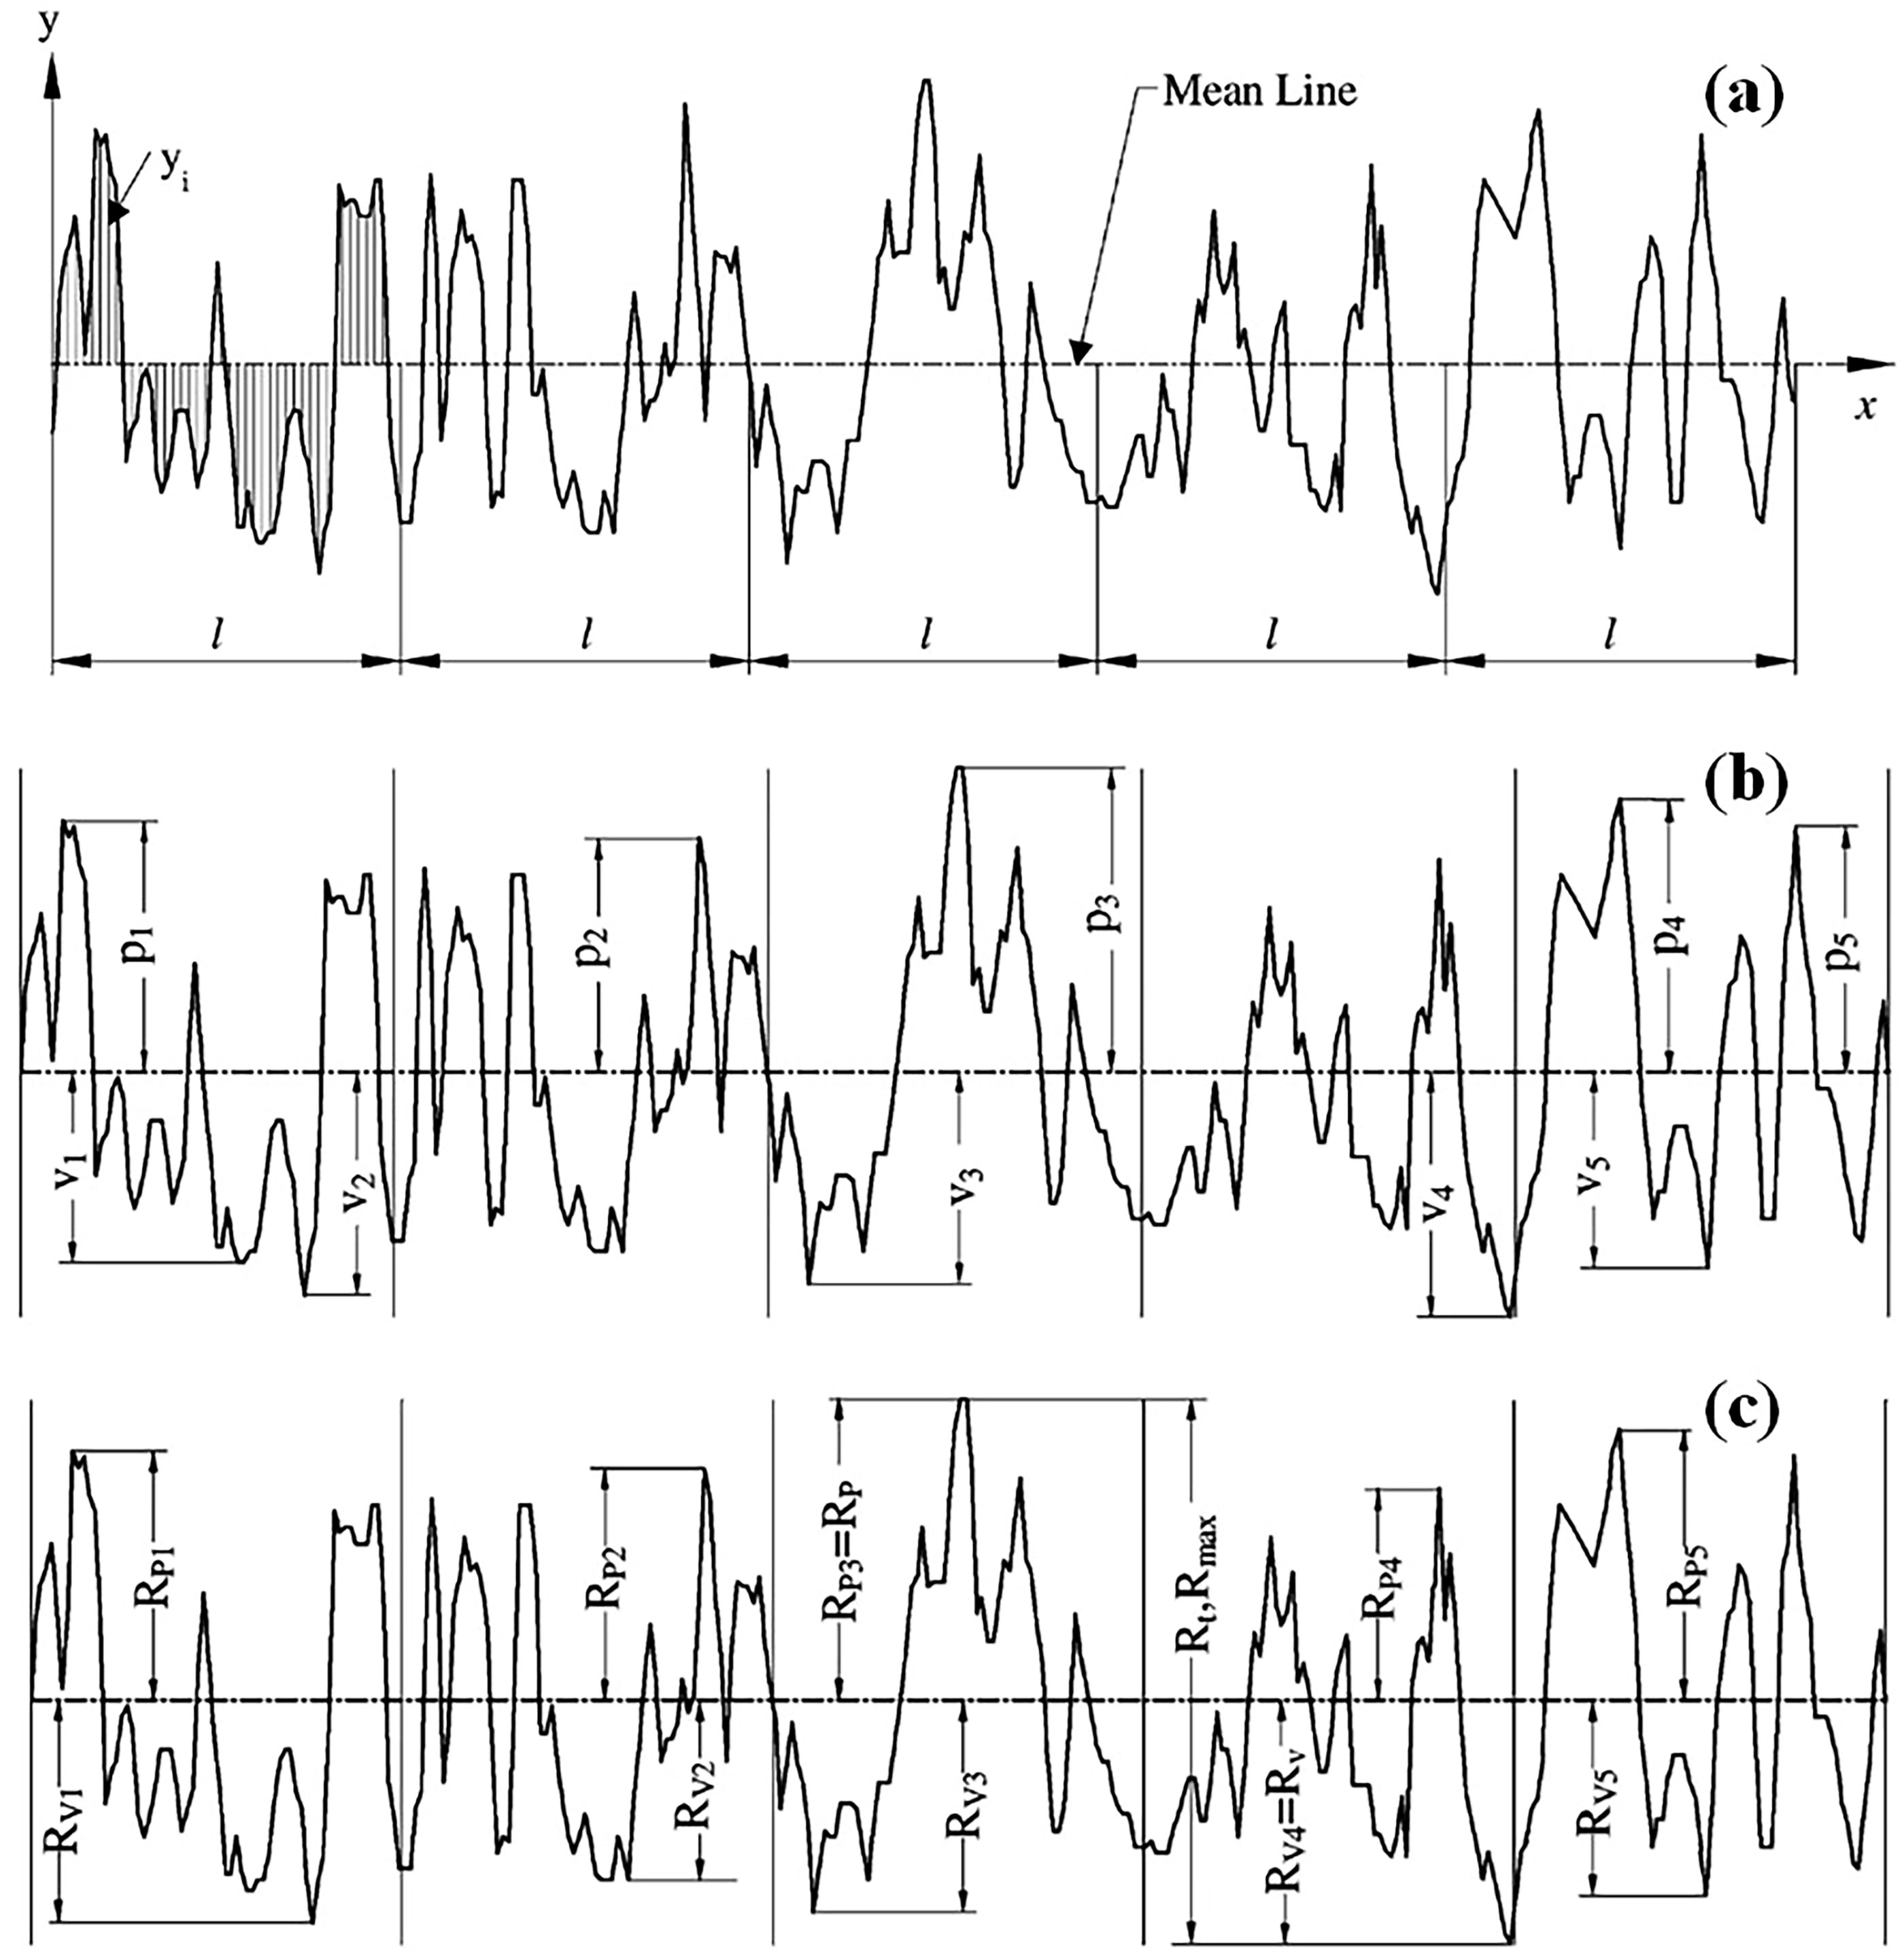
Figure 2 presents the SEM of one edge of LS sample fabricated from PA12 showing part of the cross-section (red box), part of the upper surface referred by the yellow arrows, and part of lateral surface marked with blue arrows. As observed, the cross-section shows that a relatively elongated surface occurred before it broke under tension force, whereas the exterior surfaces, top and lateral, were not deformed but were fully covered with unmolten or partially melted PA12 particles. These particles possibly adhered to the top sintered layer before they were solidified. 38
SEM micrograph of the exterior surface morphology (upper and lateral views) and the cross-sectional morphology. Yellow arrows represent the upper surface, whereas the light blue arrows represent the lateral view. SEM, scanning electron microscopy.
Surface morphology and topography of the exteriors, mainly the top surface, represent important properties for the evaluation of the surface roughness and hardness; thus, SEM images at higher magnification were collected from the top surface of the LS samples. SEM images in Figures 3 and 4 represent the surface morphology of the top surfaces of PA12 and PA12-NC specimens, respectively. For a PA12 specimen, it can be clearly noted that the PA12 particles were selectively fused together in a layer-by-layer technique to form the final 3D specimen. However, incomplete fusion of some particles, identified with the red oval in Figure 3, resulted in particles adhered to each other on the top melt layer. These particles, as observed in Figure 3, became a smooth and highly rounded shape and began to create particle-to-particle connecting bridges but without full consolidation.

SEM micrograph of the upper surface morphology of PA12 specimen showing the partially melted particles (highlighted with red oval) and the formation of surface and interior pores indicated by yellow arrows. PA12, polyamide 12.
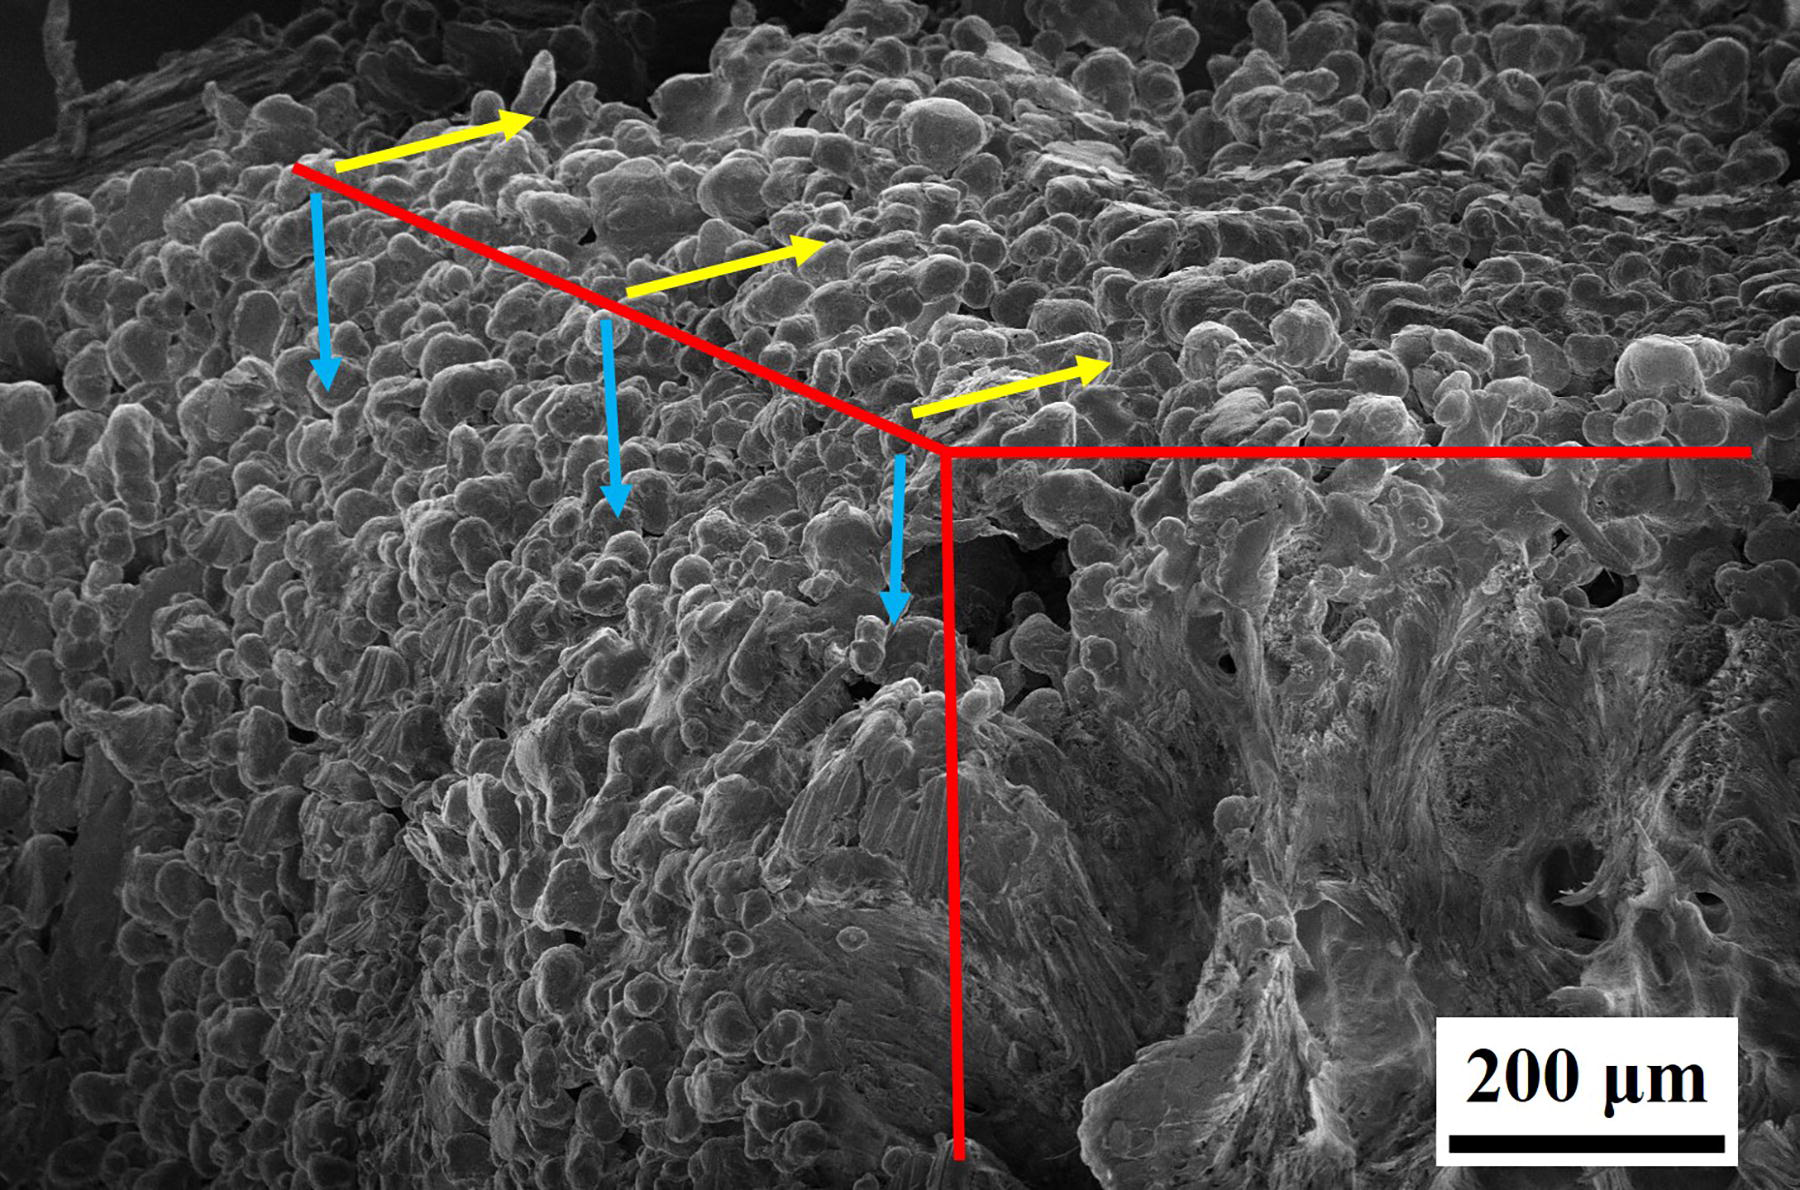
SEM micrograph of the upper surface morphology of PA12-NC specimen displaying the partially melted particles (highlighted with red oval) and the formation of surface and interior pores (indicated by yellow arrows), in addition to the nanoclay platelets were incorporated within PA12 particles (well-distributed nanoclay encircled with dark blue circle and microaggregated nanoclay indicated by dark blue arrows). NC, nanocomposite.
Lack of complete consolidation also resulted in an increase in the formation of pores as shown in Figure 3 (highlighted by yellow arrows). These pores will surely affect surface properties, like surface hardness and roughness of the fabricated objects. Other adjacent particles, which were completely unmelted particles, appeared that were not undergoing the laser energy; therefore, these were just adhered to the partially melted particles without any joining bridges.
Similar findings were obtained in the LS PA12-NC specimen. Partially melted particles, completely unmelted particles, and formed pores were observed by means of SEM in Figure 4, which represents the PA12-NC specimen. However, a reduction in the porosity in PA12 composite specimen was observed in this figure compared with the PA12 surface. Additionally, the SEM micrograph of the PA12-NC in Figure 4 displays microaggregated nanoclay platelets which clearly appeared on PA12 particle surfaces (pointed at with dark blue arrows).
However, the presence of the distributed nanoclay within polymer particles, also observed in Figure 4 (highlighted by dotted dark blue circle), can significantly affect the surface properties of the LS PA12-NC specimen. The chemical bonds formed between the nanoclay and polymer chain may affect the surface properties of the LS specimen. Better distribution of nanoclay particles can lead to a strong interaction within polymer surface and better surface properties. As observed in Figure 4, areas like those encircled with red dashed circles have well-distributed nanoclay and are better than other areas where the nanoclay builds as microaggregated particles. This will obviously increase the variation in the surface properties of the LS objects.
Surface roughness
Using the surface roughness tester, the surface roughness of the targeted materials PA12 and PA-NC were examined to validate the idea of this study. During the surface roughness examination, the top and bottom surfaces of the parts fabricated by the LS process are considered.
Figures 5–7 summarize the results of the surface roughness tests for all samples. Results are the respective values for the roughness parameter Ra (average height roughness), Rz (10-point height), Rq (root-mean-square height roughness), and Rt (maximum height of the profile).

Comparison of the surface roughness profiles of laser-sintered PA12 on the top and bottom surfaces at laser energies of 13, 17, and 21 W.
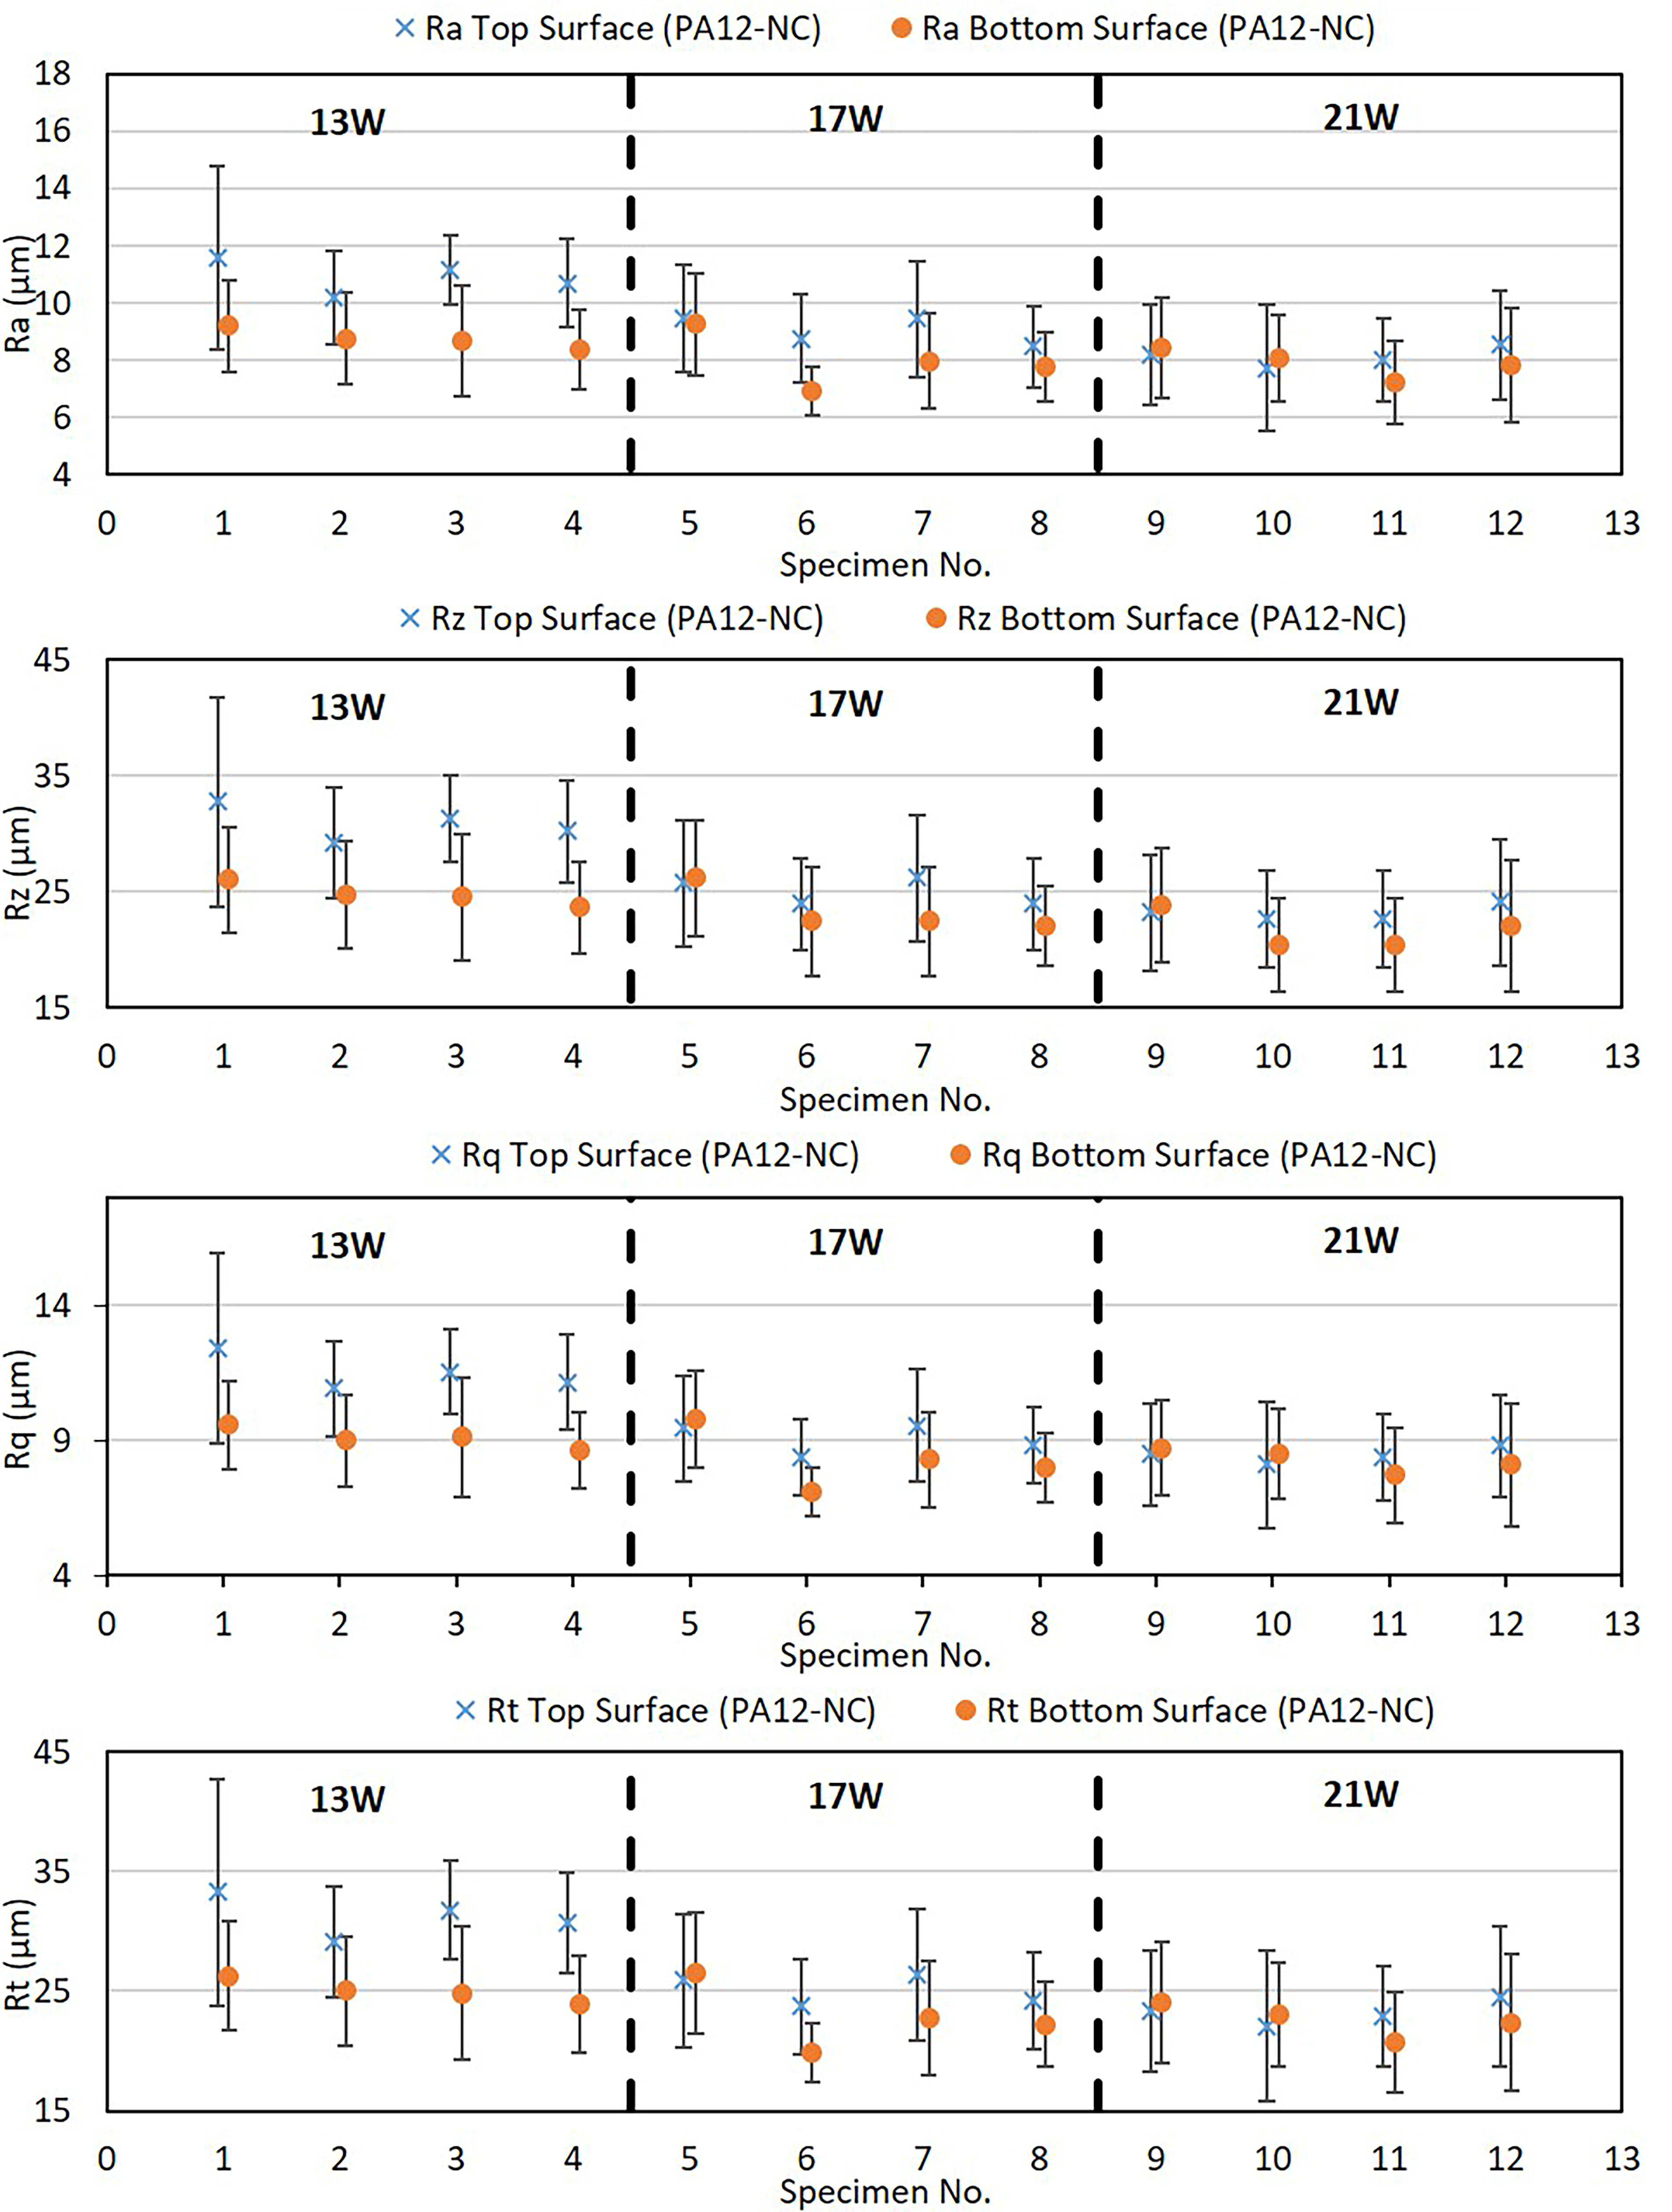
Comparison of the surface roughness profiles of laser-sintered PA12-NC composite on the top and bottom surfaces at laser energies of 13, 17, and 21 W.
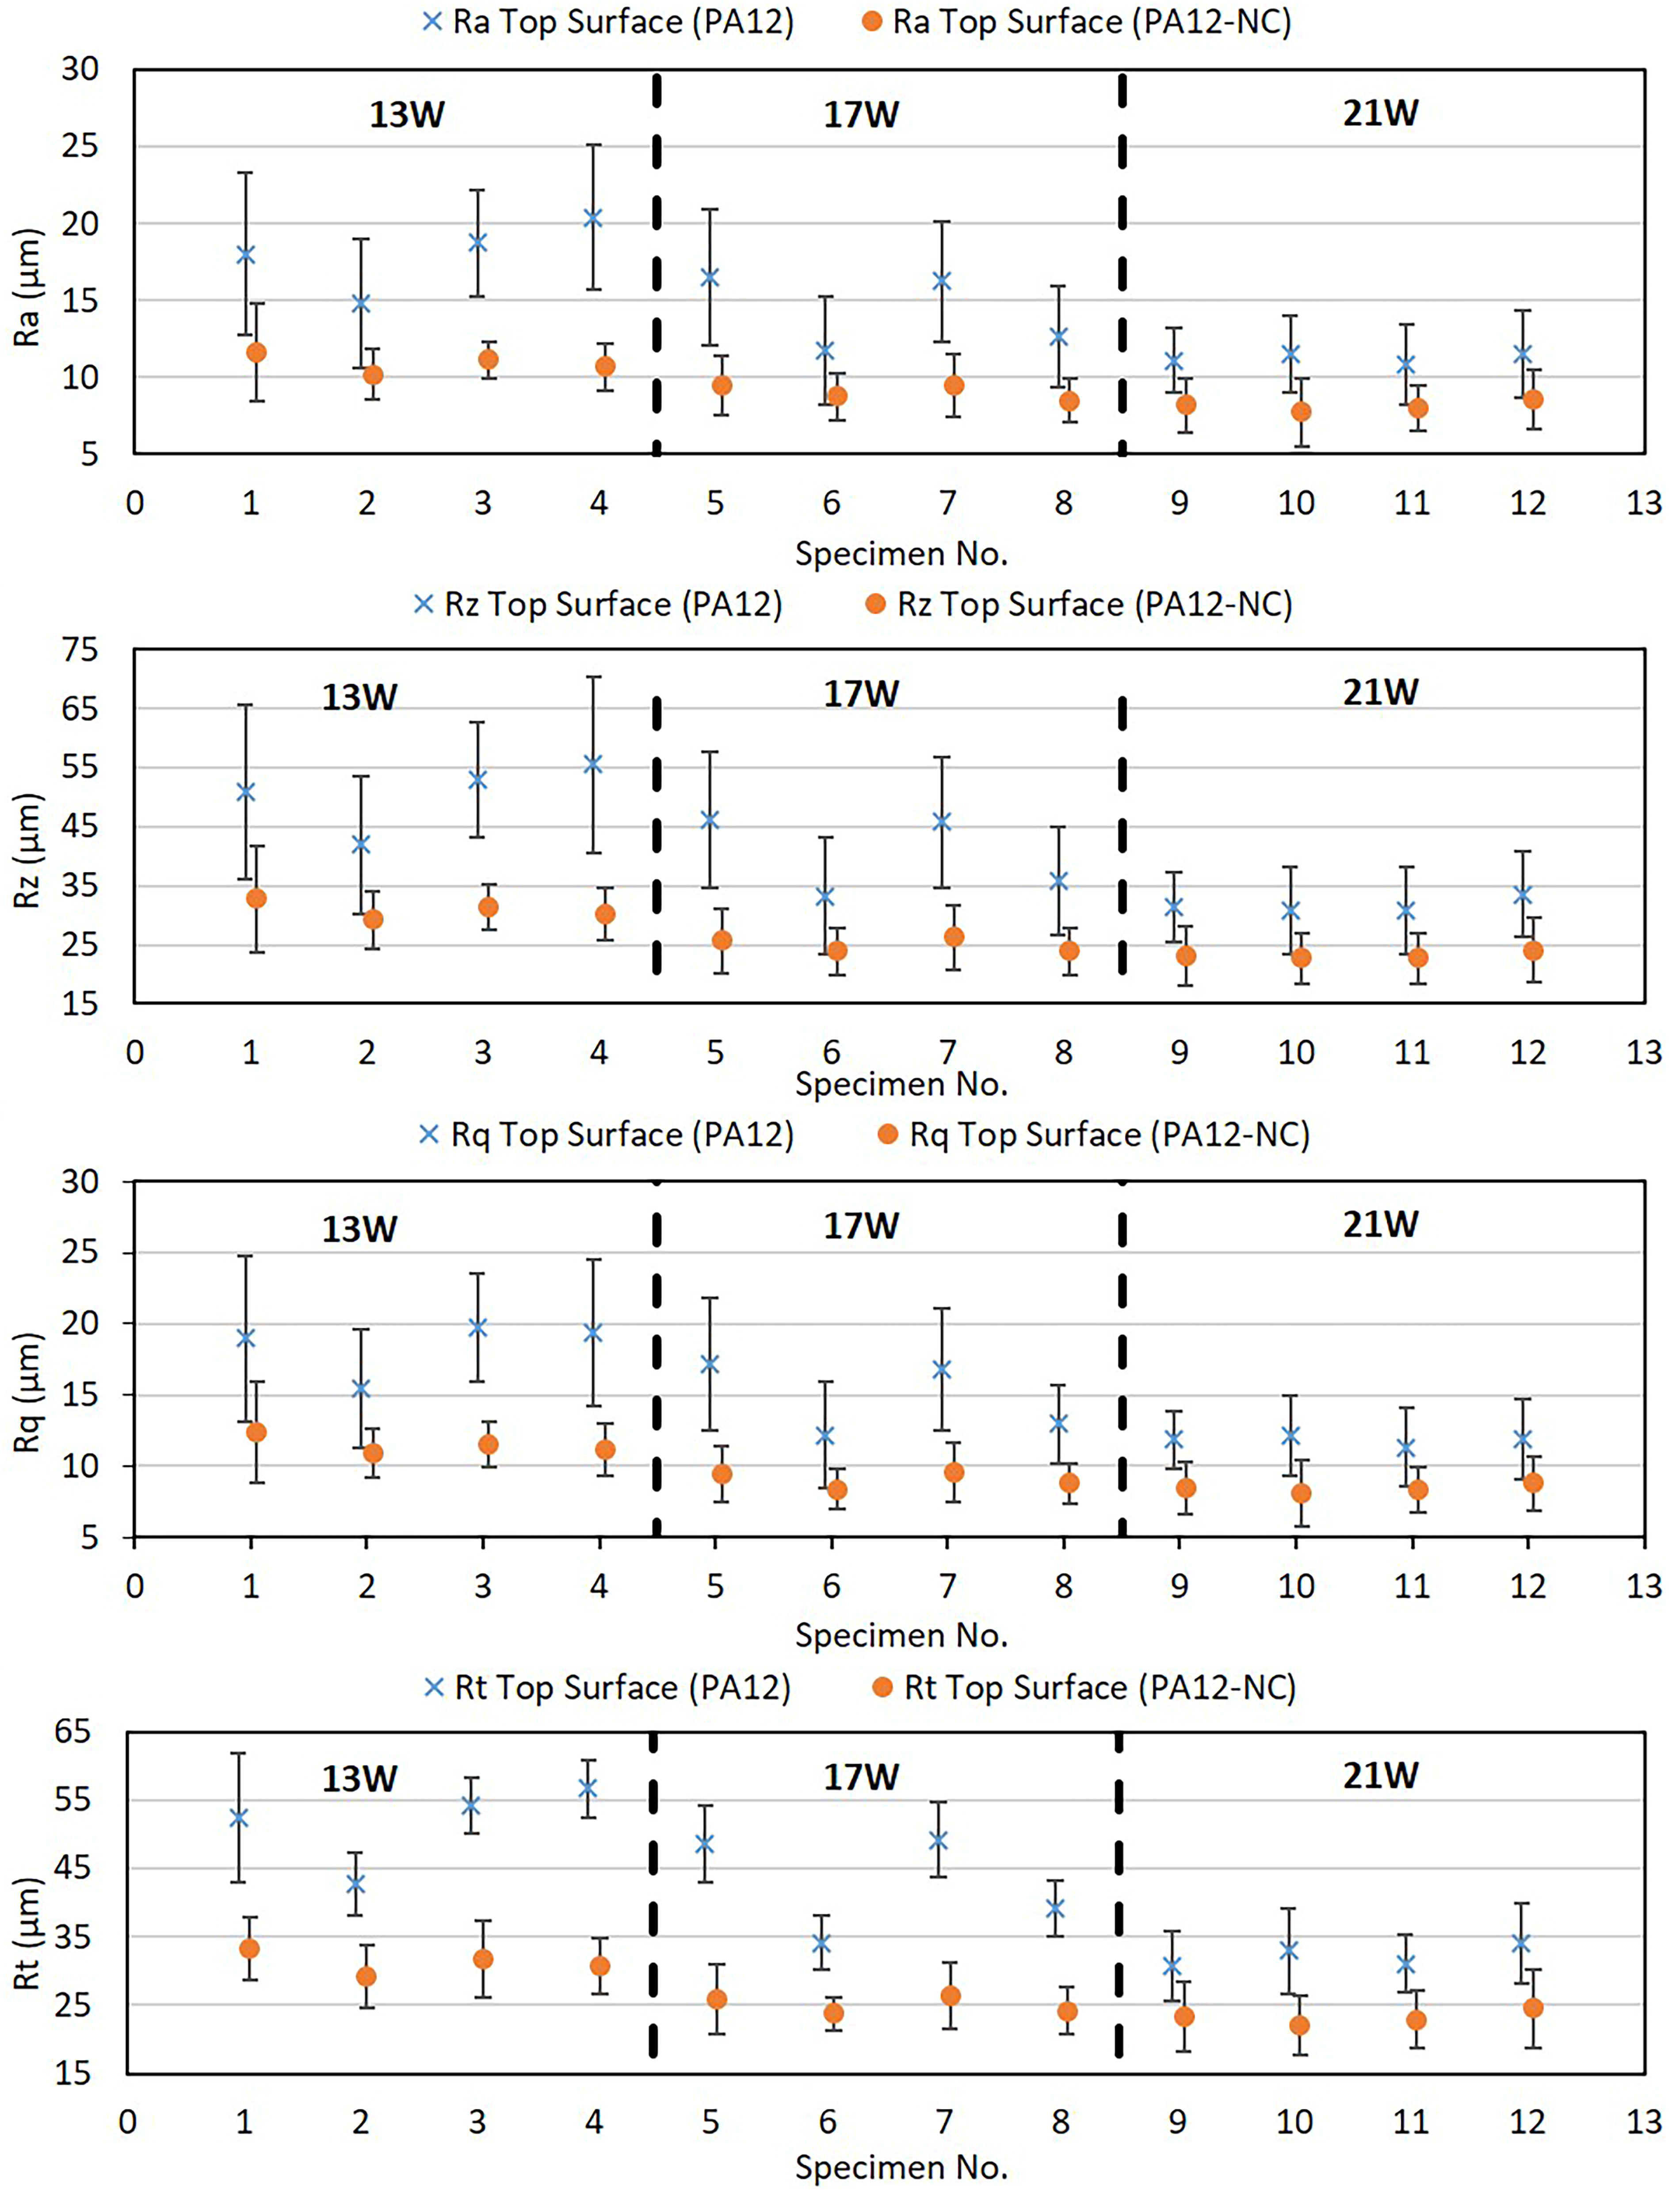
Comparison of the surface roughness profiles of laser-sintered PA12 and PA12-NC composite top surfaces at laser energies 13, 17, and 21 W.
Figure 5 depicts a comparison of surface measurements between the top and bottom surfaces of tested PA12 samples. The error bars in the graph indicate one standard deviation above and below the collected mean value. These results demonstrate that for all surface roughness parameters, the roughness values of the bottom surfaces are lower than those of the top surfaces.
The top surface of a part, which corresponds to the final sintered layer, appears to be greatly enhanced and becomes smoother as the energy density employed during LS is increased. The increase in the laser power, on the other hand, has a lower effect on the bottom surface as the contour power increases; the roughness of the surface was slightly reduced. Thus, the top surface seems rougher at all laser powers and exhibits a laser power-dependent responsivity. However, both surfaces exhibit a large variance in the obtained measurements, which may be attributable to the presence of unmelted PA12 particles at this energy level as well as the morphology of PA12 particles. The specimen with 21 W had significantly lower roughness values than the other settings.
In addition, when the energy density increased, the level of fluctuation in the gathered measurements decreased, and the roughness of the two surfaces became roughly equivalent.
Increasing the laser intensity causes a greater degree of melting and fusion between powder particles, resulting in a denser and uniform structure. This thus diminishes surface roughness by producing a surface with a reduced number of pores and voids. Surface roughness is a vital factor in determining the quality of LS components, as it affects their mechanical properties and appearance.
The noted reduction in specimen surface roughness with elevated laser power can be ascribed to the following factors:
Increasing the laser power elevates the intensity of the laser beam, generating additional heat at the material’s surface, which leads to melting and subsequent resolidification. This heat facilitates the rapid melting and solidification of the material, resulting in a smoother surface finish. Increased laser intensities lead to a more complete fusion of the material’s particles, yielding a denser and more solid section. This diminishes the quantity of cavities and surface imperfections, yielding a smoother surface. At lower laser strengths, the powder particles may not be fused together properly, resulting in loose powder clinging to the surface of the item. When the laser power increases, the powder particles are fused more completely, resulting in a better surface finish and less loose powder.
The obtained results demonstrate that boosting the power setting reduces extreme outliers in the form of peaks and notches. This result also supports the findings by Wesley et al. 39 Previous study, also, indicates that greater energy density levels were associated with increased mechanical qualities, whereas excessively high energy density lowered mechanical properties. 40 This effect is expected, as the increase in laser power is accompanied by a greater degree of sintering and a subsequent smoothing of the surface topography. Beard et al. 41 obtained remarkably comparable outcomes for LS polyamide samples assessed by optical profilometry. Moreover, de Oliveira Setti, Grazielle et al. 42 observed very similar findings that the surface roughness of the parts reduces as the laser power is increased when evaluating the association between the mechanical and surface properties of PA12 samples.
Due to many parameters associated with the LS process, the top surface of a component may have a higher roughness than the bottom surface. During the LS process, prolonged laser exposure and high temperature of the uppermost layer of powder compared with succeeding layers resulted in enhanced melting and fusion of the powder particles. This also resulted in the formation of a thicker layer of the powdered material on the build surface, leading to a rougher surface compared with the bottom surface, which is protected from the atmosphere by underlying material layers. Additionally, the elevated heat dissipation caused by the environment during the LS process leads to a cooling rate for the part upper surface that exceeds that of the lower surface, potentially resulting in a rougher textured surface. The roughness of the top and bottom surfaces of a PA12 component is comparable when employing a high-powered laser. The high laser power facilitates a uniform and consistent melting and fusing of powder particles throughout the whole component, yielding a more homogeneous surface texture. The elevated laser power provides adequate thermal energy to melt the powder particles, resulting in a more uniform and dense structure, which minimizes the formation of pores, voids, and other flaws that may lead to surface roughness. In addition, the larger melt pool formed by a powerful laser can result in better particle fusion, resulting in a smoother surface.
Plots in Figure 6 depict the effect of changing the power setting on the top and bottom surface roughness parameters of PA12-NC specimens. From these plots, it can be observed that as the power increases, the average surface roughness decreases. Although the surface becomes smoother as the power is increased from laser power 13 to 21 W, the collected data do not indicate that the roughness diminishes with increasing power (from 17 to 21 W). Moreover, the top surface has a larger roughness than the bottom surface, particularly at low-power settings. At increased power, the difference between the two surfaces becomes slightly discernible. Due to the effect of heat energy on the sintering process, the surface roughness of nanoclay specimens can decrease with an increase in laser power. When the laser power increases, the PA12-NC powder’s temperature rises, resulting in more fusion and densification of the material. As a result, the surface becomes smoother as the melted particles fuse together more fully. Czelusniak et al. 43 observed that increasing the laser power from 12 to 20 W significantly decreased the surface roughness of nanoclay composite samples. This effect was related to the increased thermal energy generated by the higher laser power, which led to a more thorough fusion and densification of the material, according to the authors.
Figure 7 depicts, with standard deviations, the effect of changing the specimen material on the surface roughness metrics under the same building process parameters. Comparisons between PA12 and PA12-NC (top surface alone) reveal that as the power setting increased from 13 to 21 W while the building process circumstances remained constant, the roughness metrics reduced. The surface roughness of sintered nanocomposite powders was much lower than that of normal polymer, indicating an increase in the end product’s surface quality. It is evident from Figure 4 that when the power increases, the average roughness value of PA12 decreases dramatically, whereas the PA12-NC specimen only decreases somewhat.
In addition, the variance of the PA12 data is significantly greater than that of the NC. This fluctuation decreases as power increases. This may be due to the existence of unmelted PA12 particles at the energy levels as well as the different morphology of PA12 particles compared with NC particles. This demonstrates the significance of comprehending the power setting of build surfaces for each material in order to improve average roughness values. When the power increases, the maximum peak height and maximum valley depth decrease. These maximum peaks are likely due to powder particles adhering to the surface of a totally melted object. Clay–polymer chain interactions raise the values of melt of fusion and heat of crystallization when clay nanoparticles are added. 44
Figure 8 shows a comparison of the bottom surface roughness parameters with the standard deviations between the PA12 and PA12-NC specimens. Generally, the PA12-NC specimens have less roughness value with slight variation from the mean value, whereas PA12 samples are rougher and more variable. In addition, increasing the power setting significantly reduced the roughness of the PA12 samples, and whereas PA12-NC specimens exhibit a slight surface roughness, improvements with the same power increase.
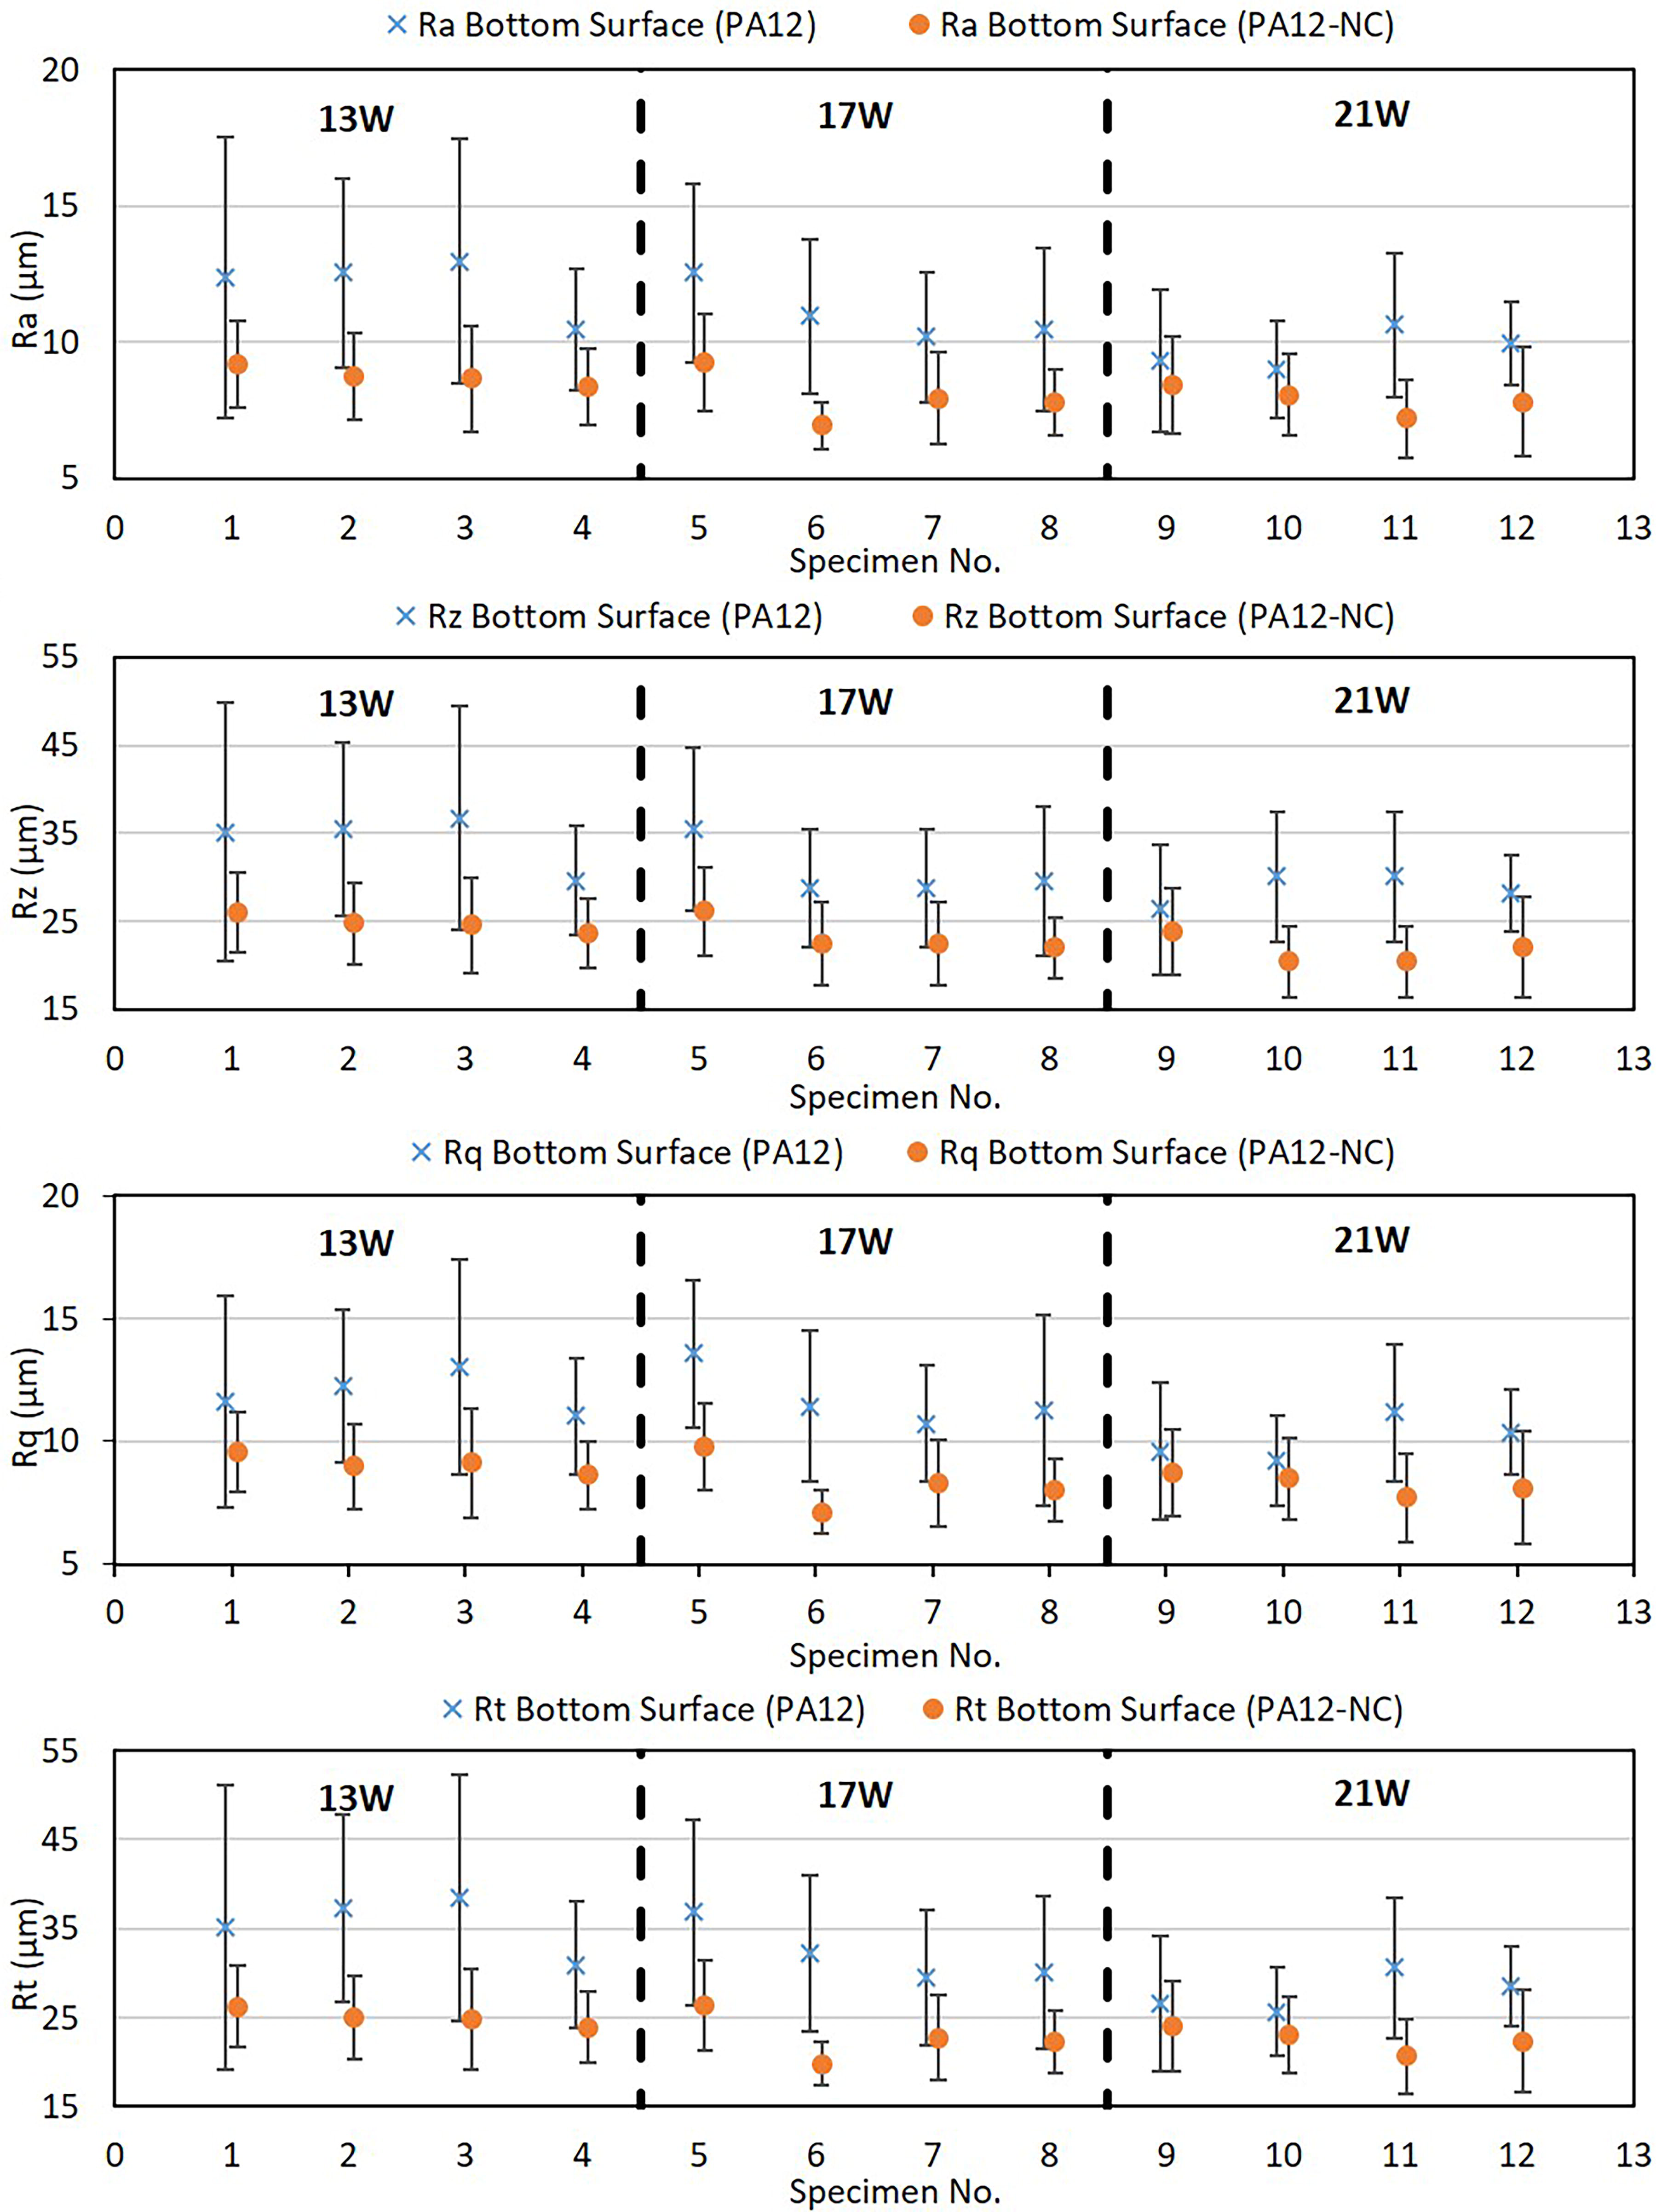
Comparison of surface roughness profiles of laser-sintered PA12 and PA12-NC composite bottom surfaces at laser energies of 13, 17, and 21 W.
The results of surface roughness characterization were supported by a SEM. The improvement in the surface roughness in the composite specimens is attributed to the reaction between nanoclay and polymer chains. However, the effect was more on the bottom surface of the specimens than the top surface, consistent with a study by Nar et al., 24 which tested LS polyamide-12 surfaces. The observed difference between top and bottom surface properties in LS polymer composites can be attributed to a different degree of polymer melting, distinct particle size, shape, and orientation. 24 Semimolten polymer particles on the top surface of the LS polymer composites (shown in Fig. 4) reduced the nanofilling efficiency; thereby, some open pores were present. However, a high degree of polymer melting at the bottom surface results in a better particle packing density, and hence reduced surface roughness.
Moreover, the microaggregated and distributed nanoclay particles on the surface of polymer particles altered the melt rheological behavior of the polymer matrix. This resulted in semimolten polymer particles in LS polymer nanoclay composites, which exhibited reduced pore size as displayed in Figure 4. Reduced pore size also means reduced surface roughness and increased mechanical properties. 45
In contrast, LS polymer 3D object surfaces (Figs. 2 and 3) exhibited larger pore sizes and rougher surfaces than LS polymer composites. The partially molten polymer particles in the LS polymer matrix have poor melt rheological behavior coupled with the lack of a nanofiller. This results in larger pore sizes. Polymer matrices with larger pores have a poor packing density of polymer particles, which results in reduced mechanical strength and increased surface roughness.
In summary, findings from the present study suggest that nanoclay particles interact with polymer matrix resulting in improved melt rheological behavior. Nanoclay filler forms physical and chemical bonds with polymer chains via physical and chemical cross-links.46,47 The physical cross-links involve electrostatic, hydrogel, ionic, hydrophilic–hydrophobic, and dipole–dipole interactions. Chemical cross-links involve stronger covalent bonding. 46 These physical and chemical bonds between nanoclay and polymer increase the packing density of particles, hence increasing the molecular weight and mechanical strength of nanoclay–polymer composites. 46 In the present study, the bonding between nanoclay and polymer particles improved surface properties (decreased surface roughness).
Conclusions
In this work, the surface roughness of laser-fused powder dependency on the laser power and surface orientation was evaluated. This was carried out by a combination of SEM technique and surface roughness tester. Moreover, the effect of nanoclay on the surface roughness of laser-fused polymer particles was studied. The obtained results have demonstrated that nanoclay as a nanofiller additive reduced the surface roughness of 3D objects prepared using polymer nanoclay composites. However, the effect was more on the bottom surface of the specimens than the top surface, consistent with a study by Nar et al., 24 which tested LS polyamide-12 surfaces.
Physical and chemical interactions between nanoclay and polymer particles improve the overall packing density in LS objects, hence smoother surface and improved mechanical strength. However, LS objects’ top and bottom surfaces exhibit distinct architecture of polymer particles. Bottom surfaces have better packing density due to better melt rheology, particle size, and shape. However, further studies are required to investigate the influence of the surface properties on the behavior of the produced LS products. Additionally, the effect of build orientation on surface roughness can also be studied as future work.
Authors’ Contributions
A.A.: Contributed to conceptualization, methodology, validation, formal analysis, investigation, data curation, writing—original draft preparation, writing—review and editing, visualization, supervision, and project administration. S.A.: Contributed to conceptualization, methodology, validation, formal analysis, investigation, data curation, writing—original draft preparation, writing—review and editing, visualization, and supervision. H.M.: Contributed to methodology, validation, formal analysis, investigation, data curation, writing—review and editing, and visualization. W.A.: Contributed to methodology, validation, formal analysis, investigation, data curation, writing—original draft preparation, and visualization.
Footnotes
Author Disclosure Statement
No competing financial interests exist.
Funding Information
No funding was received for this article.