
Abstract
The molten pool characteristics play a crucial role in the quality of parts formed through selective laser melting (SLM). Therefore, comprehending the evolution mechanism and studying the features of the molten pool during the SLM process are vital for optimizing the forming process. This study developed a multiphysics finite element model to simulate the laser selective melting of 316L stainless steel powder, considering factors such as phase change, recoil pressure, surface tension, and the Marangoni effect. The simulation results illustrated the temperature evolution, flow field, and surface morphology changes over time during the single-melt channel SLM forming process. The agreement between simulated and experimental surface morphology results was observed. Notably, the Marangoni effect causes fluid in the molten pool to move opposite to the laser scanning direction, leading to ripple formation on the surface and the creation of protrusions and depressions at specific points. Furthermore, the thermal gradient and solidification speed of solid–liquid interface of molten pool were analyzed; it was found that the solidification speed decreased with the increase of the depth of the molten pool and approached to zero at the bottom of the molten pool. Variations in molten pool geometry and length-to-depth ratio under different powers and scanning speeds were also analyzed, revealing that the molten pool geometry is more sensitive to changes in laser parameters at lower powers or scanning speeds.
Introduction
Selective laser melting (SLM) is a powder bed-based additive manufacturing method that enables the production of intricate 3D parts directly from CAD models. It has found extensive applications in aerospace, medical, mold manufacturing, and other industries. 1 However, the SLM process involves numerous intricate macro and micro physical phenomena, whose interplay can significantly impact the quality of the formed parts, posing challenges in controlling the structure and performance of SLM products.2-4 316L stainless steel, a low-carbon austenitic stainless steel known for its weldability, corrosion resistance, and oxidation resistance, is a commonly used material in aerospace, automotive, chemical processing, and biomedical field; it became of great interest in the research domain. 5 This material typically does not undergo solid-state phase transformation during cooling from molten to room temperature, simplifying the physical metallurgical process,6,7 and the microstructures, as well as mechanical properties, of 316L stainless steel can be improved by properly tailoring SLM processing parameters. 8 As a result, it is a preferred material for SLM forming and remains one of the most popular choices in current SLM applications.2,9
Due to the cyclic heat effect caused by the layer-by-layer melting and solidification of powder during the SLM forming process, unique microstructural characteristics inevitably exist in the formed part, including molten pool, 10 defects, 11 residual stress, 12 and nano-oxide particles. 13 These complex microstructures are influenced by over 130 factors, 14 such as the interaction between the laser beam and the material, heat transfer, solid–liquid phase change, and molten pool flow, among others. The Marangoni effect, which involves mass transfer along the interface between two fluids due to a surface tension gradient, 15 is a significant influencing factor. When the laser interacts with powder materials with micron-sized particles, the Marangoni effect can lead to a substantial transmission phenomenon.16,17
Various researchers have investigated the heat transfer of powder materials and fluid flow in the molten pool during SLM processes through numerical simulations, considering the Marangoni effect. Bandar et al. 18 developed a simulation model to predict the temperature evolution and thermal behaviors of the molten pool under various laser energy densities. The simulation results accompanied the experimental study and showed that the maximum temperature gradient within the molten pool was increased significantly with increasing laser energy densities. Taban et al.8,19 systematically studied the combined effects of various SLM processing parameters such as energy density, laser spot size, scanning strategy, scanning speed, and laser power on the microstructure and mechanical properties of 316L stainless steel. By comparing the microhardness, tensile properties, X-ray diffraction analysis, energy spectrum analysis, and scanning electron microscopy analysis of the samples under different parameters, the specific action mechanism of each parameter on the material properties was revealed, which provided a scientific basis for understanding the formation mechanism of SLM process. Xia et al. 20 studied the impact of the Marangoni effect on the flow of the molten pool by establishing a 3D volume of fluid (VOF) model of the SLM molten pool and analyzed the impact of the Marangoni effect on the formation of SLM defects. Yuan et al. 21 developed a simulation model based on VOF multiphase flow principles, accounting for recoil pressure from metal evaporation, and conducted experiments to assess recoil pressure’s effects on temperature and velocity fields of the molten pool under different laser process parameters. Meng et al. 22 established a 3D transient model for high-power laser manufacturing, conducting numerical simulations with varying laser powers, pulse widths, and Marangoni coefficients to investigate heat transfer and fluid flow principles during melting and solidification. Song et al. 23 simulated the melt channel in SLM processes and performed a single melt channel experiment, determining the relationship between process parameters, melt channel width, and its standard deviation coefficient to reconstruct real contours using a single-layer multipass contour 3D model. Khairallah et al. 24 developed an advanced SLM molten pool dynamics model, showing that surface tension is the primary driving force of the molten pool and highlighting the significant impact of recoil pressure and Marangoni convection in 316L stainless steel laser powder bed fusion.
Many researchers have conducted studies on optimizing the SLM process using numerical simulations and experimental methods.10,25,26 Despite this, there remains a gap in understanding the evolution of the dynamic characteristics of the molten pool during the SLM forming process of 316L stainless steel powder. A detailed and comprehensive description, along with research on the correlation between melt pool geometry and laser process parameters, is yet to be reported. To this end, this study developed a multiphysics finite element model to simulate the SLM process of 316L stainless steel powder. The model considered material phase change, recoil pressure, surface tension, and the Marangoni effect to simulate the evolution of the molten pool during the SLM process. The Arbitrary Lagrangian–Eulerian (ALE) dynamic grid method is utilized to simulate the dynamic surface of the molten pool, offering a more stable calculation process and accurate modeling of the free surface compared with other methods. 27 In addition, it provides improved accuracy in calculating surface tension effects and local surface curvature.28,29 The simulated surface morphology of the melt channel was compared with experimental results, showing good agreement. In addition, the evolution of molten pool geometry under various laser process parameters was simulated, and the correlation between changes in molten pool size and laser process parameters was analyzed.
Materials and Methods
Modeling
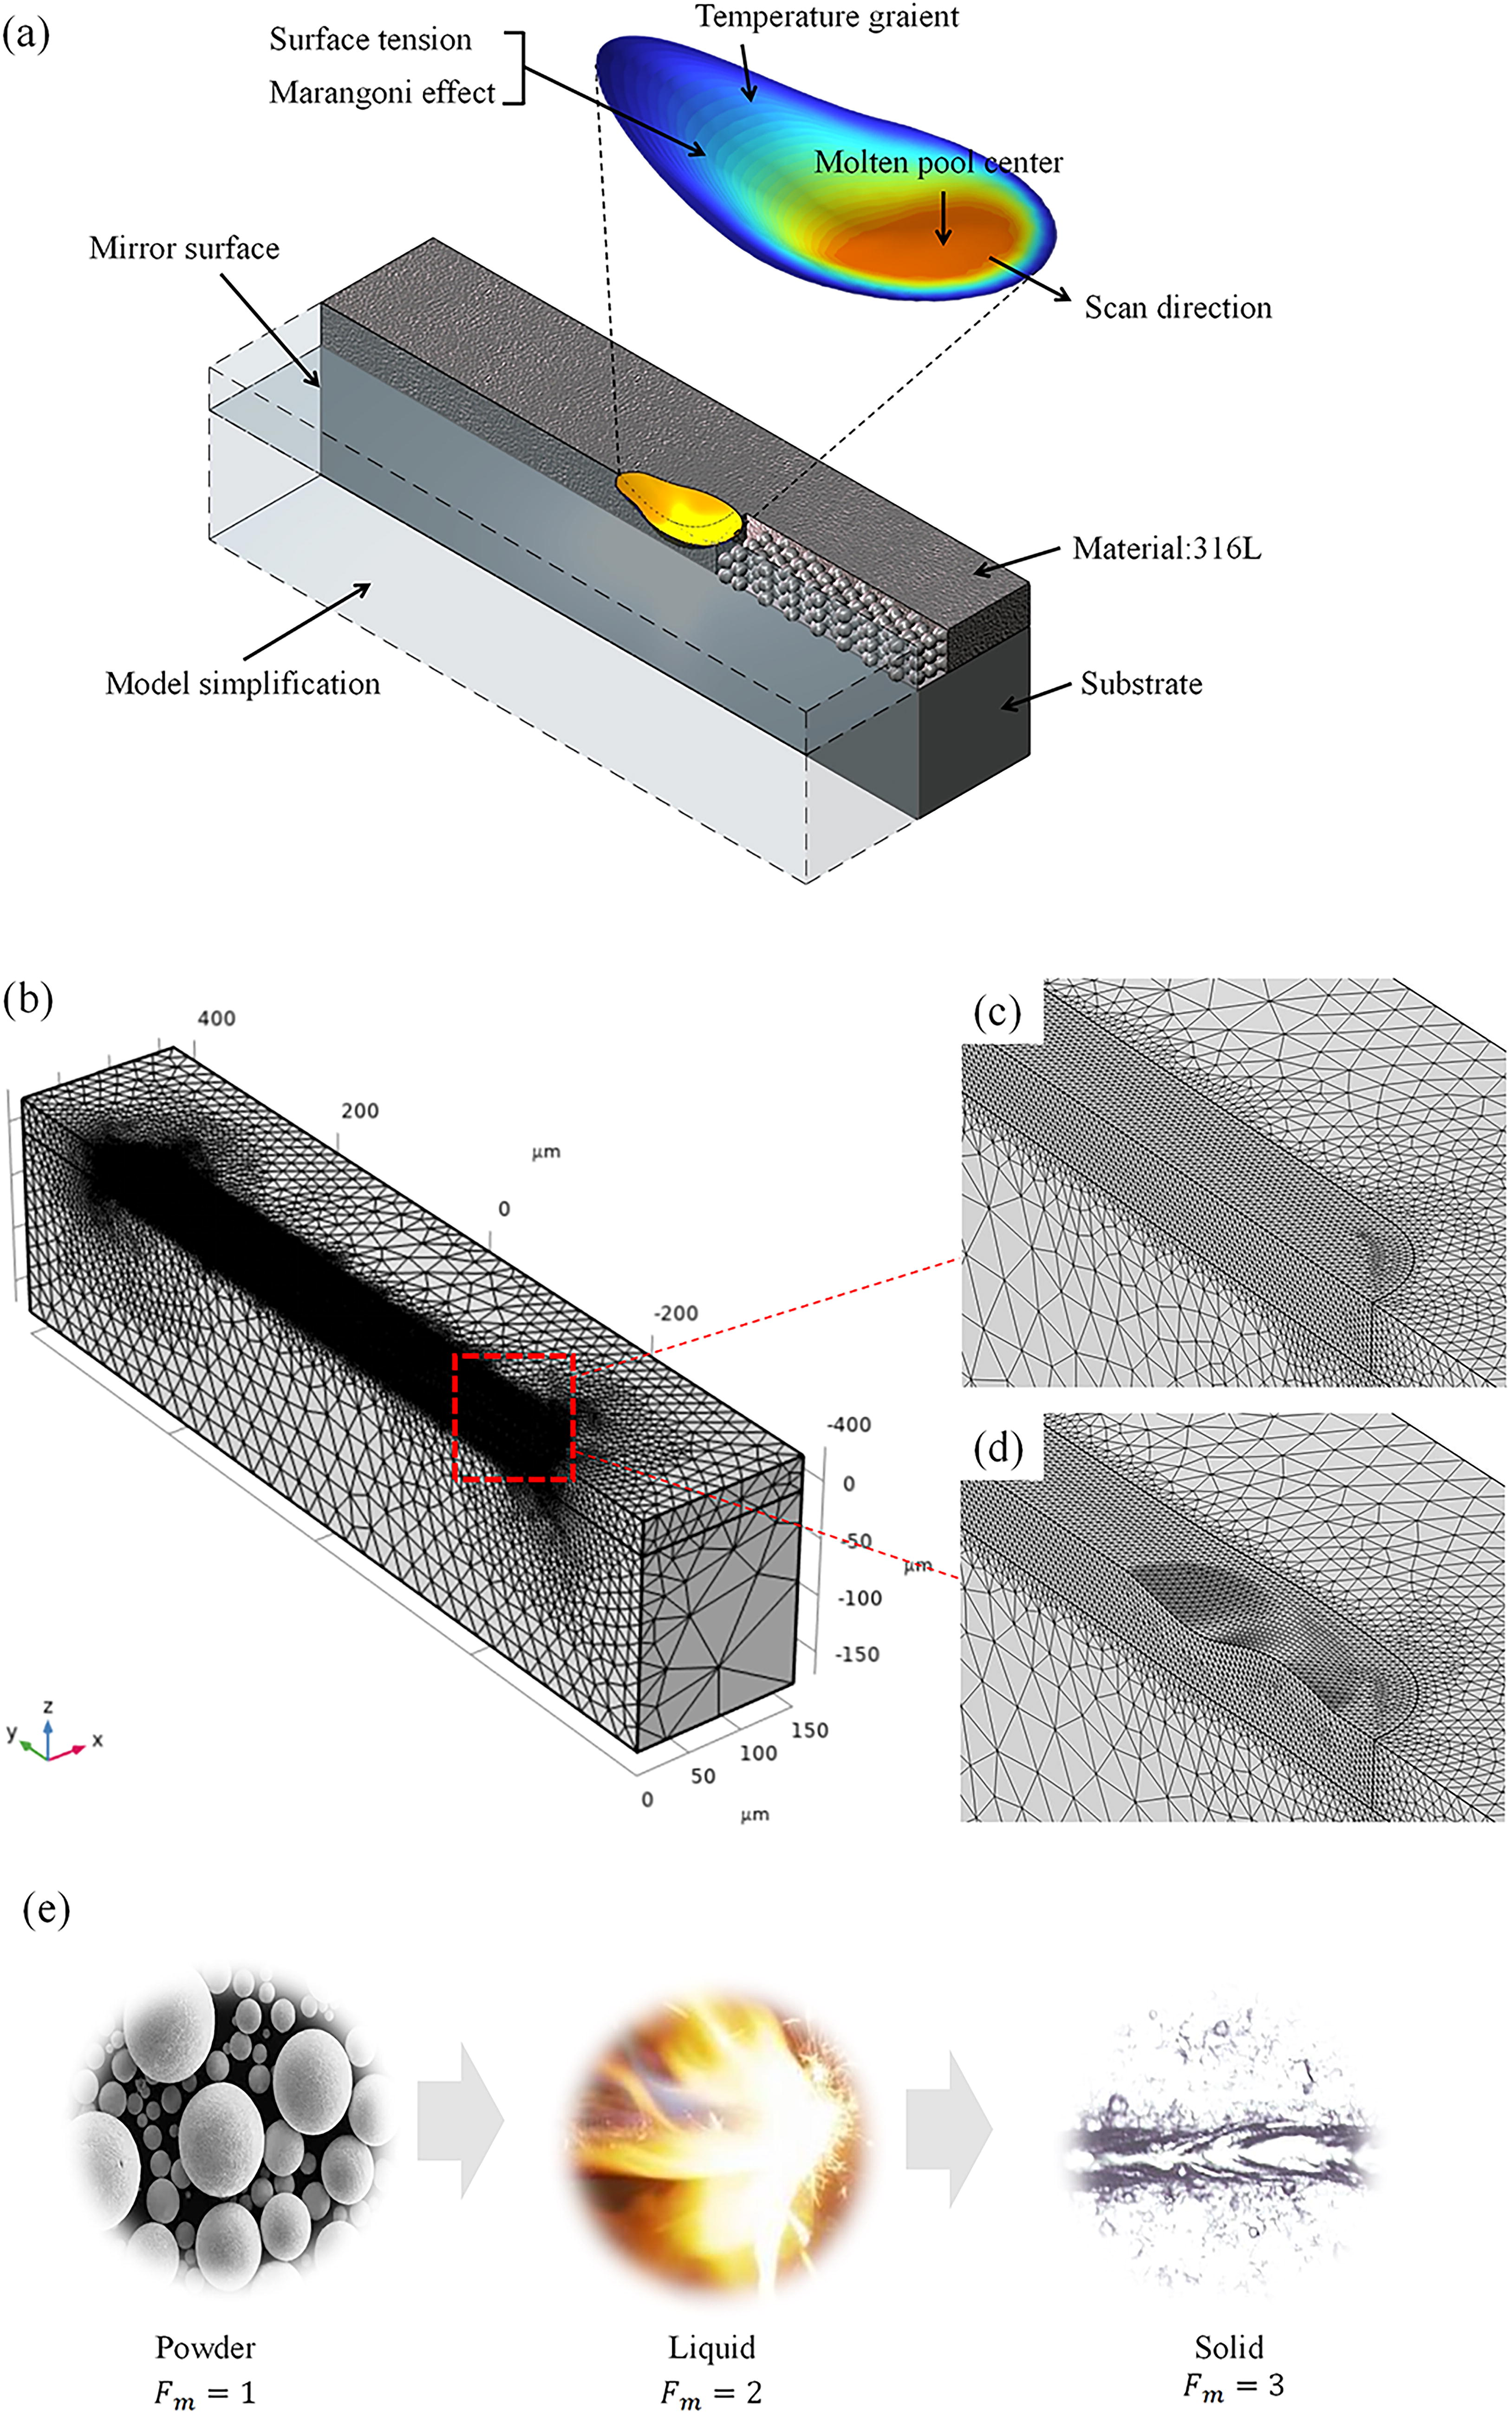
A schematic diagram of the SLM simulation physical model is presented in Figure 1a, incorporating factors such as the Marangoni effect, surface tension, material phase change, and recoil pressure. To enhance calculation efficiency and save simulation resources, the model is simplified to a symmetrical structure, with analysis and calculations performed on only one side. The results are then mirrored and postprocessed to generate a comprehensive analysis of melt pool evolution. The simplified model has dimensions of L: 800 μm, W: 300 μm, and H: 200 μm, while the thermophysical parameters of 316L stainless steel material can be found in Table 1.23,30
Thermal Property Parameters of 316L Stainless Steel
SLM is a complex multiphase change process involving transitions between solid, liquid, and gas phases. To streamline the numerical model, several assumptions are made as follows:
The discrete powder bed model is simplified into a uniform and continuous block model.
17
The molten material in the molten pool is considered an incompressible homogeneous Newtonian fluid, with the flow state assumed to be laminar.20,23 The absorptivity of the laser is held constant.
20
The mass of metal evaporated during the forming process is deemed negligible and therefore excluded from calculations.
Governing equation
The transient simulation field can be analyzed using the Euler–Lagrangian method. By solving the Navier–Stokes equation, the behavior of the discrete phase can be determined according to the motion rules of numerous particles within the calculated flow field. Therefore, the model presented in this article is founded on the Navier–Stokes equation for incompressible fluids, aiming to simulate the mass and momentum transfer of the fluid. The equation set is outlined as follows 31 :
Mass conservation equation:
Momentum conservation equation:
Energy conservation equation:
In the formula,
Heat source model
In this article, Gaussian surface heat source model is adopted,
4
and the input of Gaussian heat flux
In the formula, A is the absorption rate of the laser,
In the formula, x and y are the coordinates of the grid nodes,
Material phase transformation
During the SLM forming process, the powder material goes through a transformation from melting to solidification, during which it absorbs and releases phase change latent heat. As a result, the temperature field simulation analysis must take into account the phase change latent heat issue. The latent heat of phase change for 316L stainless steel can be characterized by its heat capacity, described as follows:
32
In the formula,
In the formula,
The latent heat distribution of the phase transition
In the formula,
To maintain the unmelted material in a stable flow field, the dynamic viscosity of the solid material is adjusted to 1000
Setting of boundary conditions
Thermal boundary condition
The boundary condition on the top surface of the model is defined as thermal convection with a convection coefficient as
Surface tension and Marangoni effect
The surface of the molten pool is defined as a free surface, and its surface tension is expressed as follows
34
:
In the formula,
Recoil pressure
When the material temperature reaches the boiling point and evaporation occurs, recoil happens on the material’s surface. The recoil pressure P can be calculated using Anisimov method
29
and is expressed as follows:
30
Where P is the recoil pressure, the unit is atm; T is the surface temperature, the unit is K.
Modeling of material state transition and mesh generation
To simplify the simulation model, the discrete powder layer model is simplified to a uniform and continuous block model. To enable the model to accurately simulate the state transition of powder materials in the SLM process (powder-liquid-solid, Fig. 1e), the material state function is defined as Equation (11).
17
The initial state of the material is 316L stainless steel powder, and the state function of the powder is defined as
Where
Based on the above definition of material states, the multiphysics simulation software (COMSOL Multiphysics 6.2, COMSOL Inc., Sweden) was used to simulate the state transition of materials. To improve the robustness of the calculation process,28,29 ALE dynamic mesh was used to simulate the free surface of the molten pool. Compared with other methods, ALE dynamic mesh method has the advantage of accurately simulating local surface curvature. At the same time, the grid around the laser heat source was locally refined to a size of 2 μm, with a total of 1,549,086 grid cells in the entire domain, as shown in Figure 1b, c. During the calculation process, the mesh is constantly updated at each time step, the deformed mesh is evaluated at each time step, and the mesh is automatically redivided according to the mesh size function once the spatial mesh quality Qmesh <0.2. Therefore, the quality of the grid is well guaranteed throughout the simulation process. Figure 2d shows the shape of the automatic repartition grid with a time step.

Experimental procedures
In the experiment, a 1080 nm wavelength IPG fiber laser with a maximum output power of 500 W was utilized. The theoretical spot radius was 40 μm. The substrate measured 160 × 160 × 15 mm and was made of 316L stainless steel. Before testing, the substrate’s surface was polished and cleaned with ethanol. Argon was used as a protective gas during the experiment to prevent oxidation of the 316L stainless steel powder, which had a particle size ranging from 15 to 53 μm. The SLM process parameters are shown in Table 2. After the completion of the experiment, an ultra-deep 3D microscope is used to observe and measure the characteristics of the melt channel.
Selective Laser Melting Process Parameters
Results and Discussion
Surface temperature distribution and morphology
The numerical simulation results in Figure 2a illustrate the temperature distribution and molten pool morphology. Under the action of the laser, the 316L stainless steel powder rapidly melts, reaching a temperature close to its melting point of 1690 K within 50 μs from an initial temperature of 300 K. Subsequently, the material’s temperature peaks at 3080 K in the same time frame due to continued laser irradiation. However, the cooling process, influenced by the release of latent heat during solidification, takes significantly longer than heating, resulting in a distinctive long tail region in the molten pool shape. Continuous laser exposure eventually leads the temperature in the molten pool to reach the boiling point, causing recoil pressure on the pool’s surface due to material evaporation. To better analyze the molten pool’s evolution, the analytical model is segmented into three sections labeled as A-A, B-B, and C-C (Fig. 2a).
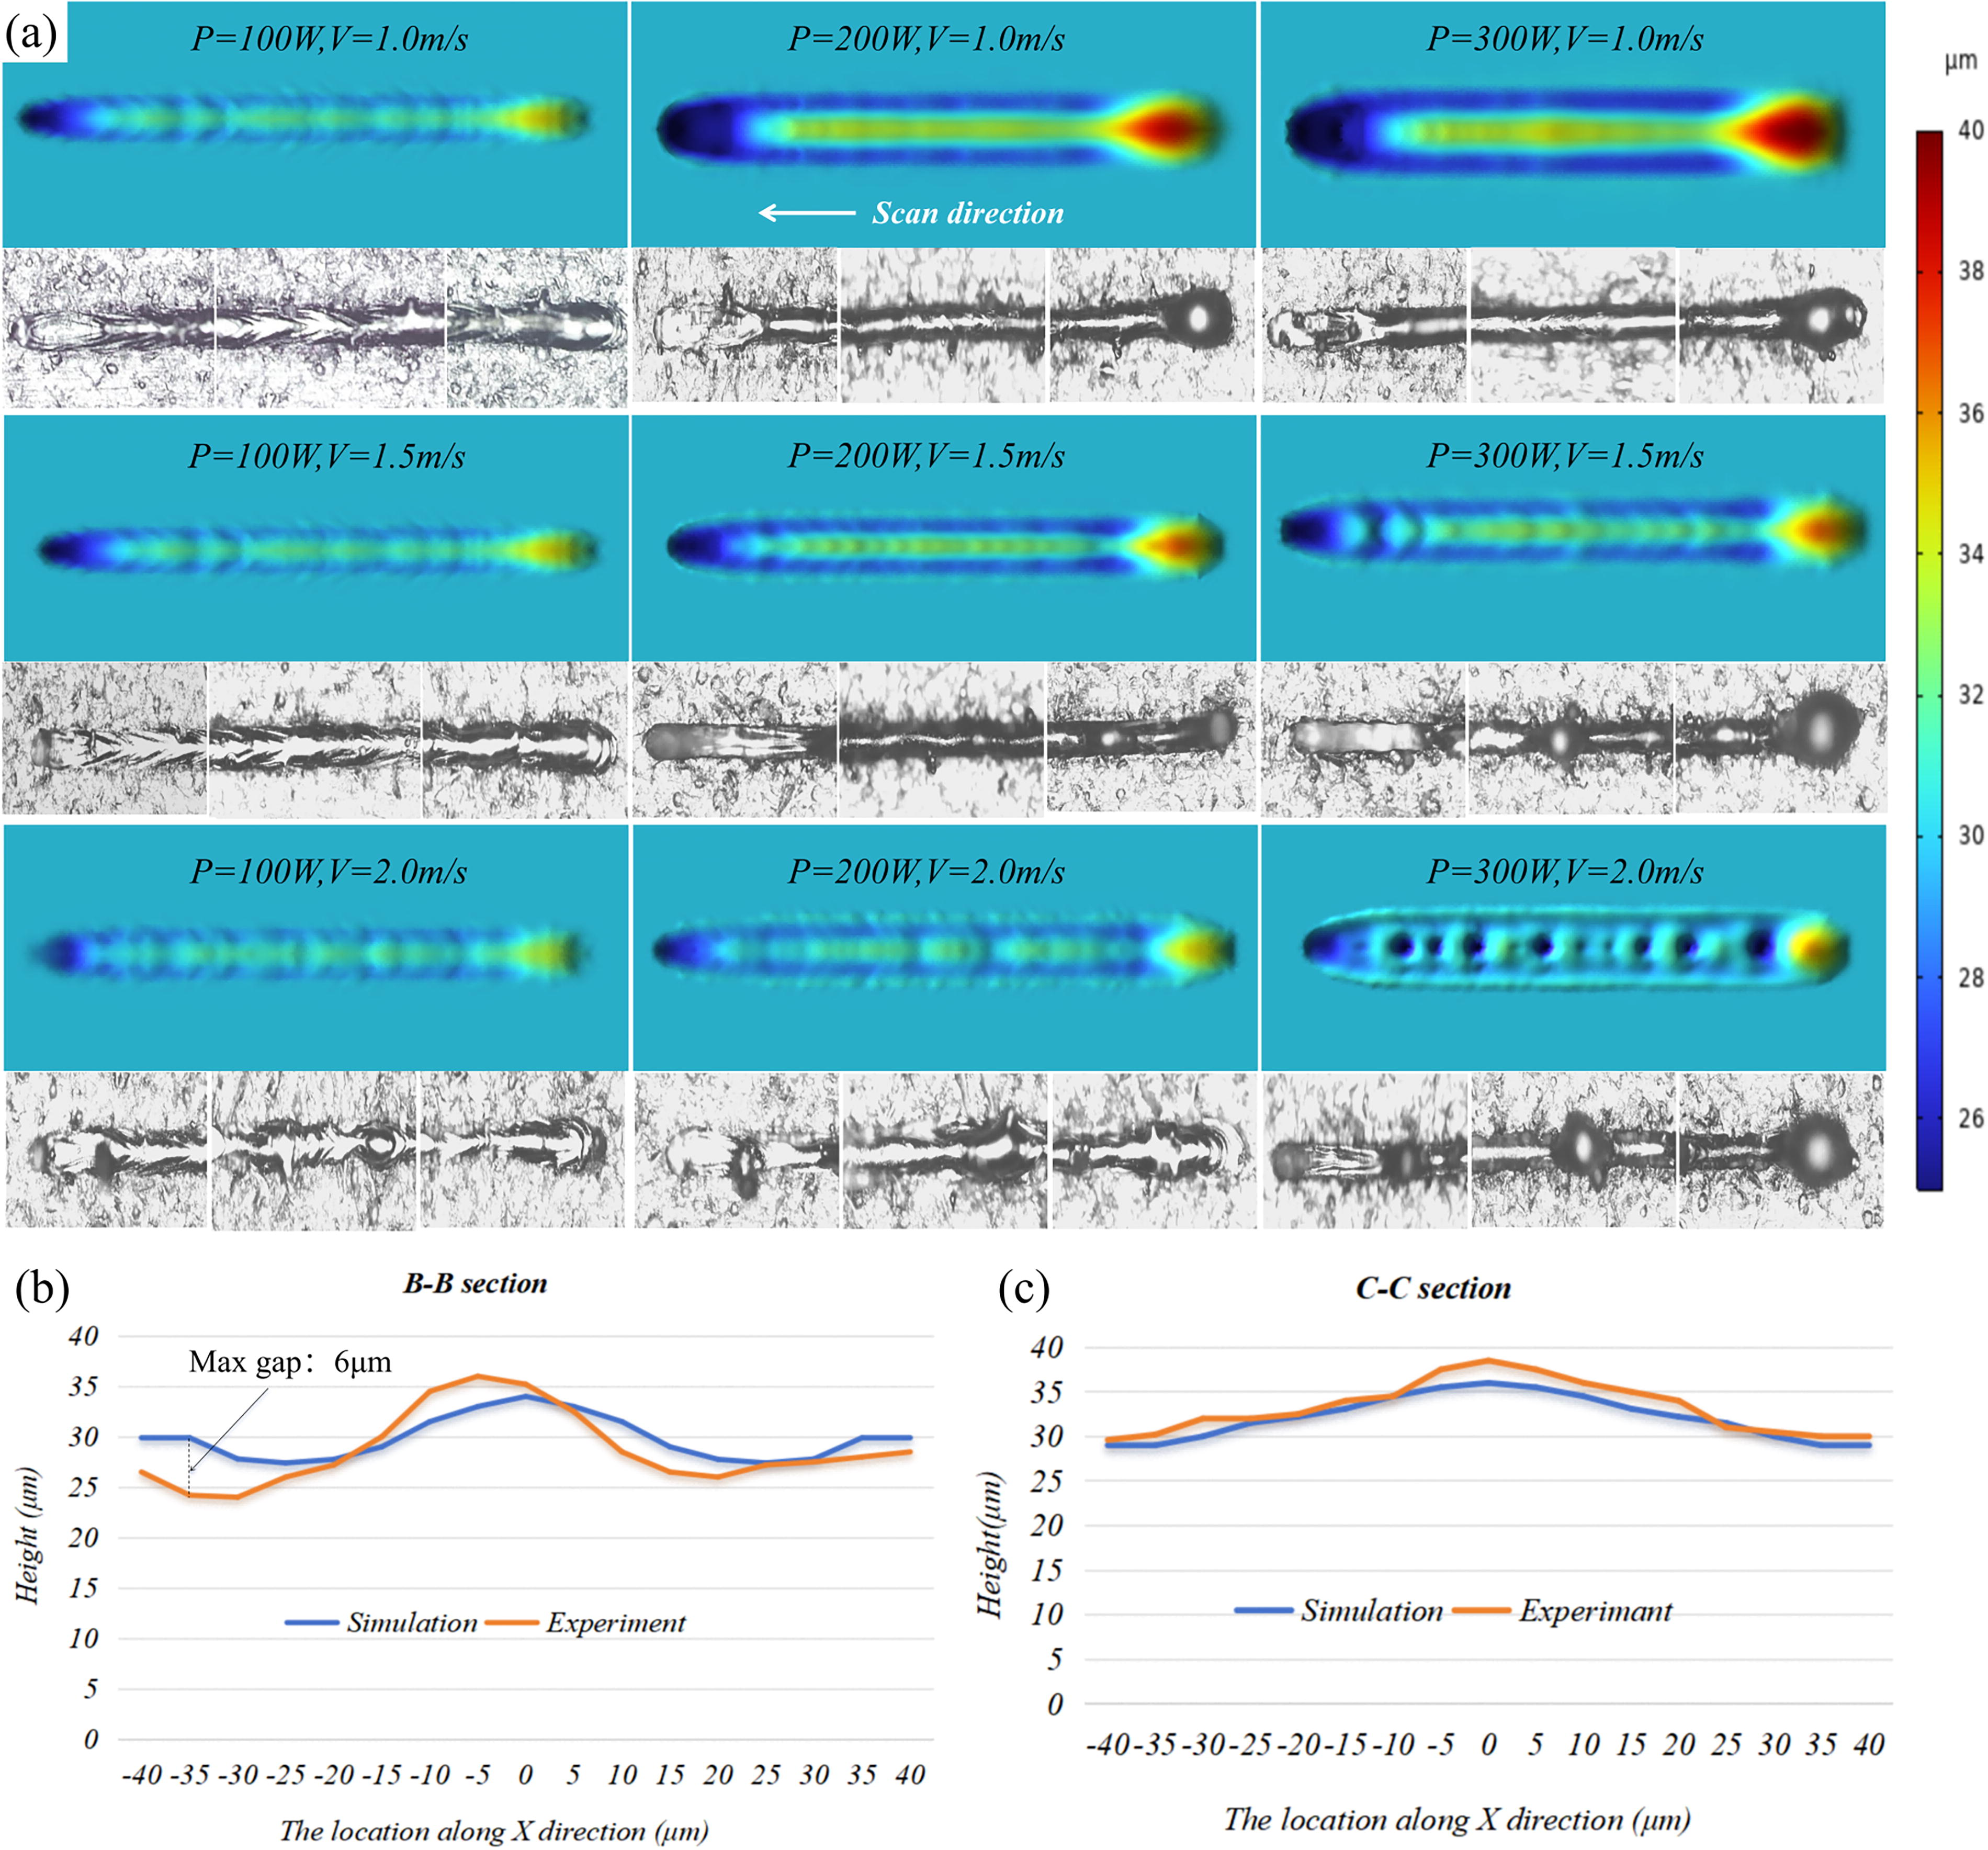
The comparison between simulation and experimental results of melt channel surface morphology at a laser power of 100 W and scanning speed of 1.0 m/s is depicted in Figure 2b. The figure illustrates that the beginning of the melt channel exhibits protrusion shapes with intermittent corrugation on the surface, whereas the tail and sides show depression features. The simulation results align closely with the experimental findings, validating the efficacy of the simulation approach.
Figure 3a shows the comparison between the simulation results and the experimental results of the appearance morphology of the fuse when the laser power is 100 W, 150 W, and 200 W and scanning speed is 1.0 m/s, 1.5 m/s, and 2.0 m/s, respectively. From the comparison results, it can be seen that under different laser power and scanning speed, the simulation results are basically consistent with the experimental results. Figure 3b,c further proves that the experimental results are also in agreement with the simulation. Dimensions of the surface morphology for the solidified molten track for both experimental and simulation results (when the laser power is 100 W and scan speed is 1.0 m/s) at two cross sections (B-B and C-C, marked in Fig. 2b) are shown. Compared with the simulation, the surface height of the molten track shows the same tendency along the x-direction. In addition, the accuracy reaches a range of ±6 μm for the two cross sections. The reason is believed to be the deviation of boundary condition of heat convection to the actual value.
Comparison between simulation and experimental results:
Evolution process of molten pool
Figure 4 illustrates the evolution of the molten pool morphology in the A-A section (marked in Fig. 2a) over time, showcasing the temperature distribution and fluid velocity distribution. The observation reveals that the size of the molten pool gradually increases with time, and the Marangoni effect, driven by the temperature gradient, becomes more pronounced on the surface of the molten pool (20–200 μs). The Marangoni effect is a hydrodynamic phenomenon resulting from the surface tension gradient of a liquid. That is, when there is a difference in surface tension at the fluid interface, the fluid flows from low-surface tension to high-surface tension. The black arrow in the figure represents the speed and direction of fluid flow induced by the Marangoni effect. The maximum flow speed reaches 4–5 m/s on the upper surface of the molten pool, flowing in the opposite direction to the laser scanning direction.

The anatomical image of the evolution of the molten pool (A-A section as marked in Fig. 2a): Flow field and temperature distribution of the different stages of molten pool evolution (oblique view). The solid–liquid interface of the molten pool is marked with black lines. The flow field is represented with black arrows.
After 100 μs, the Marangoni effect in the y direction is notably more pronounced than in the x direction, leading to the predominant transfer of molten material from the head to the tail area during the laser scanning process. Subsequently, ripples form in the melt channel upon cooling (Fig. 2b). In addition, bumps emerge at the initial section of the melt channel due to material accumulation. Over time, as the molten pool evolves, it eventually reaches a relatively stable state after 500 μs.
The evolution of the melt pool in the B-B section (marked in Fig. 2a) with y = 0 μm is depicted in Figure 5a. At 230 μs, a clear liquid level depression caused by recoil pressure from evaporation is observed, which gradually intensifies over time. Fluid flow is influenced by the Marangoni effect, as indicated by the black arrow in the figure showing flow speed and direction, with a maximum velocity vector of 1–2 m/s. By 270 μs, as molten material flows backward in the y direction, the recoil pressure diminishes, leading to solidification at the bottom of the molten pool and a rise in the liquid level. However, at 310 μs, solidification has occurred on the sides of the melt pool while the middle area remains relatively hot, resulting in protrusions during solidification. Consequently, depressions form on the sides of the melt channel and protrusions emerge in the middle, aligning with the findings in Figure 2b.

The evolution of the melt pool in the C-C section (marked in Fig. 2a) with y = −200 μm is depicted in Figure 5b. Initially, in the first 100 μs, the melt pool in the C-C section exhibits similar characteristics to that of the B-B section. However, there is a notable increase in the liquid level within the C-C section compared with the B-B section. As the C-C section evolves, the bottom of the molten pool starts to cool around 120 μs. The flow of molten material and the release of latent heat contribute to a longer cooling and solidification period for the molten pool, eventually stabilizing the liquid level after 200 μs.
Thermal gradient and solidification speed in molten pool
In the SLM process, the final quality and defect state of the sample depend on the solidification conditions of the molten pool. Adjusting the SLM process parameters can control the temperature gradient of the molten pool and the solidification speed of the solid–liquid interface to a certain extent, so as to improve the final sample defects. In this section, the variation of temperature gradient and solidification speed at different depths of molten pool is analyzed.
The temperature gradient of the symmetric plane in the x direction is zero, and the solidification speed of the metal is opposite to the direction of the heat flow, so the solidification speed of the plane in the x direction is also zero. In Figure 6a,
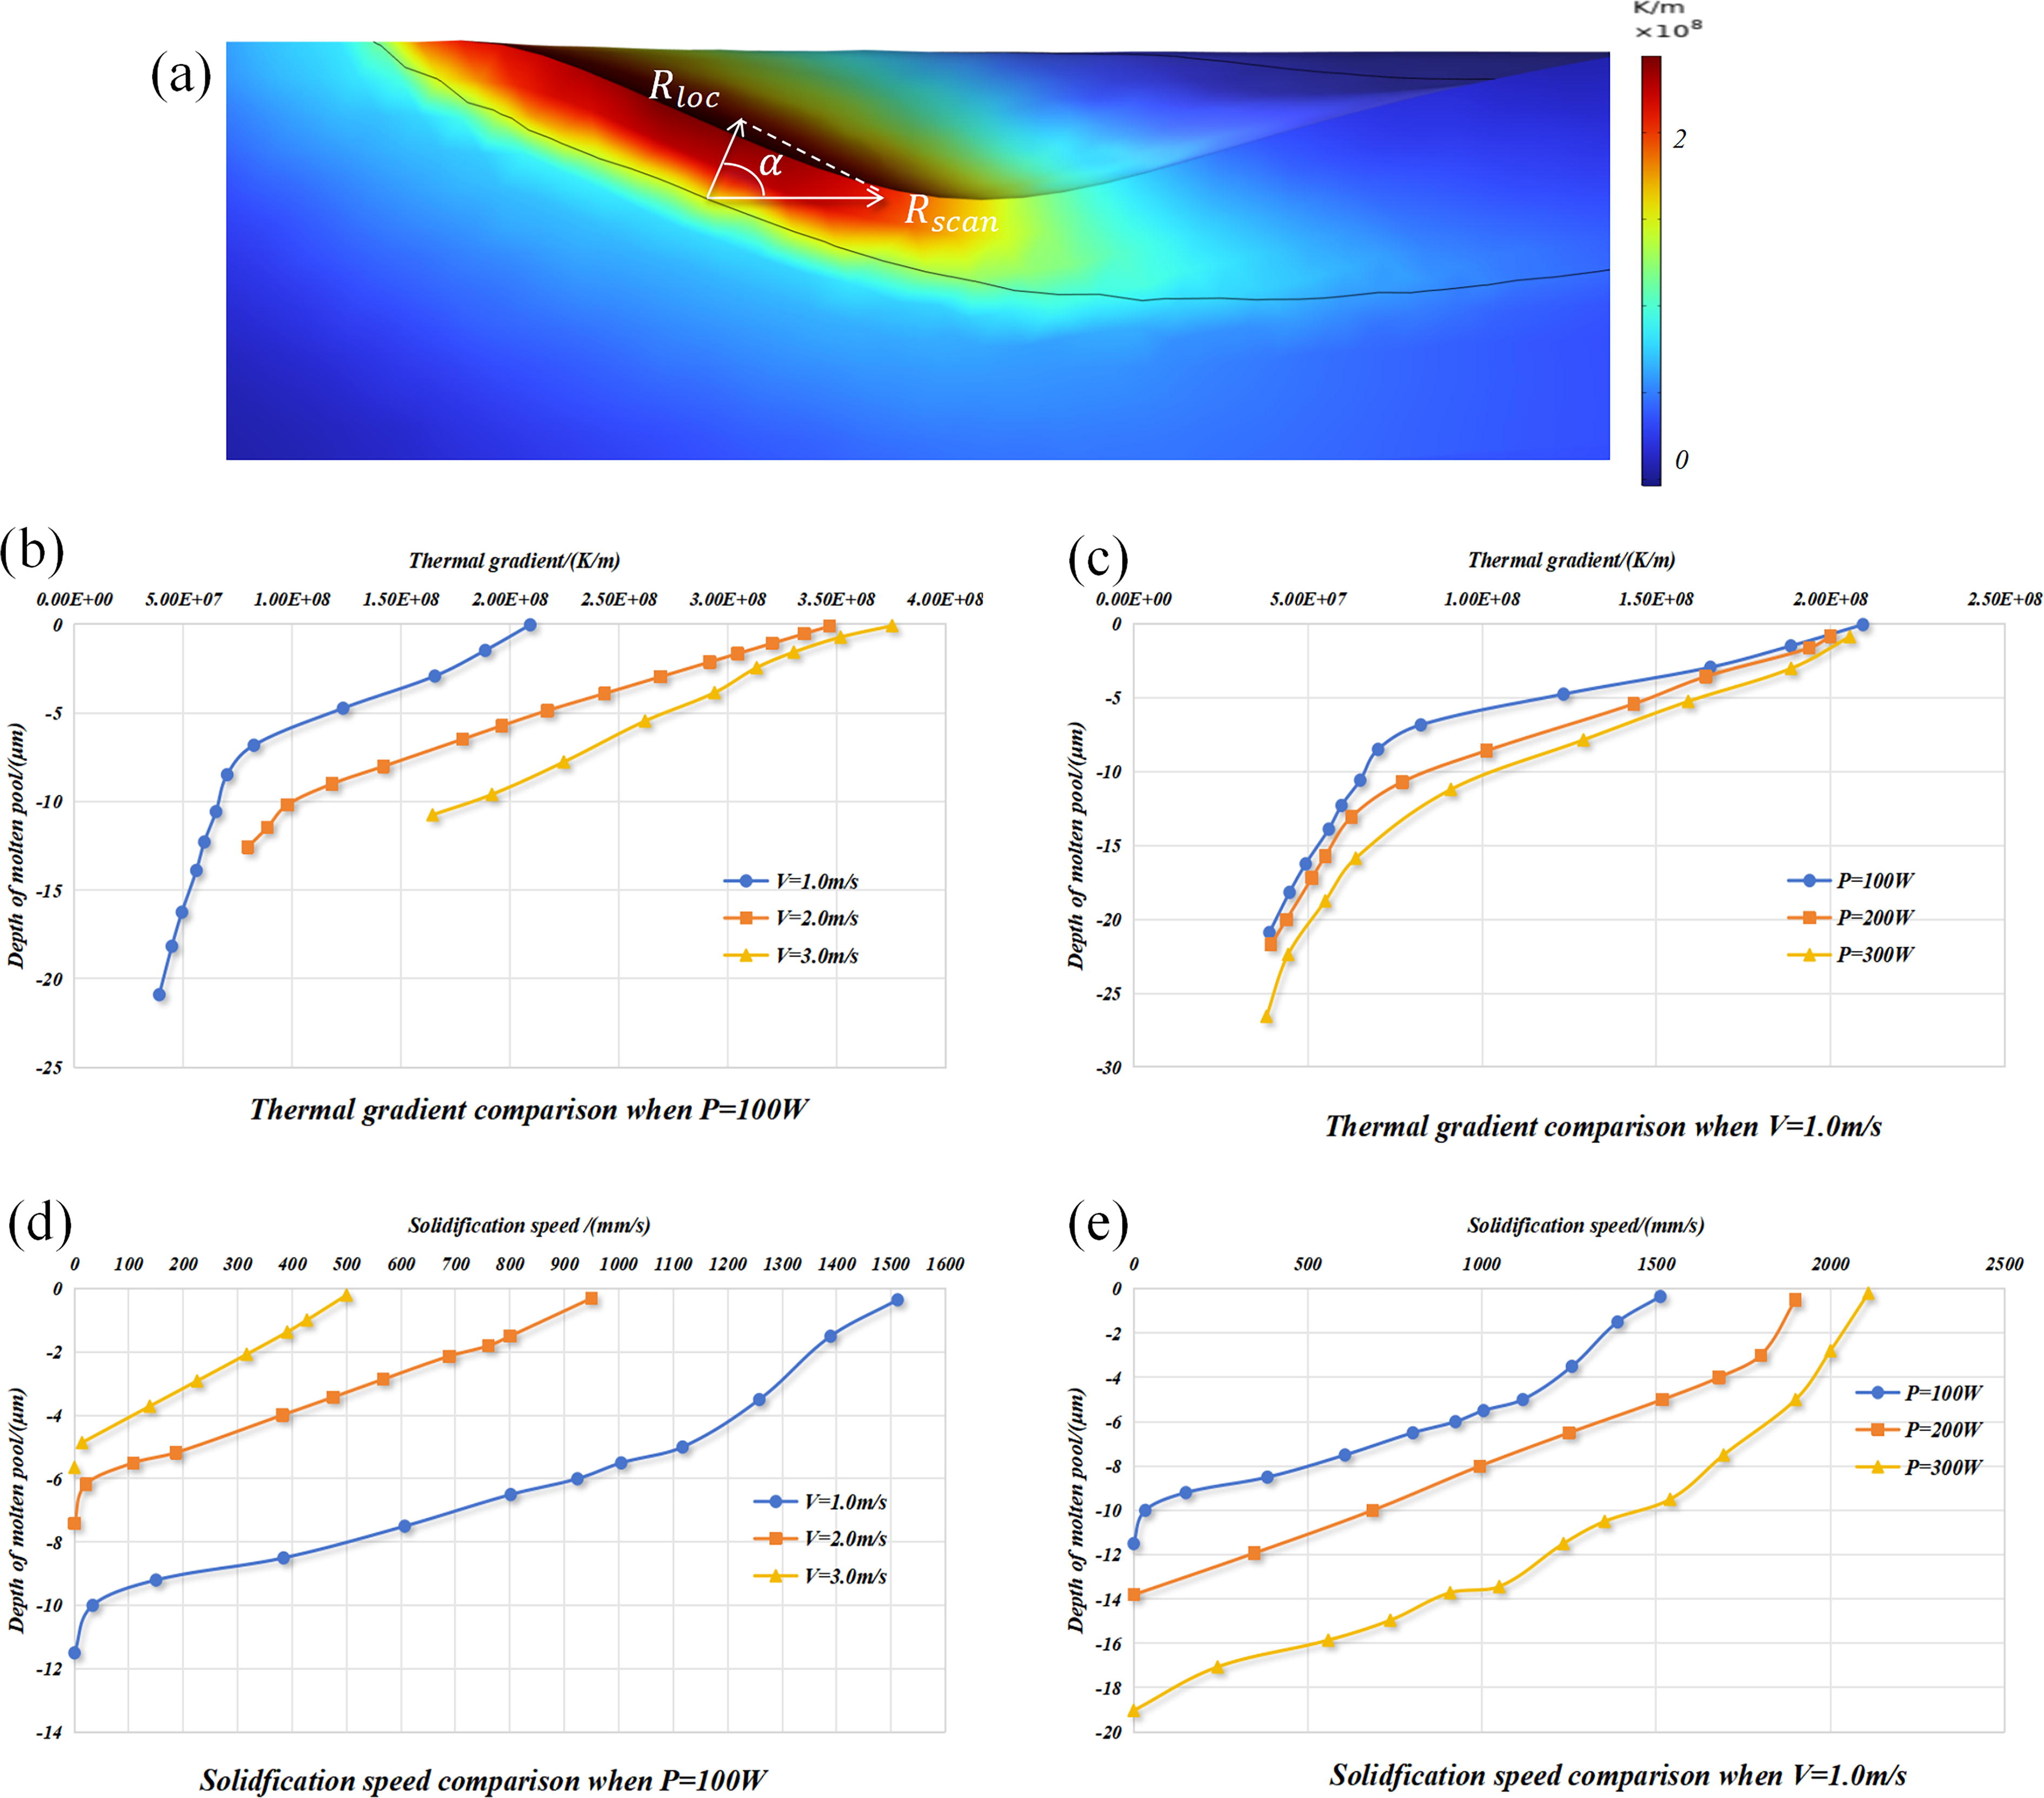
Figure 6b, d, respectively, shows the changes of solid–liquid interface temperature gradient and solidification velocity with depth in the molten pool at different laser scanning speeds. It can be found that the temperature gradient and solidification speed decrease significantly with the increase of the depth of the molten pool. The angle between the solidification speed direction and the laser scanning speed direction at the top of the molten pool is the smallest, so the solidification speed is the fastest, whereas the solidification speed direction and the laser scanning speed direction at the bottom are close to the vertical, so the solidification rate is the slowest. Figure 6c, e, respectively, shows the changes of solid–liquid interface temperature gradient and solidification speed with depth in the molten pool under different laser power. As shown in Figure 6c, e, the temperature gradient and solidification speed decrease significantly with the increase of the depth of the molten pool, that is, the solidification speed at the top of the molten pool is the fastest, whereas the solidification speed at the bottom of the molten pool is the slowest.
By comparing the three groups of curves in Figure 6b, c, it can be found that both the increase of laser power and the increase of laser scanning speed will increase the temperature gradient at the solid–liquid interface of the molten pool. By comparing the three groups of curves in Figure 6d, e, it can be found that the solidification speed gradually decreases from the scanning speed on the surface of the molten pool to zero at the bottom of the molten pool. In conclusion, the cooling and solidification rate of the molten pool can be controlled by adjusting the laser power and scanning speed, so as to further optimize the formation of porosity and other defects related to the solidification of the molten pool.
Effect of different laser process parameters on molten pool morphology
Figure 7a illustrates the temperature distribution and size variations of the molten pool under different laser powers at a scanning speed of 1.0 m/s. The molten pool is represented by the area enclosed by the thin black line, with its length, width, and depth indicated in the figure. At a laser power of 100 W, the molten pool is smaller, measuring 145.97 μm in length, 75.67 μm in width, and 20.97 μm in depth. To quantitatively describe the shape characteristics of the molten pool during the SLM process, the length-to-depth ratio is introduced. At 100 W laser power, the length-to-depth ratio of the molten pool is 6.96 (Fig. 7c). With an increase in laser power to 150 W, the size of the molten pool expands, measuring 163.84 μm in length, 84.42 μm in width, and 21.31 μm in depth, showing growth rates of 12.24%, 11.56%, and 1.62%, respectively. It is evident from the figure that as the laser power continues to rise, the size of the molten pool progressively increases with the escalating laser energy (Fig. 7b), and the length-to-depth ratio of the molten pool also notably rises with the increasing laser power.
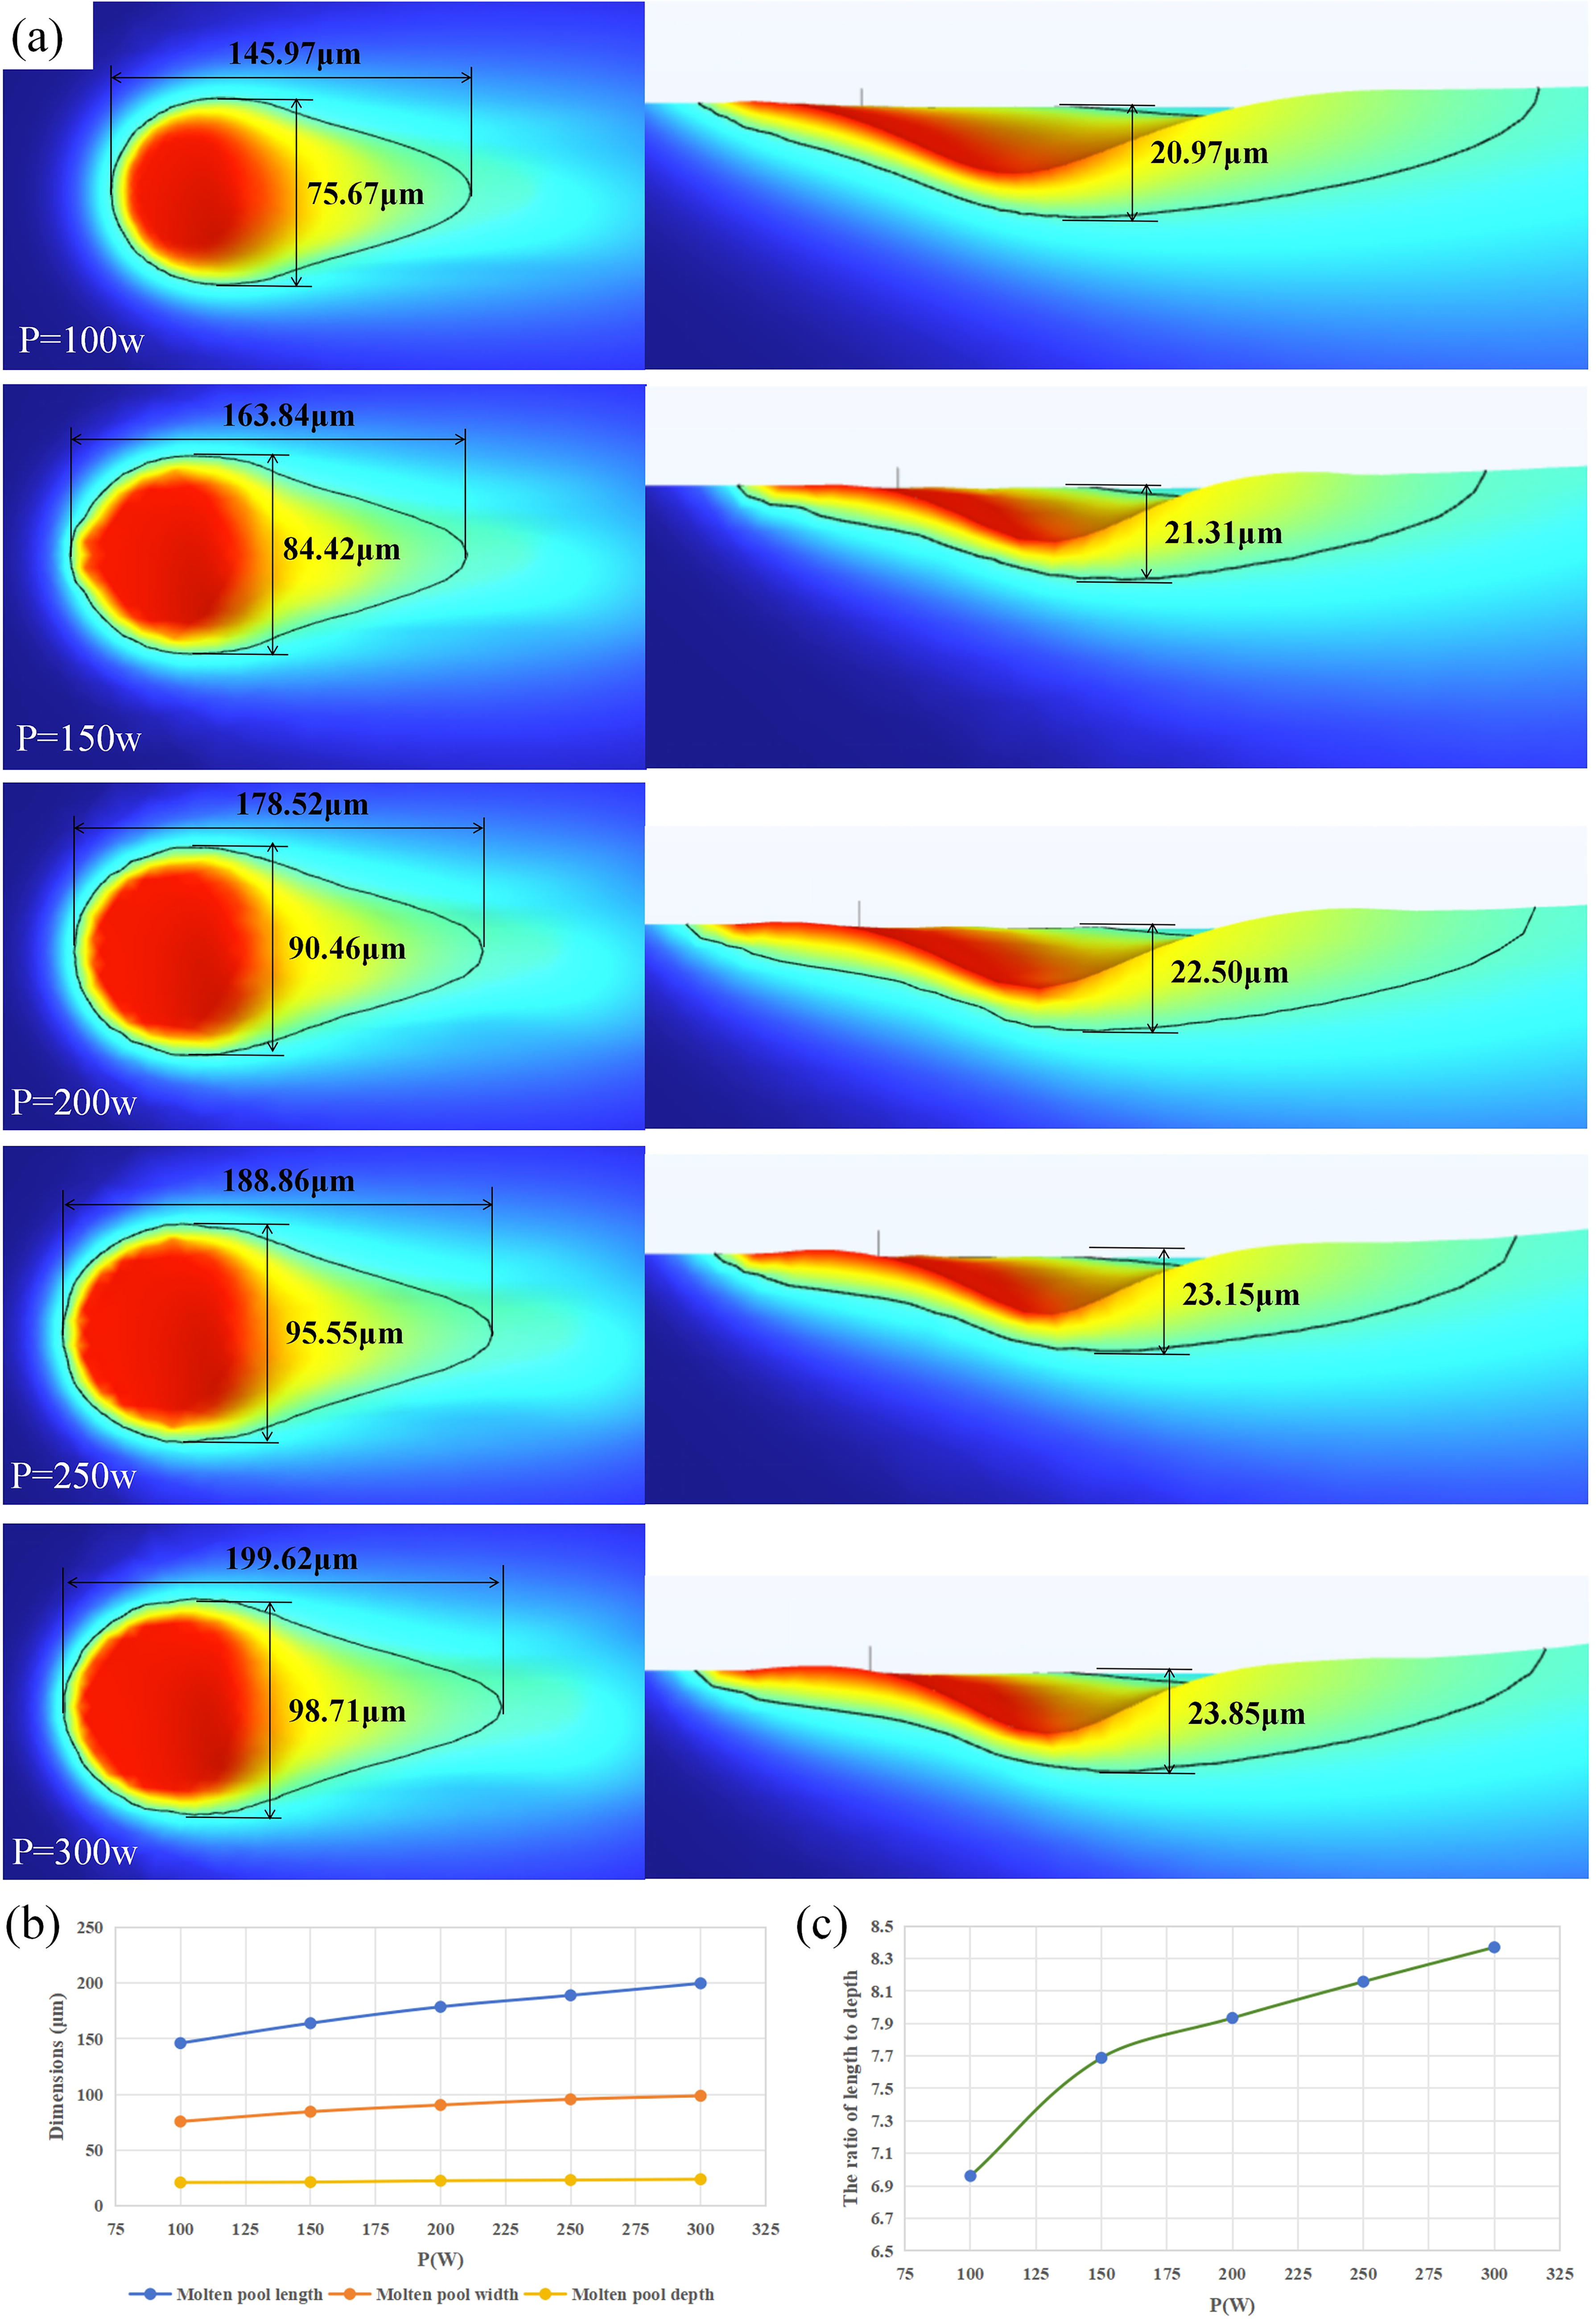
Figure 8a illustrates the temperature distribution and size variations of the molten pool at different scanning speeds with a laser power of 100 W. Similar to Figure 4, the molten pool is represented by the area enclosed by the thin black line, with its dimensions of length, width, and depth indicated in the diagram. At a scanning speed of 1.0 m/s, the molten pool appears larger, measuring 145.97 μm in length, 75.67 μm in width, and 20.97 μm in depth, resulting in a length-to-depth ratio of 6.96 (Fig. 8c). Upon increasing the scanning speed to 1.5 m/s, the size of the molten pool diminishes, with dimensions of 129.78 μm in length, 68.14 μm in width, and 13.85 μm in depth, showcasing reductions of 11.10%, 9.96%, and 33.96%, respectively. The figure illustrates that as the scanning speed continues to rise, the molten pool size progressively decreases due to shorter heat transfer times (Fig. 8a). However, the ratio between the length and depth of the molten pool increases as the scanning speed rises.
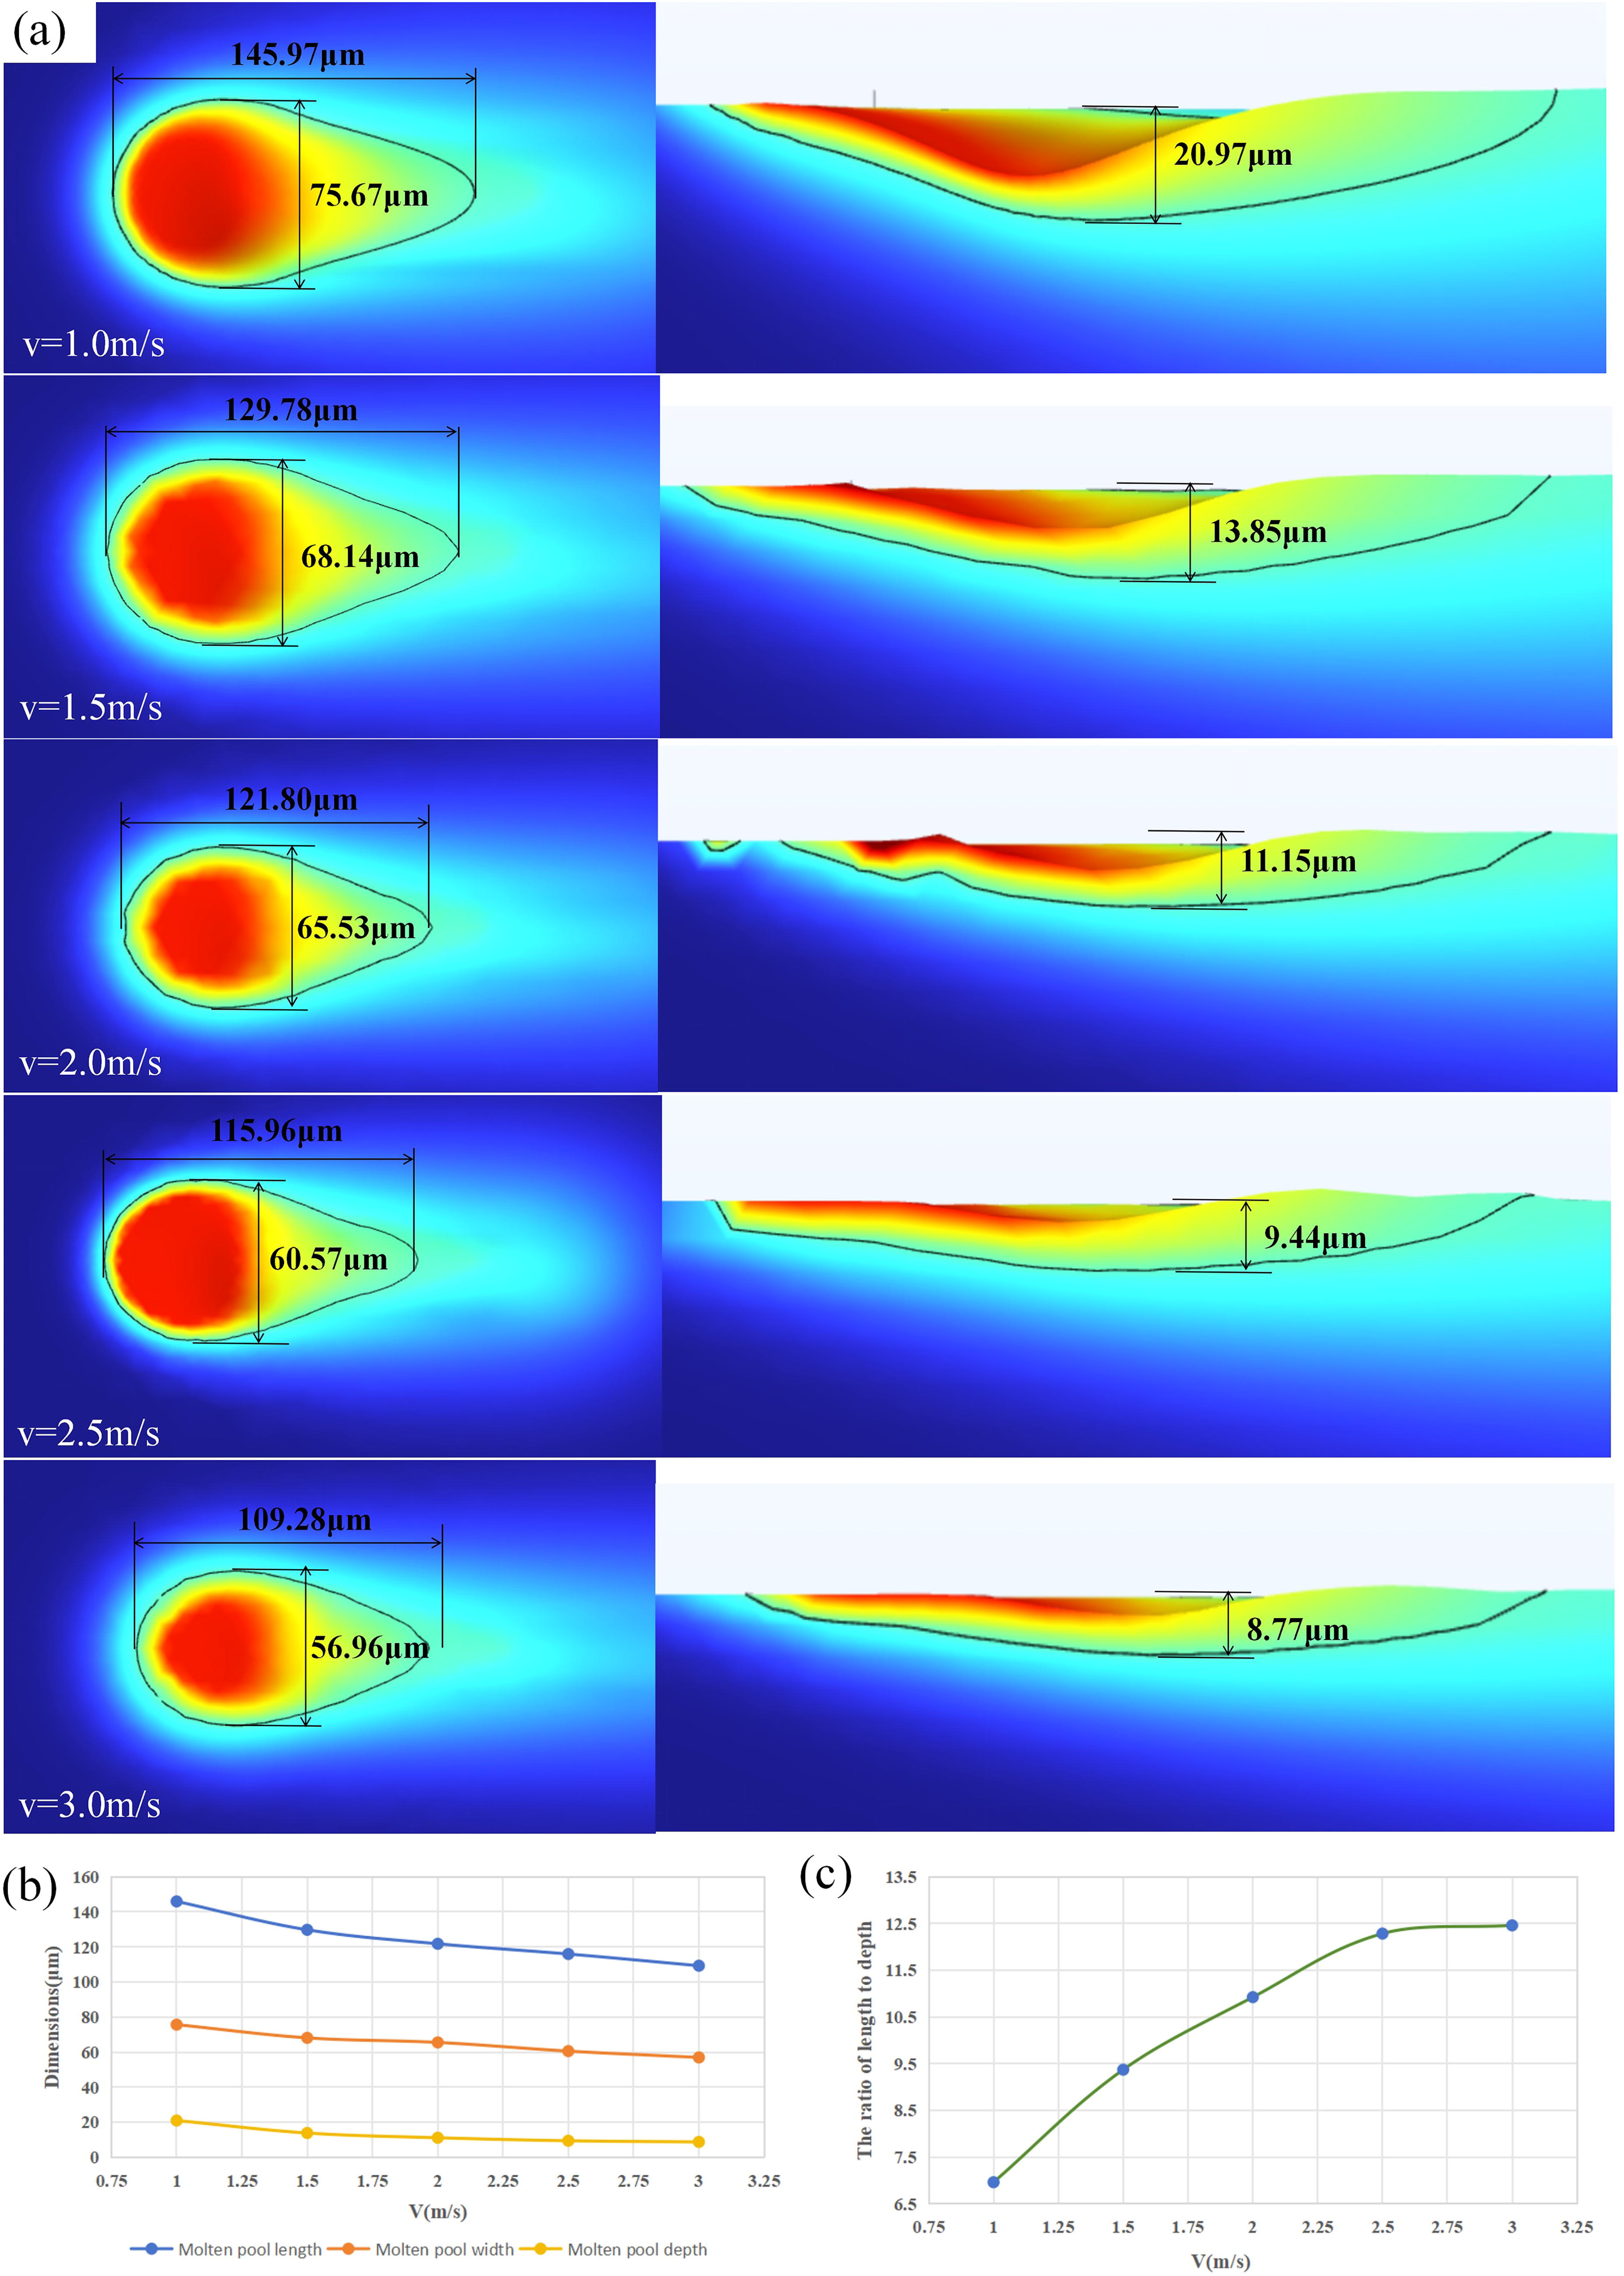
This work reveals that as laser power increases, the size of the molten pool gradually expands, whereas scanning speed leads to a reduction in size. However, the length-to-depth ratio of the molten pool increases with higher laser power and scanning speed. This ratio is more pronounced when laser power or scanning speed is low. For instance, a laser power increase from 100 W to 150 W results in a growth rate of 10.49% in the molten pool’s length-to-depth ratio, from 6.96 to 7.69. Conversely, a power increase from 250 W to 300 W shows a growth rate of only 2.57%, from 8.16 to 8.37. Similarly, a scanning speed increase from 1.0 m/s to 1.5 m/s leads to a 40.05% growth rate in the length-to-depth ratio, from 6.69 to 9.37. In contrast, a speed increase from 2.5 m/s to 3.0 m/s results in a mere 1.47% growth rate, from 12.28 to 12.46. The research highlights that changes in laser process parameters have a significant impact on molten pool morphology at lower power or speed levels, whereas stability is observed at higher levels. Therefore, maintaining stable laser process parameters at lower power or speed ranges during SLM forming processing is crucial for achieving higher forming quality.
Conclusions
This work presents a multiphysics finite element model for the SLM forming process of 316L stainless steel powder. The model incorporates the ALE dynamic mesh method to capture the dynamic behavior of the molten pool surface. Laser power and scanning speed are considered as variables to investigate the geometric shape and size evolution of the molten pool. The simulation results are validated against experimental data, showing good agreement in the surface morphology characteristics of the melt channel. The numerical analysis leads to the following conclusions:
When the laser interacts with the powder material, the molten pool material reflows from the head to the tail of the molten pool at a high speed due to the Marangoni effect. This process ultimately results in protrusions at the starting point and middle of the molten channel, with a dent forming at the end. Both simulation and experimental results demonstrate consistent characteristics. In the cooling and solidification stage of the molten pool, the solidification speed at the top of the molten pool is the fastest, and with the increase of the depth of the molten pool, the solidification speed gradually decreases until it approaches zero at the bottom of the molten pool. In the future research work, the occurrence of porosity, cracks, and other defects related to the cooling of molten pool can be optimized by adjusting the laser power parameters and laser scanning speed. As the laser power increases while maintaining a constant scanning speed, the affected area of the material by the laser energy expands. This results in a gradual increase in the geometric size of the molten pool, along with a corresponding increase in the length-to-depth ratio of the molten pool. When the laser power remains constant, increasing the scanning speed gradually results in a reduction in the geometric size of the molten pool. This is due to the shorter heat transfer time of the material. However, the reverse flow of fluid in the molten pool under the Marangoni effect causes the size reduction in the length direction to be smaller than in the depth direction. As a result, the length-to-depth ratio of the molten pool continues to increase gradually. This work examines the impact of laser power and scanning speed on the geometry and size of the molten pool. The results indicate that the shape and size of the molten pool are particularly influenced by variations in laser process parameters within the low power and scanning speed range. These findings offer valuable insights for enhancing the quality of SLM parts and serve as a foundation for future investigations into the correlation between laser process parameters and melt pool defects.
Footnotes
Authors’ Contributions
Z.L.: Conceptualization, methodology, formal analysis, investigation, and writing—original draft; Y.Z.: Funding acquisition, writing—review and editing, and project administration; Y.M.: Methodology, formal analysis, and investigation; J.D.: Formal analysis, investigation, and writing—original draft; and D.G.: Experiment and material preparation.
Author Disclosure Statement
No competing financial interests exist.
Funding Information
This research was funded by the National Natural Science Foundation of China under Grant No. 62063010.