
Abstract
This study introduces an advanced method that combines supervised and self-supervised learning to optimize the 3D printing process, based on the Bootstrap Your Own Latent technique. The approach utilizes two neural networks: an online network and a target network. The target network is provided with complete data, while the online network processes incomplete data through a “masking” technique applied to certain parameters. The main goal is to ensure that both networks can accurately predict 3D printing time, even with missing data, achieving over 90% accuracy. Experiments show that masking the “faces” parameter of the 3D model reduces prediction accuracy by 56.93%, highlighting the importance of this parameter in optimizing printing time. By combining two loss functions, cross-entropy and consistency loss, this approach enhances interaction between the networks while maintaining high prediction accuracy despite incomplete input data.
Introduction
In the modern technological landscape, 3D printing has emerged as a transformative technology with widespread applications across numerous industries. It is revolutionizing manufacturing processes through rapid prototyping 1 and cost-effective production,2,3 advancing medicine with innovations such as custom prosthetics, implants, and tissue engineering 4 and reshaping architecture with the creation of complex, sustainable designs. Furthermore, 3D printing is making significant strides in education, empowering students with hands-on learning opportunities to bring theoretical concepts to life. This versatile technology continues to drive innovation, enabling industries to achieve unprecedented levels of efficiency, customization, and creativity. 5 Optimizing the 3D printing process not only helps save time6,7 and costs8,9 but also improves product quality. However, optimizing printing parameters is not a simple task because of the complexity of the data and the influence of physical and mechanical factors. One of the main challenges is accurately predicting the printing time,10,11 especially when there are changes or missing input data.2,12 This creates a demand for the development of deep learning and artificial intelligence models to predict and optimize the printing process,13,14 thereby reducing costs and improving production efficiency.15,16
However, predicting and optimizing printing time are significant challenges due to the complexity of 3D models and the parameters involved in the printing process.4,17 To address this issue, this research proposes a hybrid method that combines supervised and self-supervised learning based on the Bootstrap Your Own Latent (BYOL) technique18,19 to improve the ability to predict 3D printing time, even with incomplete input data. BYOL20,21 is a prominent self-supervised learning technique in the deep learning field, enabling the learning of representations from data without the use of labels. The key feature of BYOL is the use of two neural networks 20 : an online network and a target network. The online network is trained with adjustable weights, while the target network is updated based on the online network’s weights using an exponential moving average. This technique has proven to be effective in many downstream tasks, especially in image recognition and prediction tasks.
In this study, BYOL is applied in combination with supervised learning to optimize 3D printing time when the printing data may be incomplete or insufficient.22,23 Research develops a hybrid model by applying the BYOL technique to predict 3D printing time. The proposed method involves two main neural networks: an online network and a target network. The target network is provided with complete information about the 3D geometry and printing settings,24,25 while the online network must learn to make predictions based on masked data (masked). Specifically, the study uses two main types of parameters:
During training, some parameters for printing settings are randomly masked, forcing the online network to learn to predict printing times without complete information. This reflects the model’s ability to process under the conditions of missing data. The target network operates on full data and learns to make accurate printing time predictions based on the 17 full parameters. The online network, on the contrary, must cope with missing data due to some masked printing parameters. This method not only tests the model’s ability to handle imperfect data but also improves performance through the self-supervised learning mechanism. In particular, the combination of two loss functions—cross-entropy loss and consistency loss—ensures that the model not only predicts accurately but also maintains consistency between the two networks. Cross-entropy loss helps train the model based on available labels (
Experiments on this model have demonstrated the effectiveness of this approach. When certain parameters, such as the number of faces of the 3D model, are masked, the accuracy of the printing time prediction drops sharply to 56.93%. This highlights the importance of the number of faces in optimizing 3D printing time. Other experiments also show that missing parameters such as the number of vertices, width, or height of the model also affect prediction accuracy, although the impact is not as significant as the number of faces. The results show that this method can achieve a prediction accuracy of more than 90%, even when data are missing. This confirms the superiority of combining supervised and self-supervised learning to handle imperfect data.
Optimizing 3D printing time is a critical issue in many manufacturing fields. Modern 3D printing systems face numerous complex factors related to the printer settings and the 3D model parameters. Although traditional techniques may provide estimates based on geometric parameters, handling missing data remains a major challenge.
Methods
Deep learning and BYOL in the context of self-supervised learning
Introduction to deep learning and self-supervised learning
Deep learning has made significant advances in solving complex problems related to image recognition,30,31 natural language processing,32,33 and even physical phenomena.34,35 One of the prominent techniques in deep learning is self-supervised learning, in which the system learns directly from unlabeled data. This enables the system to become more flexible in handling large, complex, and unlabeled datasets.
Structure of a deep neural network
A deep neural network consists of multiple interconnected layers of neurons,21,30 including the following:
Input layer: Receives raw data from the external environment. This layer is responsible for receiving raw data and converting it into a numerical form to be fed into the neural network. Data could be images, character sequences, or other types of signal. The number of neurons in the input layer typically equals the number of features in the data. For example, if the input data are a 28 × 28 pixel image, the input layer would have 784 neurons (28 × 28). Hidden layers: Responsible for processing and extracting features from the input data. Each neuron in the hidden layer receives data from the previous layer, applies weights and a nonlinear activation function to compute the result, and then passes this information to the next layer. Common activation functions include ReLU, sigmoid, or tanh, which help the model learn complex and nonlinear features from the data. The role of hidden layers is crucial, as this is where the actual learning happens, enabling the model to identify hidden patterns in the data. Output layer: Predicts the results based on the extracted features. The number of neurons in the output layer depends on the type of problem. In classification tasks, the output layer has a number of neurons that correspond to the number of classes. For example, if the task is to classify images into 10 categories, the output layer will have 10 neurons. In regression tasks, the output layer typically has only one neuron to predict a continuous value. The activation function in this layer could be softmax (in classification tasks) or a linear function (in regression tasks), depending on the model’s goal.
The interaction between these layers, the input layer, the hidden layers, and the output layer, enables the neural network to learn from the data, extract important information, and make accurate predictions. The more hidden layers and the more complex the network, the better its ability to learn subtle and nonlinear features from the data. The general formula for the output of a neuron at layer
Neural network training process
The neural network training process involves finding the weights Loss function: Measures the difference between the predicted output and the actual value. A common loss function for classification tasks is cross-entropy loss: Backpropagation: Calculates the gradient of the loss function with respect to the weights using backpropagation and then adjusts the weights using an optimization method such as gradient descent.
Concept of BYOL and its application in deep learning
BYOL32,35 is a modern self-supervised learning method that allows models to learn without labeled data. BYOL utilizes two neural networks: an online network and a target network. While the target network is initialized and remains unchanged over time, the online network is trained through a regression mechanism, enabling it to predict and improve accuracy. This method is particularly effective at learning representations from complex and unlabeled data, thus enhancing the predictive capability of the model.
Concept of self-supervised learning
In self-supervised learning, the model learns by creating a proxy task using part of the data as input and the remaining part as prediction labels. Common proxy tasks include the following:
Masked data prediction: A portion of the input data are masked, and the model must learn to predict the missing part. Autoencoding: The model learns to compress the data into a latent space and then reconstructs the original data from this latent space.
General formula of self-supervised learning
Given a dataset
The objective is to minimize the error between
Bootstrap Your Own Latent
BYOL is a self-supervised learning method that uses two neural networks: an online network and a target network. Both networks are trained to produce latent representations from the data, but the target network does not update its weights in the same way as the online network. Instead, the weights of the target network are updated using an exponential moving average (EMA) of the weights of the online network.
Loss function used in BYOL
BYOL uses a loss function to optimize the similarity between the latent representations of the two networks, measured by the MSE between the predictions from the two networks.
Advantages of self-supervised learning
Self-supervised learning offers numerous benefits for the development of modern machine learning models, especially in handling large and complex datasets. One key advantage is its ability to save on labeled data. In supervised learning methods, data must be labeled, which means that each data sample needs to be tagged (e.g., images labeled by object type). However, this labeling process is often expensive and labor-intensive, particularly with large datasets. Self-supervised learning overcomes this by using strategies that do not require labeled data. Instead of relying on labels, the model creates auxiliary tasks that allow it to learn from the inherent structure of the data.
Another important advantage is the ability to learn from large datasets. Since self-supervised learning does not rely on data labels, models can learn from vast datasets without needing costly labeling processes. This enables full use of large data sources, such as images, videos, or textual data, where manual labeling may be impractical or too complex. Exploiting these data sources enables self-supervised models to expand their learning capabilities across various domains.
Lastly, one of the greatest strengths of self-supervised learning is its ability to optimize latent representations. During the learning process, the model extracts features from the data and stores them in latent representations. These representations are typically highly generalizable, meaning that they can be reused across different tasks, referred to as downstream tasks. For example, a self-supervised model trained on image data can extract features such as edges, corners, and shapes and apply them to various tasks such as classification, object recognition, or detection without needing to retrain from scratch.
These advantages make self-supervised learning a powerful tool in machine learning problems, reducing reliance on labeled data, efficiently utilizing large datasets, and providing latent representations that can be applied in diverse contexts.
Hybrid supervised BYOL model for 3D printing optimization
Description of the hybrid supervised BYOL model
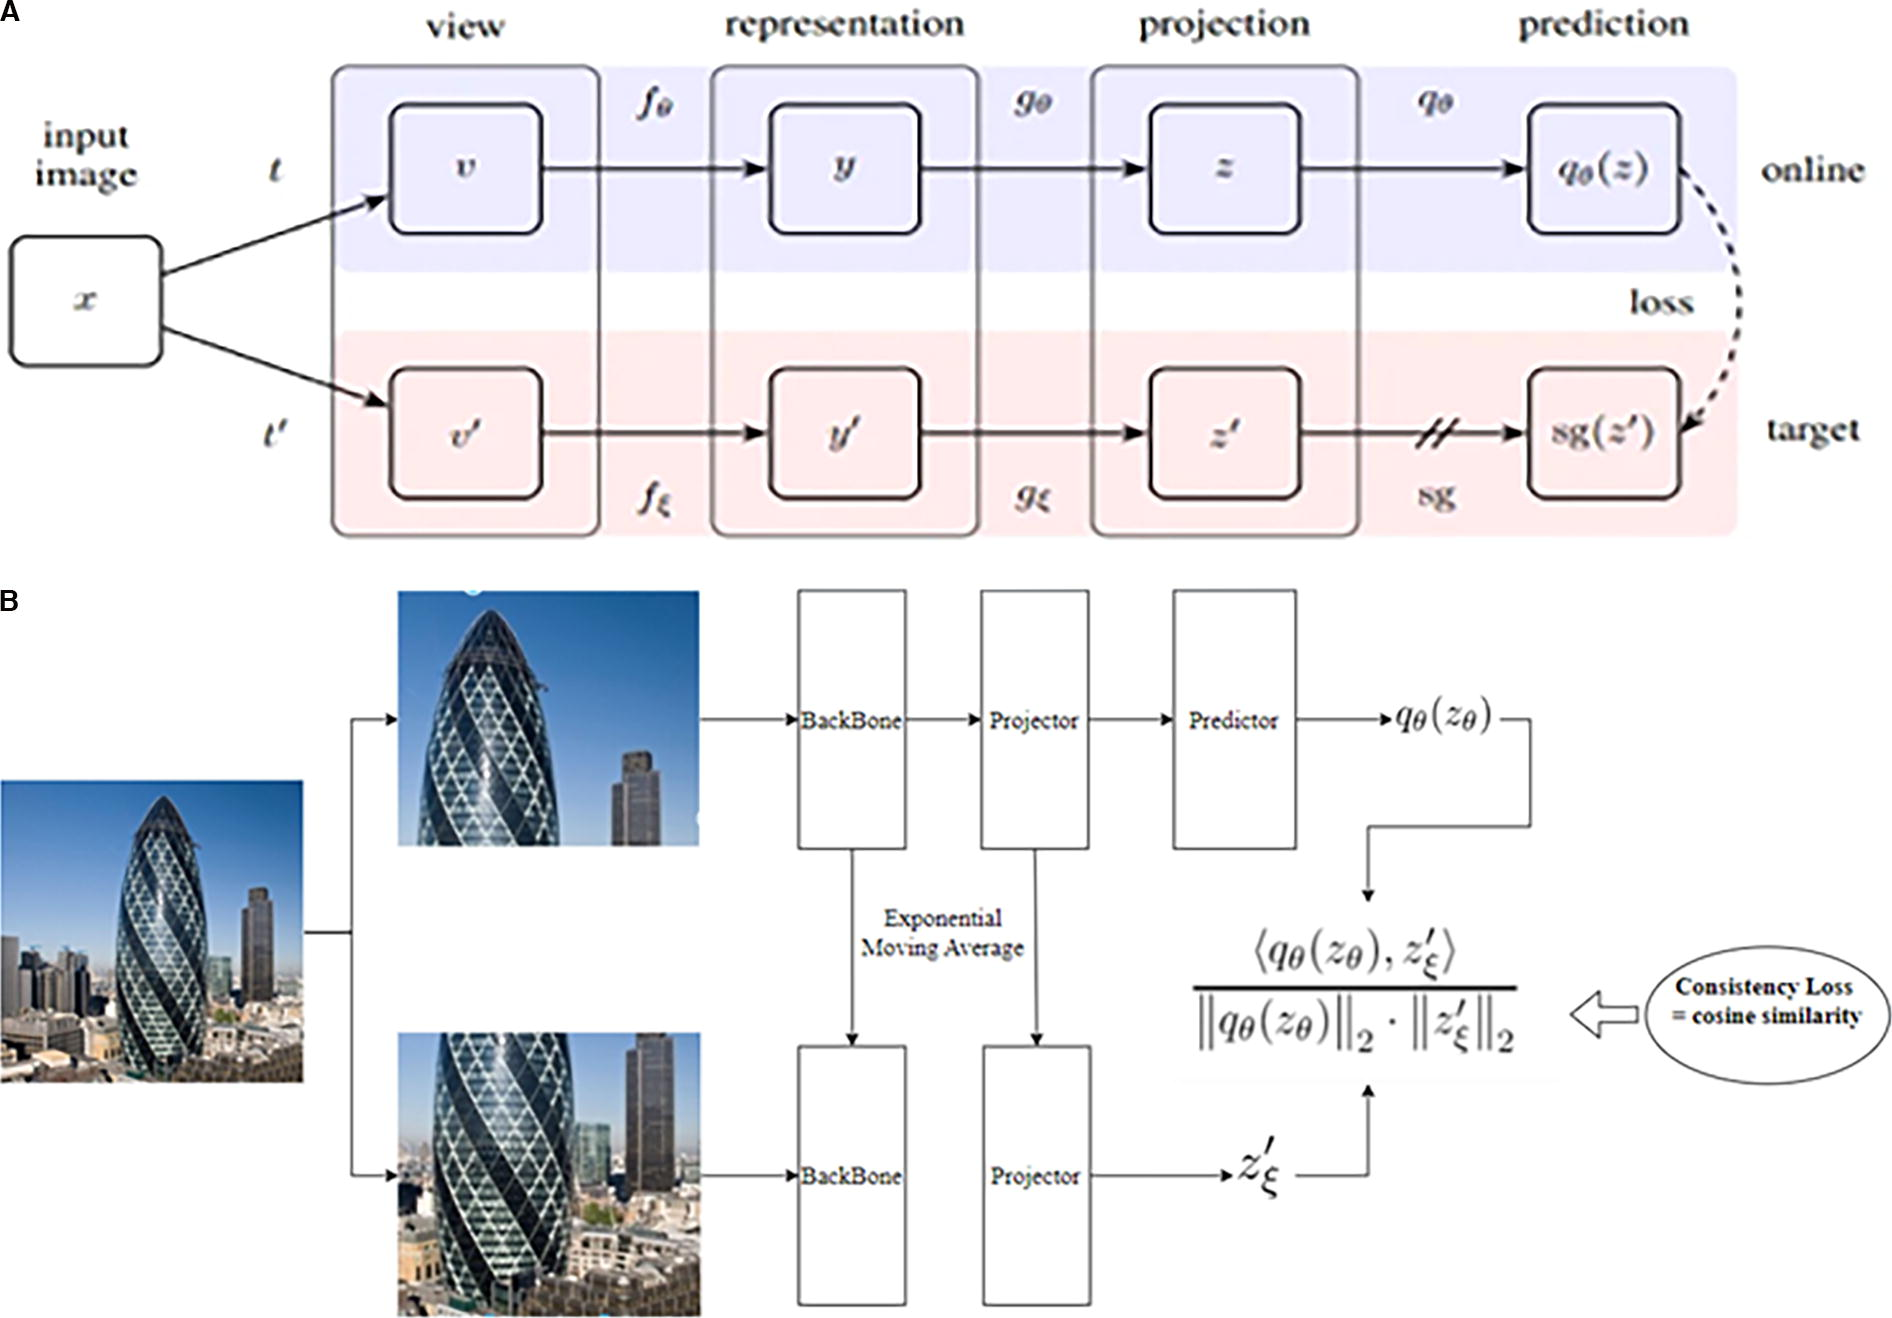
The proposed hybrid supervised BYOL model combines elements from both supervised learning and self-supervised learning to address the problem of optimizing 3D printing time, as shown in Figure 1. The structure of the model consists of two parallel network branches: the online branch and the target branch. Below is a detailed description of how these two branches operate in the hybrid supervised BYOL model:

Hybrid supervised Bootstrap Your Own Latent (BYOL) model.
Online network; This network is responsible for learning from incomplete data, where certain parameters are “masked” (hidden). Its goal is to predict the printing time even when the data are incomplete.
Target network: The target network, on the contrary, is provided with complete data, without masked parts. This network helps the online network optimize its predictions by providing reliable representations of the full dataset.
In this study, the proposed model incorporates two independent neural networks, each serving a distinct purpose, as illustrated in the updated Figure 1. The online network is specifically designed to handle cases with incomplete data, where certain input parameters are masked. This network processes the masked input and generates robust predictions, demonstrating its capability to infer printing times under data-deficient conditions. Conversely, the target network operates with full input parameters, providing accurate predictions and serving as a reference during training. By leveraging a consistency loss mechanism, the target network guides the online network, ensuring alignment between their outputs.
The updated Figure 1 now clearly depicts these complementary roles, emphasizing that the online network is intended for inference on masked input, while the target network supports the training process with complete data. This dual-network design enhances the model’s flexibility and ensures reliable performance in both ideal and real-world scenarios, where data may be incomplete. The additional annotations and explanations in the figure aim to make this distinction clear, enabling readers to fully grasp the core functionality of the proposed model.
Encoder of both networks
In the BYOL model, both neural networks use the same architecture to encode the input data. For each network, we have an encoder
Predictor
The online network also has a predictor
This predictor is only applied to the online network and is not used for the target network.
Consistency loss
To measure the similarity between the representations from the two networks, the MSE loss function is used:
Supervised loss
In addition to self-supervised loss, the model also uses a supervised loss component based on the true labels of the data. For the task of optimizing 3D printing time, cross-entropy loss is used for the predictions from the network:
Combined loss
The final loss function of the hybrid supervised BYOL model is a combination of the consistency loss and the supervised loss:
Proposed combination of supervised and self-supervised learning
This model combines both supervised and self-supervised learning by using labels for the final predictions while applying self-supervised techniques to enhance the interaction between the two networks. The main difference between this model and traditional deep learning methods lies in how it handles and interacts with “masked” (hidden) data, ensuring high prediction accuracy even when the input data are incomplete.
In this study, printing time is categorized into three distinct groups using the K-means clustering method, which was further developed based on our previous research as shown in Figure 2. This method aligns with practical needs by addressing customer preferences for simplified classifications, focusing on whether a product prints quickly or slowly rather than requiring exact timing. Through the application of K-means clustering, two threshold values—35.4 and 110.7 min—were identified, providing the basis for this classification. Specifically, printing times below 35.4 min are classified as fast, those exceeding 110.7 min as fine, and the remaining times as normal. This grouping enhances the interpretability of the results and ensures the model’s applicability in real-world scenarios, while the updated figure effectively visualizes the clustering outcomes and reinforces the rationale behind this categorization. The target network learns all 17 parameters, including 7 geometric parameters: volume, area, number of vertices, number of faces, height, depth, and width. These parameters describe the characteristics of the obj file when it is entered into the slicer software, as illustrated in Figure 3. In addition, 10 printing-related parameters, including top solid layers, bottom solid layers, outline, skirt layers, skirt outlines, extrusion width, layer height, speed, infill, and internal fill pattern, are depicted in Figure 4. The target network learns how to map all 17 parameters into printing speed classes, enabling it to quickly classify the printing time for each print job. The online network also learns the same seven geometric parameters as the target network, but the printing-related parameters are randomly masked. In each training session, between one and nine printing-related parameters may be hidden. The online network must learn to classify the printing time without relying on the masked printing parameters, which means that it must ignore the values of the masked parameters and still be able to accurately predict the printing speed.

Labeling by K-means base on time clustering.

The 10 printing-related parameters.
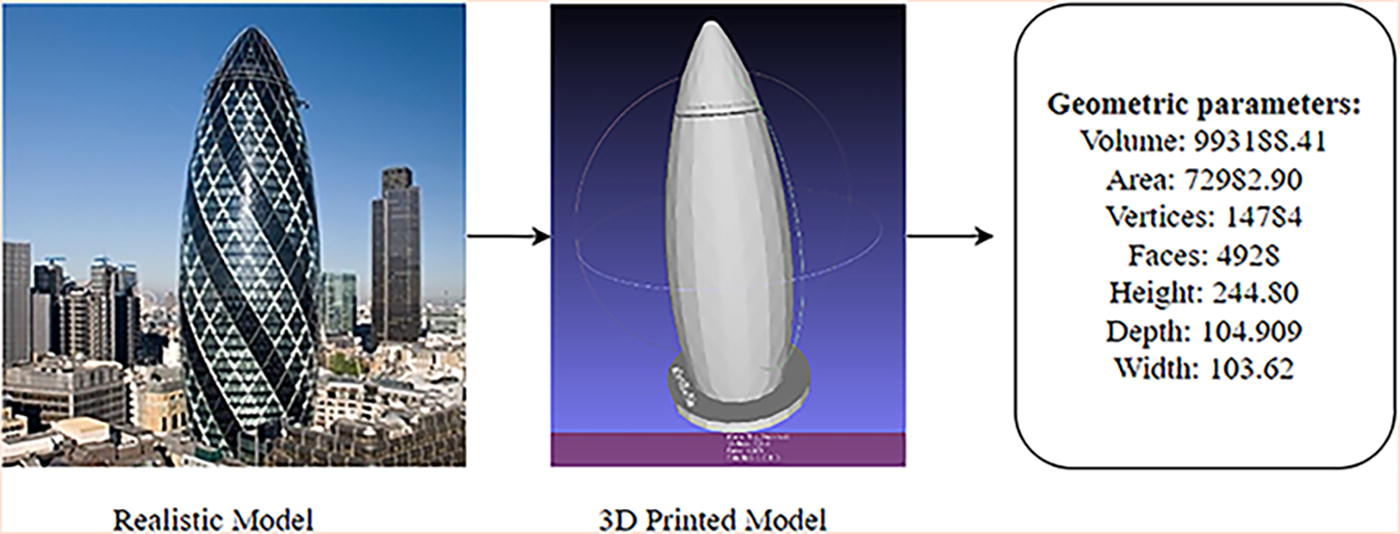
The seven geometric parameters in the 3D printing model.
To achieve this, the model uses a mechanism similar to BYOL but with some important customizations. BYOL is a technique from the self-supervised learning category. The main goal of BYOL is to learn a representation
Traditional BYOL
BYOL uses two neural networks for learning: an online network and a target network. The online network is defined by a set of weights and consists of three stages: an encoder
With a set of images D, an image
Main process of the model: The main process of the model, as illustrated in Figure 5, includes the following steps:
Step 1: Initialize two neural networks with the same architecture: a target network initialized randomly and kept fixed and an online network that is trainable. Step 2: Provide an input image xxx and generate an augmented version Step 3: Pass the image Step 4: Optimize by minimizing the distance between the two extracted representations. Step 5: Update the weights of the target network by applying an exponential moving average of the weights of the online network from previous steps.
Repeat steps 2–5 until the training process is complete.
The online network consists of three main components: the encoder
Our method: BYOL-based recommendation method
In this problem, the operational mechanism of the two networks, the target network and the online network, is depicted in Figures 1 and 4, highlighting their distinct roles and interactions. The model is characterized by several key features. First, it uses supervised learning, where labels are used to optimize the network, establishing it as a supervised learning task. Second, the model incorporates consistency loss, which enforces alignment between the online network and the target network through a loss function, typically the MSE between their predictions. This ensures that both networks learn to produce consistent outputs. Third, the model leverages masking, with the online network learning from masked data while the target network learns from complete data, enabling the model to effectively handle both incomplete and complete input scenarios. This interaction mirrors the mechanism of BYOL, allowing for robust learning from diverse data configurations. In addition, the model utilizes EMA to update the weights of the target network based on those of the online network, facilitating a gradual and stable transfer of learning. Finally, the model integrates both supervised and self-supervised learning techniques, combining label-based training with the self-supervised principles of BYOL to enhance the synergy between the two networks and optimize their performance.
A notable distinction in the model lies in its approach to the loss function, which integrates multiple components to optimize performance. The combined loss merges cross-entropy loss, ensuring accurate predictions of
This approach helps maintain consistency between the two networks throughout the training process and optimizes predictions. In the study’s experiments, a significant finding was that masking the “faces” parameter (the number of faces of the 3D model) resulted in a large drop in prediction accuracy, by up to 56.93%. This highlights the importance of the “faces” parameter in optimizing printing time. The number of “faces” reflects the complexity of the 3D model and directly influences the printer’s processing time. When the model has more “faces,” the printer must perform more steps to process and print, thereby increasing the printing time.
Hybrid model installation details
The dataset in this study was carefully divided into the following three distinct subsets: the training set, validation set, and test set, following a 70:15:15 ratio. This partitioning was performed using the StratifiedShuffleSplit stratification technique to ensure a balanced representation of all categories across the subsets. This approach guarantees that the distribution of data remains consistent, minimizing potential biases and enhancing the reliability of the results.
The training process was designed to maximize model performance while preventing overfitting. A total of 500 epochs were conducted, with the application of early-stopping and checkpoint techniques to identify the optimal model. These methods allowed the training process to halt automatically when further epochs yielded negligible improvements, ensuring computational efficiency. In extensive testing, the best model consistently emerged before reaching 100 epochs, reflecting the model’s efficiency in learning patterns from the data.
The model architecture was constructed to effectively handle the complexities of the problem. The backbone multilayer perceptron consists of three layers, each comprising 512 nodes, to ensure robust feature extraction. In addition, the projector component includes two layers with 256 and 64 nodes, respectively, designed to refine the latent representation and optimize downstream tasks. The EMA mechanism was incorporated with a 1% decay rate, providing stability to the training process and enabling smoother updates of model weights.
This comprehensive setup, combining strategic dataset partitioning, an advanced model architecture, and an efficient training process, ensures that the proposed method is rigorously validated and capable of delivering reliable and reproducible results in various scenarios.
Analysis of Results and Model Performance
Model performance in predicting 3D printing time
The study on the hybrid controlled BYOL model has demonstrated its outstanding effectiveness in predicting 3D printing time, even when the input data are incomplete, as shown in Figure 6. The model can achieve a prediction accuracy of more than 90%, even when some parameters related to the printing process are masked. This showcases the model’s flexibility and robustness in handling incomplete data, a common issue in real-world applications.
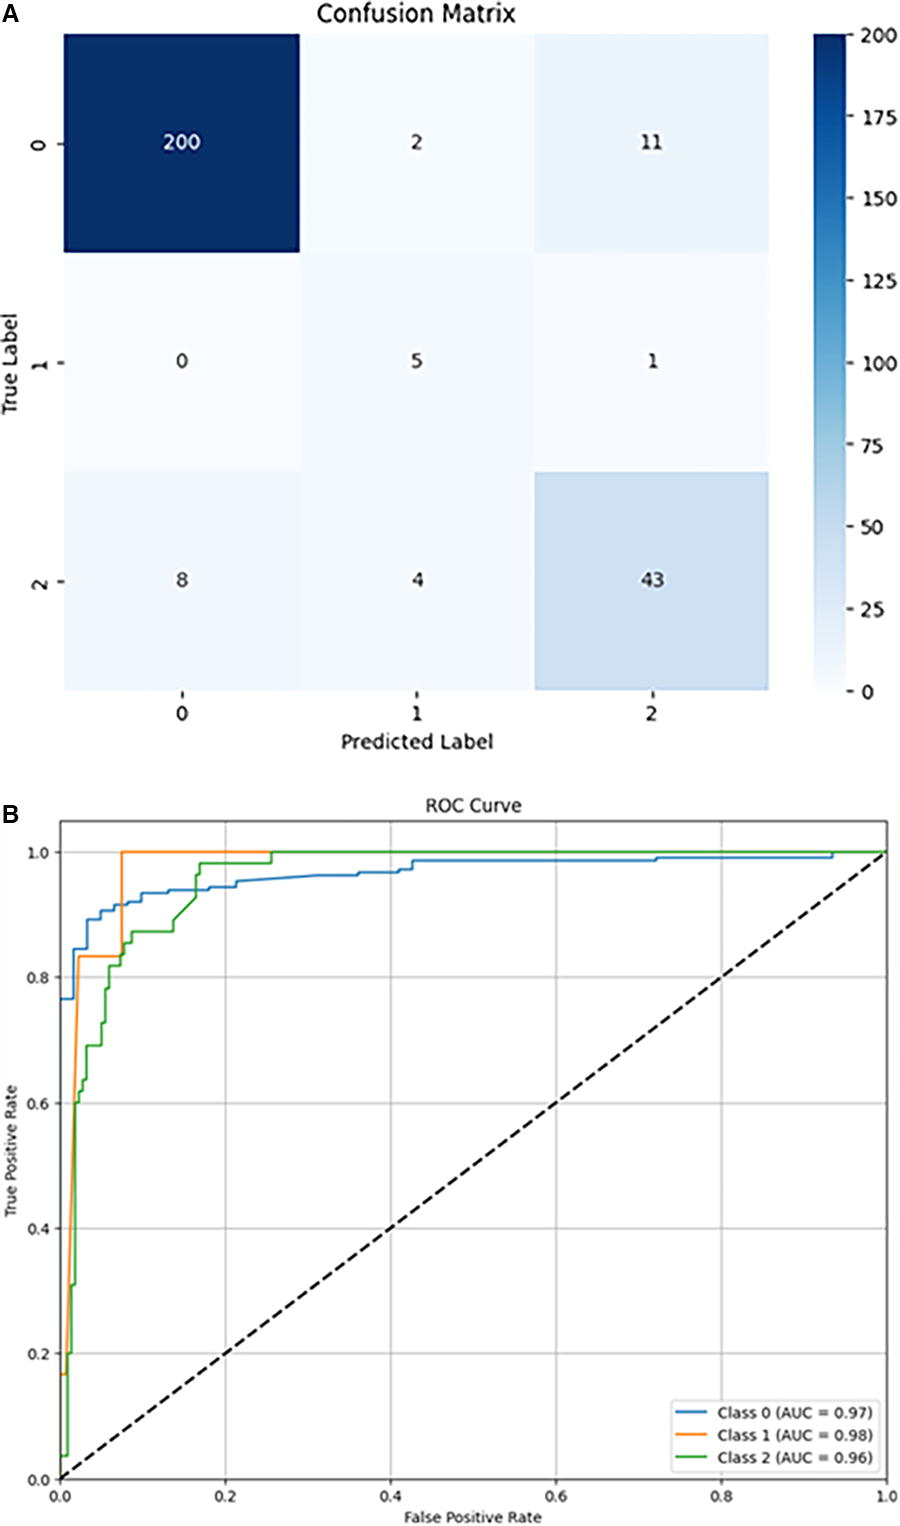
Performance of the hybrid supervised BYOL. (
The selection of the 17 features used as input in this study was informed by both domain expertise and empirical evidence from our prior research. These features were carefully chosen to capture the critical geometric and printing parameters that significantly impact the efficiency and accuracy of 3D printing processes. Specifically, the dataset includes seven geometric features, such as volume, surface area, and the number of faces, as well as 10 printing-related parameters, including layer thickness, infill pattern, and speed settings.
This selection process was guided by a team of experts in the field, who identified these features as being most relevant based on their practical experience and the underlying physics of 3D printing. These parameters are not only crucial for accurately predicting printing time but also for understanding the interactions between the geometry of the printed object and the operational settings of the printer.
The chosen features provide a comprehensive representation of the factors influencing 3D printing performance, ensuring that the model is robust and generalizable across various printing scenarios. By leveraging this curated set of inputs, the proposed approach builds upon prior research while addressing the practical needs of the 3D printing domain.
This rationale underscores the importance of feature selection in achieving high prediction accuracy and highlights the interdisciplinary nature of this study, combining expertise from 3D printing technology, data science, and domain knowledge.
Model handling of masked data
During the training process, the model faced masked data, which meant that some critical printing parameters were randomly hidden. This helps to evaluate the model’s ability to make accurate predictions based on incomplete data. Even with masked data, the online network was still required to predict the printing time of the product, with the results shown in Table 1. Thanks to the combined mechanism of supervised learning and self-supervised learning, the model learned to make accurate predictions even when some crucial information was missing. Consistency loss played a key role in ensuring that the online and target networks remained aligned in their predictions, even when the online network had to work with masked data.
Prediction Accuracy of the 3D Printing Time Model with Full and Masked Data
Table 1 shows that when the input data are complete, the model achieves its highest accuracy, with 92.5% on the training set and 91.8% on the test set. In cases where some parameters are masked, the model’s accuracy decreases slightly but still remains relatively high, especially when one to five parameters are masked. This indicates that the model is capable of effectively handling incomplete data. As the number of masked parameters increases (seven to nine parameters), accuracy continues to decline, but remains above 80%, demonstrating the model’s flexibility in making accurate predictions even when information is incomplete.
Figure 7 illustrates the decline in model accuracy on the test set as the number of masked columns increases. The online network, after fine-tuning on the validation set, was then evaluated on the test set, revealing a clear performance pattern. Initially, the model maintains high accuracy, peaking at 91.5% with one or two masked columns. However, as more columns are progressively masked, accuracy steadily declines, falling below 88% when eight or more columns are masked. Interestingly, the fluctuations in accuracy suggest that the model’s performance is not solely dependent on the number of masked columns but also on which specific columns are masked. This indicates that certain columns (such as key geometric or printing parameters) are more critical to the model’s predictive performance, and masking these has a more pronounced effect on accuracy.
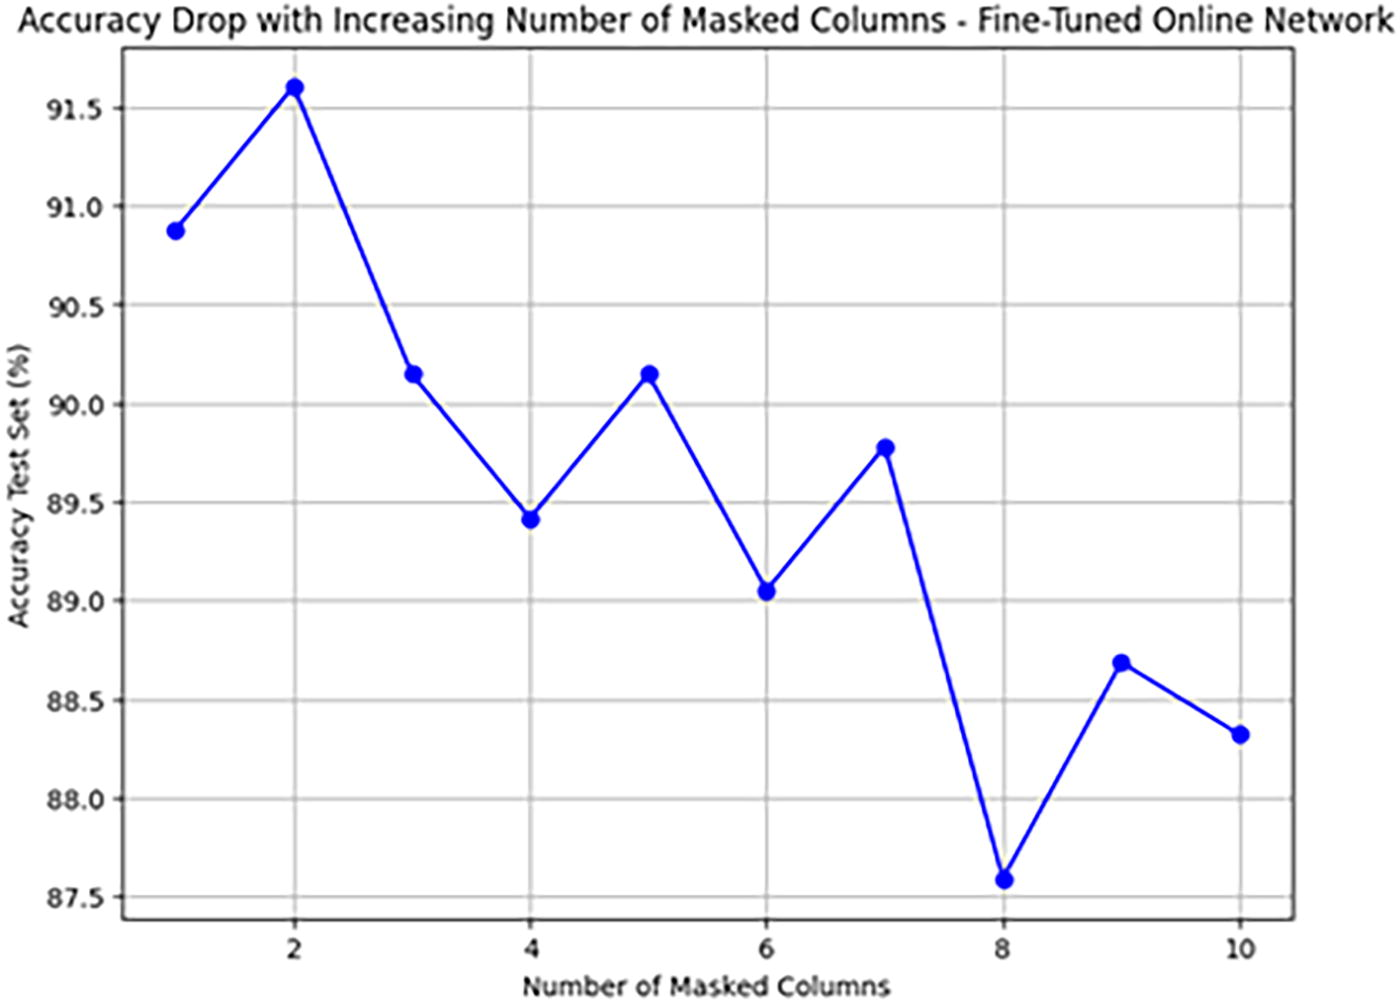
The graph illustrates the decline in model accuracy as the number of masked columns.
Prediction ability with complete data
When the input data are complete, meaning that all parameters related to 3D printing are provided, the target network is able to predict printing time with very high accuracy. The accuracy of more than 90% indicates that the model not only performs well with complete data but also fully utilizes the available information to make precise predictions.
The results from Table 2 show that consistency loss gradually decreases over the epochs, from 0.062 at epoch 10 to 0.015 at epoch 120, indicating that the model is progressively learning to make consistent predictions between the online and target networks, even under conditions of masked data. The significant reduction in consistency loss demonstrates that the two networks are learning to align their predictions. This ensures that the model not only performs efficiently with complete data, but also maintains high accuracy when faced with incomplete data, showcasing the model’s flexibility and robustness in real-world scenarios.
Reduction of Consistency Loss over Epochs
MSE, mean squared error.
Based on Figure 8, we can analyze the prediction capabilities of the target network when provided with complete data. The model exhibits rapid loss reduction during the early epochs, from 0 to approximately 20, where the loss on both the training and testing sets decreases sharply from nearly 1.0 to around 0.3. This indicates that the model quickly learns and optimizes its predictions by effectively capturing key information from the input data. The rapid reduction in loss highlights the efficiency of the target network in leveraging complete data to improve its predictive performance.
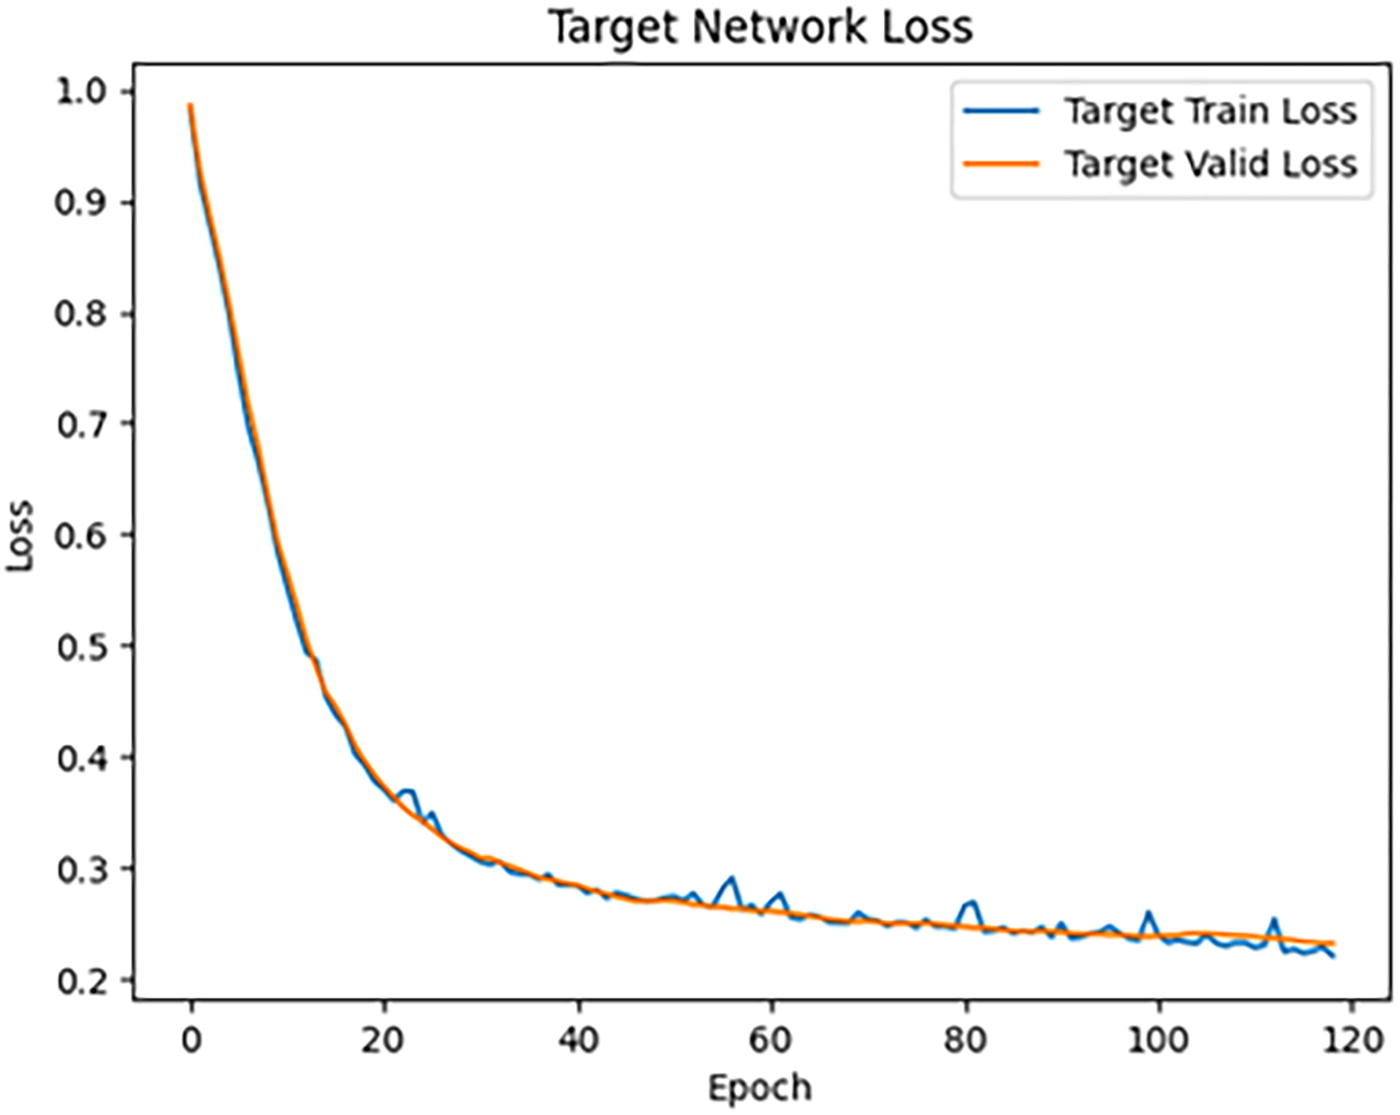
Target network loss.
After the initial phase of fast learning, the loss stabilizes around 0.2–0.3 after approximately 20 epochs. This stabilization phase suggests that the model has effectively learned the critical features of the data and has entered a steady state of training. The low and stable loss values reflect strong predictive accuracy and good generalization capability on the test set, indicating the model’s ability to perform consistently across unseen data. The loss curves for the training and testing sets remain closely aligned throughout the training process, with no significant divergence. This demonstrates that the model does not overfit to the training data and maintains high generalization capacity. The overlap between the two curves confirms that the model optimizes learning effectively across both datasets and avoids discrepancies in performance.
After stabilization, minor fluctuations are observed in the loss values beyond 30 and 40 epochs. These fluctuations are minimal and remain within the range of 0.2–0.3. Such variations typically arise as the model fine-tunes its predictions during the final stages of training. Despite these minor changes, the overall stability of the loss suggests that the model has successfully learned and is minimally affected by these fluctuations. The analysis indicates that the target network achieves excellent prediction capabilities when provided with complete data, evidenced by rapid early learning, stable low loss levels, and consistent performance on both the training and testing sets. The absence of overfitting, combined with strong generalization, ensures high accuracy in predicting 3D printing time, making the target network a robust component of the proposed approach.
Performance of the online network
The online network, despite dealing with cases of incomplete data, is still able to make accurate predictions. This demonstrates that the model has learned to effectively handle or bypass missing parameters through the self-supervised learning mechanism and techniques such as EMA for weight updates. Thanks to this mechanism, the online network has learned to predict without being entirely dependent on all input parameters, which helps the model generalize better in real-world scenarios. Table 3 presents a comparison between the online network and the target network in predicting printing time in the proposed model.
Comparison Between the Online and the Target Network in Predicting Printing Time
The target network achieves high and consistent accuracy in both the training and testing sets (91.8% and 91.2%, respectively), demonstrating its effective learning when provided with complete data. The online network, despite handling masked data, still achieves relatively high accuracy, with 90.5% on the training set and 89.8% on the testing set. This indicates that, even with missing input parameters, the online network can make accurate predictions thanks to the consistency loss mechanism and the self-supervised learning method. The online network’s consistency loss value of 0.015 shows that it has learned to align with the target network, even when input data are incomplete.
Based on Figure 9, the performance of the online network in this study can be analyzed in detail. During the early epochs, from 0 to around 20, the loss value for both the training and testing sets decreases rapidly, from approximately 0.8 to about 0.3. This rapid loss reduction indicates that the online network quickly captures patterns from the data and begins optimizing its predictions effectively during the initial stages of learning.
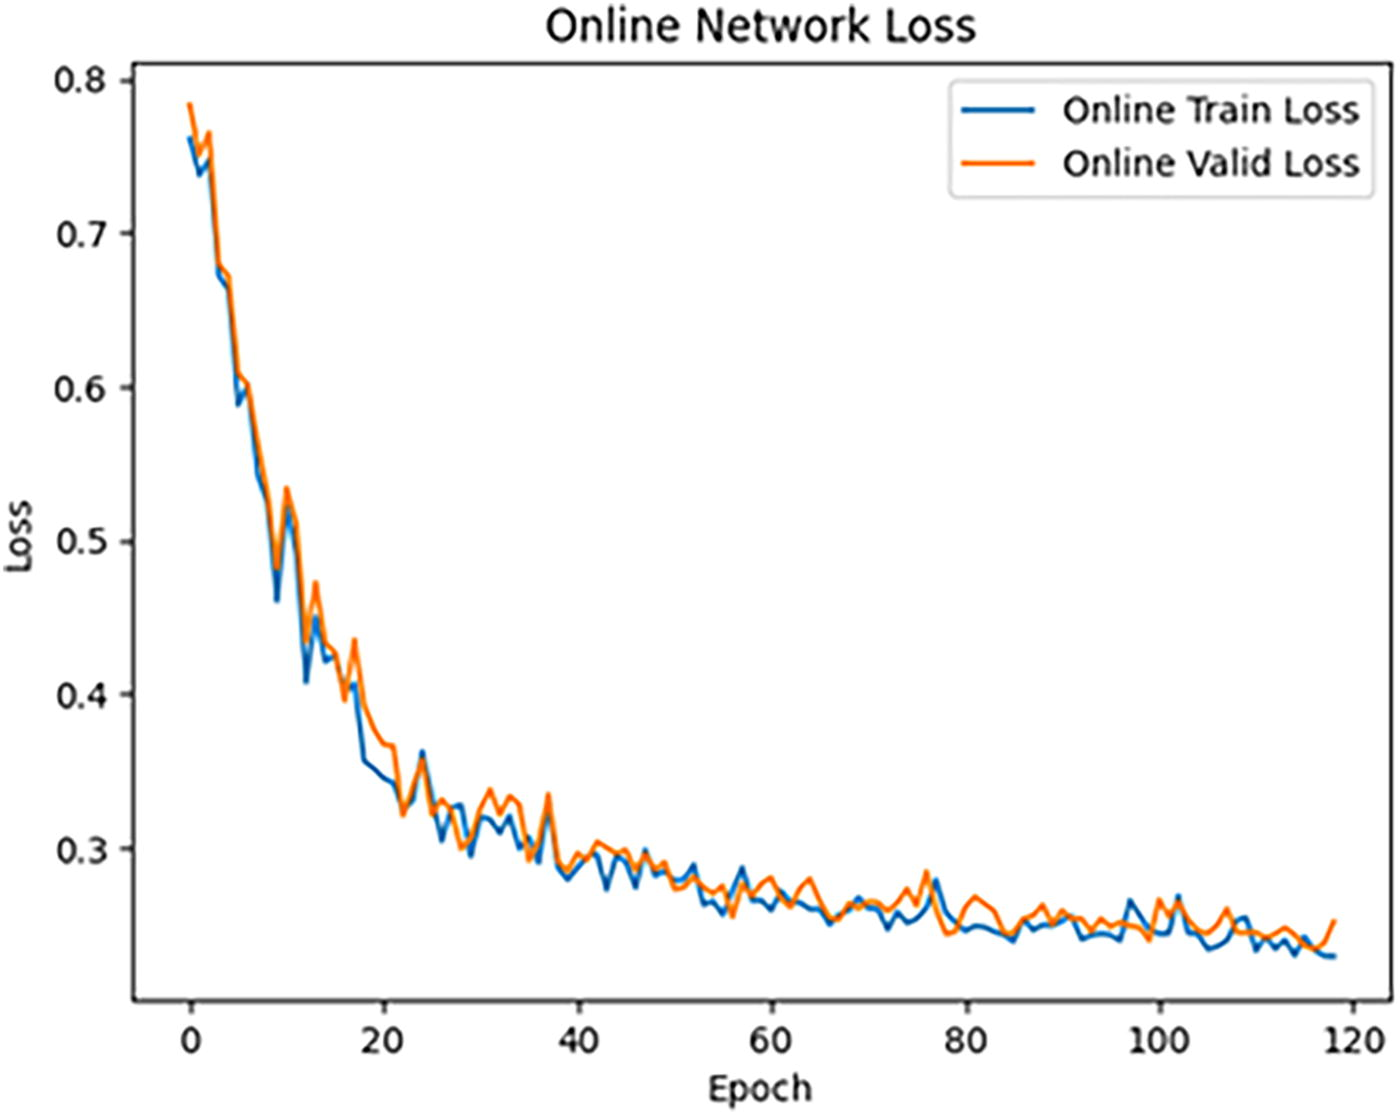
Online network loss.
After around 20 epochs, the rate of loss reduction slows down and stabilizes, fluctuating within the range of 0.25–0.3. This stabilization phase signifies that the model has reached a point where further improvements are minimal. The relatively low loss value demonstrates that the online network has learned key features from the data and maintains high accuracy in its predictions. The loss curves for the training and testing sets remain very close, with little to no significant divergence between them. This consistency highlights the absence of overfitting and confirms the model’s ability to generalize well on unseen data. The alignment of these curves demonstrates that the online network has learned in a stable manner, making accurate predictions without overly relying on the training data. While minor fluctuations in loss values are observed after 20 epochs, these variations are minimal and do not impact the overall stability of the model. This indicates that the online network has effectively learned to handle masked data and continues to perform well even when some information is missing.
The online network demonstrates exceptional performance in predicting 3D printing time, even with masked data. This is achieved through the combination of consistency loss and self-supervised learning, which enables the model to optimize its predictions with high accuracy while maintaining strong generalization without overfitting. The minor fluctuations after the initial learning phase are natural and do not detract from the overall robustness and effectiveness of the model.
Conclusion on the effectiveness of the hybrid supervised BYOL model
The effectiveness of the hybrid controlled BYOL model in predicting 3D printing time is demonstrated by its ability to handle incomplete data while maintaining high prediction accuracy (>90%), as shown in Table 4. This proves that the model is flexible and robust in real-world situations where input data are not always complete. The model not only performs well with complete data, but also shows strong adaptability when some critical parameters are masked, enhancing its applicability in production and 3D printing systems.
Prediction Results of the Hybrid Supervised Bootstrap Your Own Latent Model for 3D Printing Time
Table 4 presents the precision of predictions made by the target network under optimal conditions with complete input data. In this context, “precision” refers to the closeness of the predicted printing time to the actual printing time for individual cases, resulting in values close to 100%. This differs from the overall accuracy (∼90%) reported for the online network, which operates with masked input data and faces greater prediction challenges. The high precision values in Table 4 reflect the ideal performance of the target network, highlighting its effectiveness when all parameters are available, whereas the accuracy metric demonstrates the robustness of the online network in handling incomplete data.
Table 4 represents the performance of the target network under optimal conditions with no masked features. All 17 input features, including 7 geometric parameters and 10 printing-related parameters, are fully available for prediction. This table highlights the ideal precision achievable by the target network when complete data are provided. Masking experiments, which involve the online network, are discussed in other sections to demonstrate the model’s robustness under incomplete data conditions. The article has been revised to explicitly clarify this distinction.
In this study, the target network and the online network operate independently with distinct tasks tailored to the availability of input data. When all 17 parameters, comprising 7 geometric parameters and 10 printer setting parameters, are provided, the target network is utilized for making highly accurate predictions by leveraging the complete and detailed data. Conversely, in scenarios where certain printing parameters are omitted or unavailable, and replaced with default or random values, the online network is used. This network is specifically designed to handle incomplete input data, ensuring reliable and accurate predictions even in the absence of full information. This dual-network approach allows the model to adapt dynamically to varying data availability while maintaining robust performance.
A notable aspect of this approach is its ability to handle scenarios with missing data while still maintaining accuracy above 90%. This is particularly important when the model is tested by masking individual geometric parameters (rather than the printer setting parameters). When one of the seven geometric parameters is masked, the change in the online network’s prediction is observed. If accuracy drops significantly, it indicates that the parameter plays a critical role in the prediction process. Table 5 shows the percentage change in predictions when each geometric parameter is masked.
Prediction Change Percentage in Masked Geometric Parameters
The bold data in Table indicates the most critical parameter affecting 3D printing time. Specifically, masking the “faces” parameter resulted in the highest prediction change (56.93%), highlighting its significant impact on print time optimization.
The baseline accuracy of the model exceeds 90%, as shown in Figure 3, when all features are available. However, when one of the seven specified geometric features is randomly masked during training, the accuracy decreases. For instance, masking the “faces” parameter results in a 56.93% reduction compared with the baseline. This evaluation highlights the varying importance of features, with some, such as “faces,” having a stronger impact on prediction accuracy. The masking process was applied randomly during training, allowing the model to assess feature significance and maintain robustness under incomplete data conditions.
In this case, column 4 corresponds to the number of faces in the 3D model. Masking this parameter results in up to 56.93 percent of predictions changing, which highlights its significant impact on printing time. This influence can be attributed to several factors. The number of faces in a 3D object directly reflects the complexity of the model’s surface. As the number of faces increases, the slicer software must perform additional processing steps to slice the object, which increases its computational workload. Models with a high number of faces typically require longer analysis times and generate more print layers, both of which contribute to extended printing durations.
A larger number of faces also impose a heavier data processing load for the printer. Each layer must handle more detailed instructions, and this complexity necessitates slower printing speeds to ensure precision. In addition, the increased movement of the print head required to navigate these details further extends the total print time. The number of faces also affects printing speed and print head movement. Models with many faces demand precise movements of the print head, often requiring a reduction in printing speed to maintain output quality. This precision can increase the overall print time. Furthermore, a higher number of faces may lead to an increased number of layers, which adds to the total printing duration.
Lastly, the slicer software’s algorithm is significantly impacted by the number of faces. The software must analyze and slice the model based on its intricate surface structure. As the number of faces grows, the slicer performs more complex computations to generate the necessary print layers. This additional processing effort lengthens the slicing time, which subsequently contributes to longer overall printing durations.
The volume parameter in this study reflects the intrinsic geometric property of the 3D model, calculated using 3D viewer software, and does not account for printer-specific settings such as infill percentage. This separation ensures that the dataset captures the raw structural complexity of the object independently of operational configurations. While printing time is influenced by both geometric and printing parameters, distinguishing these inputs allows the model to analyze the contribution of each factor more effectively, ensuring accurate predictions and a clearer understanding of the printing process.
The role of consistency loss and cross-entropy loss
This model uses cross-entropy loss to ensure prediction accuracy and consistency loss to maintain consistency between the online network and the target network. This helps improve the interaction between the two networks and ensures that both networks can learn to make the same predictions, even when the online network is working with incomplete data.
Figure 10 provides detailed insights into the roles of consistency loss and cross-entropy loss in the proposed model. These loss functions serve complementary purposes, enabling the model to optimize predictions while maintaining alignment between the online and target networks.
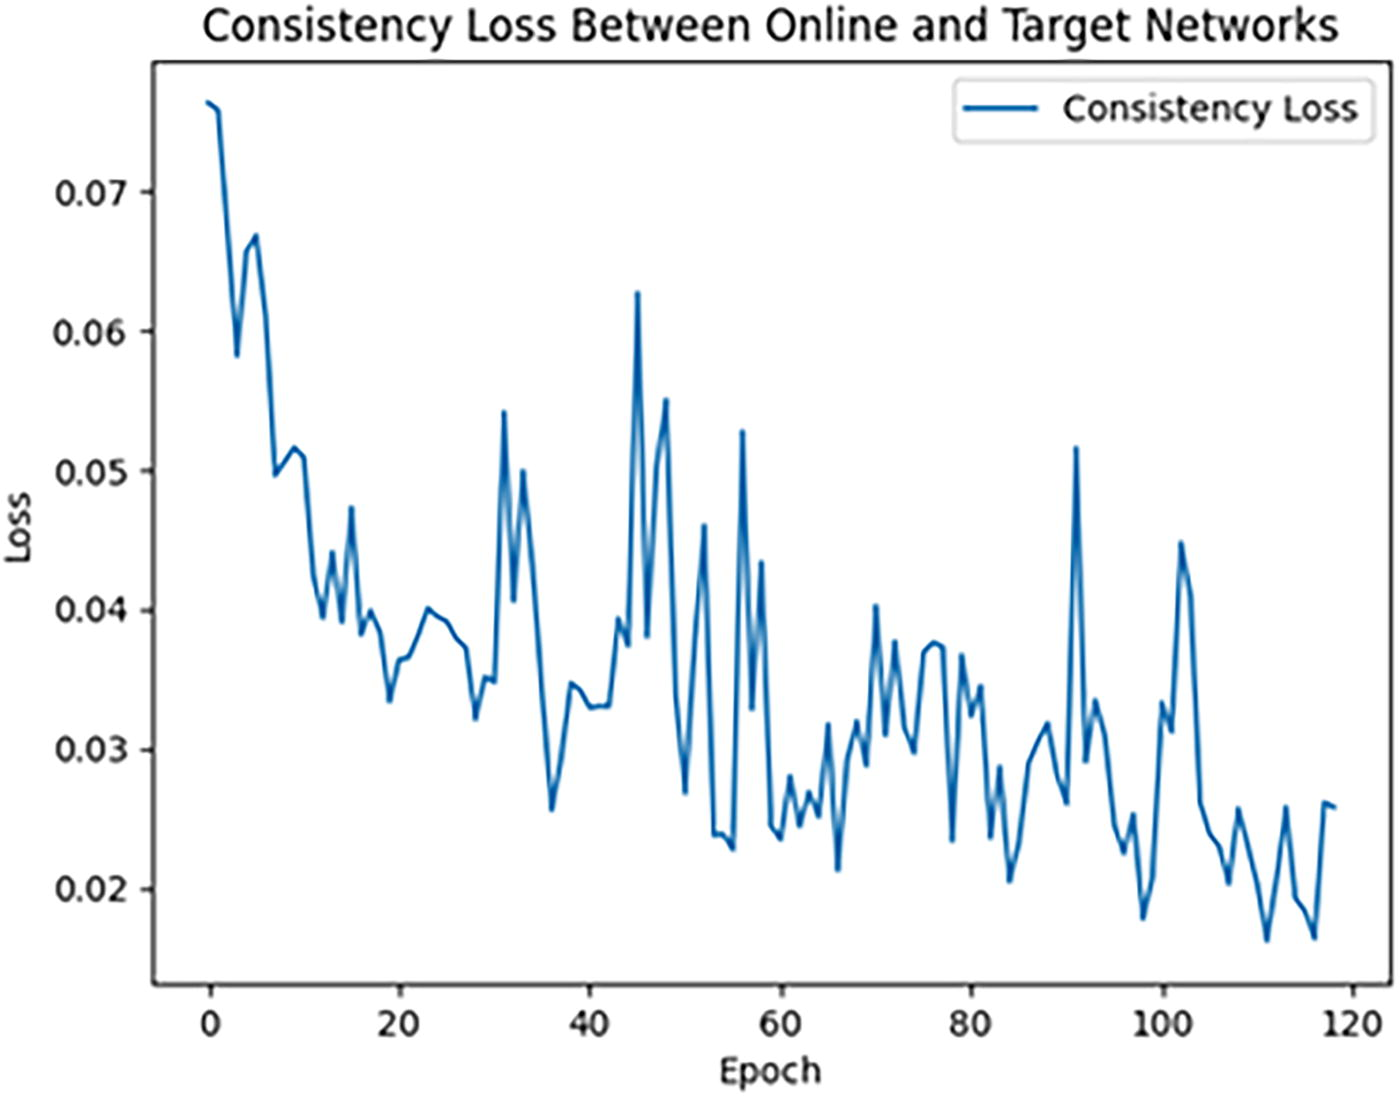
Consistency loss.
Consistency loss measures the difference between the predictions of the online network and the target network, ensuring that their outputs remain aligned. In the early epochs, consistency loss is relatively high, around 0.07, reflecting notable differences between the predictions of the two networks. However, as training progresses, consistency loss gradually decreases, indicating that the predictions of the online and target networks become more similar. Despite the overall downward trend, some fluctuations are observed, particularly between 30 and 60 epochs. These fluctuations are likely due to the challenges introduced by masked data, forcing the online network to adapt continuously. Over time, these fluctuations diminish, reflecting steady progress in aligning predictions. Consistency loss plays a crucial role in maintaining alignment between the networks, even when the online network is learning from incomplete data. Its gradual reduction demonstrates that the online network is effectively learning to make predictions similar to the target network, enhancing the model’s reliability in handling missing data.
Cross-entropy loss serves as the primary loss function for optimizing the model’s predictions on labeled data. The first graph illustrates the cross-entropy loss for the online network, which decreases rapidly during the early epochs, from approximately 0.8 to around 0.3. This rapid decline highlights the model’s ability to learn and optimize predictions quickly in the initial phase. After 20 epochs, the loss stabilizes around 0.3, with further reductions occurring more slowly. This stability indicates that the model has transitioned from fast learning to generalizing effectively on unseen test data. The second graph shows a similar trend for the target network, where cross-entropy loss decreases from 0.9 to approximately 0.3 within 20 epochs and continues to decline steadily in subsequent epochs. The nearly parallel curves for the training and test losses suggest that the target network is more stable than the online network, likely due to its reliance on the EMA of the online network’s weights. This mechanism enhances the target network’s ability to generalize well on test data.
Cross-entropy loss plays a fundamental role in supervised learning, helping the model compare predictions to true labels and optimize classification accuracy. Its consistent reduction across epochs demonstrates the model’s ability to make accurate predictions while avoiding overfitting to the training data. This gradual reduction indicates that the model is learning effectively and achieving high accuracy over time.
The combination of consistency loss and cross-entropy loss is critical to the model’s performance. Cross-entropy loss ensures accurate predictions on labeled data, while consistency loss enforces alignment between the online and target networks, particularly when the online network learns from masked data. Together, these losses enable the model to optimize predictions for complete data while maintaining reliability in scenarios with missing information.
In conclusion, cross-entropy loss serves as the core mechanism for training the networks to predict true labels accurately, ensuring precise decision-making. Consistency loss complements this by maintaining alignment between the two networks, especially under conditions of incomplete data. The gradual reduction of both losses across epochs highlights the model’s ability to learn effectively, generalize well, and handle real-world scenarios with varying data availability. This combination ensures that the model achieves robust and reliable performance across different input conditions.
Evaluation of the importance of parameters in the 3D printing model
One of the major contributions of this research is the evaluation of the importance of various parameters in the 3D printing model. The results show that the “faces” parameter has the most significant impact on printing time, with prediction changes up to 56.93% when this parameter is masked. This offers new insight into the role of technical parameters in the 3D printing process and how they affect the efficiency of the process.
Thus, masking the information about the number of faces altered nearly 57% of the model’s predictions, highlighting the critical importance of this column in predicting printing time. This metric differs from the typical feature importance indices in standard Deep Learning model training, as well as from correlation indices between features. Examining the linear relationship between input features and their effect on output is shown in Figure 11.
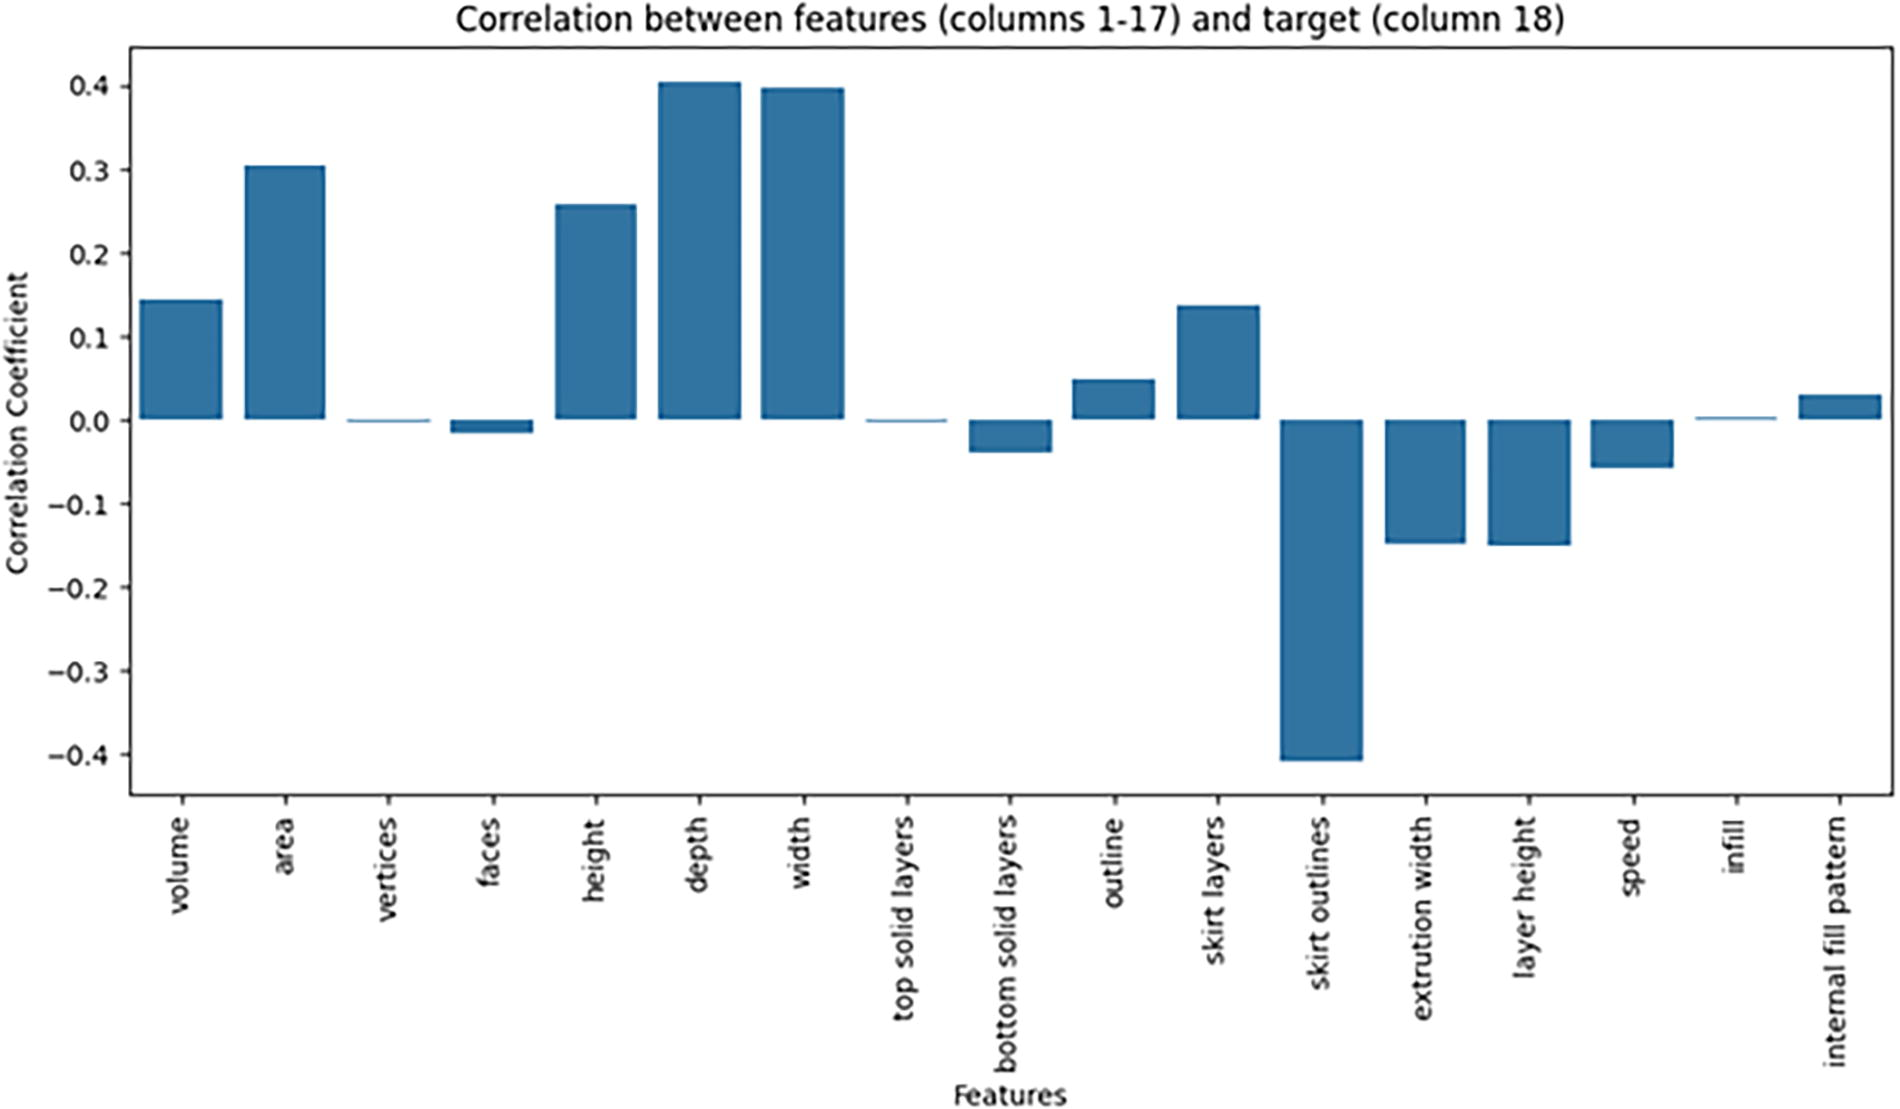
Linear relationship between input features and their effect on output.
When looking at the correlation between features and the target variable “time,” we observe that the “faces” column has an almost zero correlation coefficient, meaning that in linear calculations, it does not have a clear impact on the value of “time.” However, when the “faces” column is masked, and a significant change in the online network’s predictions is observed, it suggests that “faces” plays an important role in the model, particularly in how it interacts with other features.
Some possible explanations for this discrepancy are as follows:
Nonlinear correlation: Linear correlation only reflects the linear relationship between features and the target variable. If the relationship between “faces” and “time” is nonlinear, linear correlation will not capture it. However, deep learning models such as neural networks can detect these nonlinear relationships and utilize them to improve predictions. Interaction between features: Although “faces” might not have a large impact on its own, when combined with other features, it may create a stronger interaction. This could explain why masking the “faces” column has a significant effect on predictions. Role of the faces column in deep learning models: Neural networks may have learned to rely on the “faces” column during training, even if its correlation with “time” is not evident from a linear statistical perspective.
Thus, this interesting approach highlights the importance of paying close attention to the number of faces in the obj file before feeding it into the slicer software. Its nonlinear correlation and the interaction between the “faces” feature and other features clearly have a strong impact on printing time.
Conclusion and Future Directions
Conclusions
This study introduced and developed a hybrid supervised BYOL model, combining supervised and self-supervised learning to optimize 3D printing time, a complex task in manufacturing and industry. By utilizing two neural networks, the online network and the target network, this approach demonstrated outstanding capability in handling incomplete data while maintaining high accuracy. The research results indicate the following:
Effectiveness in handling incomplete data: The online network showed the ability to make accurate predictions even when some printing parameters were missing. This is particularly important in real-world applications, where complete data are not always available. The combination of consistency loss and cross-entropy loss helped the model maintain consistency between the predictions of the two networks, even when data were incomplete. Importance of geometric parameters: Experiments revealed that the “faces” parameter of the 3D model had the greatest impact on printing time, with prediction changes reaching up to 56.93% when this parameter was masked. This demonstrates that the number of faces in a model is not merely a simple factor but has a strong influence on 3D printing performance due to the more complex processing required by slicer software and the printer. Generalization and optimization ability: The target network, with complete data, achieved high accuracy, but notably, the online network also performed similarly well when handling incomplete data. This demonstrates the model’s flexibility and applicability in real-world scenarios, particularly when faced with incomplete data.
Future directions
In the future, this model can be expanded for application in various industrial fields, where processing and optimizing production time are key factors. Extending the model with new self-supervised learning methods could further enhance its predictive ability, allowing it to adapt more effectively to different types of data in real-world industrial environments. In addition, future studies may focus on optimizing and further analyzing other important parameters beyond the number of faces, to further improve the model’s performance in more complex 3D printing setups.
Footnotes
Authors’ Contributions
P.D.N.: Resources, data curation, conceptualization, software, and methodology. M.B.D.: Data curation, software, conceptualization, and methodology. T.Q.N.: Conceptualization, software, writing—review and editing, and supervision.
Disclaimer
This is to certify that to the best of authors’ knowledge, the content of this article is original. The article has not been submitted elsewhere nor has been published anywhere. The authors confirm that the intellectual content of this article is the original product of their work and all the assistance or funds from other sources have been acknowledged.
Originality Statement
“Thanh Q. Nguyen hereby declare that this submission is my own work and to the best of my knowledge it contains no materials previously published or written by another person, or substantial proportions of material. Any contribution made to the research by others, with whom I have worked in draft or elsewhere, is explicitly acknowledged in the draft.”
Data Availability and Access
The authors confirm that the data supporting the findings of this study are available within the article and its supplementary materials.
Author Disclosure Statement
The authors confirm that the intellectual content of this publication is the result of their own efforts and that all outside aid or funds have been acknowledged. There are no conflicts of interest declared by the authors.
Funding Information
This research did not receive any funding from any individual or organizations.