
Abstract
This study investigates the mode III fracture behavior of polylactic acid (PLA) fabricated by additive manufacturing (AM) through both experimental testing and numerical simulation. While AM is widely used in structural applications, research on mode III fracture behavior remains limited, particularly regarding the influence of build orientation on shear-driven failure. In this study, transverse shear cracked plate specimens were fabricated using fused filament fabrication (FFF) in three build orientations: horizontal, lateral, and vertical. These specimens were tested under mode III loading using a newly designed tensile testing fixture to determine the fracture toughness of PLA for each orientation. Young’s modulus values, obtained from tensile tests on dog-bone specimens, were used to compute the mode III fracture energy. Numerical simulations were performed using the extended finite element method (XFEM) to predict fracture load and crack propagation. The results showed close agreement with experiments, with deviations of 1.1%, 8.5%, and 0.4% for horizontal, lateral, and vertical orientations, respectively. The closest agreement was observed for vertically printed specimens, attributed to the intrinsic nature of mode III loading. These findings highlight the potential of XFEM as a reliable tool for predicting shear-driven fracture behavior in FFF-printed PLA across different build orientations, supporting improved structural evaluation and design decisions.
Introduction
Additive manufacturing (AM), particularly material extrusion via fused filament fabrication (FFF), has become a viable alternative to traditional manufacturing due to its cost-effectiveness and scalability. 1 Among the polymers used in FFF, polylactic acid (PLA) stands out for its biodegradability, nontoxicity, and suitability for various engineering applications, including biomedical scaffolds. 2
The layer-wise nature of AM significantly influences mechanical and fracture properties, with raster and build orientations playing a critical role in failure modes (interlayer, intralayer, or mixed) for FFF-printed polymers like PLA.3,4 Recent studies have primarily focused on mode I (opening mode) fracture behavior, demonstrating that build and raster orientations substantially influence the fracture response of PLA. 5 Similarly, layer height in fiber-reinforced 3D-printed mortars has been shown to influence fracture behavior by altering interlayer bonding,6,7 a finding that can be extended to the orientation-dependent behavior of PLA. Another study 8 reported that ±45° raster orientations in FFF-printed PLA and ABS specimens resulted in up to 169% higher fracture toughness compared with 0°/90° orientations, attributed to improved interlayer bonding and crack-path deflection. Moreover, FFF-printed PLA has been shown to exhibit the highest fracture toughness among various AM polymers (e.g., FFF-printed ABS and selective laser sintered polyamide) in certain orientations, 8 while its fracture properties remain highly sensitive to build orientation. 9
In addition to mode I, mode II (sliding mode) fracture behavior has also been studied for FFF-printed polymers, as these two modes are commonly encountered in engineering applications.5,6 For instance, the influence of geometric discontinuities on the mixed-mode I/II fracture behavior of FFF-printed parts has been investigated using extended finite element method (XFEM). 7 Similar studies on mixed-mode I/II fracture in additively manufactured materials were reported by Ameri et al. 10-12
While modes I and II have been widely examined in AM polymers, their fracture behavior under mode III (tearing mode) loading, which is critical for out-of-plane loading, remains largely unexplored, particularly for PLA. Existing mode III fracture studies focus on non-AM materials (e.g., polymethyl methacrylate, graphite, and epoxy) using specimen types like the edge notched disc bend 13 and transverse shear cracked plate (TSCP).14-16
Numerical investigations of fracture behavior in polymers have often employed XFEM, which is effective for simulating crack propagation.17,18 XFEM has been successfully applied to study modes I and II fracture in FFF-printed polymers, linking fracture behavior to build and raster orientations.19,20 Taoufik et al. 21 validated XFEM predictions of crack propagation against experimental data, highlighting the role of 3D printing parameter optimization in improving mechanical properties. For mode III, however, XFEM applications are limited to non-AM materials. For instance, Akhavan-Safar et al. 22 used XFEM to examine fracture behavior in adhesive joints under mixed-mode I/III loading, demonstrating the ability of the method to predict crack propagation paths under mixed-mode I/III and pure mode III loadings.
For FFF-printed PLA, however, research on the effect of build orientation (i.e., horizontal, lateral, and vertical) on mode III fracture behavior is lacking. To address this gap, in this study, the mode III fracture toughness and fracture energy of PLA-made TSCP specimens were investigated with varying build orientations. A mode III testing procedure was developed for use with a standard tensile testing machine. Fracture surfaces were analyzed using photography and scanning electron microscopy (SEM). Furthermore, XFEM simulations were performed to numerically evaluate fracture load and crack propagation using the mechanical and fracture properties extracted from the experiments.
Experimental Methods
Manufacturing specimens
In this study, dog-bone and TSCP mode III fracture specimens were fabricated using an FFF machine (ZAXE® X3). All PLA specimens were 3D-printed with five repetitions for each of the three different build orientations using a raster orientation of ±45°, as shown in Figure 1. The build orientations examined in this study are horizontal, lateral, and vertical, denoted as H, L, and V, respectively. The process parameters used for 3D printing are listed in Table 1.
Illustration of the print and raster orientations for all specimens in the Ultimaker Cura environment. Specimens were prepared in
Process Parameters Used When Manufacturing the PLA Specimens
PLA, polylactic acid.
Tensile and mode III fracture tests
Mode III is the fracture mode under out-of-plane sliding deformation due to an applied tearing or out-of-plane shear load. Various testing procedures can be used to introduce this tearing load. 14 In this study, custom test fixtures were designed to apply the tearing load to the specimen using a tensile testing machine. For this purpose, a testing procedure inspired by Zeinedini’s work 16 was adopted. In that study, a test-loading device was designed to enable mode I/II/III fracture testing using a tensile machine. The orientation of a TSCP specimen was adjusted relative to the tensile loading direction with the help of specially designed fixtures, allowing the application of different fracture modes. To achieve pure mode III behavior, the TSCP specimen was positioned such that the tensile loading force exerted by the machine acted on the faces of the TSCP specimen in the out-of-plane direction.
In this study, a similar out-of-plane loading concept was implemented using custom-designed fixtures compatible with the tensile test machine to observe mode III fracture behavior. The TSCP specimen was 3D-printed with the dimensions shown in Figure 2a and b, including the notch geometry. After printing, a sharp crack was introduced at the notch tip using a 0.2 mm-thick razor blade (SUIZAN Dozuki Dovetail Blade, Japan). The dimensions of the printed specimens, listed in Supplementary Data S1, indicate dimensional consistency across multiple fabricated samples.
Illustration of
The designed fixtures in this study clamp the TSCP specimen on both sides of the notch, as shown in Figure 2c. One side of the specimen is clamped to the bottom fixture, which remains stationary, while the other side is clamped to the top fixture, which moves upward to induce a transverse deflection. This motion continues until the crack propagates longitudinally in a tearing mode. The specimen has three holes on each side of the notch to facilitate clamping using bolts. Further details, including drawings and dimensions of the proposed mode III fixtures, are provided in Supplementary Data S2.
Once the specimen was fixed to the upper and lower fixtures, a tensile load was applied to the upper fixture using the testing machine at a displacement rate of 0.5 mm/min.
The fixtures clamping a 3D-printed mode III specimen are shown in Figure 3a. The crack propagation during the test is shown in Figure 3b, where out-of-plane tearing of the specimen is visible with the upward movement of its left side. This observation confirms that mode III fracture behavior was successfully induced by this testing procedure.

Illustration of
However, because FFF-printed PLA specimens exhibit anisotropy due to build orientation and raster directions, their mode III tests may result in crack propagation paths and fracture surfaces that deviate from expectations. To ensure that the testing procedure induces pure mode III loading, an epoxy-made TSCP specimen, which exhibits homogeneous material properties, was tested before evaluating the FFF-printed PLA specimens. The epoxy specimen was fabricated by molding with the same dimensions as shown in Figure 2, following the procedure employed in a previous study. 23
Molded epoxy specimens have been used in the existing literature,15,16 where mode III fracture tests revealed a fracture surface inclined at an angle, characteristic of homogeneous materials under pure mode III loading. Details regarding the epoxy molding process and the expected fracture surface are provided in Supplementary Data S3. Figure 3c and d shows the front and side views of the fracture surface obtained from the tested epoxy specimen in this study. The results confirm that the proposed fixture successfully imposes mode III loading on the specimen.
In addition, dog-bone specimens based on ASTM D638 Type I 24 were 3D-printed in three build orientations and tensile tested with a crosshead speed of 1 mm/min. A digital image correlation (DIC) technique was employed to extract the mechanical properties. This method is commonly used to characterize the tensile behavior of materials 5 and has also been applied to analyze crack propagation in the fracture studies.25-27 In this study, DIC was specifically utilized to measure strain by tracking the deformation of the painted speckles on the gauge length of the tensile specimens, 28 as shown in Figure 3e. A detailed description of the DIC procedure is provided in Supplementary Data S4.
Theory and Formulation
Mode III fracture toughness and fracture energy
The mode III fracture toughness (
The corresponding fracture energy for mode III is determined by
Numerical fracture analysis using XFEM
The XFEM was employed for the numerical fracture simulations of the mode III test. This method enables cracks to propagate through the element interior by incorporating enrichment functions into the conventional finite element formulation. These enrichment functions facilitate displacement jumps across crack faces and model the singularity at the crack tip, as described by
29
In XFEM, crack initiation was modeled using a cohesive traction-separation law. Specifically, the maximum principal stress (MaxPS) criterion was applied in ABAQUS to simulate the crack initiation.
30
According to this criterion:
For crack propagation, the following fracture energy power-law criterion was used to model damage evolution:
Numerical Modeling
The TSCP specimen was modeled with the dimensions shown in Figure 2a. The specimen model, along with the applied boundary and loading conditions, is illustrated in Figure 4a. The specimen model was partitioned into multiple sections to facilitate meshing. The crack was represented by defining a two-dimensional plane at the notch location in the TSCP specimen. The model was meshed with three-dimensional, 8-node linear brick elements (C3D8), as shown in Figure 4b. A mesh refinement study was conducted, determining that the smallest element size around the crack tip was 1 mm ×1 mm ×1 mm along the x-, y-, and z-axes, respectively.
XFEM model of mode III specimen
The boundary conditions were applied as suggested in Akhavan-Safar et al. 22 to simulate the clamping of the TSCP specimen between the plates of the proposed mode III fixtures. Specifically, on each side of the specimen, the cross-sectional area of 1.5 bolts was coupled to a reference point to apply the loading and boundary conditions (Fig. 4c and e). The right-hand side of the specimen was fully constrained, whereas a displacement was applied to the left-hand side in the z-direction (Fig. 4a). The XFEM domain was defined as a rectangular section surrounding the crack and extending between the bolt-hole regions, as shown in Figure 4d.
Results and Discussion
Tensile test results
The stress–strain responses of five dog-bone specimens for each build orientation were extracted and used to determine Young’s modulus (E) and yield strength (
Material Properties Extracted From Dog-Bone Specimens Through DIC
DIC, digital image correlation.
Mode III fracture test results
Five specimens for each build orientation were manufactured and tested using the proposed fixtures to examine the mode III fracture behavior of PLA. The load–displacement responses of the samples are shown in Figure 5. The critical mode III fracture toughness and corresponding fracture energy values were calculated using Eqs. (1–4) and are listed in Table 3, along with their averages and standard deviations. The average fracture properties listed in Table 3 were employed in the XFEM analyses. The results indicate that the lowest and highest fracture properties correspond to the horizontal and vertical build orientations, respectively. The effects of build orientation on Young’s modulus and yield strength can be attributed to its effect on the failure type (i.e., interlayer, intralayer, or mixed) and the resulting crack propagation path. Additional details, including photographic and SEM images, are provided in Supplementary Data S6.
Illustration of crack propagation path and fracture surfaces of mode III specimens printed with the
Mode III Fracture Toughness (
PLA, polylactic acid.
Discussion on fracture surfaces
Fracture surface photographs were taken using the Canon EOS 250D, and the failure types observed across different build orientations were investigated. Representative images taken for one mode III specimen from each build orientation are shown in Figure 5. Moreover, SEM images of fracture surfaces (also shown in Fig. 5) were prepared for one specimen manufactured in each build orientation. In general, SEM imaging can reveal two main failure modes in fracture surfaces: (1) Raster rupture, which produces a rough fracture surface because of the pullout of individual rasters (intralayer failure), and (2) delamination between layers, which results in a smooth fracture surface (interlayer failure). 31
In the horizontal orientation, the top view in Figure 5a shows that the crack path follows the raster direction of ±45°, creating a flat fracture surface within the same layer rather than between layers, indicating intralayer failure. The corresponding SEM image reveals tiny voids associated with raster pullout, a typical sign of this failure type. 32 Due to the ductile nature of PLA, substantial plastic deformation is visible around the pulled-out rasters, as also suggested by Aloyaydi and Sivasankaran. 33 Furthermore, when ±45° raster orientations are used, a combination of rough and smooth zones (intralayer and interlayer failures) typically appears, as reported in Naveed, 34 leading to V-shaped fracture channels, resulting from raster failure in two perpendicular directions 35 as observed in Figure 5a. Thus, the SEM analysis confirms that intralayer failure is predominant in horizontally fabricated specimens under mode III loading.
In the lateral orientation, the crack path is perpendicular to the notch and parallel to the layer interfaces, as shown in Figure 5b, indicating interlayer failure. This failure mode arises due to weak interfacial bonding between adjacent layers, 34 which limits effective load transfer, causing premature failure before the material reaches its tensile capacity. The SEM image supports this finding by displaying predominantly smooth surfaces with clearly visible raster patterns. These are characteristics that are not typically observed in intralayer-dominated failures. Although the failure primarily occurs along layer interfaces, some regions exhibit failure between rasters aligned at ±45°, resulting in a relatively smooth but topographically uneven fracture surface.
In the vertical orientation, the crack path is aligned with both the notch and the build direction, which corresponds to the direction of layer stacking, as illustrated in Figure 5c. Similar to the lateral case, this orientation results in interlayer failure. The SEM image corroborates this by showing a smooth fracture surface with no apparent transition between layers, which indicates that the failure occurred along the layer interfaces.
Additional fracture surface photographs, interpretations of different failure types for horizontal, lateral, and vertical orientations, and further discussions on mode III fracture are provided in Supplementary Data S6. It is also noteworthy that the loading direction for all specimens, regardless of build orientation, is along the Z-axis. However, the direction of the layer sequence varies depending on the build orientation: it is along the Z-axis for horizontal, the X-axis for lateral, and the Y-axis for vertical build orientations.
Numerical results
The numerical investigations of the study were conducted using XFEM, incorporating the mechanical and fracture properties of PLA obtained from the standard experiments. The load–displacement curves extracted from the XFEM simulations are plotted in Figure 6, alongside the corresponding experimental curves for comparison. The numerical predictions of stiffness (load/displacement) and crack initiation points align well with the experimental data. However, discrepancies arise after the crack initiation, particularly during crack propagation. These differences are attributed to the partially ductile behavior of PLA, as evidenced by the nonlinear segments of the experimental load–displacement curves.
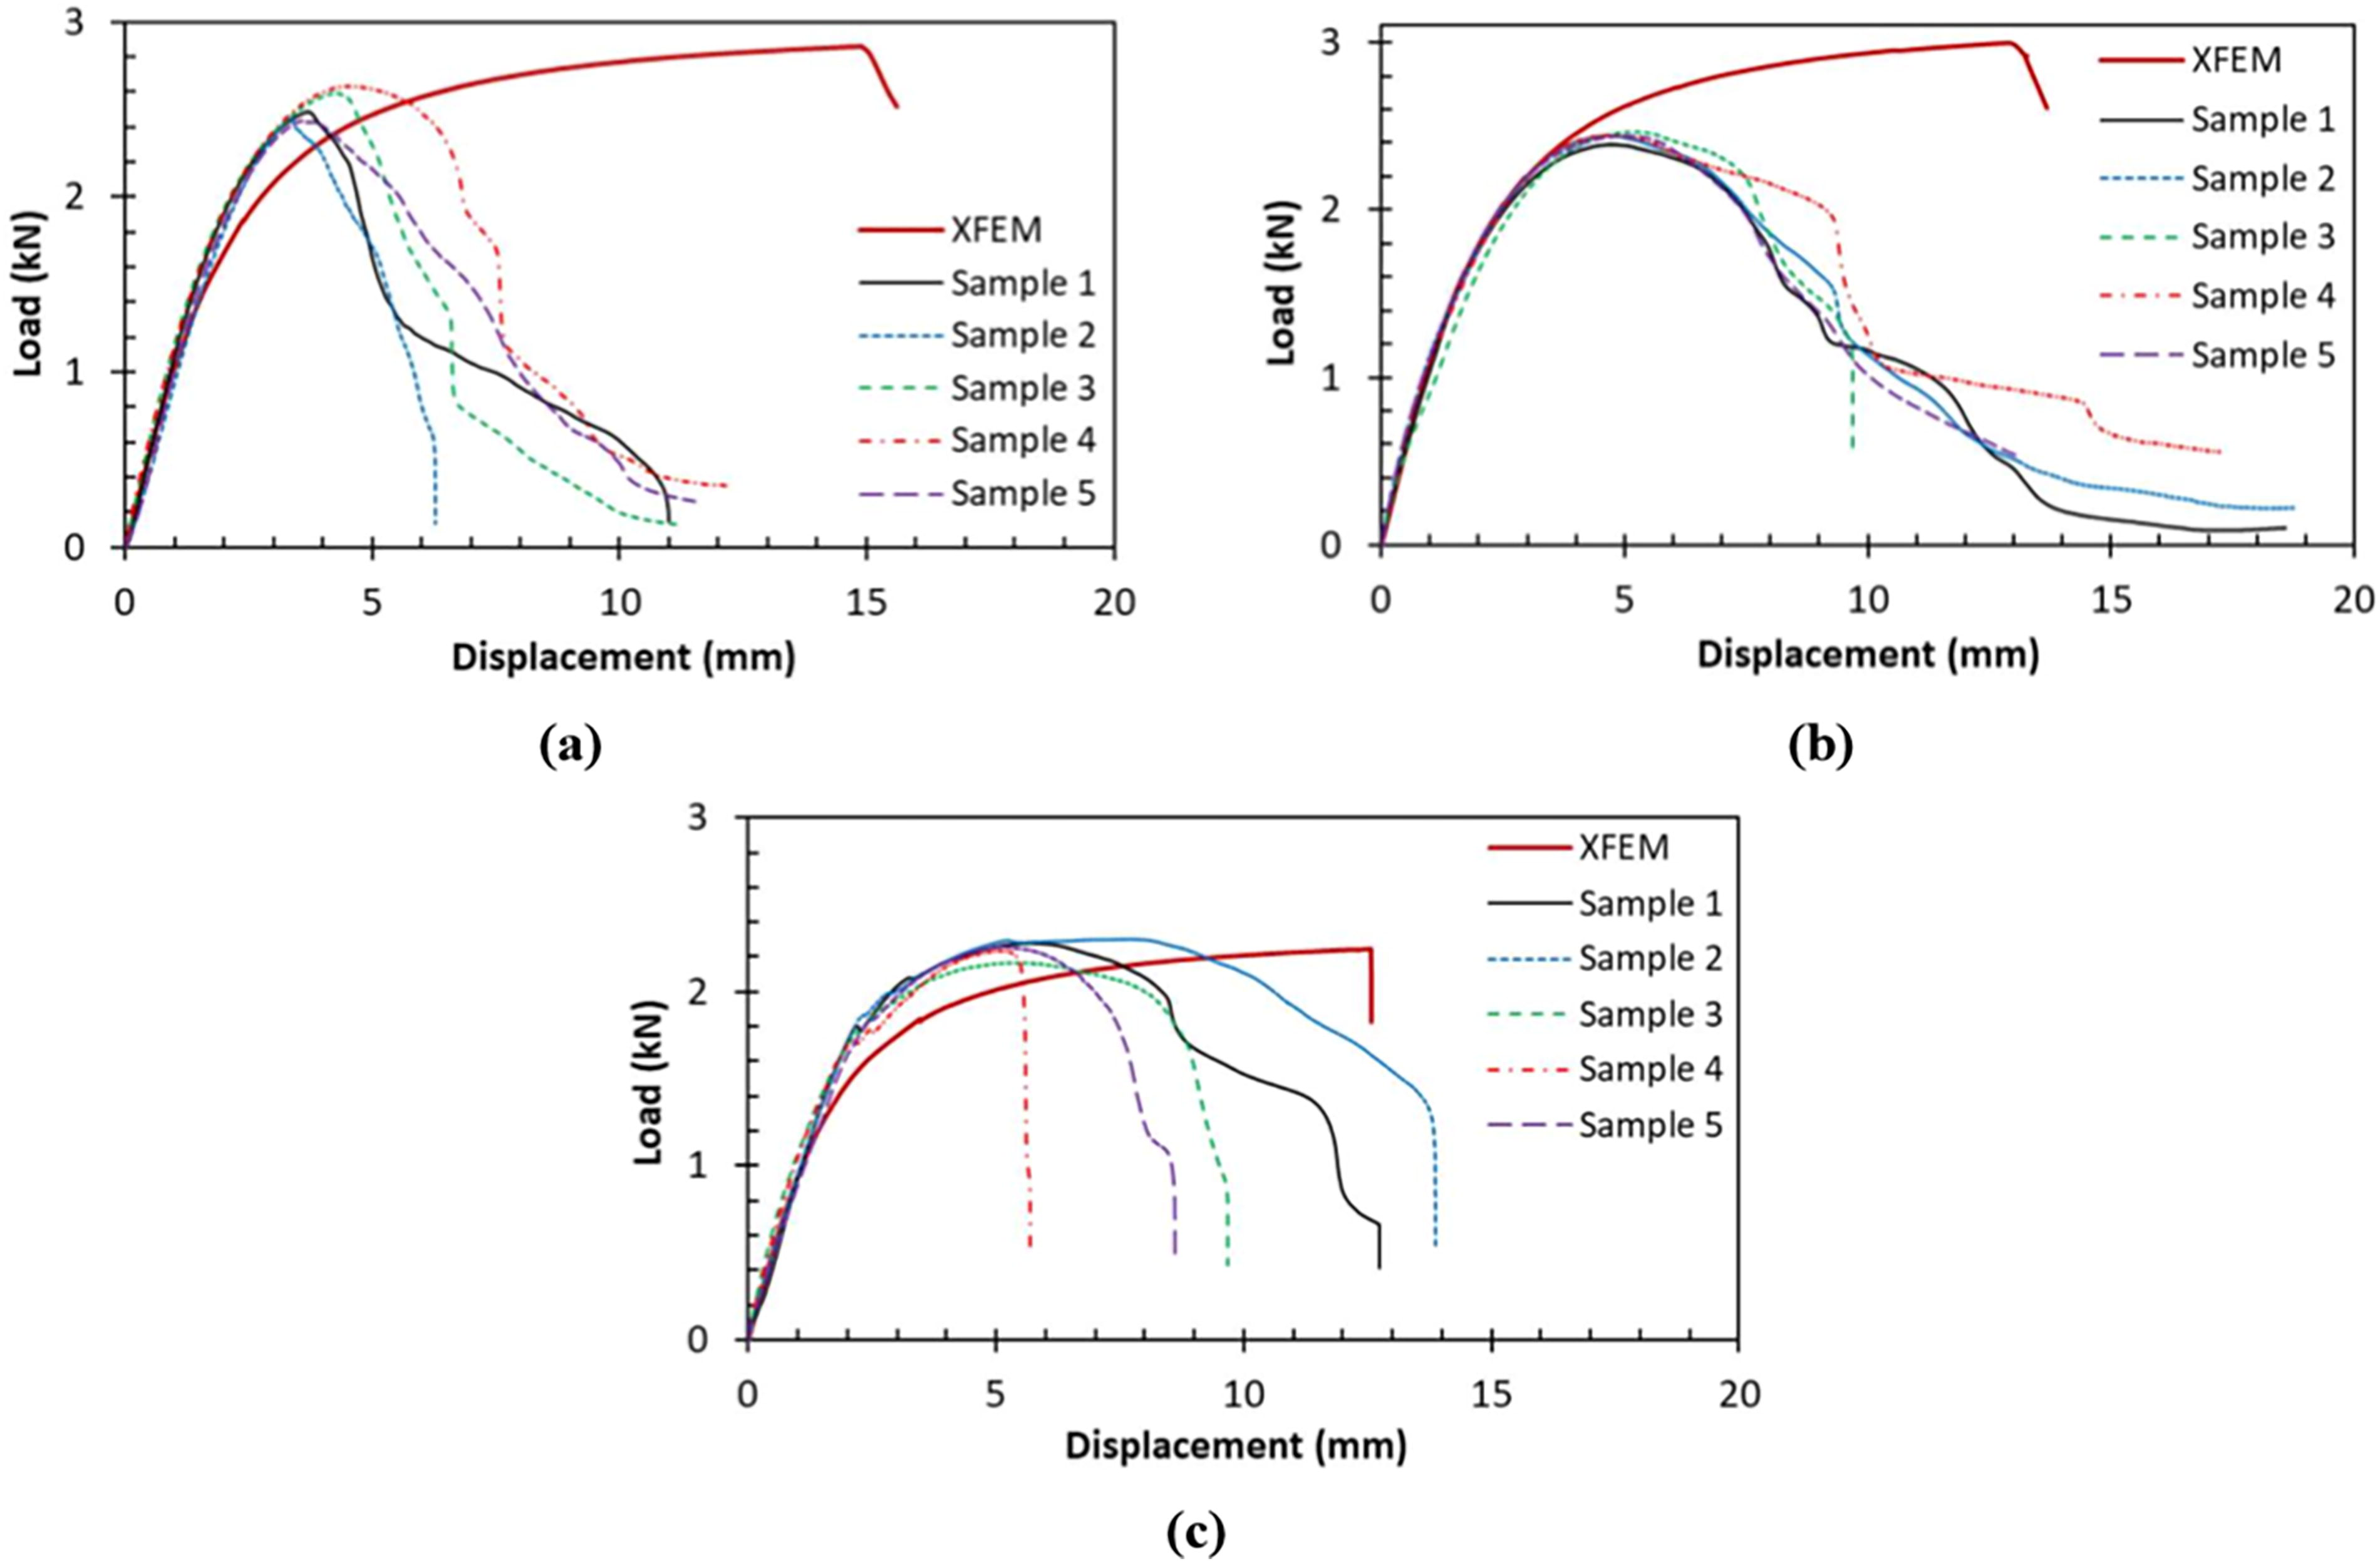
A comparison between load–displacement experimental and numerical responses of
It is important to note that the experimental fracture parameters were interpreted using the linear elastic fracture mechanics (LEFM), while a bilinear traction-separation law was employed in the XFEM simulations to model the fracture process. This approach allows for progressive damage and interface degradation, which provides a more realistic representation of the tearing behavior observed in PLA specimens. As such, the numerical model extends beyond the assumptions of LEFM and is better suited to capture the limited plasticity present in the tested material.
Although the fracture loads predicted by the simulations exhibit differences compared with the experimental values, the errors remain below 9% for all specimens as shown in Table 4. It can be observed that when using the mechanical and fracture properties obtained from the vertically printed TSCP specimens, the numerical results show better agreement with the experimental data. This result is expected, considering the fracture surfaces of the vertically fabricated specimens, which reflect a relatively pure mode III tearing failure (see Supplementary Data S5). In this orientation, crack propagation occurs directly along the crack length direction, and the simpler interlayer failure along the layer cross-section contributes to more accurately predicted load–displacement behavior in the numerical analyses.
The Experimental and Numerical (XFEM) Results of the Mode III TSCP Specimens
TSCP, transverse shear cracked plate; XFEM, extended finite element method.
In Table 4, the experimental and numerical stiffness values (K = load/displacement in the initial linear region of the curves in Fig. 6) and the peak load (Fpeak) of the mode III specimens are presented for comparison, along with their means and standard deviations. As observed, the standard deviations are relatively low compared with the mean values, indicating consistent and repeatable test results.
The crack initiation and propagation in the numerical analyses of the mode III samples, simulated using the fracture properties of the PLA TSCP specimens additively manufactured with the horizontal, lateral, and vertical build orientations, are shown in Figure 7. In each figure, a small inset box with red lines highlights the crack propagation in detail. The contour plots also present the distribution of MaxPS throughout the specimens.
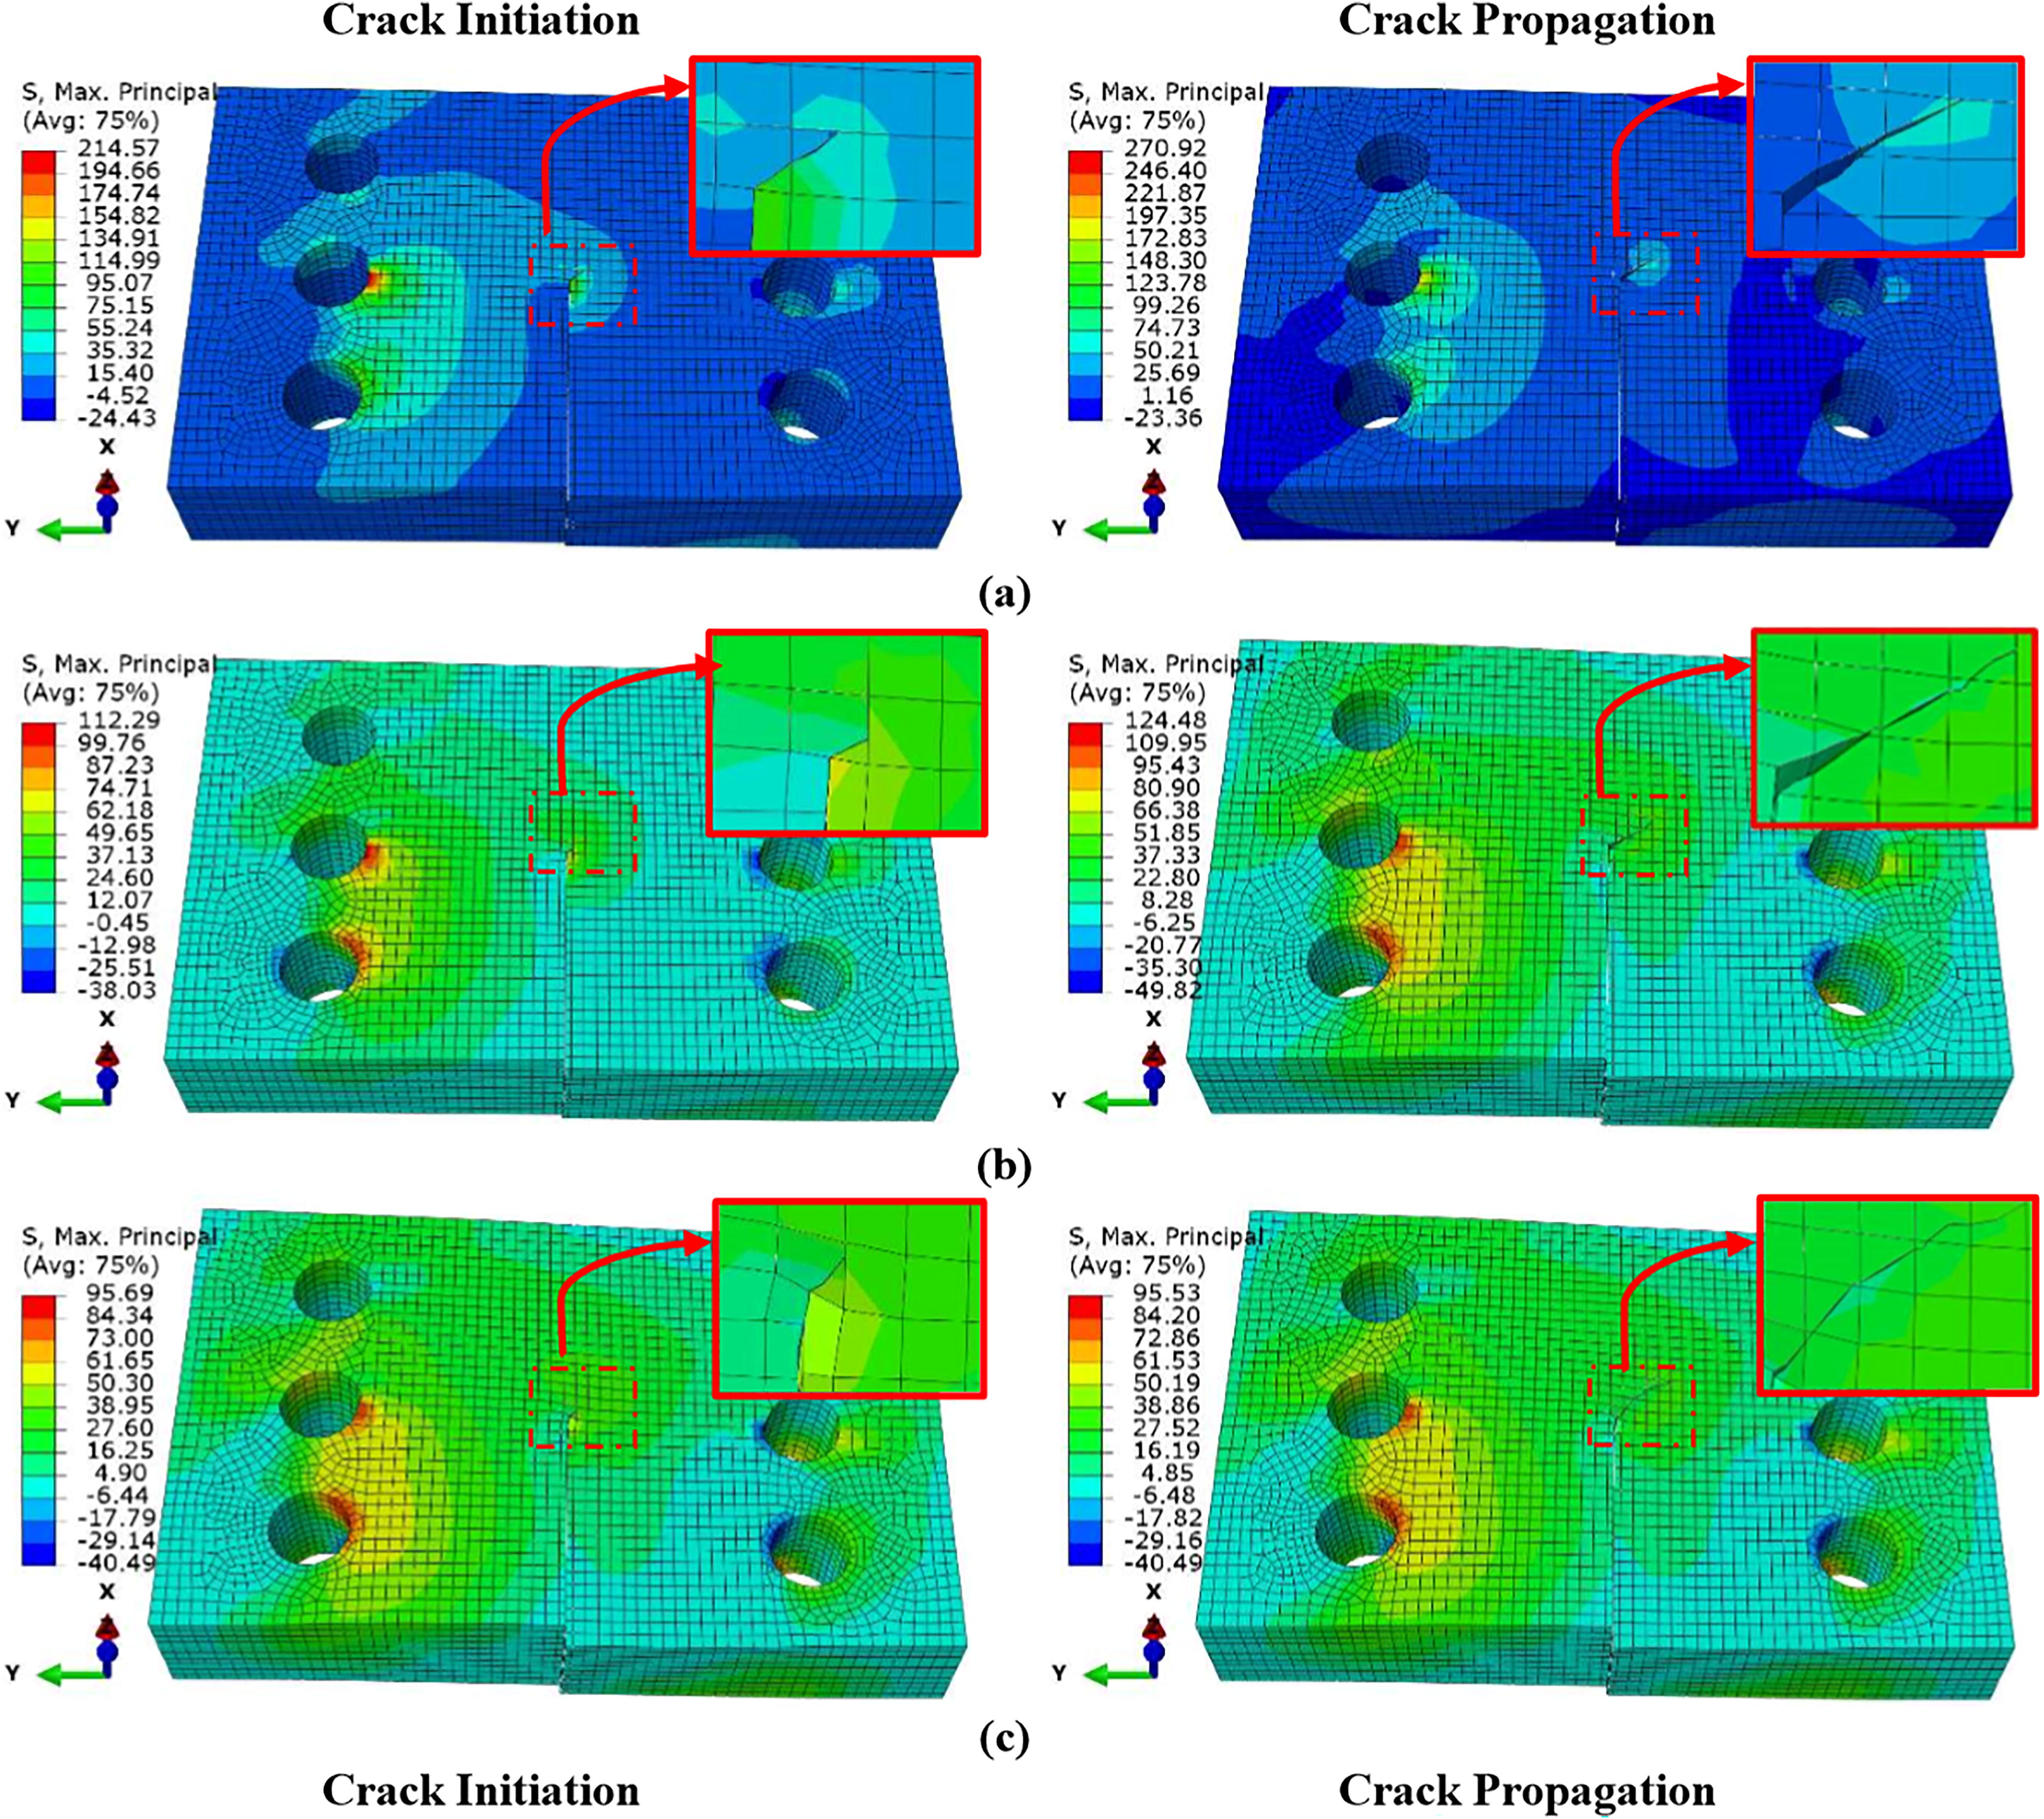
Illustration of the crack initiation and propagation in the mode III TSCP specimens fabricated with the
In the models simulated with the material properties obtained from the TSCP specimens fabricated in the three different build orientations (horizontal, lateral, and vertical), the crack initiates at the sharp tip and then kinks toward the near-diagonal direction. The crack continues to propagate along an almost straight diagonal path, as seen in Figure 7. These crack propagation directions are consistent with findings reported in the literature, 22 where diagonal crack kinking was also observed in mode III simulations.
In addition, the extent of crack propagation varies depending on the build orientation used in the simulations. Specifically, when the material properties of the vertically printed specimens were used (Fig. 7c), the crack propagated further compared with those simulated with the properties of horizontally and laterally printed specimens (Fig. 7a and b). This longer propagation is attributed to the significantly lower yield strength of the vertically printed specimens, as shown in Table 2. Interestingly, although the laterally printed specimens have a higher yield strength than the horizontally printed ones, the crack propagated slightly further in the lateral case. This behavior is explained by the higher Young’s modulus of the laterally printed specimens, which resulted in higher stress at the same deformation and crack initiated earlier. Thus, the numerical results provide expected propagation behavior for mechanical properties associated with each build orientation.
Conclusions
This study investigated the effects of build orientations (horizontal, lateral, and vertical) on the mode III fracture response of FFF-made PLA specimens using a specially designed fixture. The experimental results revealed that horizontally fabricated specimens exhibited the lowest fracture toughness and energy, while the lateral and vertical orientations produced similar values. Photography and SEM investigations confirmed that the build orientation significantly influences the mode III fracture behavior of PLA. Specifically, the crack paths were diagonal, perpendicular, and parallel to the notch for specimens fabricated in horizontal, lateral, and vertical orientations, respectively. The diagonal crack path in the horizontally printed specimens was attributed to ±45° raster orientation, whereas the cracks in laterally and vertically printed specimens primarily followed the interlayer regions, aligning with the printed layers or raster direction.
The mechanical and fracture properties obtained from the experiments were employed in XFEM simulations, which demonstrated high predictive accuracy. The numerical results deviated from the experimental fracture loads by 1.1%, 8.5%, and 0.4%, and from stiffness values by 4.9%, 1.6%, and 8.1% for the horizontal, lateral, and vertical orientations, respectively. These findings underscore the critical influence of build orientation on fracture performance and highlight the potential of integrating XFEM simulations into the design and optimization processes of 3D-printed structures subjected to mode III loading.
This study was limited to the LEFM analysis of the experimental data from FFF-printed PLA specimens, although plastic properties were included in the simulations. Nevertheless, the assumption of linear elastic crack growth in XFEM may still introduce certain limitations, particularly in capturing the effects of plastic zone development at the crack tip. This could influence the predicted failure loads and crack propagation behavior. Therefore, future work could explore alternative approaches to better account for nonlinearity and plastic deformations within the XFEM framework.
Footnotes
Acknowledgment
This research was funded by a grant from The Scientific and Technological Research Council of Türkiye, project number 122M823.
Authors’ Contributions
B.P.: Conceptualization, investigation, methodology, data curation, formal analysis, visualization, validation, and writing—original draft. R.M.G.: Conceptualization, investigation, supervision, funding acquisition, project administration, resources, and writing—review and editing.
Author Disclosure Statement
On behalf of all authors, the corresponding author declares that no known competing financial interests or personal relationships could have appeared to influence the work reported in this paper.
Data Availability Statement
The datasets generated during and/or analyzed during the current study are available from the corresponding author upon reasonable request.
References
Supplementary Material
Please find the following supplemental material available below.
For Open Access articles published under a Creative Commons License, all supplemental material carries the same license as the article it is associated with.
For non-Open Access articles published, all supplemental material carries a non-exclusive license, and permission requests for re-use of supplemental material or any part of supplemental material shall be sent directly to the copyright owner as specified in the copyright notice associated with the article.