




Abstract
Objective:
Previous studies evaluating neurophysiological correlates of long-term meditation are constrained by some methodological limitations. The objective of this study was to measure changes in the regional cerebral glucose metabolism during meditation using a novel methodological approach.
Design:
The present study was a part of a larger, nonrandomized, single-center open-label study.
Setting/location:
The study was conducted at the Department of Physiology and Department of Nuclear Medicine and Positron Emission Tomography. A dedicated place was set up as a yoga room, away from the positron emission tomography (PET) scanning room in the Department of Nuclear Medicine and Positron Emission Tomography, where meditators performed meditation in a peaceful environment in a sitting posture with eyes closed. The electroencephalography (EEG) was recorded to affirm the meditation objectively.
Subjects:
Twenty-four sets of PET scans were obtained at 2 different occasions (baseline and postmeditation within 40 min of 18FDG [18fluorodeoxyglucose] injection) from 12 apparently healthy, male, right-handed long-term meditators practicing Preksha meditation (since >5 years, at least 5 days a week) who were recruited from a well-established meditation center in Delhi.
Outcome measures:
Changes in the regional cerebral glucose metabolism during meditation versus baseline.
Results:
Regional cluster analysis showed significantly activated well-defined areas of fronto-parieto-temporal regions of the right versus left hemisphere during meditation. Interestingly, right homolog of Broca's area and right lentiform nucleus were hyperactive during meditation in all the meditators.
Conclusions:
Long-term meditation might potentially enhance the explicit functions of specific parts of the right hemisphere, possibly due to neuroplastic changes in the brain. Importantly, results of the current study are encouraging and show a novel methodological approach to acquire 18FDG PET/CT (computed tomography) images. The study was registered at Clinical Trial Registry India (CTRI), CTRI/2009/091/000727.
Introduction
Previous studies have proposed that the neurophysiological mechanism of meditation, 1 –5 which are constrained by certain methodological limitations. 6,7 Furthermore, there is a dearth of data with respect to long-term effects of meditation.
The surge of new and improved imaging techniques has made it possible to study the activation of the human brain more efficiently. The long-term practice of meditation might induce brain plasticity and these changes are largely similar to those observed with training and learning in an adult brain. 8 It should be noted that meditation reduces stress and inflammation 9 –12 ; however, it is important to explore the brain functions further to understand the neural correlates of meditation and stress.
A multitude of advanced imaging techniques such as functional magnetic resonance imaging (fMRI), positron emission tomography (PET), and single-photon emission computed tomography (SPECT) have been deployed to study changes in the brain during meditation. Earlier, few studies have quantified the subjective components of spiritual and religious practices using fMRI, PET, and SPECT imaging. 1 –5 However, these studies had some obvious methodological limitations, including measuring brain activity while meditation is being practiced inside the scanner, and/or subjective assessment of meditation. It is apparently very difficult to achieve a sound meditational state inside the scanner, and to ascertain if meditation is being performed, for example, in fMRI, the amount of noise in the scanner can reach up to 100 decibels. This level of noise and claustrophobic environment might completely disrupt the practice of meditation while lying in the scanner and hence might not give an accurate result, as queried in a recent study. 7
Therefore, the present study was designed to evaluate the regional cerebral glucose metabolism during meditation versus baseline using PET to overcome certain methodological challenges in long-term meditators. Furthermore, this methodological approach allowed the authors to record electroencephalography (EEG) to affirm meditation objectively while easily avoiding the mutual interference between PET-CT (computed tomography) and EEG electrodes. Additionally, the authors also tried to validate the long-term meditation practice claim by assessing the baseline levels of stress and inflammatory markers 13 (plasma cortisol, β-endorphin, interleukin [IL]-6, and tumor necrosis factor [TNF]-α) versus healthy controls.
Materials and Methods
The present study was part of a larger, nonrandomized, single-center open-label study conducted at the All India Institute of Medical Sciences, New Delhi, India. The study included three groups (n = 167), short-term meditators, long-term meditators, and healthy controls. The results for short-term meditators and healthy controls have been published previously. 11 PET imaging was performed only for long-term meditators, and results are presented here.
Participants
Long-term meditators (age 35.0 years [median; range 30.0–74.0 years]) predominantly practicing Preksha meditation (PM) were recruited from a well-established meditation center in Delhi. The word Preksha means to see or to perceive the self, which is the fundamental principle of this meditation; hence, it has been termed as Preksha meditation (PM). 14 The technique of PM is a process of awakening one's own reasoning mind (vivek) that aims at attitudinal change and behavioral modification through integrated development of personality. The main elements of PM are Kayotsarga (stopping of gross external physical activities), Antaryatra (internal trip, i.e., the process of making the energy flow upward), Shvasapreksha (to observe movement of breathing), Sharirapreksha (concentration of mind in each organ of the body to feel vibrations), Chaitanya Kendra preksha (control of the neuroendocrine system), Leshyadhyan (subtle flow of feelings in the consciousness), Bhavana (practice of getting rid of affection, desire, and fear), and Anupreksha (to break the delusion of mind).
A total of 26 long-term meditators were evaluated, and PET imaging could be successfully completed in 12 meditators at 2 different occasions, that is, at baseline and during meditation. Meditators with any current or previous history of major psycho-neurological or medical illness or chronic diseases such as heart diseases or diabetes were excluded. In addition, those using medications tending to affect neural activity or behavior or those addicted to alcohol and cigarette smoking were excluded. Only male subjects were recruited in the study. There were no firm criteria to exclude females, but this was questionable considering the possible effects of menstrual cycles. The authors offered conveyance or local transport expenses to the participants for study-related procedures to increase study compliance.
The sample size was based on previous neuroimaging studies 1,2,4 and was verified using an online software. 15 On this basis and the complexity of the 18 fluorodeoxyglucose positron emission tomography ( 18 FDG-PET) procedure, a total of 24 sets of PET scans obtained, at 2 different occasions, from 12 apparently healthy subjects (long-term meditators) were found to be appropriate and ethically accepted for the regional cluster analysis.
Study design
The most important feature of the study was the use of 18 FDG-PET as an imaging technique, which facilitated real-time brain imaging during meditation with EEG recording.
There are many similarities between PET and SPECT imaging with some significant differences, such as PET imaging provides better spatial resolution than SPECT and the distinctive half-life of radiotracers used. The uptake of 18 FDG (a radionuclide with half-life of 110 min) by highly active brain cells is an indicator of glucose uptake and its metabolism. The 18 FDG uptake pattern during meditation in active brain cells might be utilized to evaluate the differential blood flow and glucose metabolism in cells of the brain at baseline and during meditation.
A dedicated quiet place was set up as a yoga room in the Department of Nuclear Medicine and Positron Emission Tomography where subjects could practice meditation in a sitting posture. Before PET scanning, a catheter to inject
18
FDG was placed before the meditation practice was initiated. Once subjects were in the state of meditation for about 10–20 min, as assessed by EEG with random photic stimulation,
18
FDG was injected. After the injection, the meditator was still continuing the meditation. The depth of meditation, as evaluated by EEG wave activity, showed a constantly and significantly higher alpha and gradually increasing theta activity from the eyes closed (resting) state to the advanced state of meditation; the detailed analysis of EEG findings has been published previously.
16
The peak uptake of PET tracer is 25–30 min, so the authors have taken advantage of the 30-min duration of tracer uptake to evaluate brain regions activated during meditation. Furthermore, PET imaging was done after meditation was over, within 30–40 min of
18
FDG injection. Such benefit is not available for another comparable radionuclide (
15
O-H2O) that is also used in PET scanning as it has an ultrashort half-life of about 2 min, during which meditation is not possible. Hence,
18
FDG-PET was found to be most appropriate for such studies to measure brain cell activities during meditation. The procedure/time frame for the
18
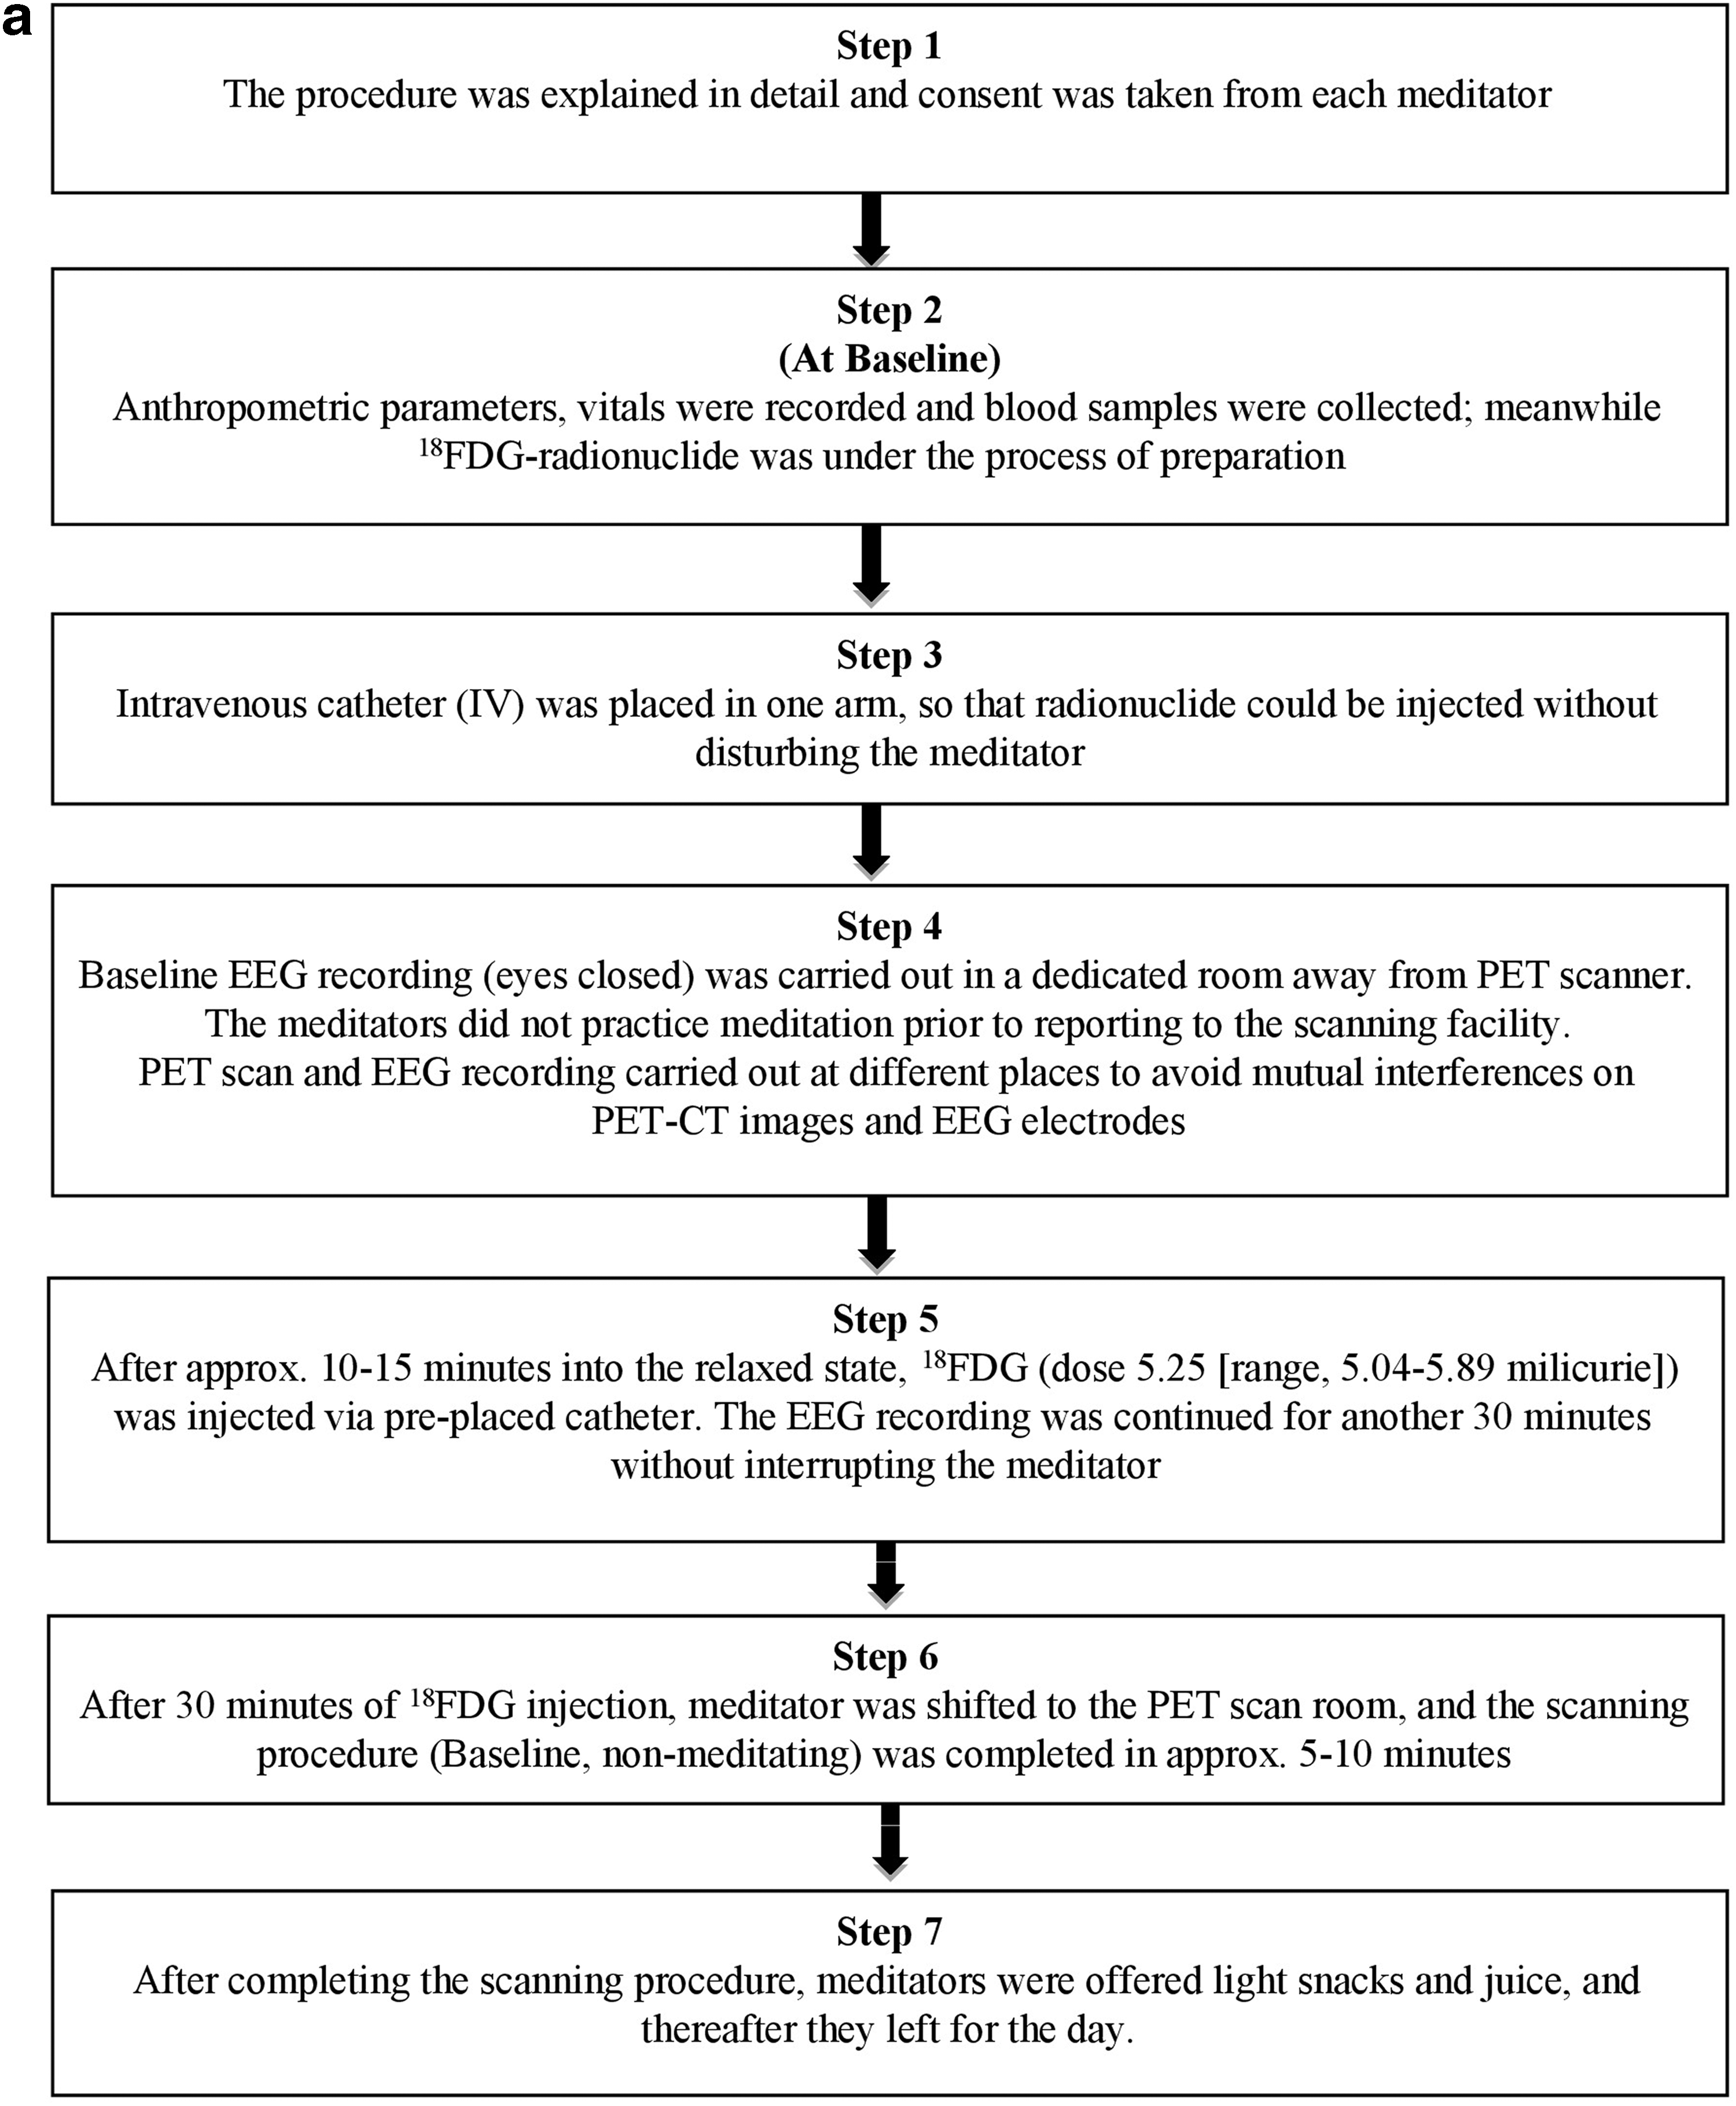
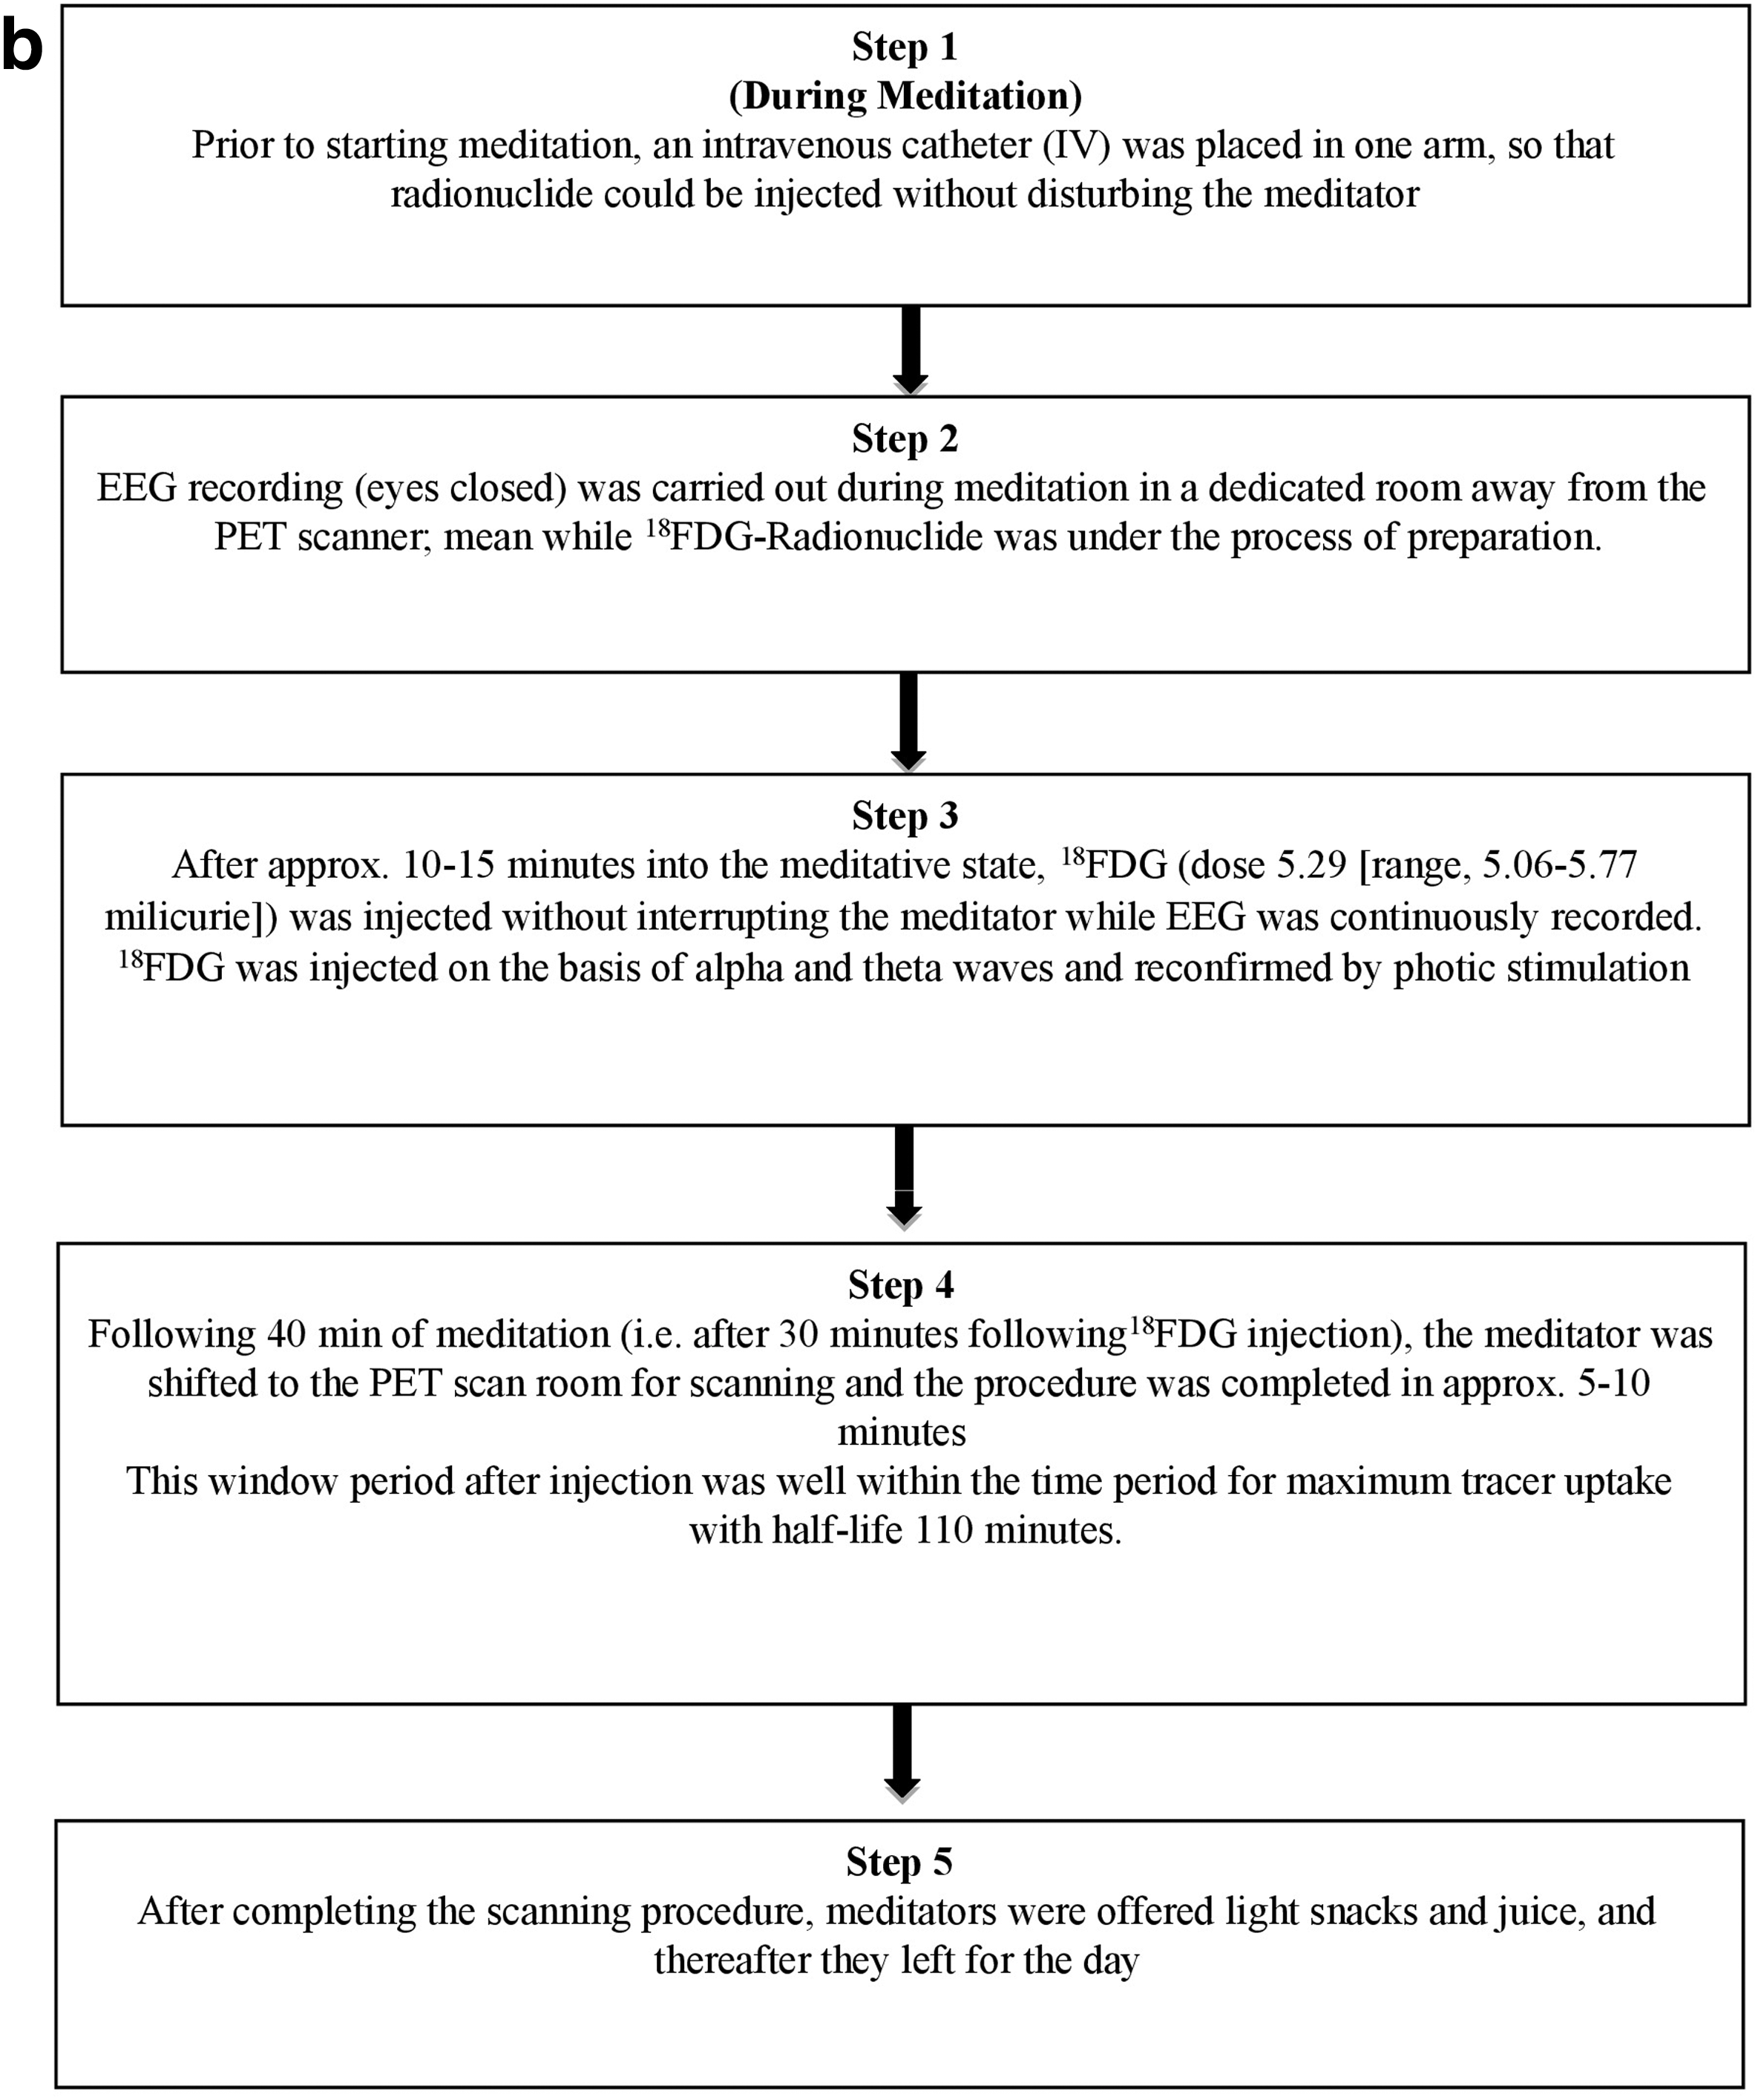
FDG-PET scan procedure and EEG recordings at baseline and during meditation are shown in Figure 1a and b. PET/CT scans were obtained between 10.30
A dedicated PET/CT scanner (SIEMENS, BIOGRAPH 64 PET/CT scanner) available in the Department of Nuclear Medicine was deployed. The LSO (lutetium oxyorthosilicate, Lu2SiO5:Ce) detectors had an attenuation coefficient of 0.89/cm, photo fraction of 30%, and decay constant of 40 ns. The energy resolution at 511 keV (% full width at half maximum) was 10 with spatial resolution of 6.0 mm in the PET/CT system. CT scan acquisition was performed on spiral dual-slice CT with a slice thickness of 4 mm and a pitch of one. Images were acquired using the matrix of 512 × 512 pixels and pixel size of about 1 mm. After the CT scan, three-dimensional (3D) PET acquisition was performed for 3–5 min per bed position for one–two bed position(s). PET data were acquired using a matrix of 128 × 128 pixels with a slice thickness of 1.5 mm. CT-based attenuation corrections of emission images were employed. PET images were reconstructed by the iterative ordered subset expectation maximization (OSEM; two iterations and eight subsets) method. After completion of PET acquisition, the reconstructed attenuation-corrected PET images, CT images, and fused images of matching pairs of PET and CT images were available for review in axial, coronal, and sagittal planes, as well as in maximum intensity projection's 3D mode. After image reconstruction, quantification of regional brain activity was performed using NeuroQ™ software (version 3.0; Syntermed, Inc., Atlanta, GA) 17 –20 dedicated to the visual display and quantitative analysis of regional brain PET data.
The NeuroQ analysis program aids in assessment of human brain scans through quantification of mean pixel values lying within standardized regions of interest and provides quantified comparisons with brain scans derived from FDG-PET studies of defined groups having no identified neuropsychiatric disease or symptoms, that is, asymptomatic controls. Following many internal data checks (e.g., accurate radiopharmaceutical) and to initiate the spatial transformation of subject brain scans (PET-FDG brain files in DICOM format) to the defined template, the normal template images are created from a high-quality normal brain 18 FDG-PET scan acquired at the University of California, Los Angeles (UCLA), and these are the images in which the 240 standardized regions of interest were defined. Spatial transformation was accomplished by a method previously described by Tai et al., 21 and the standardized regions of interests (S-ROIs) were defined by careful comparison between PET and magnetic resonance imaging (MRI)-based standard atlases. The resulting data output of the above processes was compacted into a smaller set of regional clusters. Each cluster value was defined by the average of the subset of all S-ROIs pertaining to a given brain structure (e.g., inferior frontal cortex, thalamus, and cerebellum) in all planes in which those S-ROIs appeared, weighted by the number of pixels contained within each S-ROI in each plane. For quantification of regional brain activity determined with S-ROI analysis of 18 FDG-PET, all values are expressed normalized to sensorimotor cortical activity. After normalization, it gives the mean (average number of counts per second per pixel in ROI) for each of the 240 ROIs of the patient; norm refers to the mean normalized to the average of all pixels in all ROIs (default). All regions have internally normalized region of interest (ROI) radiotracer uptake values falling >1.65 standard deviations below the mean values (in the hypometabolic operation) and >1.65 standard deviations above the mean values (in the hypermetabolic operation) for a symptomatic control group.
The hemispheric dominance for the whole brain was measured by the laterality index (Li) using Equation (1) given below:
where RH and LH are right and left hemispheres, respectively.
Statistical analyses
All statistical analyses were performed using SPSS, version 18.0 (SPSS Software, Inc., Chicago, IL). PET data analysis was a cluster-based analysis, and pre–post comparisons for 18 FDG uptake activity and for laterality index on the group data were made using the Wilcoxon signed-rank test with Bonferroni correction in frontal regions p = 0.003, temporal regions p = 0.005, occipital regions p = 0.012, brain stem regions p = 0.01, parts of association areas p = 0.025, and subcortical nuclei p = 0.012, assuming an alpha level of 0.05. Generation of cluster-based data is an inbuilt feature of NeuroQ software, eliminating the additional step of cluster value calculation. All the data are expressed as median (range).
Ethical aspects
The study was conducted in accordance with the Declaration of Helsinki, and the protocol of the study was approved by the Institute's Ethics Committee, All India Institute of Medical Sciences, New Delhi. The study was registered at Clinical Trial Registry India (CTRI), CTRI/2009/091/000727.
Results
A total of 26 apparently healthy, expert long-term meditators were enrolled in the study, and 2 sets of pre–post scans could be obtained fruitfully for 12 long-term meditators. Subject disposition is presented in Figure 2. All the long-term meditators (median age 35 years) were right-handed and were practicing PM. The median duration of meditation practice was 11.0 years (range, 9.0–50.0 years) and for about 45.0 min (range, 30.0–60.0 min) a day (Table 1).
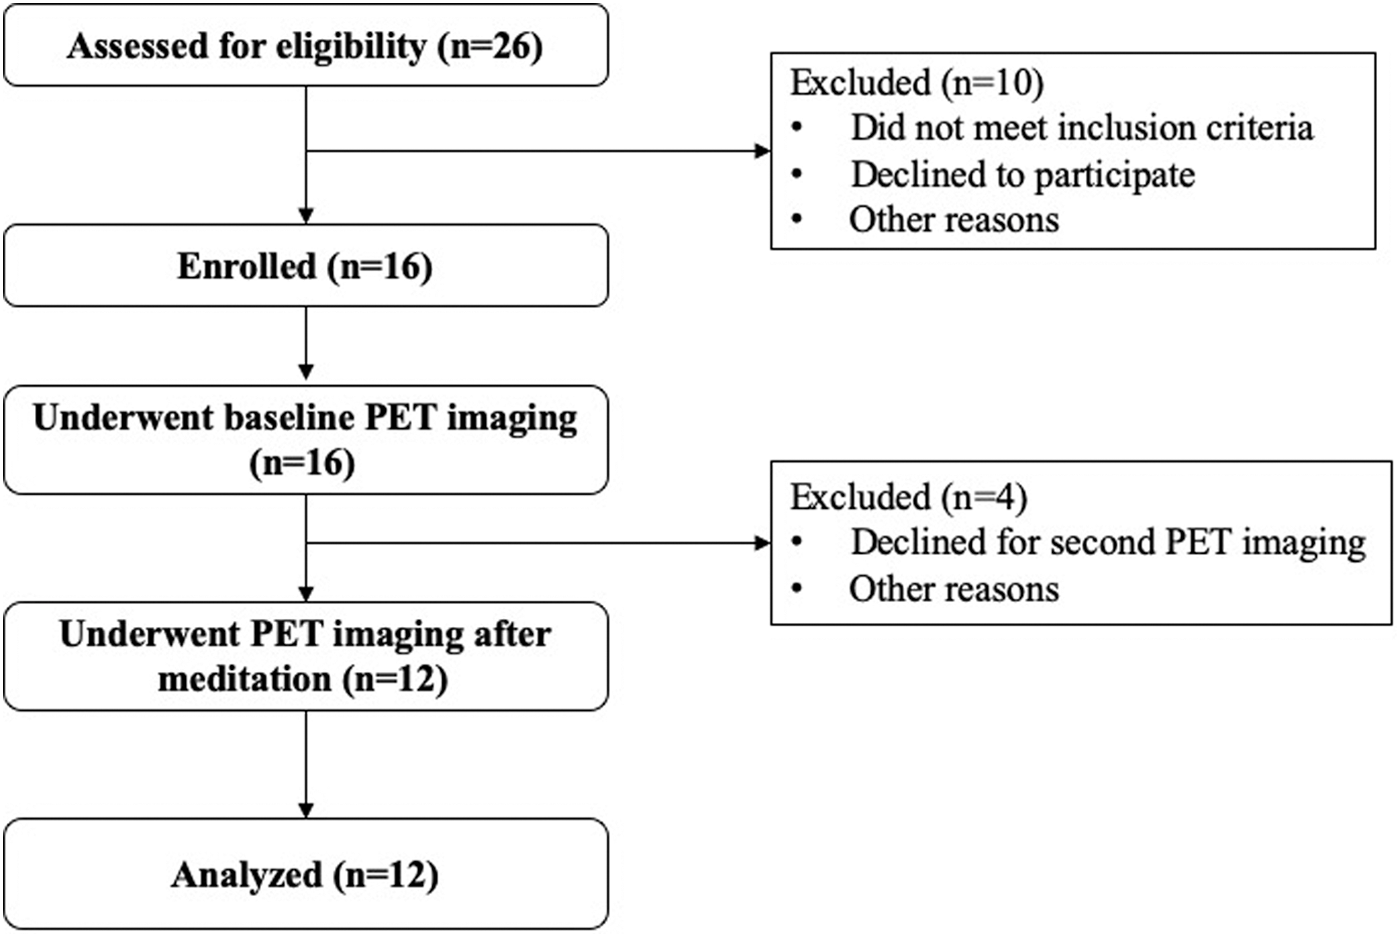
Subject flowchart.
Baseline Characteristics
All values presented as median (range). The comparisons between groups were made by Mann–Whitney test.
HDL, high-density lipoprotein; LDL, high-density lipoprotein.
The mean 18 FDG uptake values for the whole cortex measured in a slice at the level of the whole brain are given in Figure 3. During meditation, 18 FDG uptake values were greater in seven subjects and lower or equal in the remaining five subjects, but this increase was not statistically significant (p = 0.59). The above findings indicate that 18 FDG uptake values (cerebral glucose metabolism) during baseline as well as during meditation remained unchanged. On the basis of regional brain activation, 47 brain regions were precisely and quantitatively analyzed. Differential 18 FDG uptake, showing hyper- and hypometabolic brain regions, is presented in Tables 2 and 3. Overall, statistically significant laterality indices (Li) were observed during meditation versus baseline for the right parieto-temporal cortex (rPTC; p = 0.001).
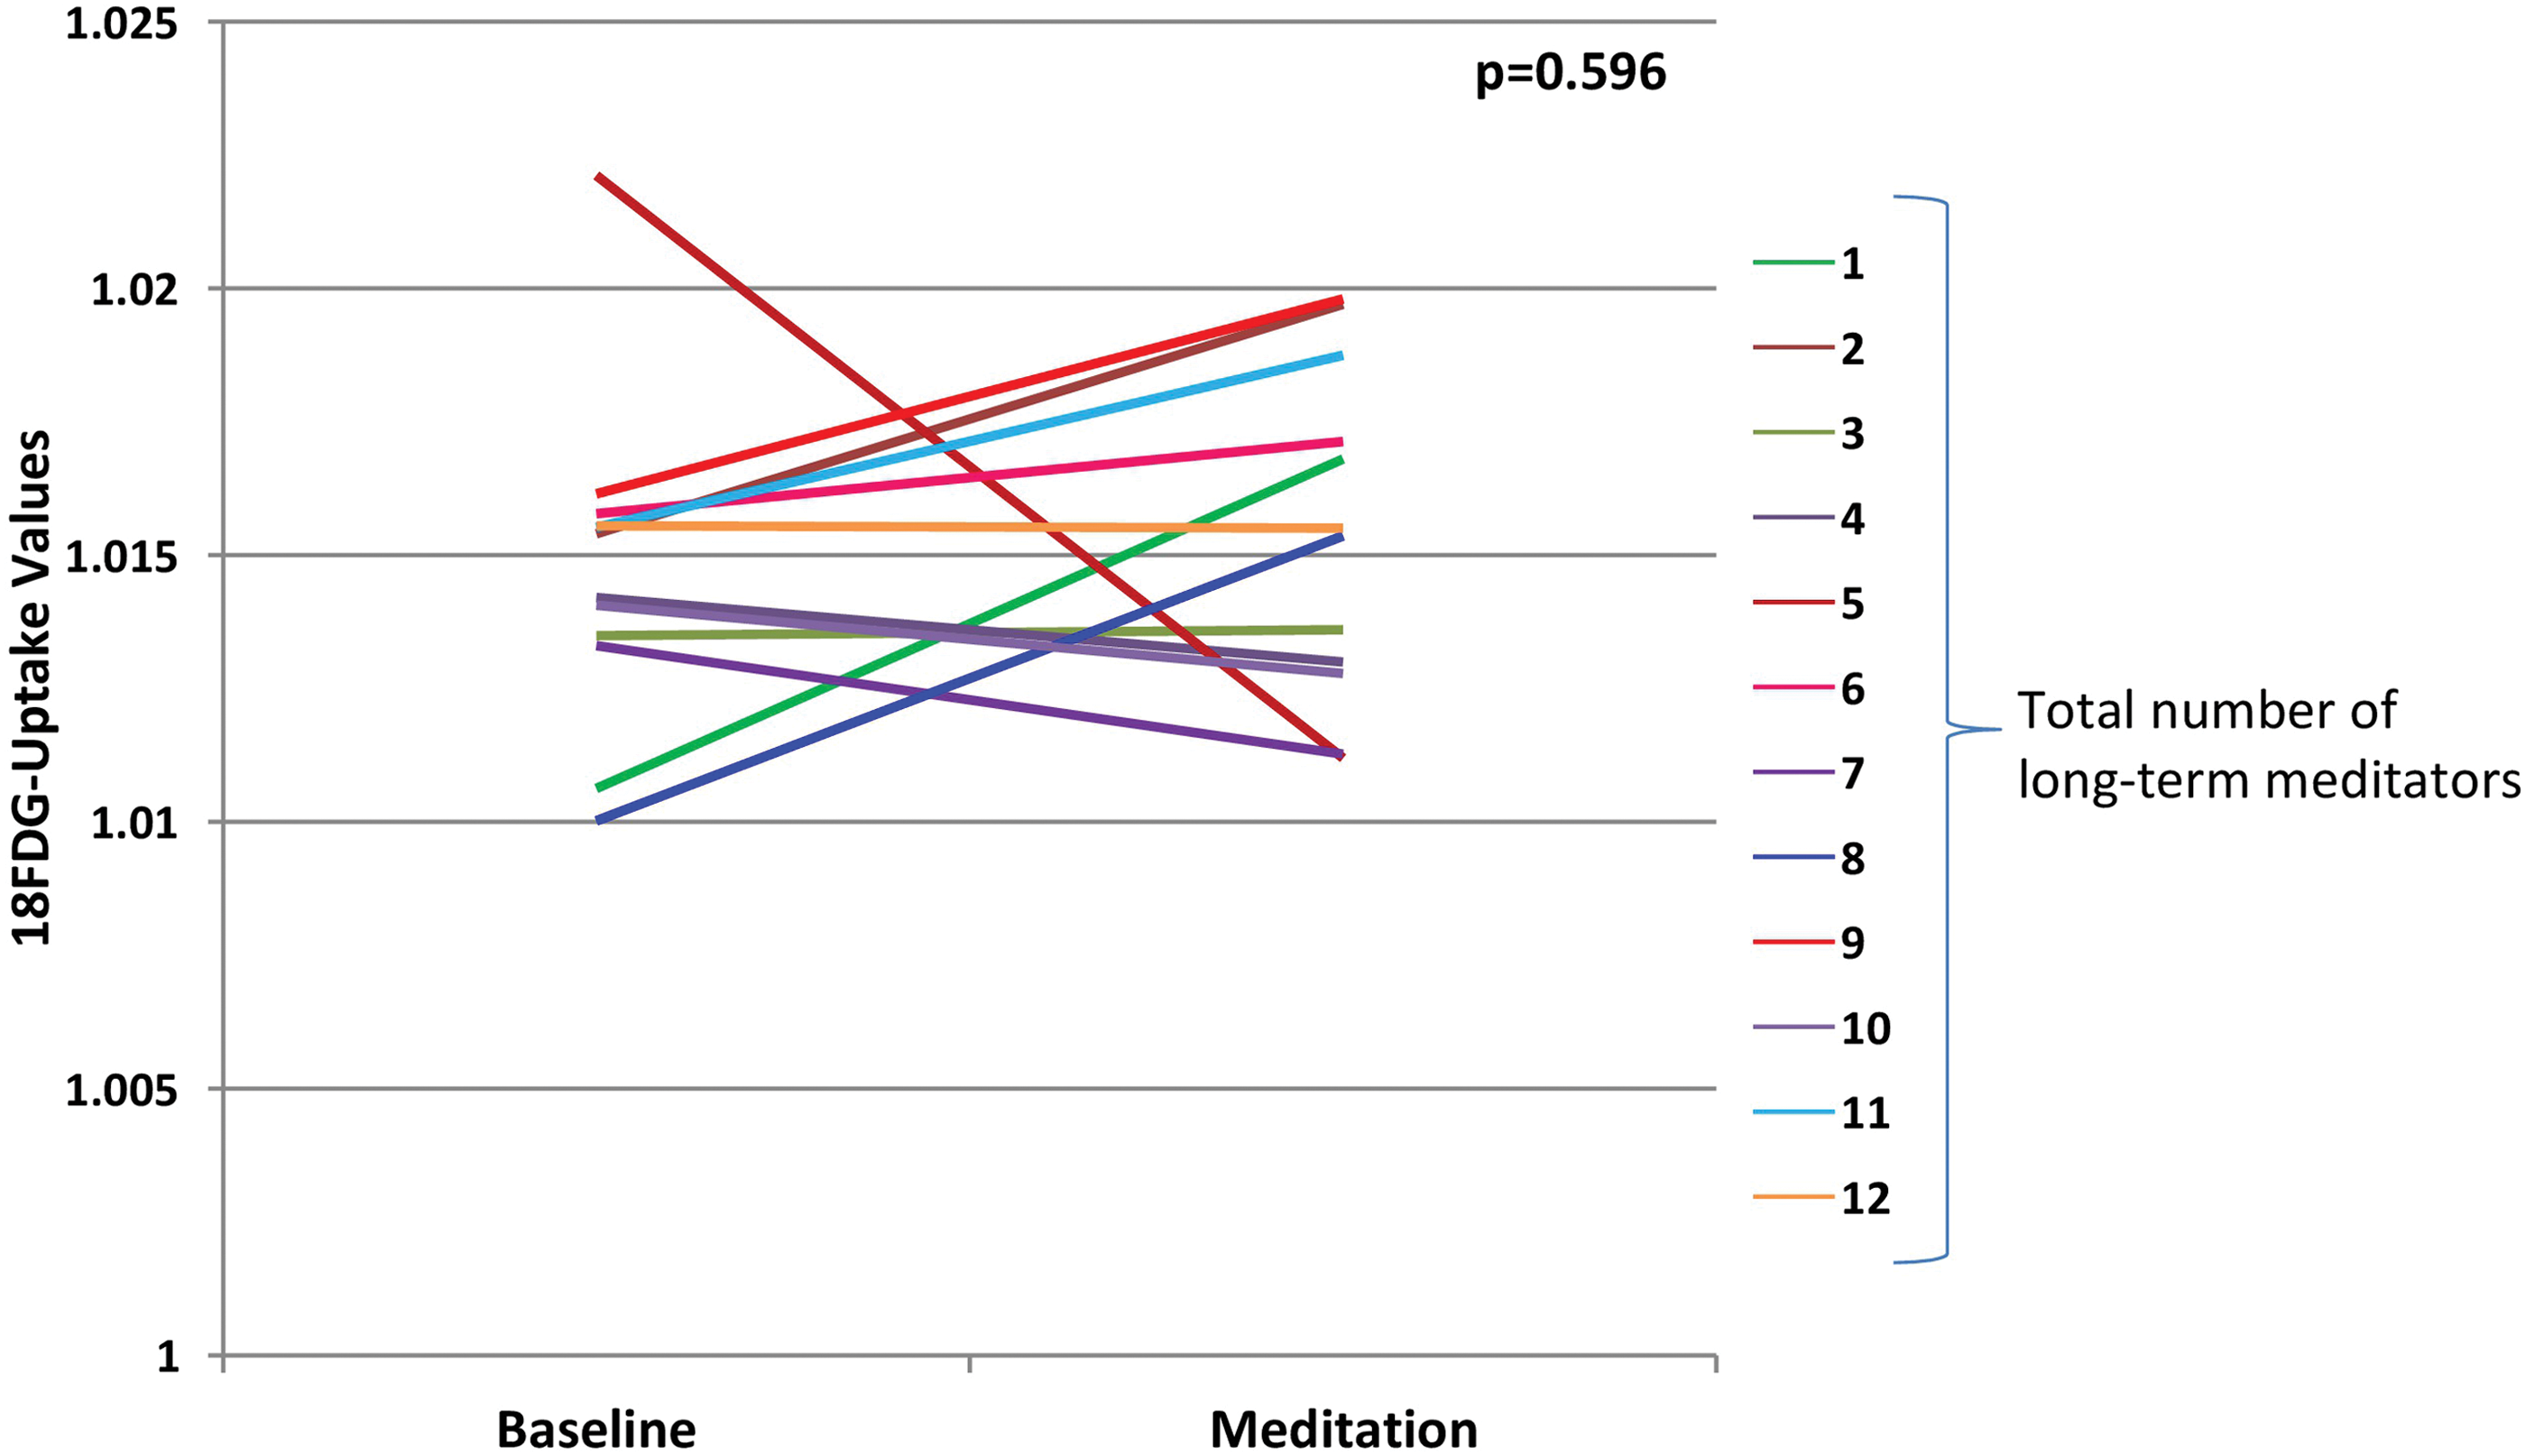
Overall 18 FDG uptake activity for the whole cortex between baseline and meditation for 12 long-term meditators. Color images are available online.
Differences Between Baseline and Meditation 18 Fluorodeoxyglucose Uptake Values Based on Region of Interest: Frontal Regions, Subcortical Nuclei, Parts of Association Areas, and Temporal Regions
Bold indicates significance at p < 0.05.
The comparisons were made by Wilcoxon signed-rank test after Bonferroni corrections in frontal regions (p = 0.003), temporal regions (p = 0.005), subcortical nuclei (p = 0.0125), and parts of association areas (p = 0.025) were statistically significant (assuming an alpha level of 0.05).
FDG, 18 fluorodeoxyglucose; lCN, left caudate nucleus; lGCa, left anterior cingulate gyrus; lGFd, left medial frontal gyrus; lGFm, left mid-frontal gyrus; lGFs, left superior frontal gyrus; liLAT, left inferior lateral anterior temporal; liLPT, left inferior lateral posterior temporal; lLN, left lentiform nucleus; lMAT, left medial anterior temporal; lMPT, left medial posterior temporal; lPCC, left posterior cingulate cortex; lPTC, left parieto-temporal cortex; lsLT, left superior lateral temporal; rCN, right caudate nucleus; rGFd, right medial frontal gyrus; rGFi, right inferior frontal gyrus; rGFm, right mid-frontal gyrus; rGFs, right superior frontal gyrus; riLAT, right inferior lateral anterior temporal; riLPT, right inferior lateral posterior temporal; rLN, right lentiform nucleus; rMAT, right medial anterior temporal; rMPT, right medial posterior temporal; rPCC, right posterior cingulate cortex; rPTC, right parieto-temporal cortex; rsLT, right superior lateral temporal.
Differences Between Baseline and Meditation 18 Fluorodeoxyglucose Uptake Values Based on Region of Interest: Parietal, Occipital, and Brain Stem Regions
Bold indicates significance at p < 0.05.
Comparisons were made by Wilcoxon signed-rank test after Bonferroni corrections in parietal regions (p = 0.008), temporal regions (p = 0.005), occipital regions (p = 0.0125), and brain stem regions (p = 0.01) were statistically significant (assuming an alpha level of 0.05).
lAVC, left associative visual cortex; lCbm, left cerebellum; liPL, left inferior parietal lobe; lPVC, left primary visual cortex; lSM, left sensorimotor cortex; lsPL, left superior parietal lobe; rAVC, right associative visual cortex; rCbm, right cerebellum; riPL, right inferior parietal lobe; rPVC, right primary visual cortex; rSM, right sensorimotor cortex; rsPL, right superior parietal lobe.
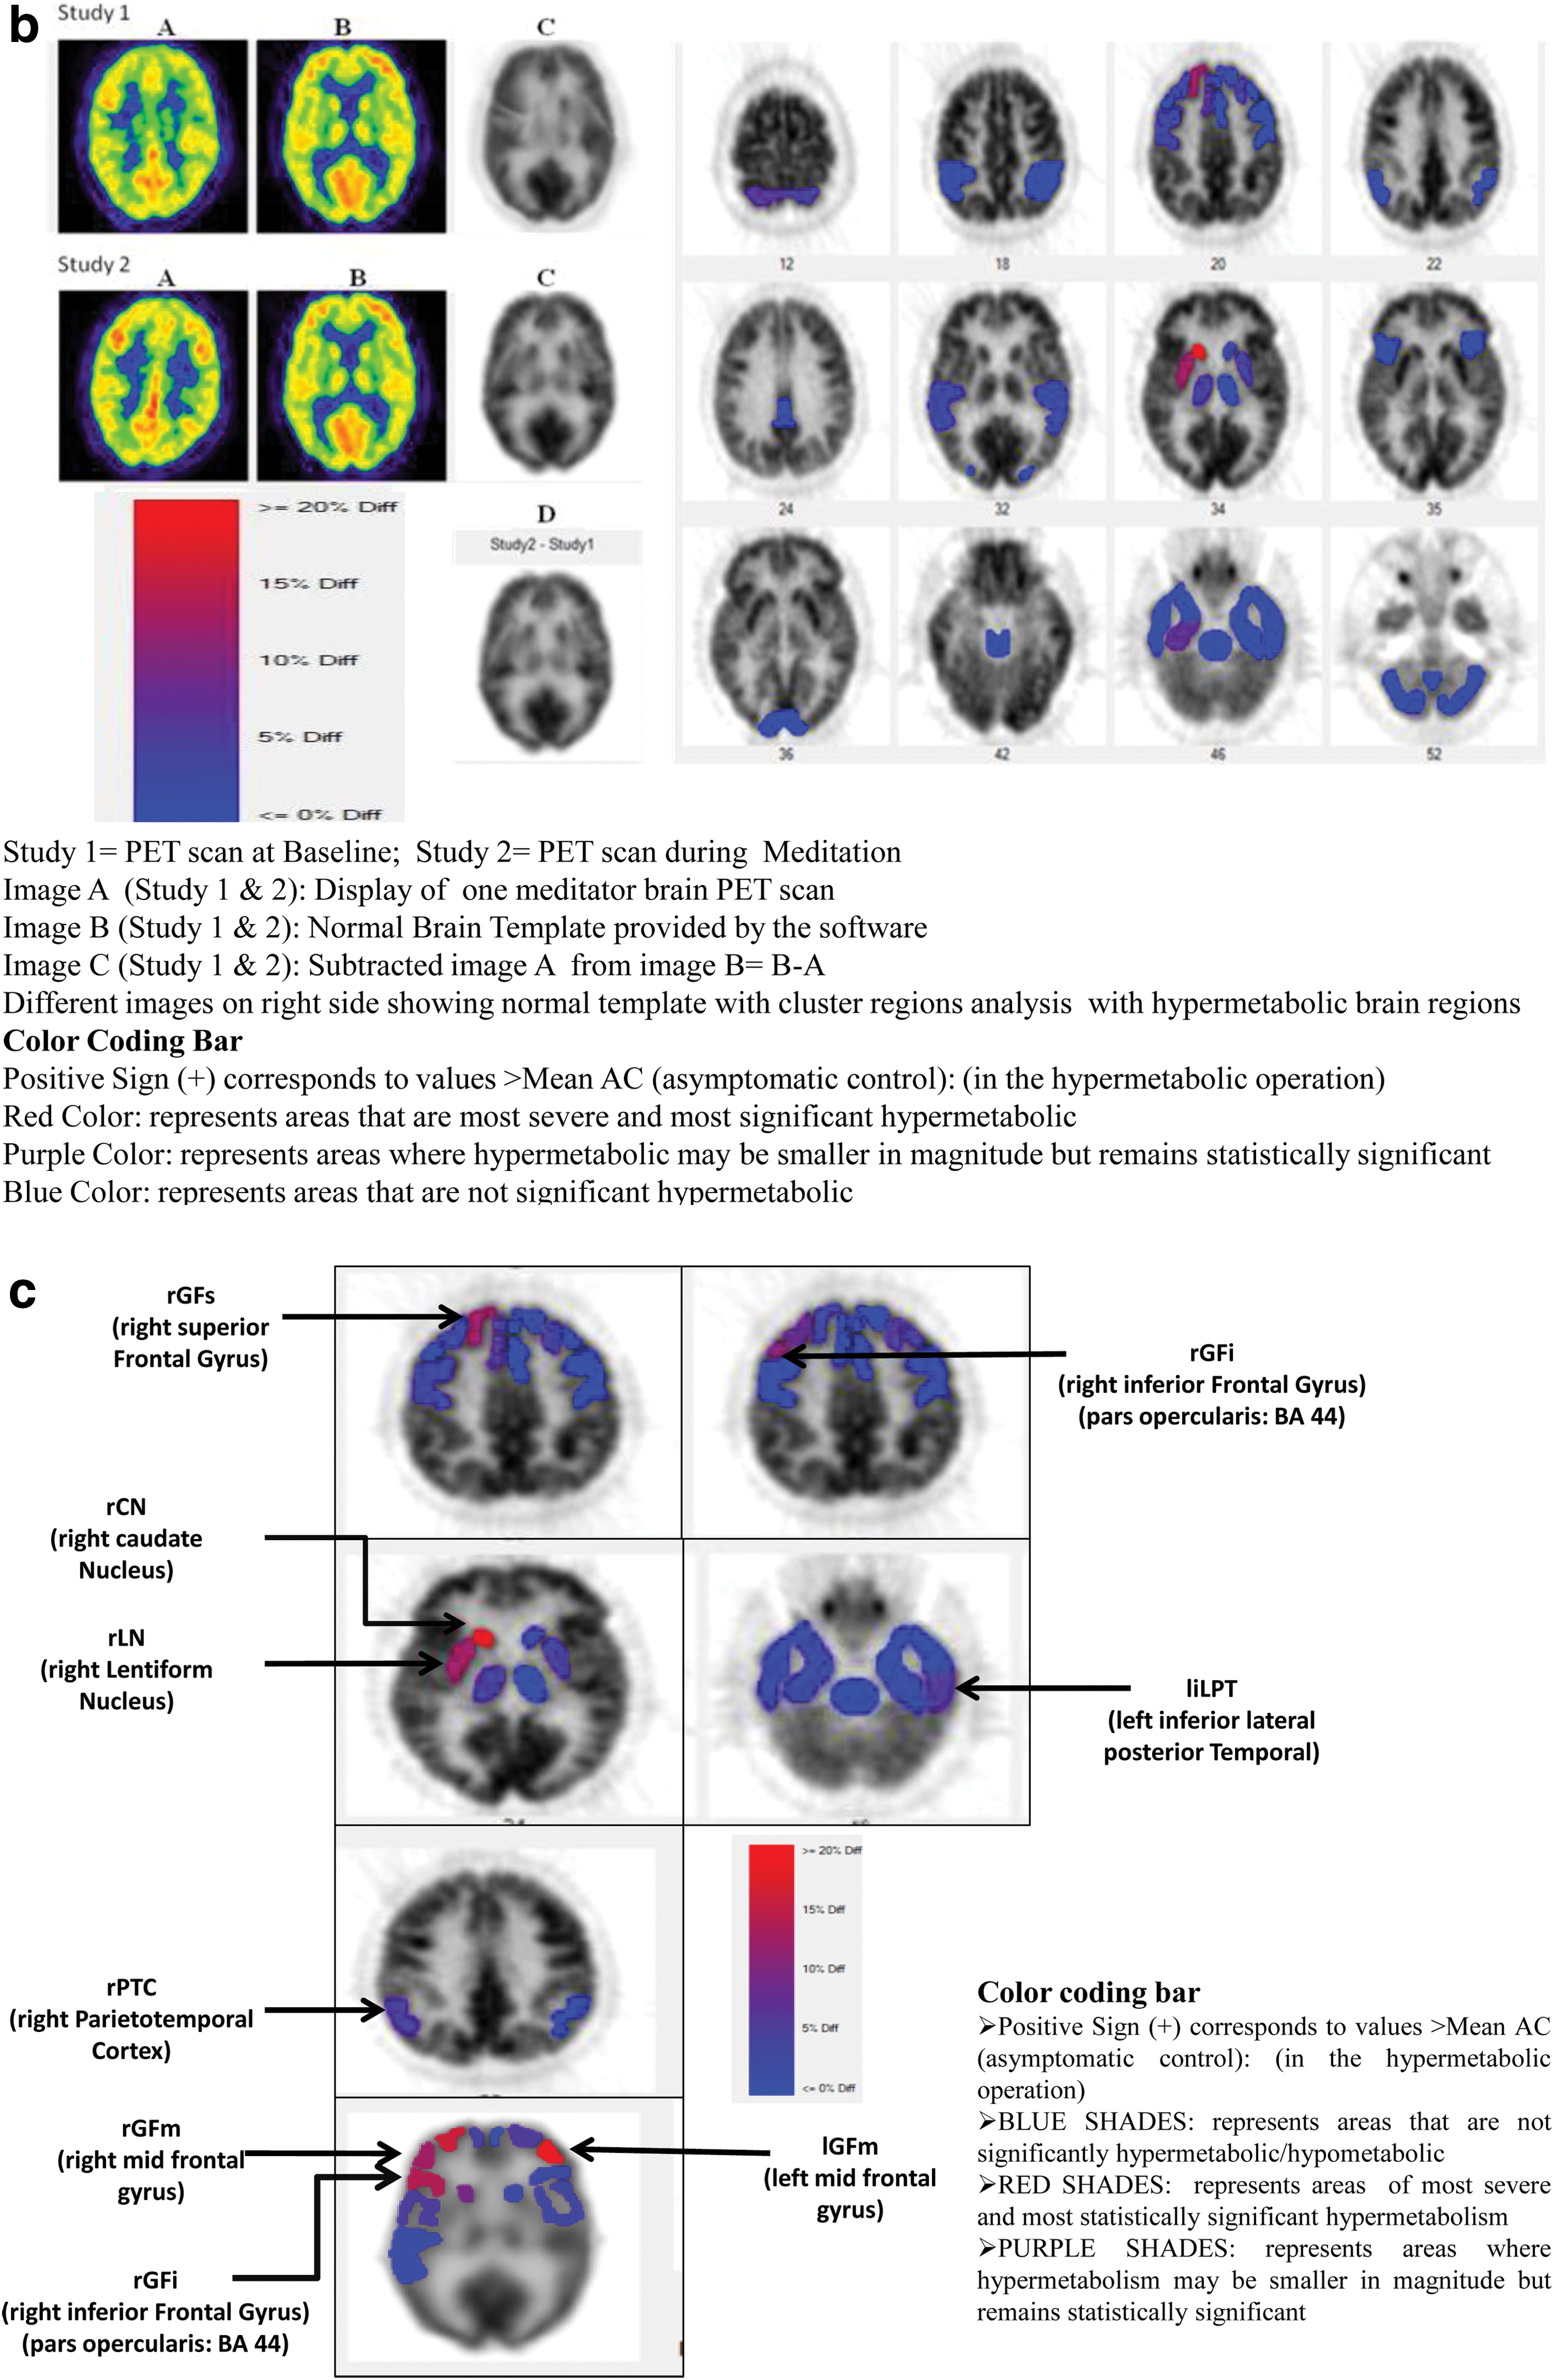
An interesting finding of the study was that the significantly (p = 0.002) hyperactive right homolog of Broca's area was consistently observed in all the 12 subjects during meditation versus the baseline. Another interesting finding was the hyperactive right lentiform nucleus during meditation versus the baseline (p = 0.005) (Table 2). The representative 18 FDG-PET brain scans at baseline and during meditation of three meditators are presented in Figure 4a (showing the different patterns of brain metabolic activity during meditation scan); 18 FDG-PET image analysis of one long-term meditator showing hypermetabolic brain regions is presented in Figure 4b; and regional cluster analysis data showing hypermetabolic brain areas after subtraction of baseline scans with meditation scans for all the long-term meditators are presented in Figure 4c.

Discussion
Neuroimaging studies during meditation have procedural or methodological challenges, and several such limitations were discussed recently by Newberg et al. 5 The key challenge pointed was the choice of imaging technique(s) used for imaging subjects while they are practicing meditation (e.g., inside the MRI scanner) without disturbing them. The present study attempted to minimize some of the major limitations while studying brain activity in long-term meditators, and methods were optimized to maximize precision since subjects remained unperturbed during meditation in a peaceful environment, away from the PET scanner. The meditational state was validated by continuous EEG recording with photic stimulation. In addition, the authors tried to validate the claim of long-term meditation by evaluating levels of stress and inflammation 13 at baseline since yoga and meditation might reduce stress and inflammation even in a short duration of time, as shown in previous studies. 10 –13
In the present study, long-term meditators had significantly distinct patterns of 18 FDG uptake during meditation compared with the baseline. Long-term meditation seems to be associated with a higher 18 FDG uptake activity in the frontal regions, particularly the prefrontal cortex, 1 –4 while other studies reported changes in subcortical structures such as the amygdala or striatum. 22,23 The authors noted a significantly activated well-defined area of the prefrontal cortex, including the right mid-frontal gyrus (rGFm), and right Broca's area. The rGFm is involved in reorienting of attention, and lesioning in this area reduces the impact of attention and working memory. 24 Therefore, sustained hyperactivation of the right medial frontal gyrus and rGFm by meditation might help an individual to develop the ability for perceptual awareness, the main component of Preksha meditation.
Present findings also showed significantly increased 18 FDG uptake in right homolog of Broca's area during meditation in all the meditators, who were essentially right-handed. There was only a subtle increase in the activity of left Broca's area. Broca's area, conventionally located in the left (categorical) hemisphere of the brain, is responsible for speech and language tasks. 25,26 However, one cannot comment on the possible impact of meditation on the right homolog of Broca's area as its functionality remains partly understood and explored. Nevertheless, this is an interesting finding and might have some clinical utility in patients with damage to the left brain, which is the dominant or categorical hemisphere in 96% of right-handed individuals who constitute 91% of the human population. 27 This could be of interest as adults have limited plasticity of brain, that is, they suffer permanent damage to language and speech tasks if the left brain is removed, while infants learn to speak fluently even if the left brain is removed or damaged. 28,29 This indicates that it is the training that activates and increases functionality of the right brain, possibly engaging the corresponding right Broca's area with unknown, but important, functionality.
The ROI analysis in the present study showed that parietal cortex activity was decreased, although statistically nonsignificant, which is in line with other studies. 2,4 Another study showed increased superior parietal lobe activity during baseline in experienced meditators versus controls. 1 Importantly, the increased activity in the prefrontal cortex and decreased activity in the parietal cortex indicate that blood flow is directed toward attentional network areas from the parietal cortex. The results of this study also support the fact that meditation has a specific goal of reducing external distractions, including visual stimuli, as shown by a decrease in 18 FDG uptake during meditation in occipital regions. Similar results were shown in other studies where decreased activity was observed in occipital regions. 4,30 This is pertinent because during meditation there is sensory attenuation, which the authors tried to confirm in their study by photic stimulation during EEG recording.
We observed that an increased 18 FDG uptake in the rPTC, associated with processing of information in terms of the ability of an individual to pay attention, was also hyperactive during meditation. It increases self-awareness and feeling of compassion in meditators. 31 Similar results were reported 32 using fMRI, but another study 30 showed decreased activity in parieto-temporal gyri. The authors also observed significantly increased activation in the right lentiform nucleus during meditation, associated with regulation of attentional circuits and motor activity. 31 Similar results have been reported previously, where there was increased activation of the lentiform nucleus during an attentional task, 33 indicative of a higher activation level following meditation.
The laterality index (Li) was significantly increased for the parieto-temporal cortex involved in attentional and emotional regulation. Interestingly, for this region, the right hemisphere showed greater activation versus the left hemisphere during meditation, although all the long-term meditators were right-handed. Previous study showed thalamic laterality toward the left side in 7 of 12 advanced meditators at baseline. 1
The observations of the present study are highly valuable due to following strengths. First, in the methodological notions study, the authors could successfully image 12 apparently healthy long-term meditators at 2 different occasions in spite of procedural complexities associated with 18 FDG-PET scanning. Second, the authors could objectively document meditation using EEG, which was done in a quiet environment, away from the PET scanner, and the images were reflective of real-time meditation by virtue of the window period available between 18 FDG injection and PET scanning. Additionally, the authors tried to verify the claim of long-term practice of meditation based on baseline levels of biomarkers of stress and inflammation. 13
Conclusions
The results of the current study are encouraging and show a novel methodological approach to acquire 18 FDG PET/CT images and EEG recording during meditation in a relatively peaceful environment, ruling out the artifacts. Future recommendation is to recruit an equal number of right- and left-handed meditators and female meditators for increasing the generalizability of results. In addition, neurotransmitters involved in these brain activities may be assessed to further strengthen the neural correlates of meditation.
Footnotes
Acknowledgments
The authors are grateful to Dr. S.C. Mahapatra (Head, Department of Physiology, AIIMS, Bhubaneswar, India), Dr. A. Malhotra (Ex Head, Department of Nuclear Medicine and Positron Emission Tomography, AIIMS, New Delhi, India), Ms. Sanjana (PhD Scholar), and other technical staff members for their contribution and support to carry out PET scans at the Department of Nuclear Medicine and Positron Emission Tomography, AIIMS, New Delhi, India.
Author Contributions
D.M. was involved in study conduct and acquiring, analyzing, and interpreting data and contributed in writing the manuscript; C.S.B. was involved in study design, PET imaging of subjects, and neuroimaging analysis; R.K.Y. was involved in study conceptualization, study design, data analysis, data interpretation, writing of the manuscript, and approving the final content of the manuscript; R.M. was involved in data interpretation and manuscript review; and R.M.P. was involved in data analysis and data interpretation.
Author Disclosure Statement
No competing financial interests exist for any of the authors.
Funding Information
The authors are thankful to the Department of Biotechnology (DBT, BT/PR10269/GBD/27/82/2007), New Delhi, for granting financial support for successfully completing the study.