




Abstract
Cell-monolayer-based assays for chemotherapeutic drug discovery have proven to be highly artificial compared with physiological systems. The objective of this study was to culture cancer cells in a simple 3-dimensional (3D) collagen gel model to study the antiproliferative activity of known lung cancer drugs. The validity of our 3D model was tested by measuring the activity of 10 lung cancer drugs (Paclitaxel, Alimta, Zactima, Doxorubicin, Vinorelbine, Gemcitabine, 17AAg, Cisplatin, and 2 experimental drugs from the University of Kansas [KU174 and KU363]) in 2 lung cancer cell lines (A549 and H358) and comparing the activity in a traditional 2-dimensional (2D) in vitro cellular assay. Both potency and efficacy of these drugs were calculated to evaluate the activity of the drugs. Our results demonstrate that the activity of these drugs showed significant differences when tested in 3D cultures, which varied with individual drugs and the cell line used for testing. For example, the cytotoxicity of Paclitaxel, KU174, Alimta, Zacitma, Doxorubicin, Vinorelbine, KU363, and 17AAg was significantly changed when tested in the 3D model, whereas the potency of Cisplatin and Gemcitabine in H358 cell line remained unaffected. A similar pattern, with some differences, was observed in A549 cells and is discussed in detail in this article. The observed differences in potency and efficacy of the cancer drugs in 3D models suggest that the biological implications of screening configurations should be taken into account to select superior cancer drug candidates in preclinical studies.
Introduction
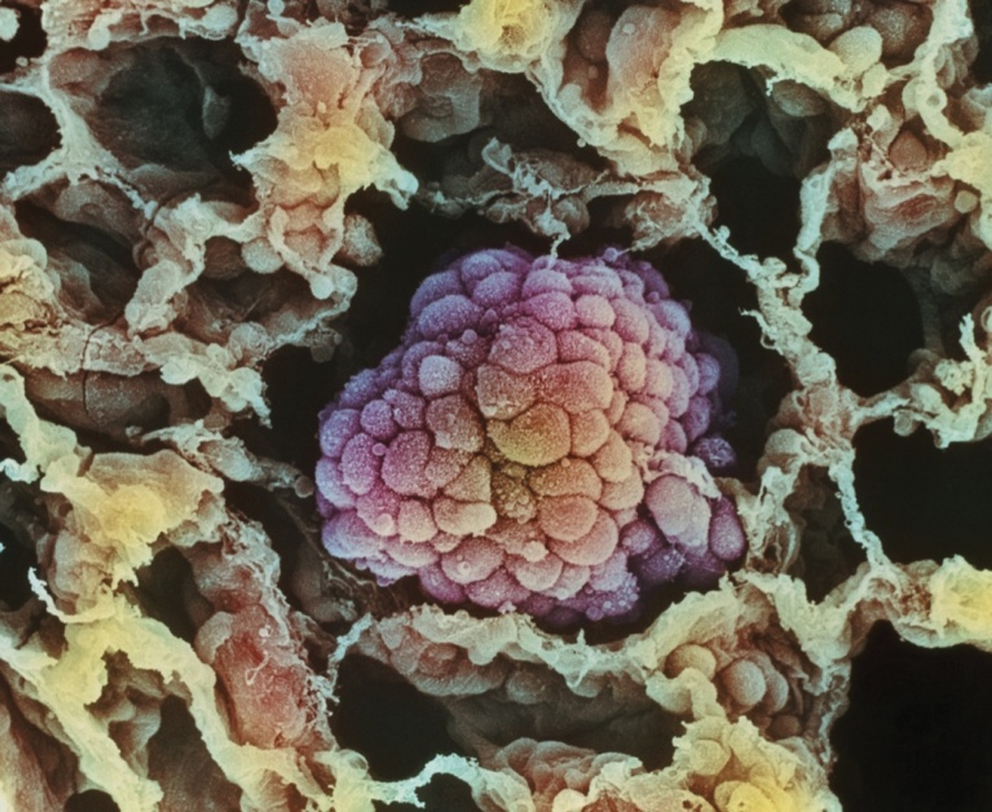
A scanning electron micrograph image showing the 3-dimensional nature of a small cancerous tumor within a human lung. Credit: © Moredun Scientific/Photo Researchers, Inc. Color images available online at
To closely mimic the in vivo behavior of normal or cancerous human tissue, a 3D model needs to be used. 4,6 –10 Although 3D cultures of lung cancer cells have been used to study various aspects of tumorigenesis and tumor progression, 6,11 to the best of our knowledge, these models have yet to be used to screen new lung cancer drugs. Using a 3D tumor model as a strategy to test NMEs is more physiologically relevant than the traditional 2D cell culture environment in HTS assays. 12 Screening NMEs in 3D tissue models has the potential to be more efficient in identifying lead chemical hits with a much higher success rate than the current paradigm (5 out of 5,000 compounds becoming approved drugs 13 ). A contributing factor to the extremely high cost of the current drug discovery and development process (∼$1.2 to 1.3 billion to launch a new drug into the market 14 ) could be attributed to the inefficiency and low predictability of 2D in vitro models.
We hypothesize that testing NMEs in 3D systems will better simulate the microenvironment and signaling pathways that are functional in tissues and organs, and would potentially provide better connectivity between in vitro screening and in vivo animal models. It is particularly important to grow cancer cells as 3D cultures since certain aspects of tumorigenesis and tumor progression can only be accurately mimicked in 3D models (Fig. 1). For example, 3D matrix induces Par6/aPKC association with the ErbB2 dimer, which results in loss of acinar polarity, internal matrix production, and deregulated cell growth associated with tumor progression. 15,16 In addition, alteration in acinar morphology associated with tumorigenesis due to increased β1-integrin activity is only detected in 3D models. 17 It is possible that certain molecular pathways are activated only when they receive specific cues from 3D ECM. A particular case in point is that of special AT-rich sequence-binding protein-1 (SATB1) expression in human mammary epithelial cells grown on plastic or the 3D hydrogel, Matrigel. 18 Depending on the culture conditions, a different gene expression pattern is activated by this genome organizing protein that is a master gene in breast cancer when cells are grown in Matrigel, implying that the epigenetics of the matrix environment also affect cell phenotype. 18 Branching morphogenesis, a process essential for the formation of glands and organs, including mammary glands, lungs, and blood vessels, is a unique characteristic of breast and lung tumors. 18 Studies show that branching morphogenesis and blood vessel formation are only induced in 3D cellular environments. 19 Only a few studies have demonstrated the feasibility of developing 3D tissue models using human glioma, 20 colon, 21 and breast 22 cancer cell lines for evaluating anticancer drugs, but little effort has been taken to utilize 3D cellular models to screen lung cancer drugs.
In this study, we investigated a 3D tissue model system using lung cancer cell lines to screen lung cancer drugs. Our 3D tissue model was developed by suspending lung cancer cells in an appropriate concentration of rat tail type I collagen gel. This system is unique because it takes the third dimension into consideration in the drug screening. The objective of this study was to compare the potency and efficacy of a series of lung cancer drugs in 2D and 3D screening system to determine if significant antiproliferative differences exist in the screening strategies. We hypothesize that, depending on the signaling pathway modulated by the drug, there will be an increase or decrease in the potency of the drug when screened in the 2D and 3D systems. We believe that 3D screening systems are more predictive and physiologically relevant and will, ultimately, contribute to improving the success rate of cancer drug candidates in preclinical studies and clinical trials.
Materials and Methods
Experimental Design
Three-dimensional tissue models were created using 2 established lung cancer cell lines, bronchioalveolar carcinoma (NCI-H358) and epithelial lung carcinoma (A549). Cells were seeded at a density of 30,000 cells per well in type I collagen in each well of a 96-well plate. Type I collagen gel (rat tail) was used to grow the cells as 3D culture to more accurately represent the physiology of lung tumor cells in vivo. 23 We used two 2D control groups to compare the 3D system. In the first control group (2D-5K), cells were cultured as a monolayer (2D) at a seeding density of 5,000 cells per well in a 96-well plate. The seeding density of 5,000 cell per well was chosen since it has been used as a standard seeding density in our laboratory for the 2 selected cell lines. The seeding density of 30,000 cells per well for the 3D system was calculated so as to account for the increased cell number in the 3D system due the third dimension. To eliminate the possibility that the observed differences between the 3D system and the first control group (2D-5K) are not due to the difference in the seeding densities, we included a second control group in this study. The second control group (2D-30K) consists of cells cultured as a monolayer (2D) at a seeding density of 30,000 cells per well in a 24-well plate. All 3 groups were treated with 10 different anticancer drugs that were chosen because they represent a range of mechanisms (Table 1): Paclitaxel, Alimta, Zactima, Doxorubicin, Vinorelbine, Gemcitabine, 17AAg, Cisplatin, and 2 experimental drugs from the University of Kansas (KU174 and KU363). The potency (IC50 value) and the efficacy (area under the dose–response curve) of each drug were used as the response measures to compare the 3 treatment groups. The IC50 is defined as the concentration of drug at which 50% of the cells are inhibited by the drug, whereas area under the curve (AUC) defines the efficacy of the drug.
The Mechanism of Action for Each Drug and the Starting Concentrations for the Dose–Response Experiment
Materials
The lung cancer cell lines, bronchioalveolar carcinoma (NCI-H358) and epithelial lung carcinoma (A549), were obtained from American Type Culture Collection (Manassas, VA). The H358 and A549 cells were grown in RPMI1640 (Sigma Aldrich, St. Louis, MO) and Ham's F12K (Mediatech, Manassas, VA) media, respectively, and supplemented with 10% fetal bovine serum (FBS; Sigma Aldrich) and penicillin/streptomycin (100 IU/mL/100 μg/mL; Invitrogen, Inc., Carlsbad, CA). The 3D group and 2D-5K control group were plated in 96-well plates (TPP, Trasadingen, Switzerland) and 2D-30K control group was plated in 24-well plates (TPP). The 3D group was plated in type I rat tail collagen (BD Biosciences, San Jose, CA) and supplemented with 10× phosphate-buffered saline (PBS; Gibco, Carlsbad, CA), NaOH (Acros Organics, Geel, Belgium), FBS, and dH2O. The anticancer drugs Paclitaxel, Doxorubicin, Cisplatin, Alimta, Vinorelbine, 17AAg (Sigma Aldrich), Zactima (LC Laboratories, Woburn, MA), Gemcitabine (Axxora LLC, San Diego, CA), KU174, and KU363 (University of Kansas, Lawrence, KS) were tested in all 3 treatment groups. All drugs were dissolved in 100% dimethyl sulfoxide (DMSO; Sigma Aldrich). CellTiter 96 AQuesous One Solution Cell Proliferation Reagent (Promega, Madison, WI) was used to measure the antiproliferative effects of the drugs.
Cell Culture
The H358 and A549 lung cancer cells lines were cultured in RPMI1640 and Ham's F12K media, respectively, with 10% FBS and penicillin/streptomycin (100 IU/mL/100 μg/mL). Both cell lines were grown for 48 h at 37°C in 5% CO2 until they achieved 85% confluency. The cells were trypsinized using trypLE (Invitrogen, Inc.) and passaged into 2 T-75 flasks at a density of 1 × 10⁶ cells per flask and grown for 48 h till they reach 85% confluency. On the day of experiments, cells were trypsinized and counted using a Vi-Cell (Beckman Coulter, Fullerton, CA) to determine the number of viable cells. The number of cells needed for the first and second control groups were directly plated in 96-well plates and 24-well plates, respectively. The cells assigned for 3D culture were combined with collagen and plated in 96-well plates.
Generation of 3D Collagen Cultures
The cells were grown as 3D cultures in type I rat tail collagen (BD Biosciences, San Jose, CA). Briefly, to adjust the pH and reach a final concentration of 3 mg/mL of collagen, appropriate amounts of 10 × PBS, NaOH, and dH2O were added to collagen before adding the cells. To complete the 3D culture, 10% FBS and 20% media with cells are added to 70% of the collagen mixture. The collagen mixture is then plated into each well of a 96-well plate. Once the collagen solidified, the respective medium is added to each well.
Drug Treatment
To be consistent with other screening experiments in our laboratory, cells were allowed to proliferate for 48 h before drugs were added in the experimental group and in the 2 control groups. The drugs were dissolved in DMSO at various stock concentrations that are dependent of each drug: 20 mM (KU174, KU363, Zactima, Alimta, Gemcitabine, and Vinorelbine), 10 mM (Cisplatin, Doxorubicin, and 17AAg), and 1 mM (Paclitaxel). Serial dilutions were prepared at a ratio of 1:3 to create a dose–response drug plate. The cells were exposed to the drugs for 72 h. The initial concentration for each drug varied from drug to drug (Table 1). Each experiment was repeated 3 times on separate days with appropriate controls (media only, untreated cells and cells treated with the vehicle, DMSO, for 2D groups; and collagen and media only, untreated cells and cells treated with DMSO for 3D group).
Antiproliferation Assay
The CellTiter 96 AQueous One Solution Cell Proliferation Reagent (Promega) was used according to manufacturer's protocol. Briefly, cell proliferation was measured by bioreduction of a tetrazolium (MTS) dye to a formazan by-product, which corresponds directly to viable cell number. After the 72 h time point, the plates were analyzed on a plate reader (Synergy 4; BioTek Instruments Inc., Winooski, VT) at an absorbance wavelength of 490 nM. Data were analyzed from 3 independent experiments performed in duplicate by normalizing to absorbance of wells containing media only (0%) and untreated cells (100%). Nonlinear regression and sigmoidal dose–response curves (GraphPad Prism, La Jolla, CA) were used to calculate IC50 values. The AUC was determined using data points bounded by the highest and lowest concentrations and the highest and lowest percent viability for each curve. AUC was calculated using the trapazoid rule by GraphPad Prism 5 software before normalizing the data.
Statistical Analysis
The IC50 value and efficacy of each drug were compared using 1-way analysis of variance (ANOVA) across the 3 treatment groups, 3D, 2D-5K, and 2D-30K. To determine the statistical significance between 3D and 2D-5K, 3D and 2D-30K, and 2D-5K and 2D-30K groups, post-hoc testing was conducted using Bonferroni adjustments. 24 Residuals were tested for normality and homoscedasticity and found to satisfy these criteria at a 5% level of significance. All conclusions regarding the significance of different treatments were made at P < 0.05.
Results
For both the H358 and A549 cell lines, the IC50 and AUC values were determined and reflect the potency and efficacy, respectively, of the drugs examined in the antiproliferative assay between 2D and 3D treatment groups. The potency and efficacy values for Paclitaxel, KU174, Alimta, Zactima, Doxorubicin, Vinorelbine, KU363, Gemcitabine, 17AAg, and Cisplatin are listed in Tables 2 and 3, respectively. Cells grown in 3D collagen gel demonstrated a spherical morphology (Fig. 2), which could be a reason for the change in potency between groups.
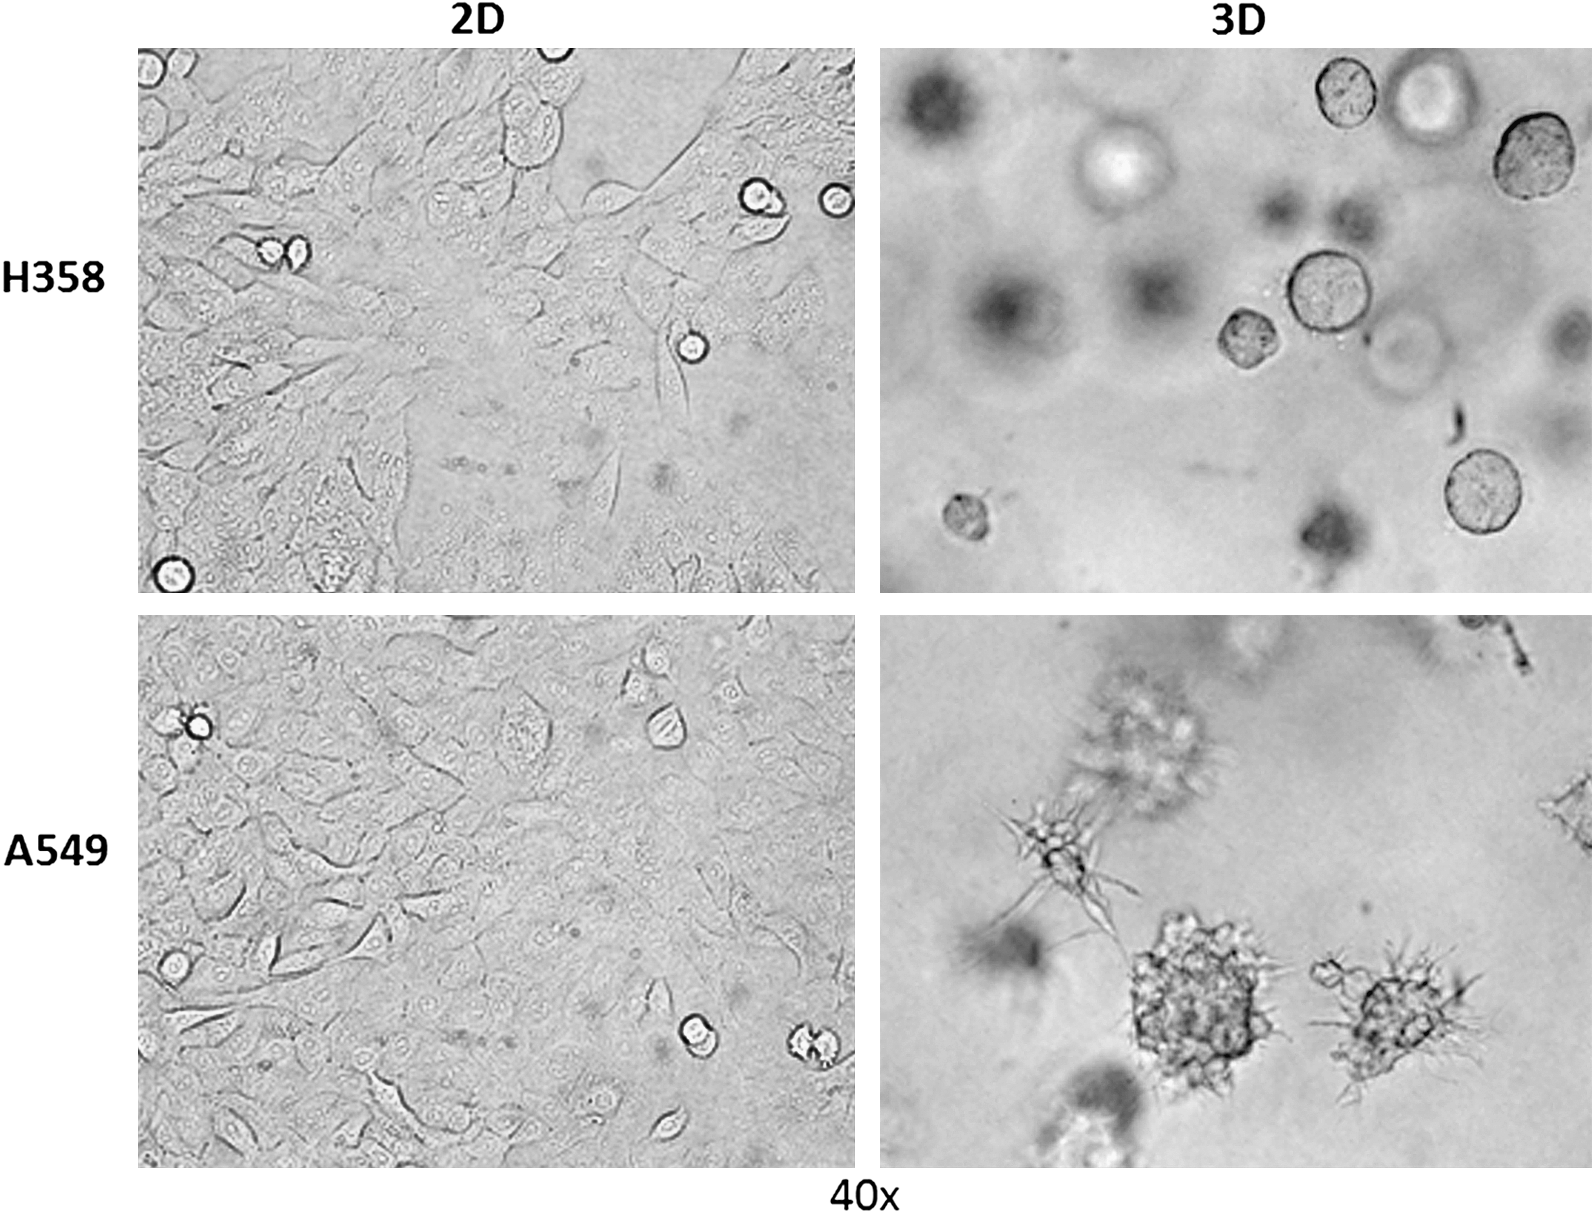
Confocal images of H358 and A549 cells in 2D and 3D at 40 × magnification show more spherical morphology of the cells in 3D and a flat monolayer morphology in 2D.
IC50 Values (Mean ± Standard Deviation μM) of the Tested Drugs in 2-Dimensional and 3-Dimensional Cultures of Both Cells Lines
3D, 3-dimensional; 2D, 2-dimensional.
Area-Under-the-Curve Values (Mean ± Standard Deviation) of the Tested Drugs in 2-Dimensional and 3-Dimensional Cultures of Both Cell Lines
Antiproliferative Effects of Chemotherapy in H358 Lung Cancer Cells
Upon close examination of the data, 1-way ANOVA detected highly significant difference across the treatment groups in the IC50 value for 8 of the 10 drugs tested. Paclitaxel (P = 0.0069), KU174 (P = 0.0024), Alimta (P = 0.021) (Figure 3), Zactima (P = 0.001), and 17AAg (P < 0.0001) showed a decrease in potency in 3D compared with 2D. However, Doxorubicin (P = 0.0031), Vinorelbine (P = 0.007) (Figure 3), and KU363 (P = 0.0005) showed an increase in potency in 3D compared with 2D. Cisplatin and Gemcitabine (Figure 3) did not show a significant difference (P > 0.05). Bonferroni multiple comparisons demonstrated significant differences in the IC50 values between 3D and 2D-5K treatment groups for Paclitaxel, KU174, Alimta, Zactima, Doxorubicin, Vinorelbine, 17AAg, and KU363 (P < 0.05) (Tables 2 and 4). Similarly, significant differences were found in IC50 values between 3D and 2D-30K treatment groups for Paclitaxel, KU174, Alimta, Zactima, Doxorubicin, Vinorelbine, 17AAg, and KU363 (P < 0.05) (Tables 2 and 4). Surprisingly, no difference in IC50 values were detected across the treatment groups or between any of the multiple comparisons for Cisplatin (P = 0.122) and Gemcitabine (P = 0.2702) (Tables 2 and 3). No differences were detected in the IC50 values between the 2 control groups, 2D-5K and 2D-30K, for any of the drugs at 5% significance level (Tables 2 and 4).
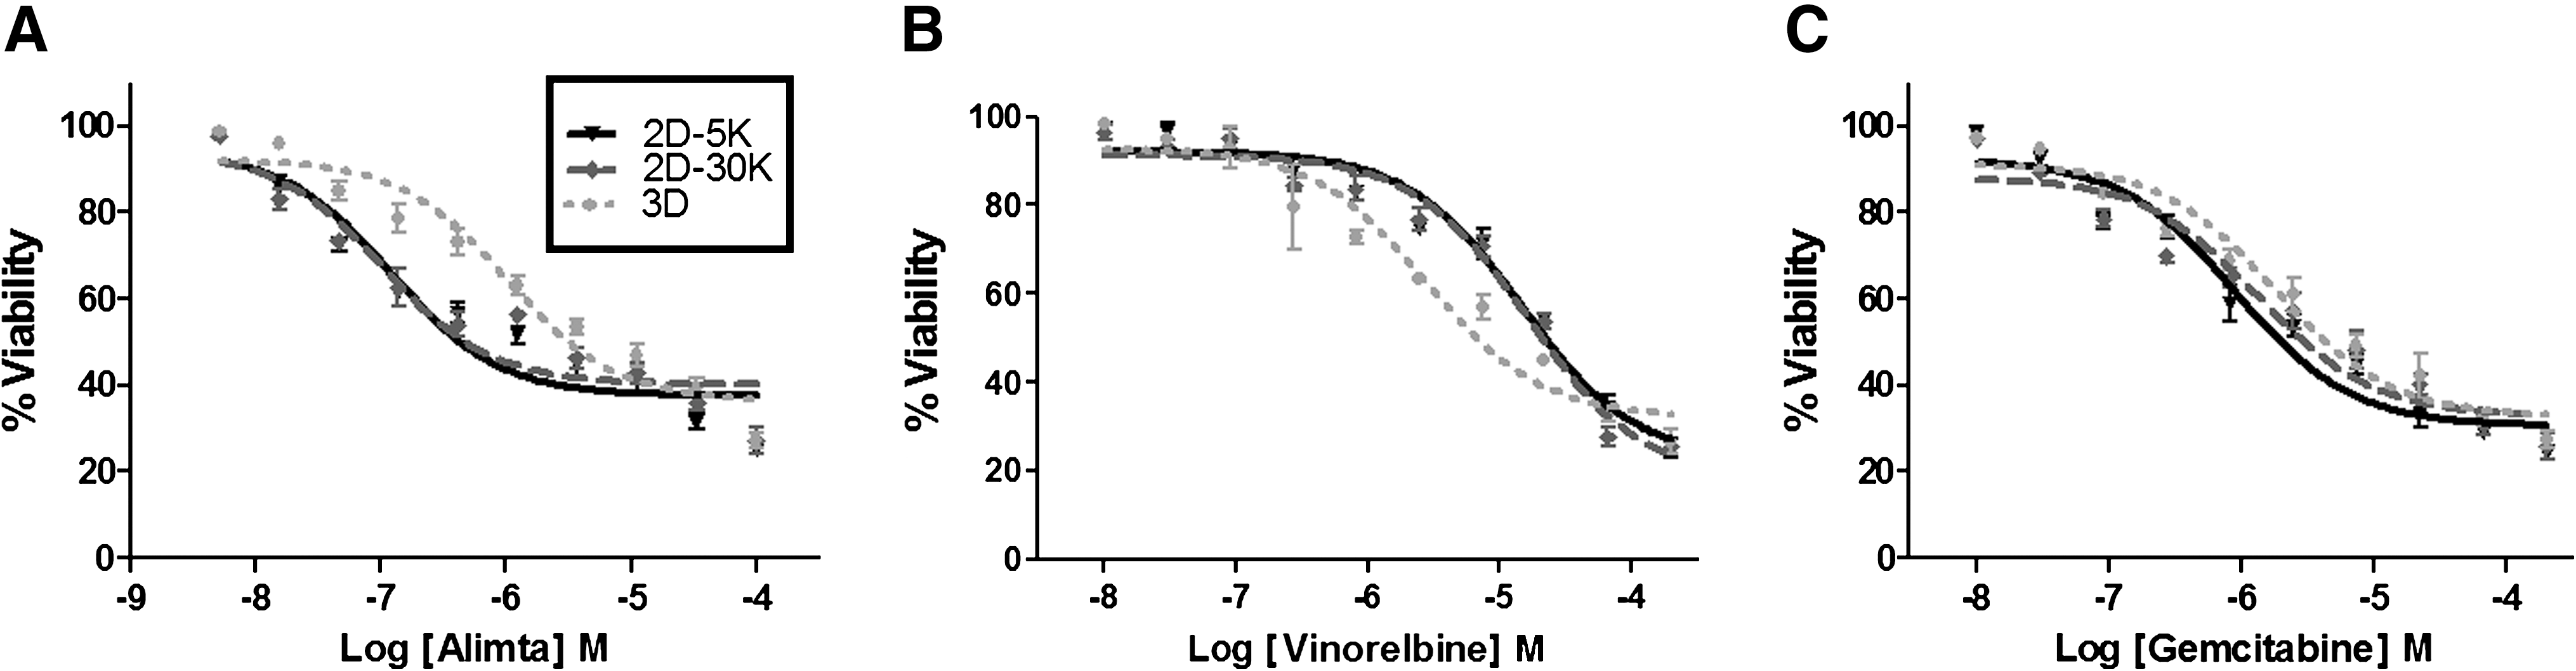
Antiproliferative effects of drugs demonstrating different responses in H358 cell line. (
Statistically Significant Changes in Potency and Efficacy
White, same effect across cell lines; light blue, opposite effects across cell lines; dark blue, no change. The Potency is measured by IC50 and the efficacy is measured by area under the curve (AUC).
The efficacy data did not follow the same trend as the IC50 data. Significant differences in the efficacy were found between the 3D versus 2D-5K (P < 0.05) and 3D versus 2D-30K (P < 0.05) groups only for Paclitaxel and Alimta, indicating that the drug is more efficacious in 3D (Tables 3 and 4). No differences were found in efficacy for KU174 (P = 0.0219), Zactima (P = 0.2434), Doxorubicin (P = 0.2486), Vinorelbine (P = 0.0537), 17AAg (P = 0.0877), KU363 (P = 0.0899), Gemcitabine (P = 0.5633), and Cisplatin (P = 0.238) across the 2D and 3D treatment groups, thus showing that there is a drug dependency in addition to the spatial dimension (Tables 3 and 4).
Antiproliferative Effects of Chemotherapy in A549 Lung Cancer Cells
After examination of the data from the A549 lung cancer cell line, ANOVA revealed significant difference in the IC50 values across the treatment groups. Paclitaxel (P = 0.0068), KU174 (P = 0.0089), Doxorubicin (P = 0.0092), and Vinorelbine (P < 0.0001) showed a decrease in potency in 3D compared with 2D. Alimta (P < 0.0001), Zactima (P = 0.0024), and Gemcitabine (P = 0.0001) showed the opposite effect with an increase in potency in 3D compared with 2D when tested in A549 cell line (Tables 2 and 4). KU363, 17AAg, and Cisplatin showed no change between treatment groups. Post-hoc tests demonstrated significant differences in the IC50 values between 3D and 2D-5K groups for Paclitaxel, KU174, Alimta, Zactima, Doxorubicin, Vinorelbine, and Gemcitabine (P < 0.05) (Tables 2 and 4). However, no difference in IC50 values were detected across the treatment groups (P = 0.4419), or between any of the multiple comparisons for Cisplatin (P = 0.4419), 17AAg (P = 0.0879), or KU363 (P = 0.094) (Tables 2 and 4). As expected, no differences were found between the 2 control groups, 2D-5K and 2D-30K, for any of the drugs (Tables 2 and 4).
The efficacy data for A549 cell line demonstrated a different trend compared with that of the H358 cell line. Paclitaxel, Zactima, Gemcitabine, and Vinorelbine demonstrated a significant difference in the efficacy between the 3D versus 2D-5K (P < 0.05) and 3D versus 2D-30K (P < 0.05) groups, suggesting that the drug is more efficacious in 3D (Tables 3 and 4). No differences were found in efficacy for Doxorubicin (P = 0.0503), Cisplatin (P = 0.0652), KU363 (P = 0.0523), Alimta (P = 0.518), KU174 (P = 0.4834), or 17AAg (P = 0.685) across the treatment groups (Tables 3 and 4).
Discussion
In this study we developed a simple 3D lung tumor model by culturing lung cancer cell lines in collagen gel and validated the use of this 3D model in drug discovery by testing a series of known and 2 experimental anticancer drugs. The aim of this study was to examine whether the potency and efficacy of anticancer drugs are altered when screened in cells cultured in 3D collagen gel compared with traditional 2D monolayer cellular systems. We observed changes in activity (potency and/or efficacy) for 8 of the 10 anticancer drugs tested in H358 and 7 of the 10 anticancer drugs tested in A549. Paclitaxel and KU174 were found to be less potent when tested in 3D culture of both cell lines compared with their 2D counterparts. Alimta (Fig. 4), Zactima, Doxorubicin, Vinorelbine, KU363, 17AAg, and Gemcitabine demonstrated different responses in the 2 cell lines tested in this study. The potency of Cisplatin was unaffected by the screening system in both cell lines, implying that not all drugs have different responses in 3D and 2D culture systems. A possible explanation is that Cisplatin is a DNA intercalator and is less affected by the changes in signaling pathways of tumor cells due to the spatial architecture. The observed differences in potency of the tested drugs suggest that HTS of NMEs in 3D tissue culture may offer a distinct advantage to the current HTS paradigm and reduce the failure rate of lead candidates. However, this hypothesis is yet to be tested in in vivo animal studies.
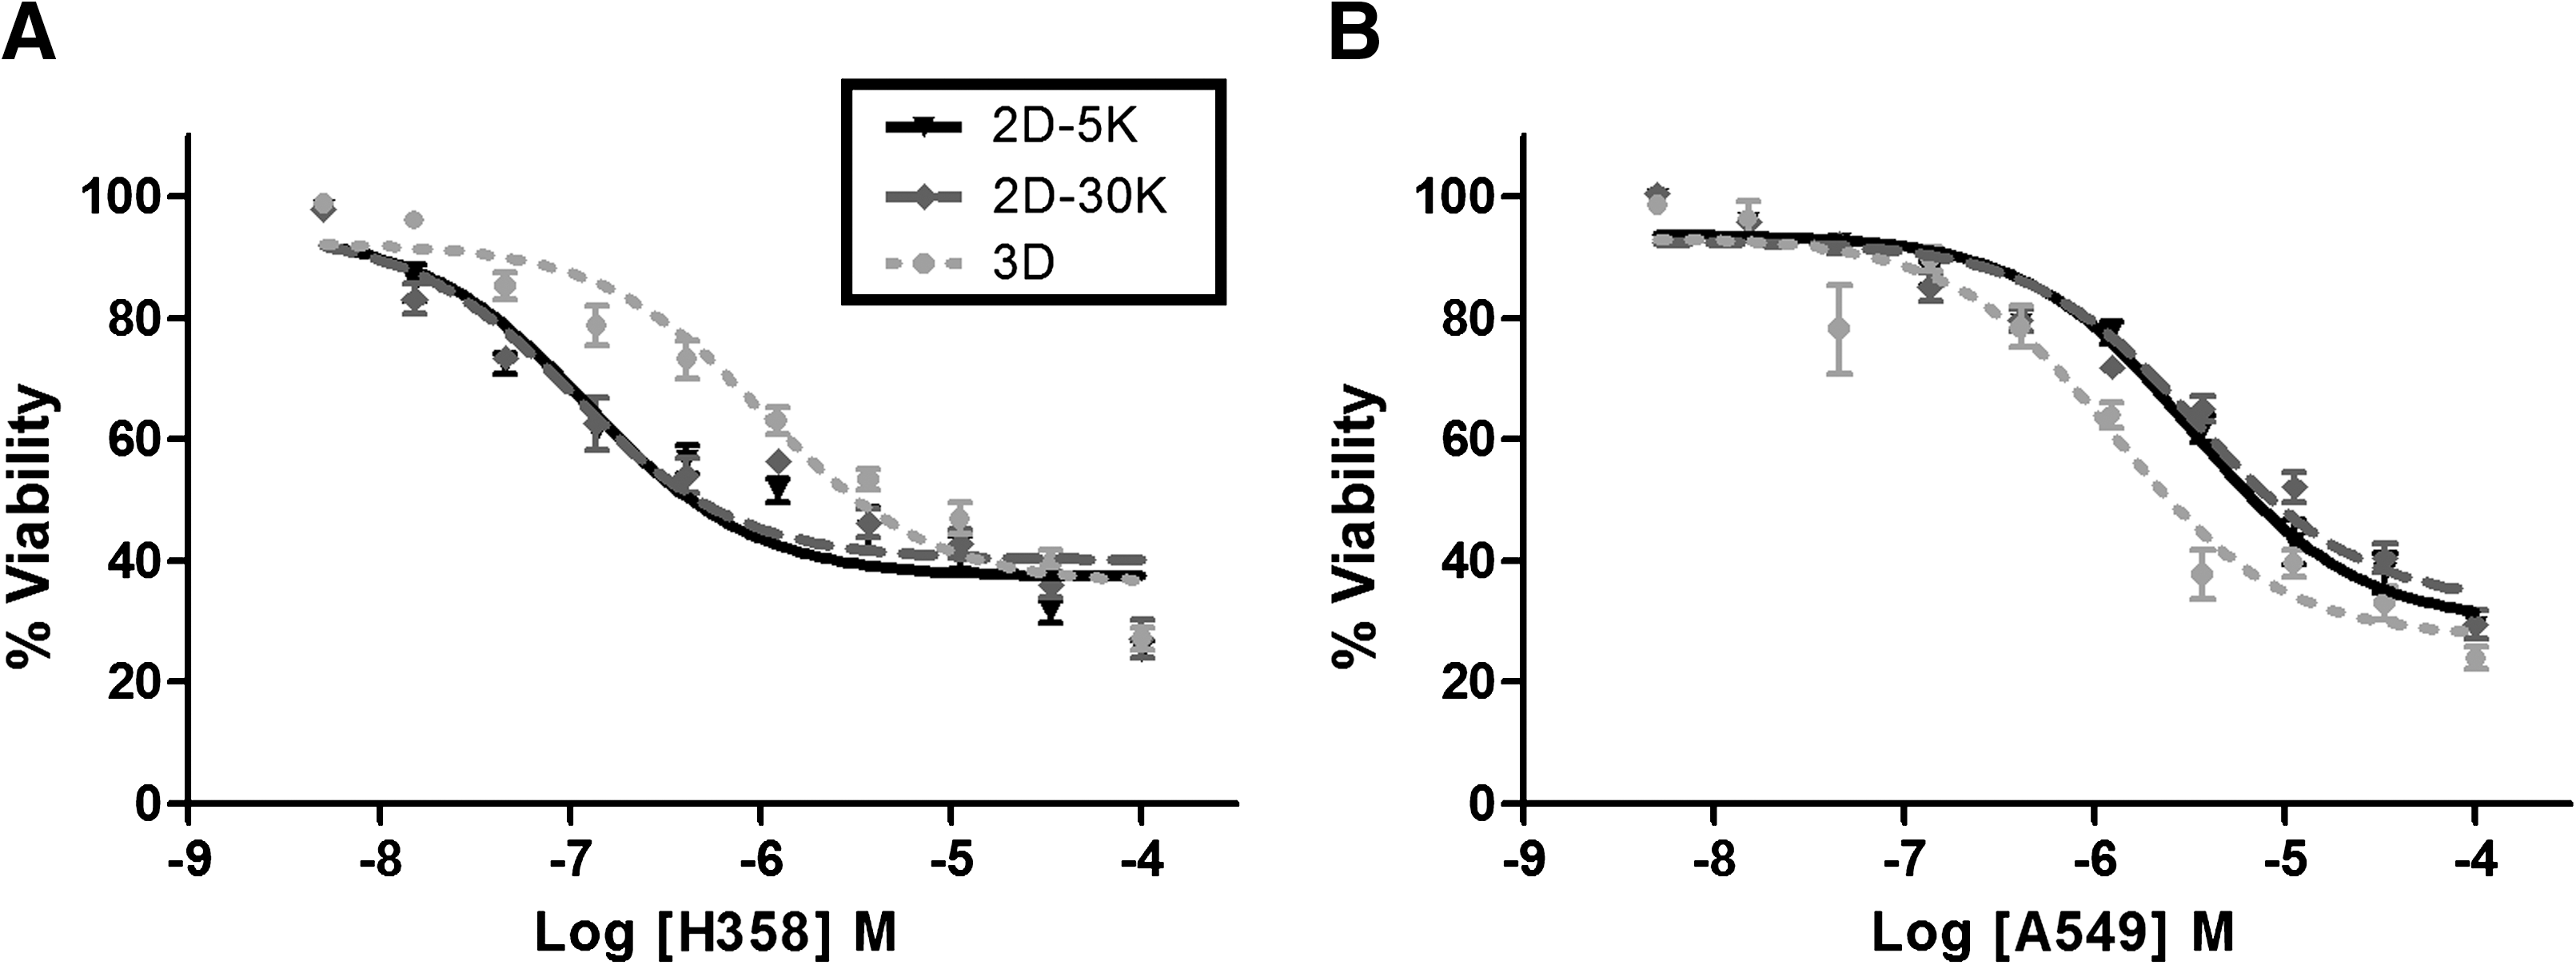
Example of drug whose antiproliferative effect is cell line dependent. (
Although the tested commercial lung cancer drugs were originally discovered through 2D cell-based assays along with selected animal models, they have varying efficacies for different cancer indications for which they were approved and require a cocktail approach in many therapeutic regimens to reduce toxicity and increase efficacy. For example, Cisplatin, Paclitaxel, and Zactima are some of the moderately successful lung cancer drugs. These drugs have been screened in vitro and shown promising results, but only limited therapeutic responses were observed when tested in vivo. Zactima is a small molecule inhibitor of vascular endothelial growth factor receptor 2 (VEGFR2) as well as epidermal growth factor receptor (EGFR) tyrosine kinases, and has been shown to inhibit EGFR, VEGFR2, mitogen-activated protein kinases, Akt phosphorylation, and EGF- and VEGF-induced proliferation, and also induces apoptosis in vitro. 25 However, efficacy of Zactima is very modest in in vivo tumor models. 25 Paclitaxel is a microtubule inhibitor and induces tumor regression in vitro. However, only a limited therapeutic response to Paclitaxel was observed when cells were implanted orthotopically into the lungs of nude mice. 26,27 Cisplatin is a DNA cross-linker that results in damaged DNA and elicits DNA repair mechanisms, which in turn activates apoptosis when these repair mechanisms are disabled. While Cisplatin is the standard of care to treat nonsmall cell lung cancer, 28 it still demonstrates only modest activity and requires a cocktail approach in many treatment regimens. Therefore, the tested drugs constituted an ideal therapy to test our hypothesis.
Although the signaling pathways and the mechanism of actions of different chemotherapeutic agents have been extensively studied in 2D cultures, little is known about changes to these signaling pathways in 3D cultures. Several points need to be considered: the metabolic state, cell–cell contact, drug-resistant transporter expression, and signaling pathways of the tumor cell could be significantly different in a 3D configuration. Second, tumor matrix and heterogeneous cell populations in the tumor may also be affecting the response of the tumor cells to the drug treatment. The current 3D configuration does not completely address the latter. Third, the tumor cell origin, type, and the mechanism of action of the drug are also critical. It has been well documented in the literature that the behavior of cancer cells is affected by the surrounding 3D ECM, but only a very few studies 22,29 have examined the effects of 3D spatial structure and ECM on the cytotoxic agents' ability to induce cell death. Bartling et al. 29 reported that the Paclitaxel-induced cell death is highly impaired by active extracellular-signal-regulated kinases (Erk) 1/2 in H358 cells, whereas the Cisplatin-induced cell death is independent of this kinase. This may explain why in our experiments, the potency of Paclitaxel was decreased when tested in H358 cells grown in extracellular matrices as 3D cultures and the potency of Cisplatin remained unaffected in the 3D cultures compared with 2D cultures. Although the findings reported by Bartling may explain the underlying differences in mechanisms of Paclitaxel and Cisplatin in 2D and 3D cultures of H358 cells, the mechanisms of these drugs and other cytotoxic agents in 3D cultures of other cell lines (including A549 cell line) remain largely unknown. The differences between Paclitaxel and other drugs in H358 and A549 cells point to mechanistic aspect superimposed on tumor architecture.
The discrepancy between the trends in efficacy (determined by the AUC) and potency (determined by the IC50) in both cell lines is significant because the spatial architecture and distribution of the tumor cells may be important in determining the efficacy of even highly potent drugs. The AUC represents the population of cancer cells affected by the drug at the potency represented by IC50 of the drugs. AUC is routinely used in high content screening and flow cytometry applications to measure cell viability and the efficacy of the antiproliferative drugs. 30 Both parameters are important since therapeutic dosing regimens are administered based on a therapeutic index that maximizes efficacy and potency with minimal toxicity. Lower doses ensure lesser side effects to patients with less toxicity to normal tissue. We have used both potency and efficacy measures to evaluate the drugs in this study. It is possible that highly potent drugs may not be the most efficacious in killing all cancer cells in the tumors and vice versa (Tables 3 and 4). This is particularly important during early preclinical screening of NMEs to select the best molecule to advance to animal studies. We are exploring the use of a combined index using IC50 and AUC parameters in representing pharmacological activity of drugs in 2D and 3D drug screening applications to investigate if such an index would be more predictive.
The 3D tumor model system we used in our study is a simple model and has been widely used to study the tumor cell migration and signaling. Although the single tumor cells cultured in collagen gel captures some aspects of tumorigenesis, 23 in vivo tumors are found to be in the form of aggregates containing both peripheral and deeply buried cells, proliferating and nonproliferating cells, and well-oxygenated and tumor cytokine secreting hypoxic cells. 31 These aspects can be mimicked in 3D spheroids created in suspension of hanging drops of medium or in bioreactors. 6,20,21 Even the 3D spheroids do not perfectly mimic the in vivo conditions since they lack vasculature, a critical aspect of tumor progression. This important in vivo feature can be modeled in vitro by introducing a second cell type in the spheroids. 32 The extracellular matrix deposited by the second cell type facilitates angiogenesis in spheroids. A widely used candidate for the second cell type is fibroblasts, which secrete transforming growth factor, an effective angiogenic stimulator. 32 Our future studies will include the development of more complicated 3D tissue models, including 3D spheroids and multicellular 3D spheroids for cancer drug discovery.
Our approach is not without limitations. First, we understand that growing cells as 3D cultures does not perfectly mimic the in vivo physiological conditions. Three-dimensional culture systems alone are not physiologically relevant with respect to some tissues and cells, like those of the lung or alimentary canal that experience physiological forces in vivo through normal respiration or distention of the colon through peristalsis. These in vivo mechanical forces have been shown to impact signal transduction pathways affecting cell biology and potentially the mechanisms through which drugs function. Therefore, future studies should examine the importance of these in vivo forces in drug discovery. It is also possible that the cells simply lack some systemically released cytokines (in vivo) that could be driving the susceptibility of the cells to treatments in vitro. Lack of knowledge about these cytokines and other in vivo factors makes it difficult to simulate similar effects in culture. Another important limitation of our study was the lack of evidence for the direct biological effects that result in drug potency changes in 3D cell culture. The method for protein and RNA extraction from cells dispersed in 3D collagen matrices has yet to be fully optimized. There is, however, preliminary evidence based on Western blot analysis from cells growing on both 2D cell-culture-treated plastic and on 2D cell culture surfaces coated with collagen type I. The preliminary results indicate that there is an increase in EGFR expression in the H358 cell line when cells are cultured in collagen-coated 2D surfaces. We expect similar behavior in cells grown in collagen gels. Although the drug Zactima targets the phophorylation of this receptor protein, an increase in total EGFR protein may make this more difficult and is a possible explanation as to why this drug is less potent in 3D collagen type I cell culture. Our hypothesis that 3D cultures will be predictive of the in vivo outcomes more readily than 2D cultures on bare plastic surfaces is based on the assumption that signaling pathways of the selected drugs are different in 2D and 3D cultures. Signaling pathways of these drugs have already been examined and reported based on 2D in vitro experimental systems. Although our current study is not aimed at examining the signaling pathways of the selected drugs in 3D culture systems, we believe that our approach of demonstrating the importance of 3D cultures on anticancer agents by comparing the potency and efficacy of the selected drugs in different biological systems will open up a new area of exploration.
In summary, our study compared the potency and the efficacy of 10 anticancer drugs in 2D and 3D screening systems. Eight of the 10 drugs in H358 and 7 of the 10 drugs in A549 demonstrated significantly different responses when screened in 3D versus 2D systems. It has yet to be determined whether the varying response of these drugs translates to preclinical animal studies. Predictability of in vivo outcomes using a physiologically relevant 3D screening system can be demonstrated only if these drugs have been tested in animal studies. Studies are underway in our laboratory to address the signaling pathways affected in cancer cells grown in 3D configurations and to test these drugs in orthotopic mouse models.
Footnotes
Acknowledgments
This project was supported through a faculty startup grant for G. Sitta Sittampalam, Ph.D., and V. Sanjit Nirmalanandhan, Ph.D., by The University of Kansas Endowment Association, and the University of Kansas Cancer Center. The HSP90 c-terminal inhibitors KU174 and KU363 were synthesized in Professor Brian Blagg's laboratory at the Department of Medicinal Chemistry, The University of Kansas, Lawrence, KS.
Author Disclosure Statement
No competing financial interests exist.